
Abstract
The objective of this research is to determine the thermal conductivity of the interphase in epoxy alumina nanocomposites. First, TPS 500 measures the thermal conductivity of epoxy alumina nanocomposite samples. Following that, a numerical model based on the finite element method was developed to estimate the effective thermal conductivity of epoxy alumina nanocomposites over a range of assumed interphase thermal conductivity values. Finally, an algorithm is devised to extract the interphase’s thermal conductivity by combining simulation and experiment results. Interphase was found to have significantly higher thermal conductivity than the base polymer. A comprehensive analysis is presented to shed light on the observed increase in interphase thermal conductivity. The findings of this study will be critical for further investigation of heat transfer in epoxy alumina nanocomposites via modeling and simulation studies.
Introduction
Electrical insulation forms the backbone of all electrical power networks. The life of electrical insulation is determined by its aging characteristics under various operating stresses (i.e., electrical, mechanical, thermal, and ambient). Failure data reveals that the majority of electrical insulation failures occur due to thermal stress. 1 Thermal stress originates in electrical equipment due to heat produced by different losses (ohmic, magnetic, and dielectric). The temperature rise caused by trapped heat gradually decreases the dielectric material’s performance and eventually results in premature failure. On the other hand, increased thermal conductivity enables more efficient heat transfer, extending the life expectancy of electrical equipment.
Polymeric insulating materials are attractive to electrical insulation designers due to their low electrical conductivity, high dielectric strength, high strength-to-weight ratio, and hydrophobic properties. Despite many fascinating features, low thermal conductivity prevents their extensive usage in electrical power devices and systems. Low electrical conductivity and high thermal conductivity have become increasingly desirable for insulating materials operating at elevated voltage levels. In recent years, polymer nanocomposites (PNCs) have gained prominence as potential solutions for addressing these two seemingly contradictory requirements.2–5 Polymer nanocomposites are a class of materials in which nanometer-sized particles are uniformly dispersed in a host polymer to improve its electrical, mechanical, and thermal properties.6–10 Interfacial interaction becomes a dominant parameter to regulate the properties of nanocomposites due to the enormous specific surface area of nanoparticles. A substantial body of literature indicates that filler matrix interaction in PNCs constitutes a new phase called interphase. Interphase appears to be crucial in strengthening the attributes of PNCs. On the other hand, the interphase characteristics are unknown and are likely to differ significantly from the filler and base polymer. The understanding of the physicochemical interactions at interfaces has advanced significantly in recent years.11–16 Apart from comprehending the physicochemical interaction of filler and matrix, quantifying the interphase’s size and material properties are crucial to investigating nanocomposites through modeling and simulation studies.
Dielectric properties of constituent phases in epoxy alumina nanocomposites.

This research extends previous work by probing the thermal conductivity of the interphase in epoxy alumina nanocomposites. A finite element method (FEM) based numerical model has been developed to estimate the effective thermal conductivity of nanocomposites. The TPS 500 instrument is used to measure the thermal conductivity of synthesized samples. Finally, an algorithm is devised to estimate the interphase’s thermal conductivity using simulation and experiment results.
Materials
Epoxy resin (DGEBA) supplied by Huntsman is used as a base material. Spherical aluminum oxide (alumina) nanoparticles with an average size of 50 nm were employed as nanofillers. Sigma Aldrich’s 3-glycidoxypropyl trimethoxysilane (GPS) was employed to surface functionalize alumina nanoparticles. Triethylenetetramine, supplied by Huntsman, was used as the curing agent.
Preparation of the samples
The following specimens were synthesized for this study: 1. Pure epoxy samples. 2. Nanocomposites samples (with nano alumina concentrations of 1 and 2 vol.%).
Pure epoxy samples were synthesized by gently mixing the 10% hardener with neat epoxy resin. The solution is then degassed to get rid of any trapped gas bubbles. The degassed solution was then poured into the mold and allowed to cure for 24 h at room temperature. In addition, 12 h of post-curing at 100oC were completed. Finally, 15x15x15 mm cubic samples were fabricated to meet the dimensional specifications of the measuring instrument (TPS 500).
To fabricate nanocomposite samples, a procedure similar to that described in Refs. 18 and 19 is adopted. The first step in this procedure is to prepare a solution made up of 95% ethanol and 5% distilled water. The pH of the solvent is brought up to 4.5 by adding acetic acid. While the solution is sonicated, a predetermined amount of 3-glycidoxypropyl trimethoxy silane (GPS) is gently injected. The silane must be allowed to hydrolyze entirely after 30 min of sonication. Next, untreated alumina nanoparticles are introduced to the hydrolyzed GPS solution at regular intervals to ensure homogeneous dispersion and coating of the nanoparticles. After that, the mixture is sonicated for an additional hour. The solvent is then evaporated, resulting in surface-functionalized nanoparticles. Finally, employing Fourier transform infrared spectroscopy (FTIR), the surface functionalization of nanoparticles is confirmed.
11
To prepare samples, a predetermined amount of surface-functionalized alumina nanoparticles was added to ethanol and dispersed uniformly for 60 min using ultrasonication. Next, a predetermined amount of epoxy was added to the ultrasonicated solution and thoroughly stirred with a magnetic stirrer. Following the removal of the ethanol, the nanocomposite samples were prepared in the same manner as the pure epoxy samples. Figure 1 depicts typical images of synthesized epoxy and nanocomposite samples (with a filler content of 1 vol.%). A flow diagram illustrating the synthesis of nanocomposite samples is shown in Figure 2. Synthesized neat epoxy and nanocomposite samples. Flow diagram for the synthesis of the nanocomposites.

Scanning electron microscopy
Scanning electron microscopy (SEM) was used to examine the morphology of the samples. Figure 3 shows typical micrographs of pure epoxy and nanocomposites (at a filler content of 1 vol. %) samples. There is no visible particle agglomeration, indicating that the particles are evenly distributed throughout the host polymer. Scanning electron microscopy micrographs: (a) neat epoxy (b) epoxy alumina nanocomposites.
Thermal conductivity measurement
The standard test technique recommended by ISO 22007-2:2008 was followed while measuring thermal conductivity using a TPS 500 instrument. Thermal conductivity measurements are carried out by sandwiching the TPS 500 sensor between two segments of a sample, as illustrated in Figure 4. A total of five samples from each specimen were randomly selected and tested for thermal conductivity. Table 2 shows the average thermal conductivity value of each specimen. TPS 500 sensor sandwiched between samples. Measured thermal conductivity values of different specimen.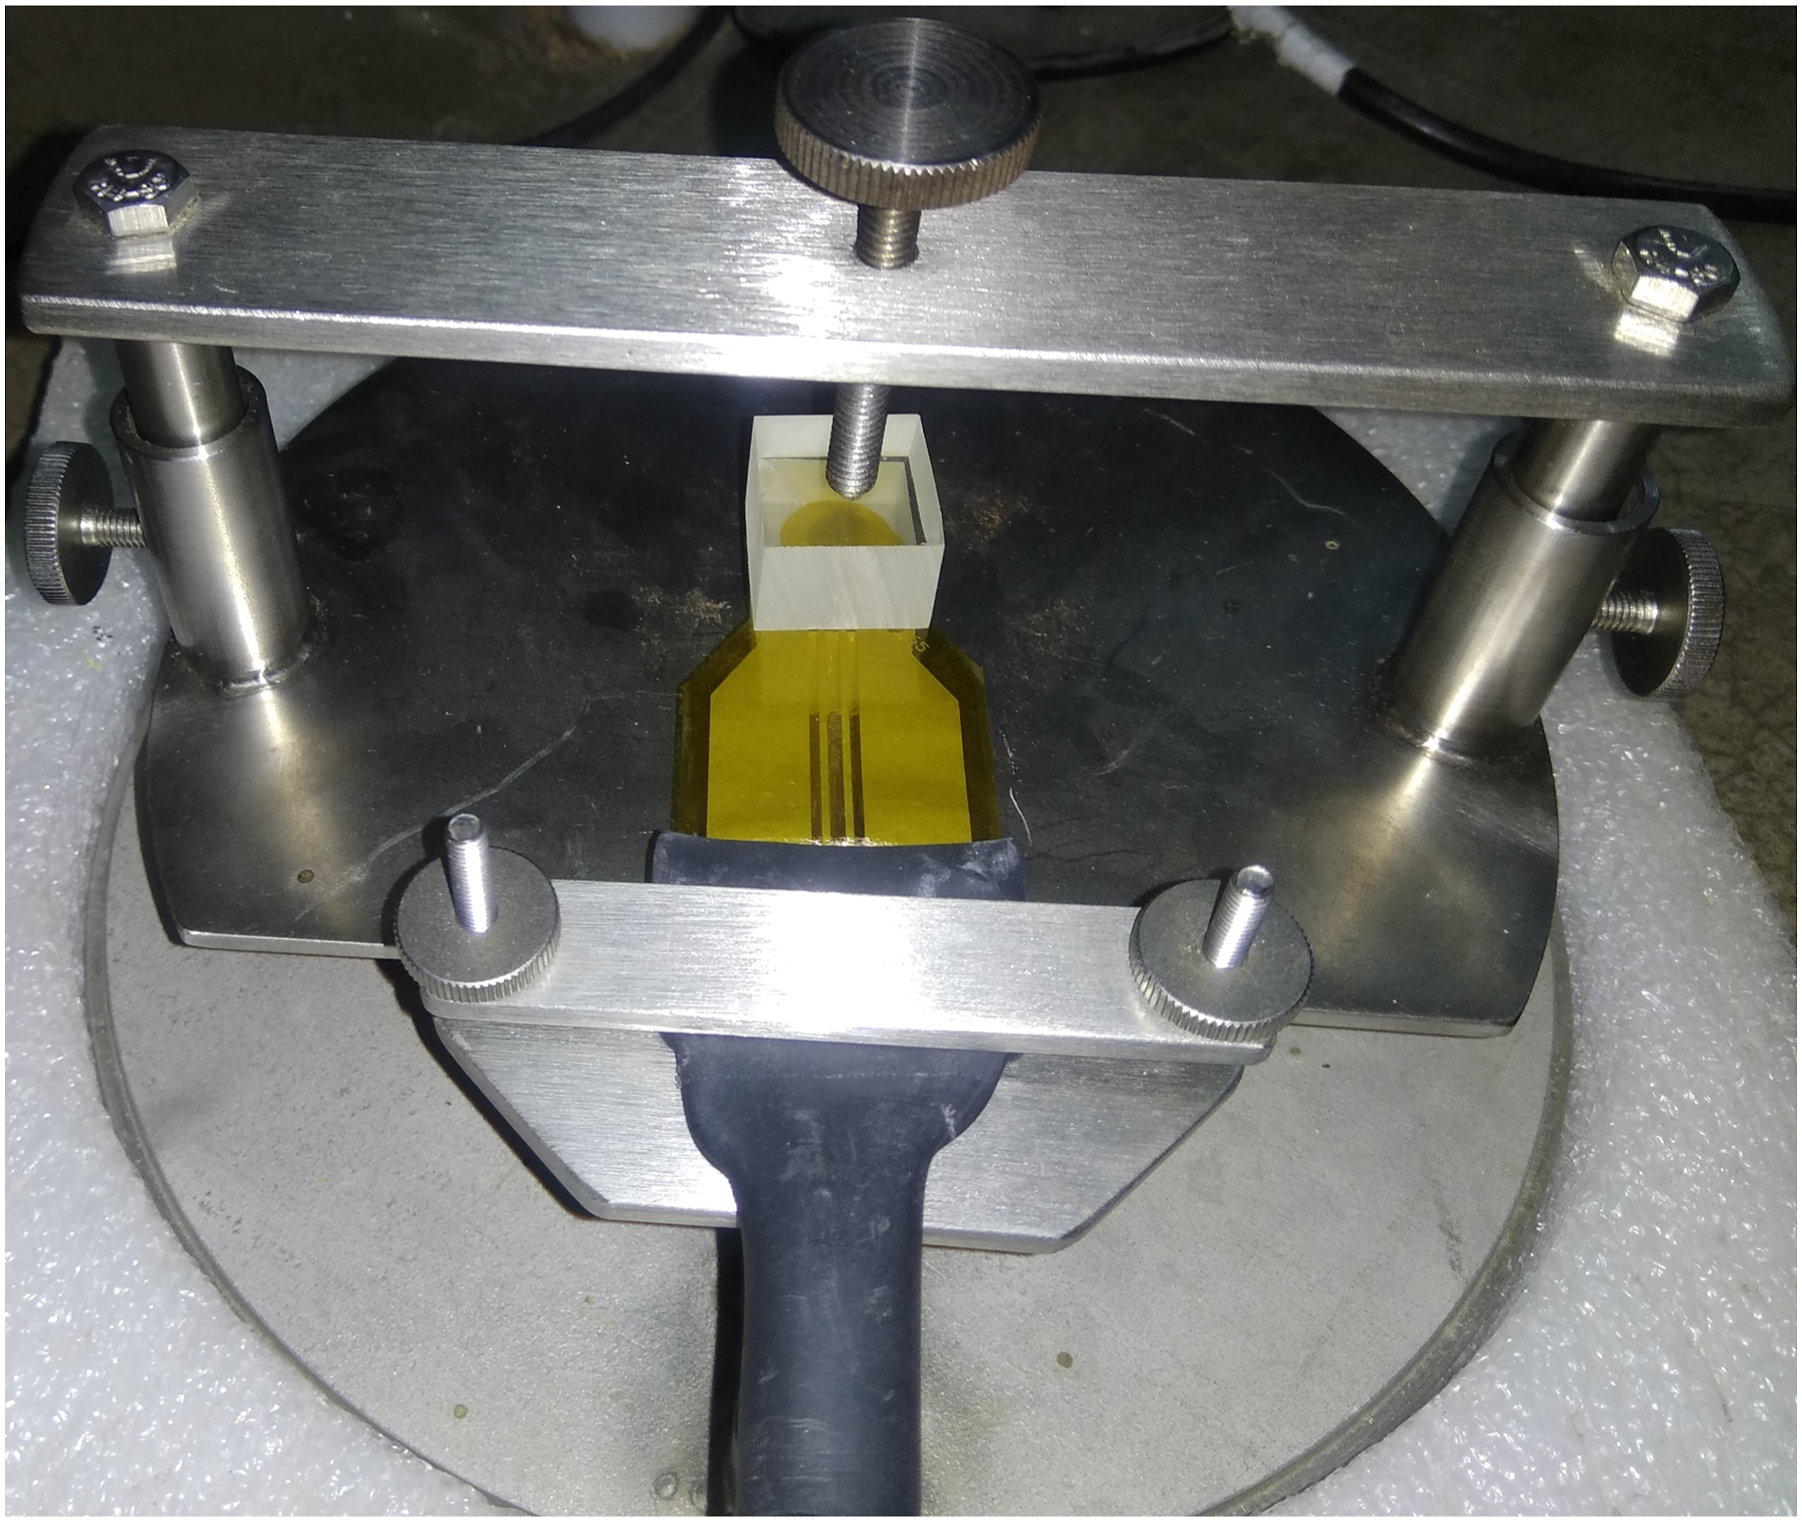

Numerical modeling
A numerical model implemented in COMSOL Multiphysics is used to estimate the effective thermal conductivity of nanocomposites. The following subsections discuss numerical modeling in greater detail.
Pre-processing
First, a unit cell with a size of 1 µm x 1 µm x 1 µm is constructed, which comprises 1 vol.% alumina particles of size 50 nm. One hundred fifty-three (153) filler particles are randomly distributed within the unit cell of the numerical model to ensure the filler content in the numerical model is identical to the filler content of the synthesized samples. Each nanoparticle is surrounded by interphase with a specified thickness determined by previous studies.
17
Apart from filler and interphase, neat epoxy occupies the remainder of the volume in the unit cell. Figure 5 illustrates a unit cell composed of three material domains (i.e., neat epoxy, alumina nanofillers, and interphase). The application builder tool of COMSOL Multiphysics in conjunction with the JAVA script’s random function is used to build the numerical model, and periodic boundary conditions are appropriately applied. Based on the experimental data shown in Table 2, epoxy resin is assigned a thermal conductivity of 0.16 W/K.m. According to the manufacturer’s specification, alumina nanoparticles have a thermal conductivity of 30 W/K.m. The analysis was carried out using the AC/DC module and heat transfer module of COMSOL Multiphysics. The electric field in the dielectric material is computed by solving the Laplace equation and the continuity equation (Maxwell’s equation for conservation of charge). It is required to first compute the conduction losses in the dielectric materials. The thermal solver then estimates the temperature distribution based on the conduction losses that have occurred. The unit cell’s outer boundary is kept at room temperature (i.e., 293oC). Randomly distributed nanoparticles in the epoxy matrix.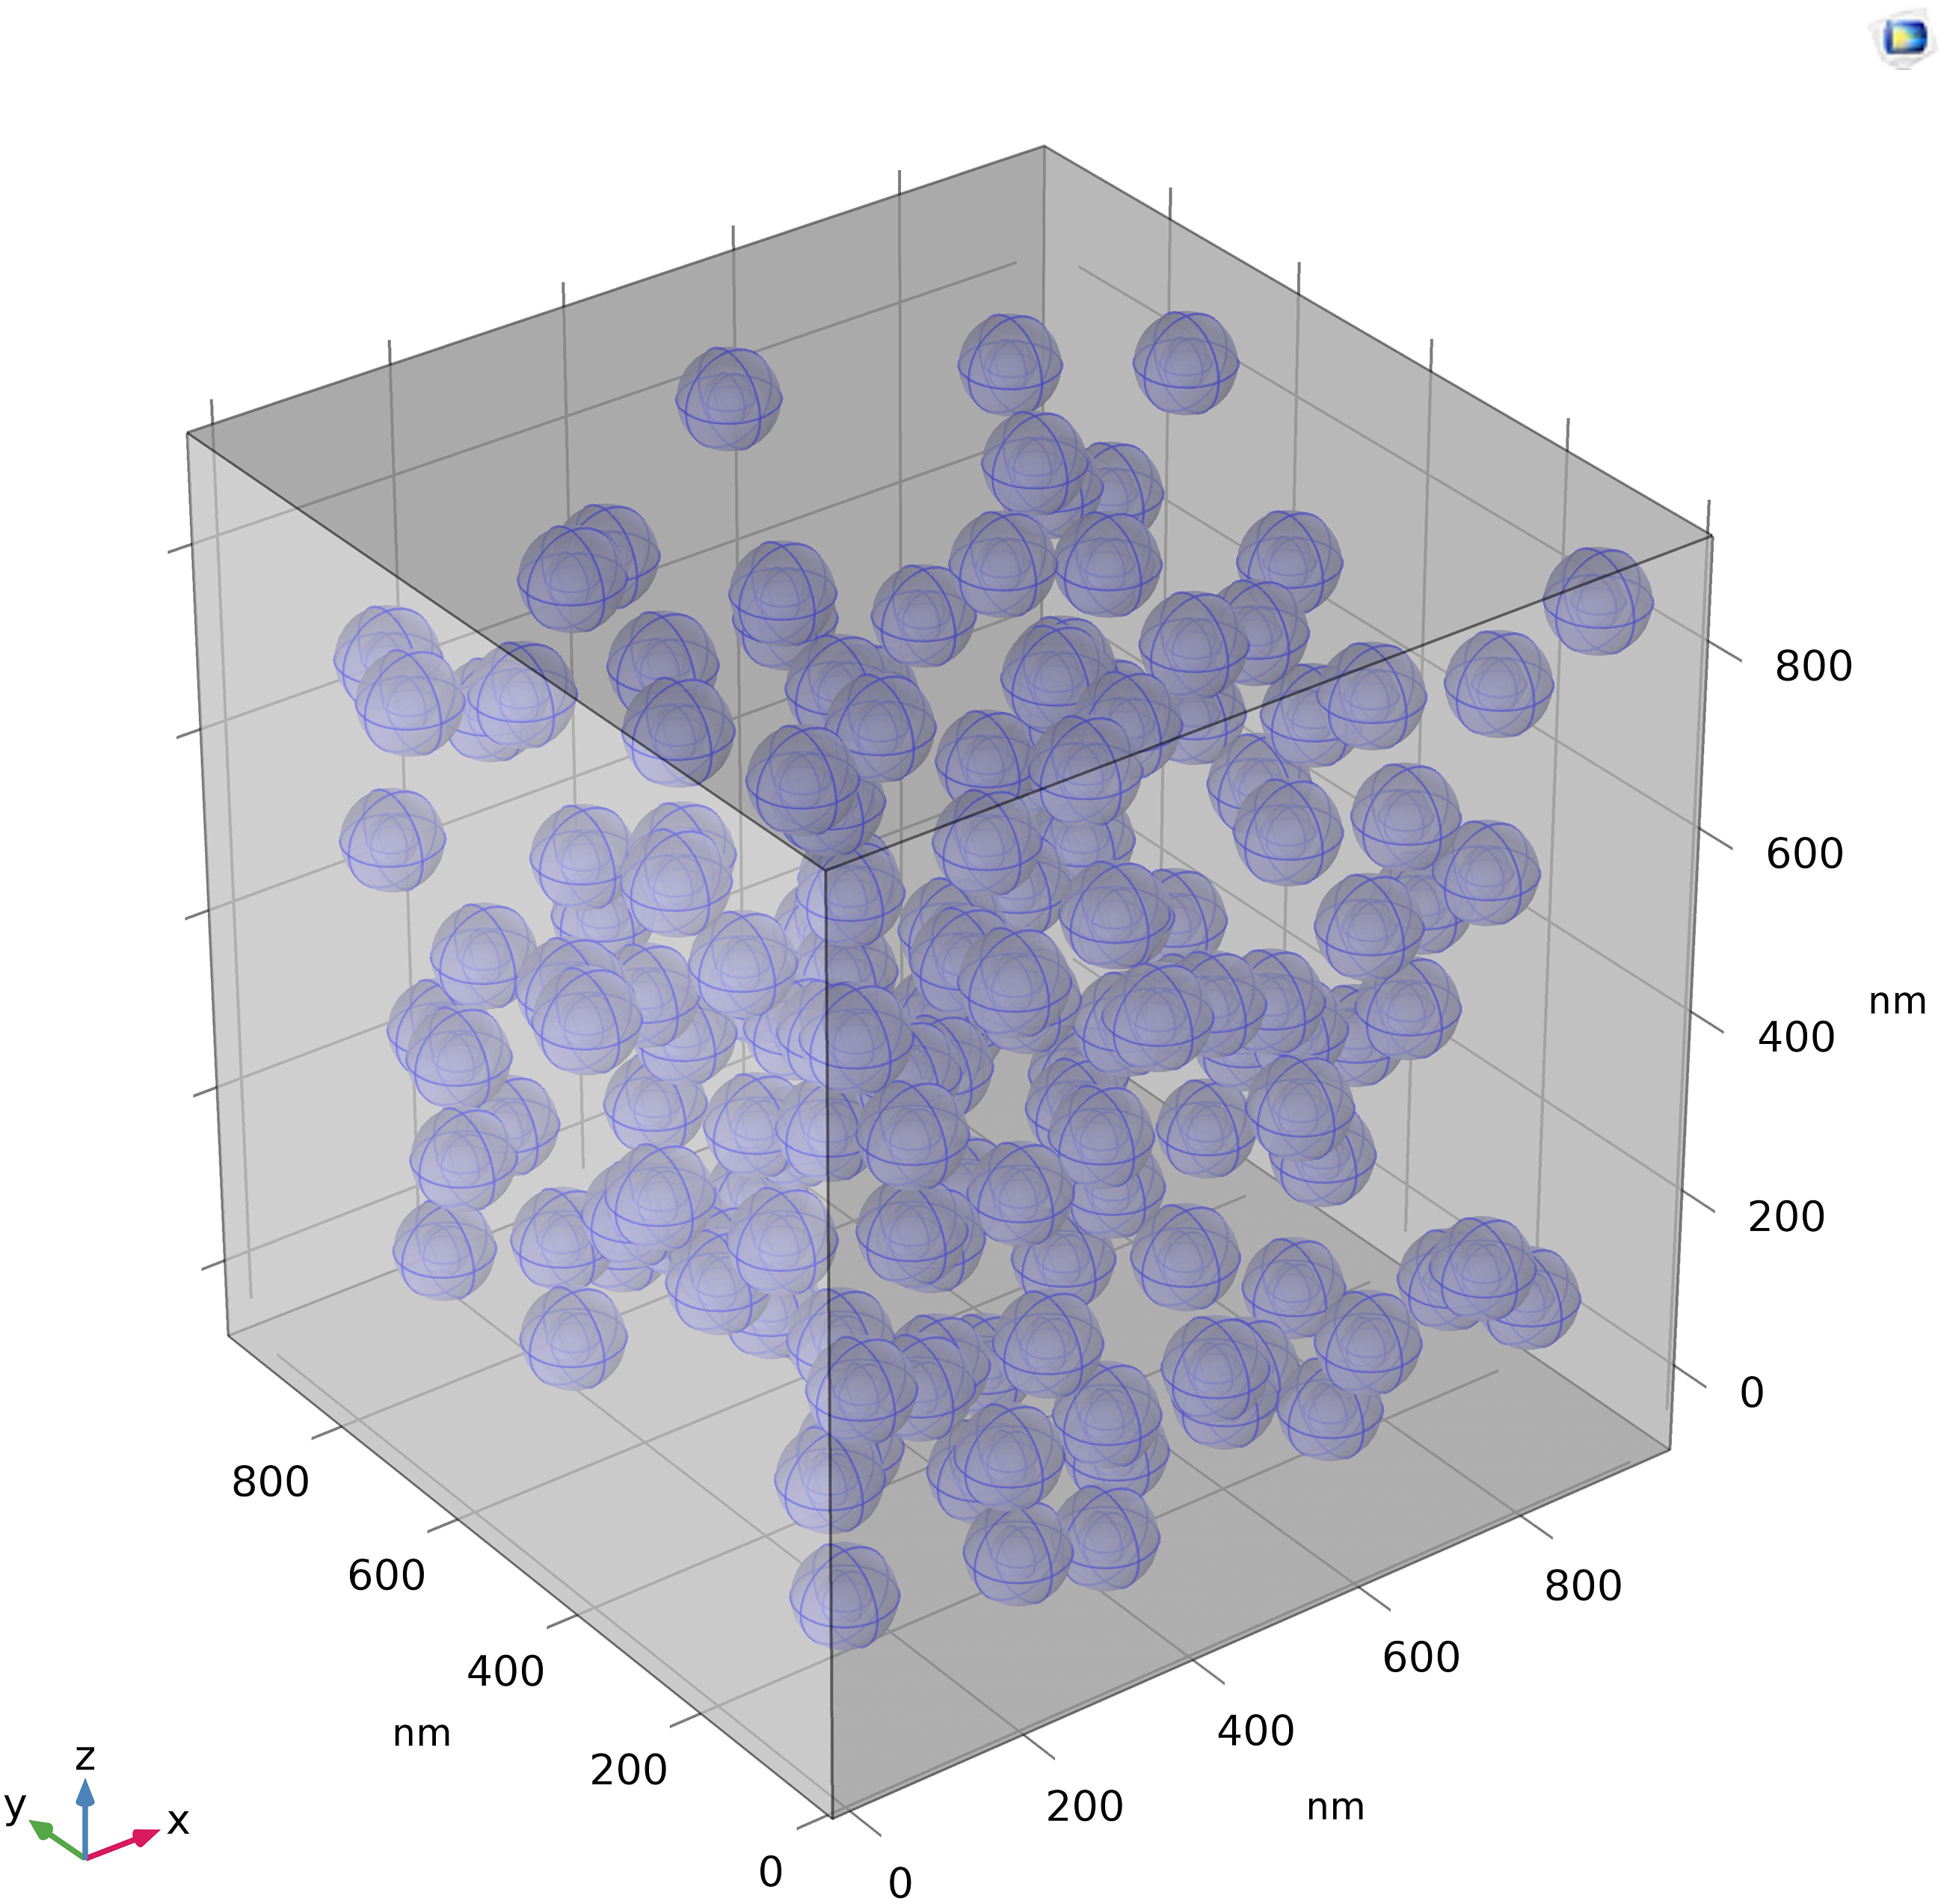
The effective thermal conductivity of nanocomposites is estimated using equation (1) shown below (a) Heat flux magnitude inside the model, (b) Temperature gradient magnitude inside the model.

Estimating thermal conductivity of interphase
A bisection method-based algorithm is utilized to evaluate the thermal conductivity of the interphase. The steps to implement the proposed algorithm are described in detail in the following section: Step 1-Record experimental thermal conductivity values for pure epoxy and nanocomposites. Step 2: Import the model created in COMSOL Multiphysics. Assign material properties, describe the model’s physics and apply appropriate boundary conditions. Step 3-Set the simulated thermal conductivity of the nanocomposite to zero as an initial trial value. Specify a convergence tolerance value of 0.001. Assign a value of 0 as the initial mean, a value of 30 as the up bound, and a value of 0.001 as the low bound. Step 4-Compare the measured thermal conductivity of nanocomposites to that computed using a numerical model. If this difference is greater than the convergence tolerance limit, go to the next step. If the difference is less than the convergence tolerance, store the interphase’s thermal conductivity value and exit the program. Step 5-Calculate the mean value of the up bound and low bound. Assign this mean value to interphase thermal conductivity. Step 6-Calculate the total heat flux and temperature gradient using the numerical model. Determine the thermal conductivity of the nanocomposite using the total heat flux magnitude and temperature gradient. This nanocomposite thermal conductivity value should be stored. Step 7: The computed value of the effective thermal conductivity of the nanocomposites is compared to the measured value. If the computed value exceeds the measured value, then assign the up bound value as the mean value. If the computed value is lower than the measured value, then a low bound is used as the mean. Step 8-Return to step 4 and repeat until convergence is achieved.
The suggested method is also illustrated using the flow chart depicted in Figure 7 for clarity. Table 3 contains information on the variables used in the flow chart. An illustration of the flowchart used to estimate the thermal conductivity of the interphase. List of variables used in the flowchart, along with their descriptions.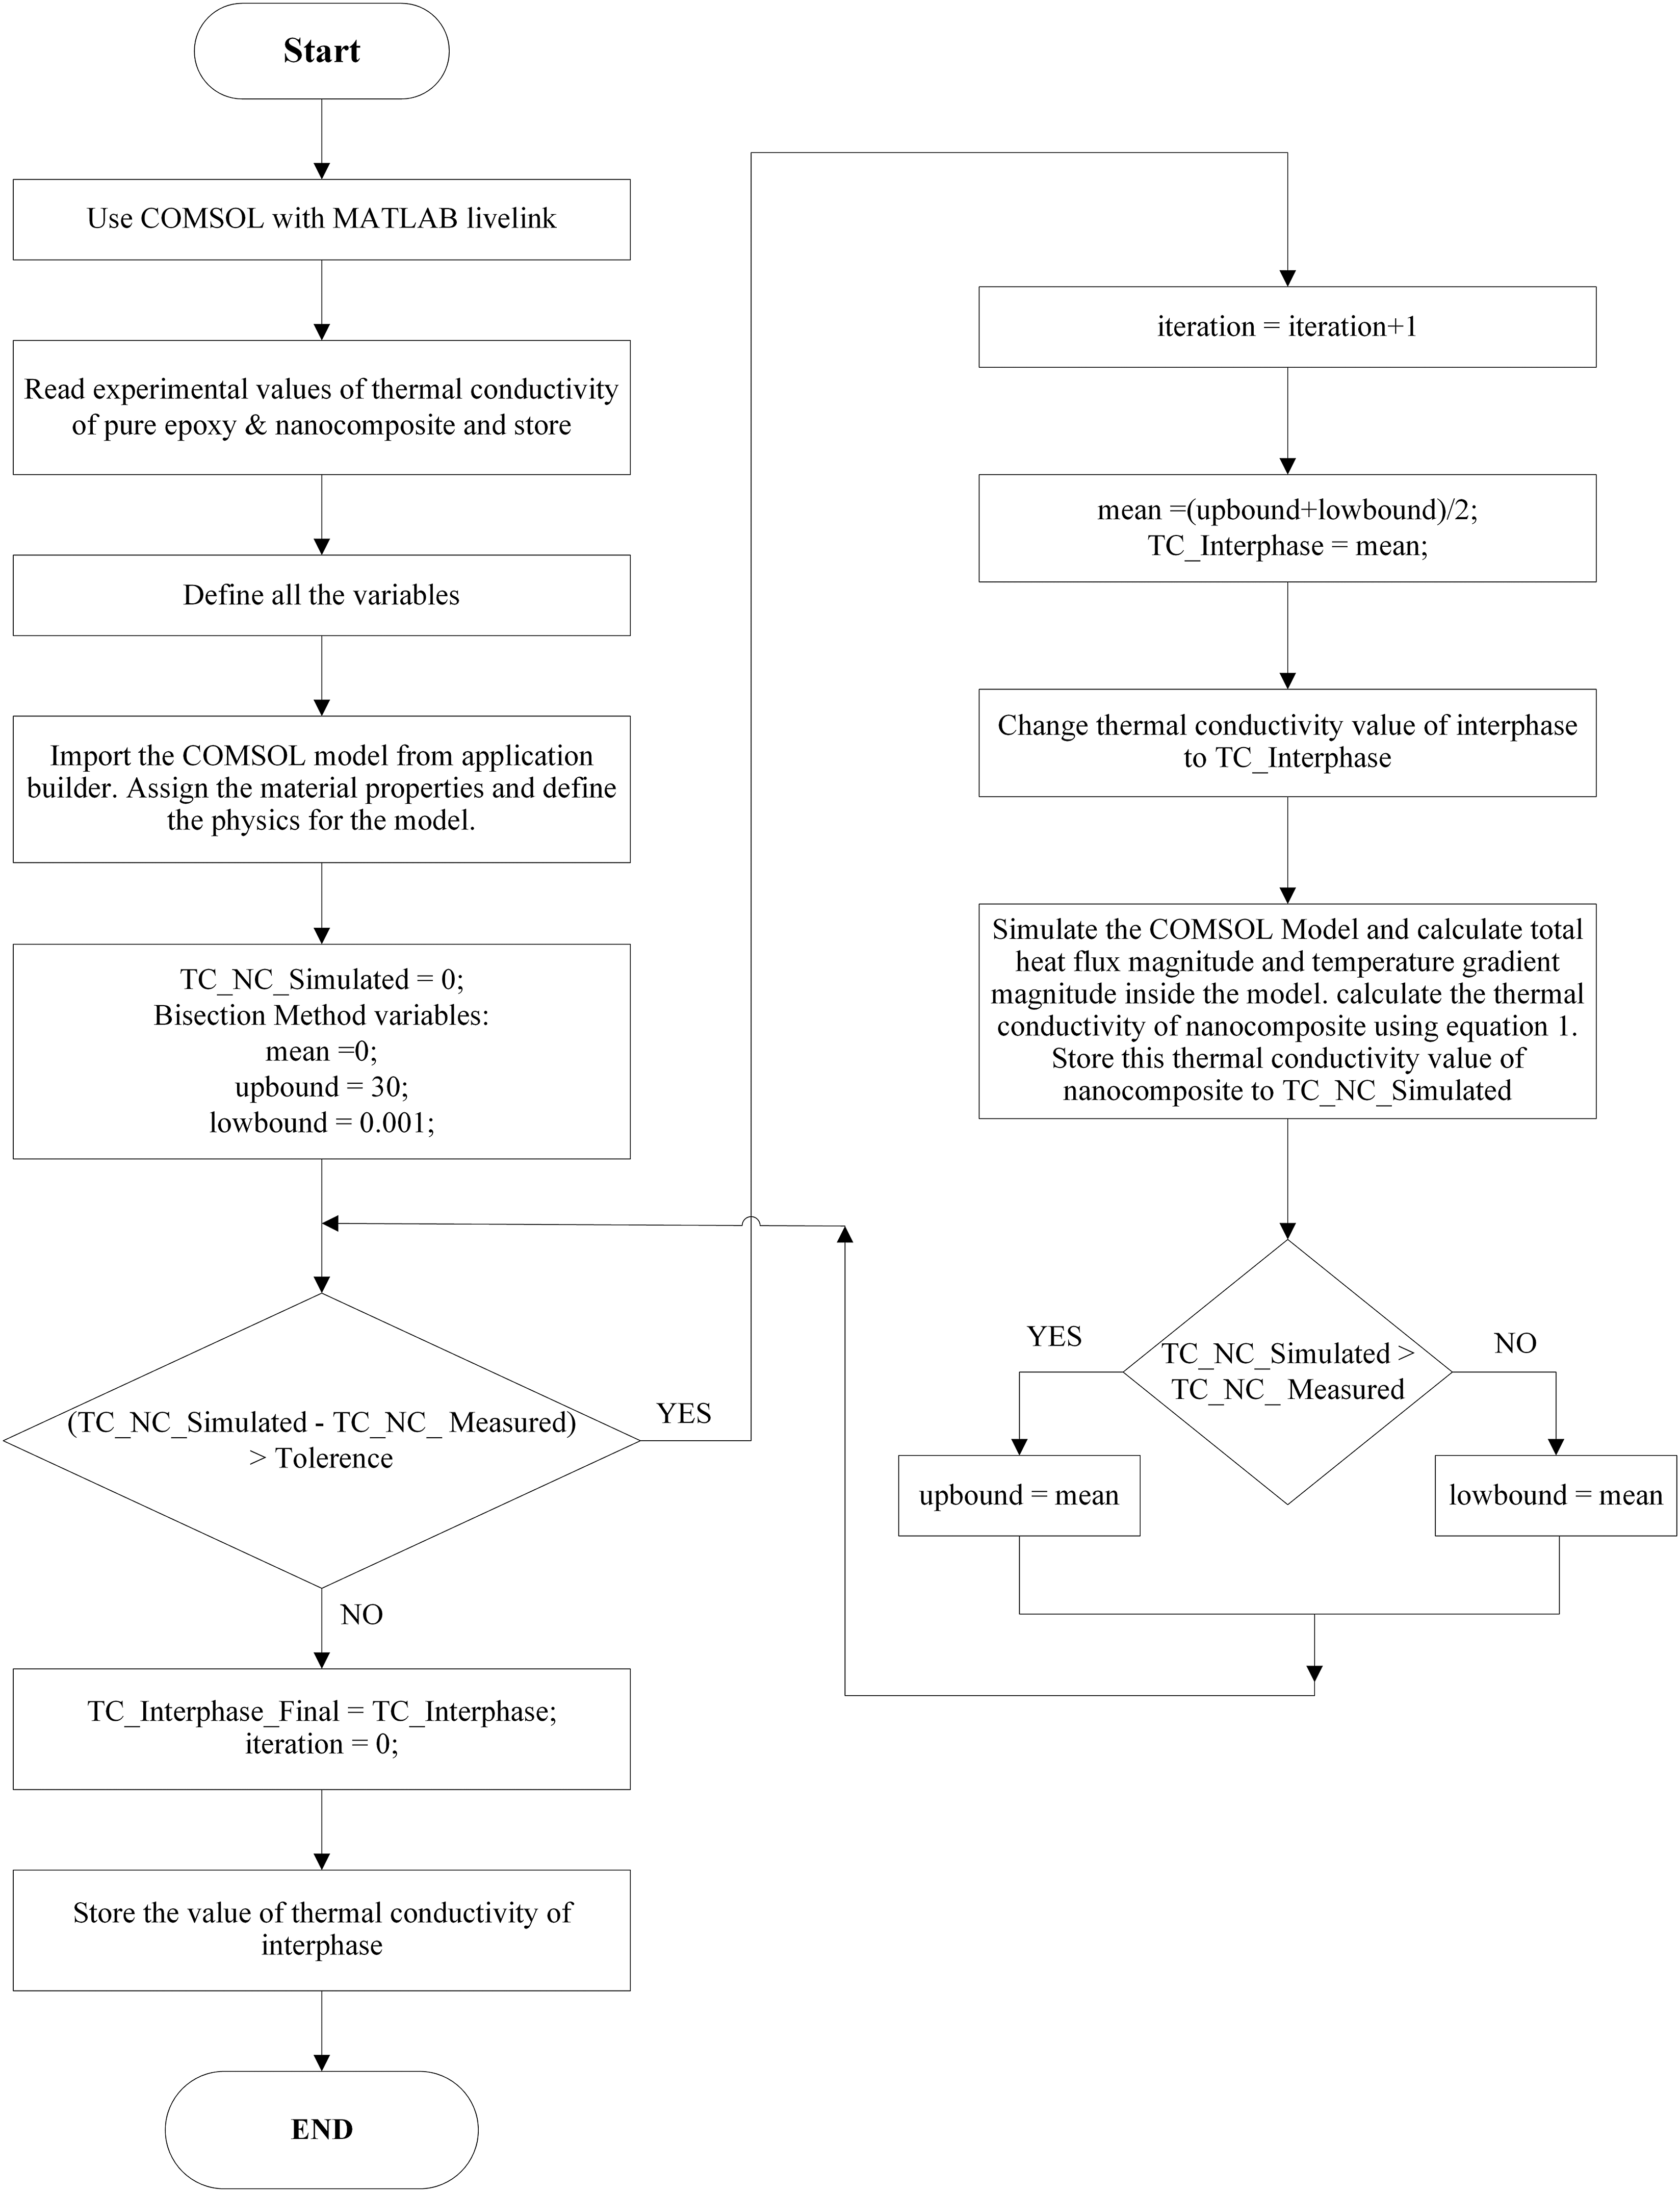

Results and discussion
The thermal conductivity of alumina particles as specified by the manufacturer is 30 W/K.m, and the measured thermal conductivity of neat epoxy samples is 0.16 W/K.m. This shows that the epoxy resin possesses significantly lower thermal conductivity than alumina. Figures 8(a) and (b) show X-ray diffraction (XRD) spectra of epoxy and alumina nanoparticles, respectively. XRD graph of (a) Pure epoxy sample, (b) Alumina nanoparticles, (c) Epoxy alumina nanocomposite sample.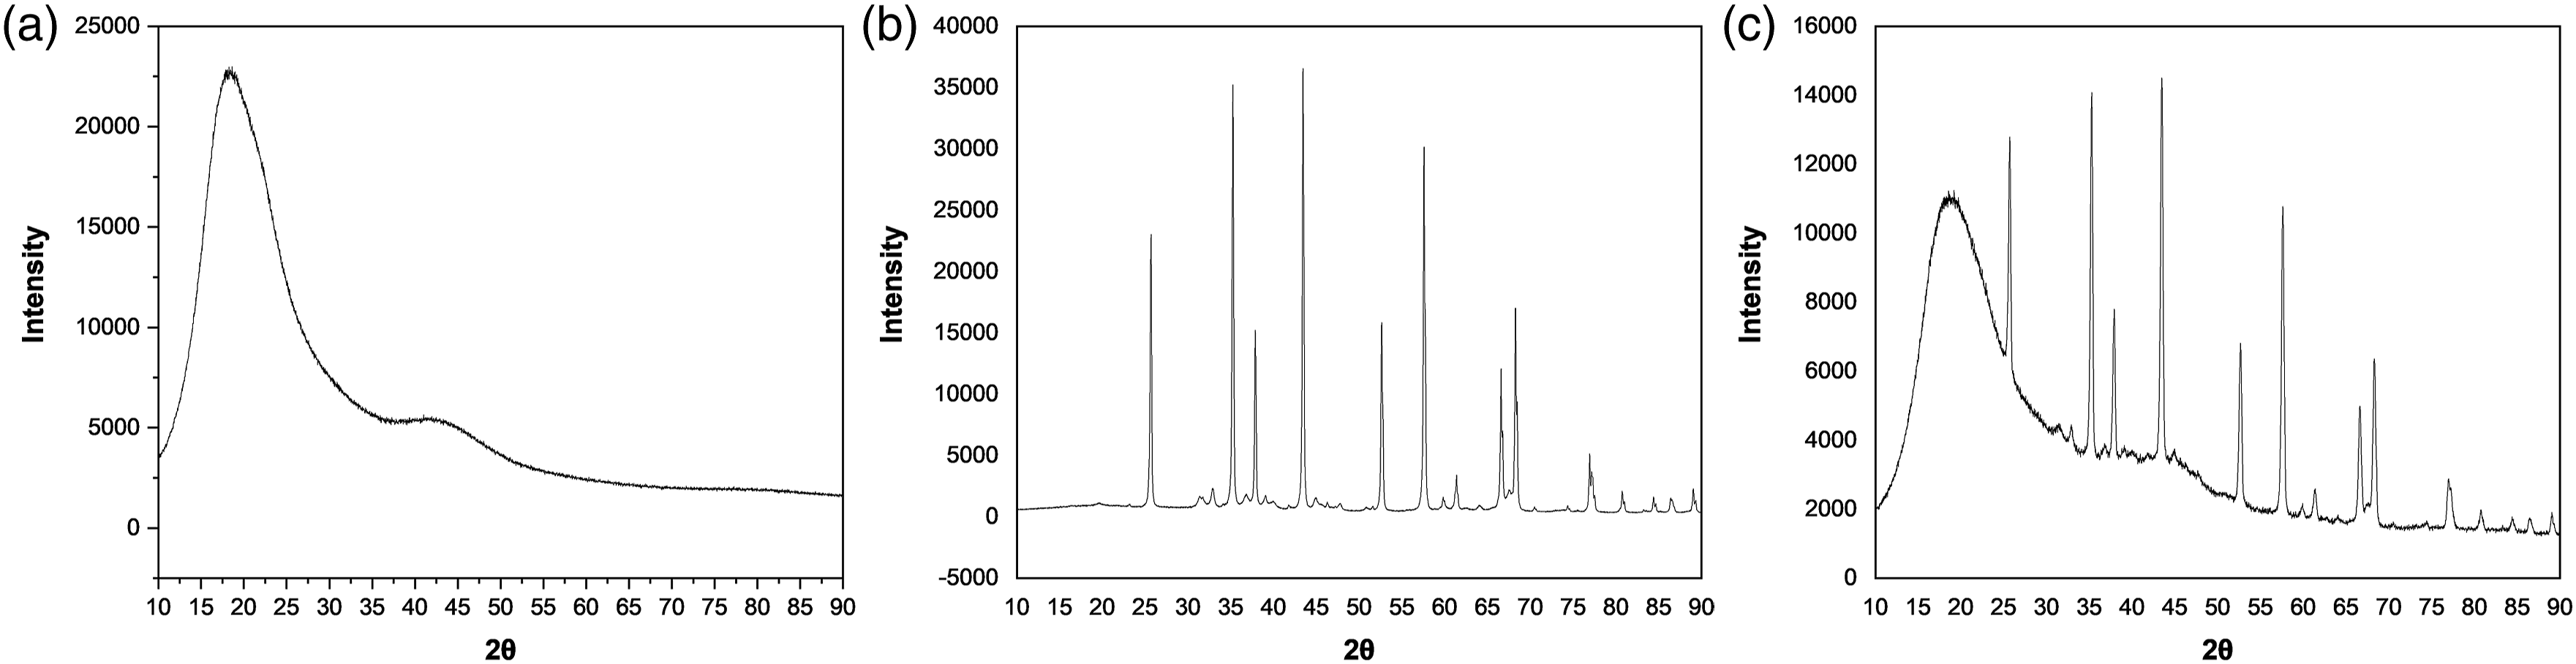
The XRD pattern indicates the amorphous and crystalline nature of epoxy and alumina, respectively. One of the main reasons for the lower thermal conductivity of epoxy resin is its high degree of amorphousness. Besides being amorphous, epoxy resin exhibits low thermal conductivity due to its low atomic density and a higher mismatch in its molecular thermal vibrations. 20 Figure 8(c) depicts the XRD pattern of epoxy alumina nanocomposites, which clearly shows the presence of alumina particles in composite samples.
The effect of nanofiller inclusion on the thermal conductivity of epoxy is estimated using the numerical model described earlier. To begin with, the numerical model treats nanocomposites as a two-phase system. The computed thermal conductivity is then compared with the measured thermal conductivity. The bar chart in Figure 9 shows the measured and numerically estimated effective thermal conductivity of nanocomposite samples. The calculated thermal conductivity of nanocomposites is significantly lower than the measured value. Thus, considering a nanocomposite sample as a two-phase system is unacceptable, particularly when nanocomposites are synthesized using surface-treated nanoparticles. Pandey and Singh
11
presented a detailed analysis to demonstrate how the interaction of a surface-treated filler and a polymer matrix would eventually form interphase. Furthermore, quantitative interphase analysis reveals that the interphase thickness in epoxy alumina nanocomposites can reach a few hundred nanometers.
17
Measured thermal conductivity of actual nanocomposites and simulated value (without considering interphase).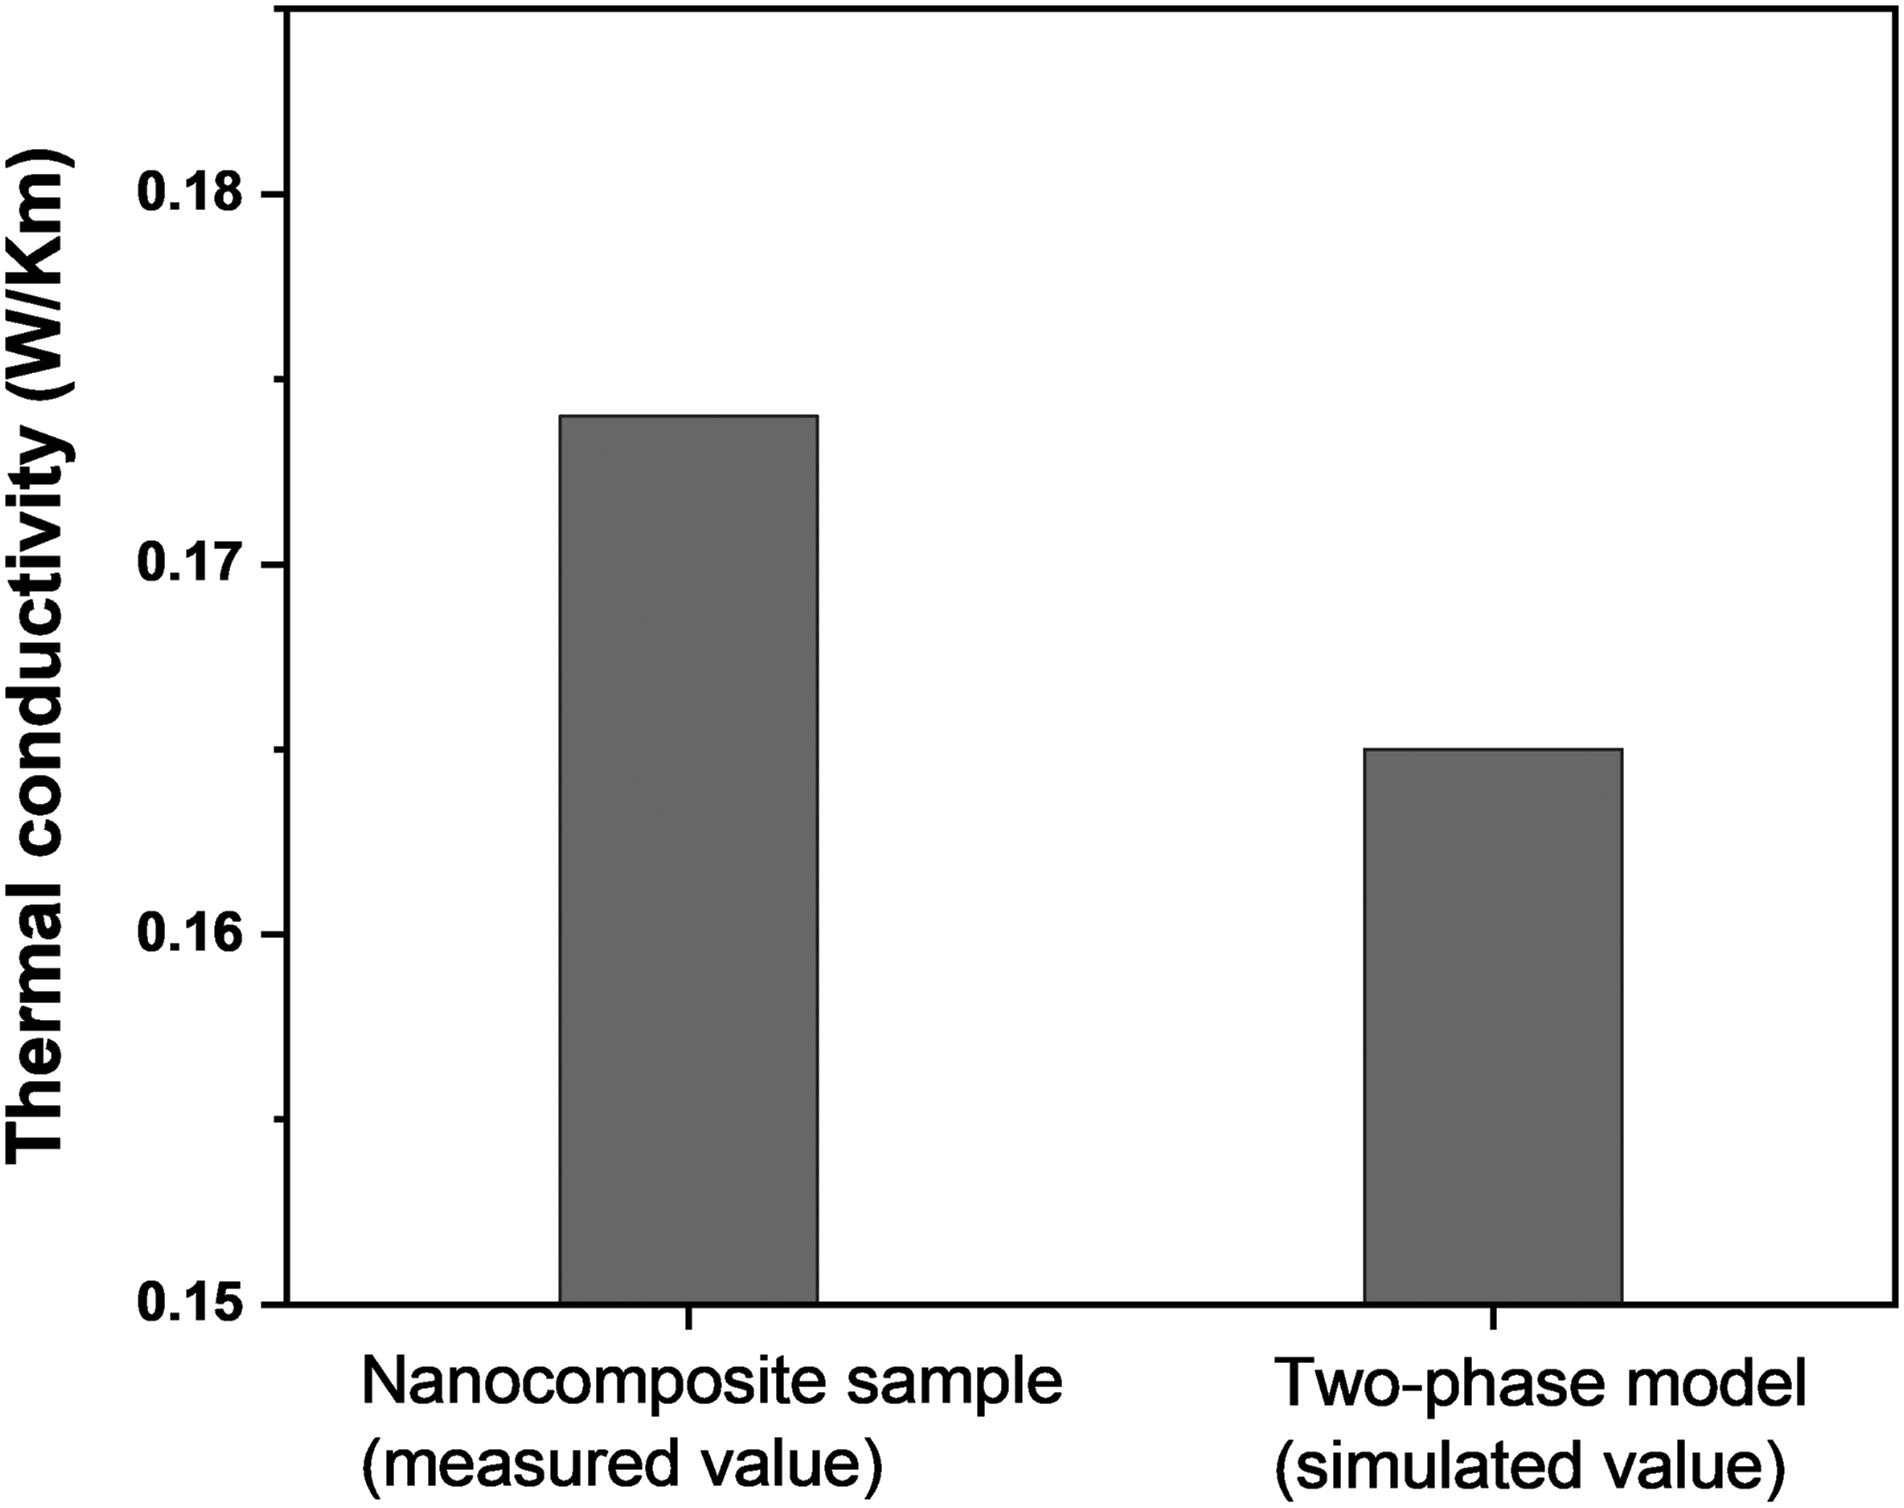
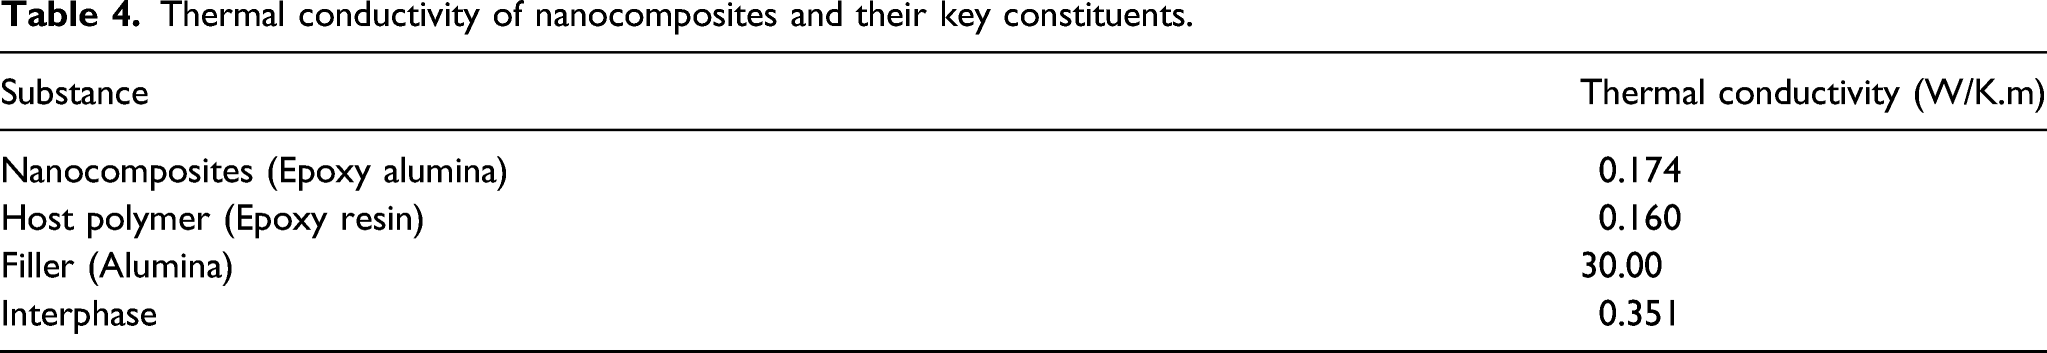
Thermal conductivity of nanocomposites and their key constituents.
Furthermore, for a three-phase system, the effective thermal conductivity of composites should lie within the upper and lower Wiener bounds.
21
The upper and lower Wiener bounds are given by equation (2) and (3).

For epoxy-based nanocomposites (formed with 1 vol.% of alumina), kupper and klower are 0.471 W/K.m and 0.168 W/K.m, respectively. The effective thermal conductivity of epoxy alumina nanocomposites predicted using the numerical model is 0.174 W/K.m, and this value lies within the upper and lower Wiener bounds. Similarly, the effective thermal conductivity estimated by the proposed numerical model for nanocomposites (containing 2 vol.% of nano alumina) is within Wiener bounds.
Each of the studies outlined above verifies the numerical model’s accuracy. The thermal conductivity of the interphase is calculated to be significantly greater than that of the neat polymer. The interphase’s high thermal conductivity may be a result of the polymer chain’s alignment at the filler matrix interfaces. Andritsch
22
proposed a polymer chain alignment model and explained how aligned chains might contribute to a nanocomposites sample’s effective permittivity. Similarly, a few other researchers23–30 have published on the impact of chain alignment on the thermal conductivity of polymers. Heat transfer in insulating polymers is thought to be primarily facilitated by phonon transport. The scattering of thermal energy carriers (phonons) is caused by the irregular crystal structures of polymers, as shown in Figure 10(a). Polymeric materials with increased phonon scattering have low thermal conductivity. Aligned polymer chains minimize interfacial resistance, thus facilitating phonon transport between filler and base epoxy and vice versa. The schematic in Figure 10(b) illustrates how aligned polymer chains at the interfaces can boost phonon transport, resulting in an increase in interphase thermal conductivity. (a) Phonon scattering phenomena in a polymer, (b) Phonon transport phenomena through aligned polymers chains at the interface.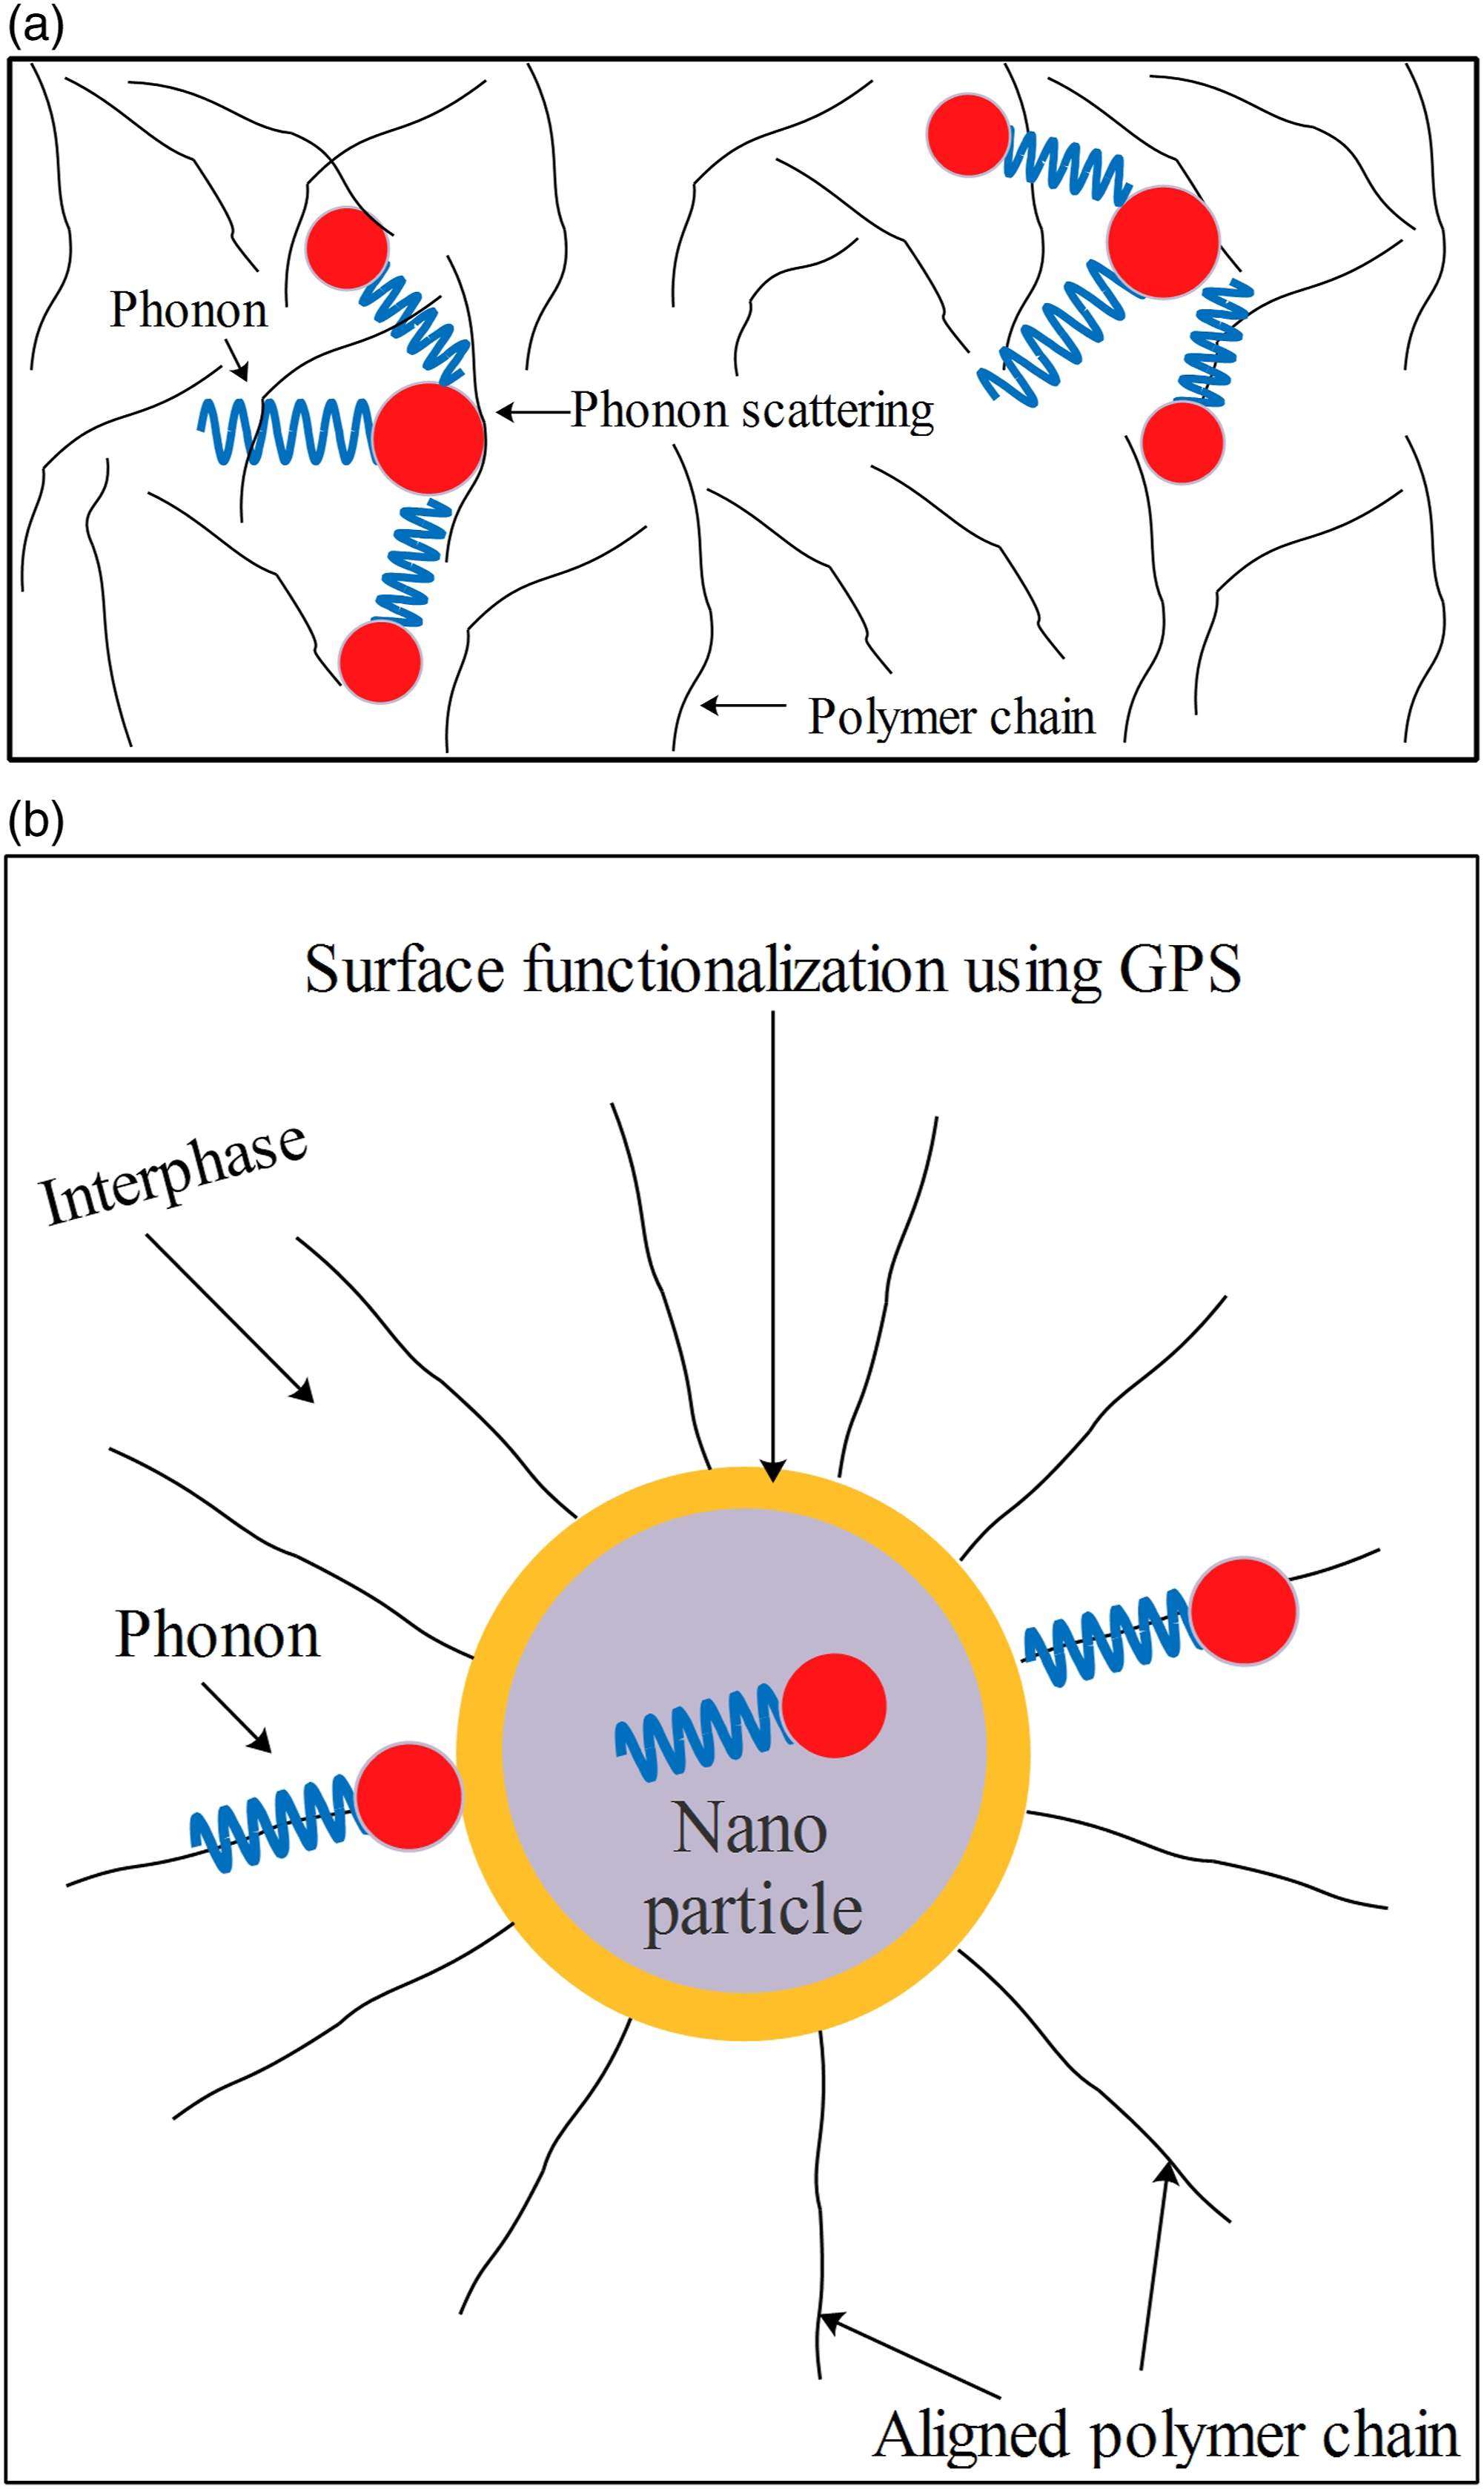
The bar chart in Figure 9 shows how interphase has a quantifiable impact on thermal conductivity estimates of nanocomposites. For example, the thermal conductivity of actual nanocomposites (made with surface-treated nanofillers) is 0.174. On the other hand, when nanocomposites are modeled as a two-phase system (i.e., without interphase), the effective thermal conductivity is found to be 0.164. This suggests that the interphase has a substantial impact on nanocomposites' thermal conductivity. In a similar line, interphase was seen to affect other dielectric characterizations (viz., dielectric strength, conductivity, and permittivity). The authors' earlier work 11 detailed systematic analysis of interphase formation in epoxy-based nanocomposites and its impact on dielectric properties.
Conclusion
The thermal conductivity of epoxy alumina nanocomposites is investigated in this work. When epoxy alumina nanocomposites are treated as a two-phase system, numerically predicted thermal conductivity values do not concur with experimental values. Thus, one could argue that the interaction between the filler and the matrix results in the creation of interphase, which is particularly true when nanocomposites are formed using surface-treated nano alumina. This study makes the most significant contribution by developing a methodology for estimating the thermal conductivity of interphase using experimental data and numerical modeling. According to the proposed methodology, the thermal conductivity of the interphase in epoxy alumina nanocomposites is 0.351 W/K.m, which is significantly higher than that of pure epoxy. The increased thermal conductivity of the interphase may be due to the interaction of the filler matrix, which results in the alignment of polymer chains at the interfaces. Aligning polymer chains reduces phonon scattering, resulting in increased heat transfer efficiency. This research focuses exclusively on epoxy-based composites employing nano alumina fillers. At a low filler content (1 vol.% of nano alumina), the thermal conductivity of nanocomposites is seen to increase modestly for neat polymer. However, as evidenced in the published literature, boosting thermal conductivity at a high filler level necessitates a trade-off of dielectric properties. Thus, future work with various high thermal conductivity fillers should be undertaken in order to optimize the material’s overall performance. From this vantage point, the current study points the way forward for future research on the electro-thermal analysis of polymer nanocomposites.
Footnotes
Declaration of conflicting interests
The author(s) declared no potential conflicts of interest with respect to the research, authorship, and/or publication of this article.
Funding
The author(s) received no financial support for the research, authorship, and/or publication of this article.