
Abstract
The study of the behavior of polymeric material used for insulators in the electrical system is extremely important in order to evaluate their lifetime as well as their performance when exposed to different environmental conditions. In the present work, the behavior of high-density polyethylene (HDPE) pin type insulators (15 kV), under accelerated aging conditions, was studied. Samples were exposed to aging, for 200 h, 1000 h, and 2000 h, in accelerated weathering chambers, according to two different methods. In Method 1, the parameters were established based on natural aging in location conditions, and in Method 2, ASTM G155 standard parameters were used. All samples were characterized by rheometry, Fourier-transform infrared spectroscopy (FTIR), and differential scanning calorimetry (DSC). The accelerated aging conditions, used in Methods 1 and 2, affected the aging of HDPE pin type insulators samples differently, the changes being more intense in Method 1.
Keywords
Introduction
Electrical insulation is one of the most important parts of all electrical components, and its quality determines the reliability of several electric equipment used in electric energy generation, transmission, and distribution, such as cables, capacitors, insulators, transformers, generators, and motors. Every electric insulation system is designed to support the different stresses, which equipment and components are exposed to, during their lifetime.1,2
The study of the behavior of the polymeric material used for manufacturing electric system insulators is important in order to evaluate the lifetime of such products, as well as their performance when exposed to different environmental conditions. 3 Despite the advantages of the use of polymeric insulators, there are many concerns related to them, such as the diversity of polymeric materials and additives and the reliable prediction of the lifetime of these insulators, among others.4,5
Aging studies are extremely important for the development of more resistant materials, as well as additives, for increasing the lifetime of polymers. 6 The use of accelerated aging methods makes possible the prediction of material behavior and their lifetime, at short periods of exposure. 7
For large thickness products, the degradation is, usually, limited to a superficial layer, due to the difficulty for the diffusion of oxygen or for the penetration of UV radiation. 8 The loss of antioxidant protection of polymers is a subject largely reported in scientific and technical communications.9–17
The lifetime polymeric material evaluation used for insulators in the electrical system as well as their performance when exposed to different environmental conditions is extremely important. So, in the present work, the behavior of high-density polyethylene (HDPE) pin type insulators (15 kV), using accelerated weathering chamber, at different conditions, was studied. Temperature, humidity, and irradiance were the parameters used for accelerated aging conditions. Samples were exposed to aging in accelerated weathering chambers, according to two different methods. In Method 1, the parameters were established based on natural aging in local conditions, and in Method 2, ASTM G155 standard parameters were used. The characterization of the insulators, before and after aging, was carried out by differential scanning calorimetry (DSC), FTIR, and rheometric tests. The obtained results for Methods 1 and 2 show that the aging of HDPE pin type insulator samples was differently affected. It is believed that the same behavior should be observed in other polymers used in the electrical system.
Materials and methods
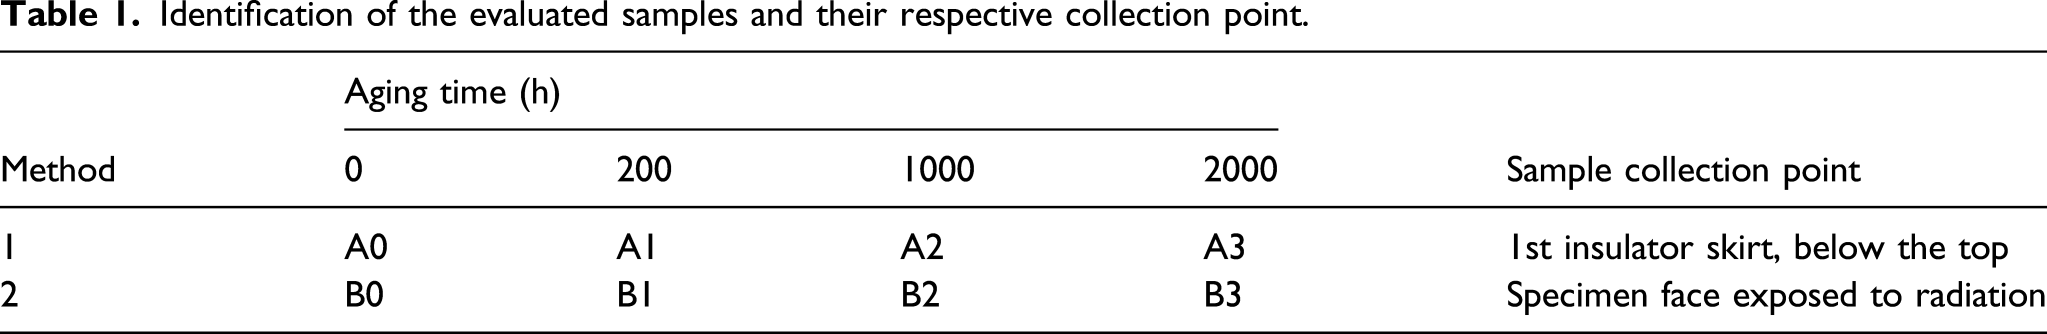
Identification of the evaluated samples and their respective collection point.
FTIR analysis
A Thermo Fisher Scientific, model Nicolet 6700, FTIR spectrometer, ATR mode, with 64 scans and 4 cm−1 resolution, was used for obtaining molecular absorption spectra in the infrared region, ranging from 4000 cm−1 to 650 cm−1. With the aid of this technique, the Carbonyl Index (CI), for the aged samples, was determined, based on equation (1)
20

Differential scanning calorimetry analysis
A Shimadzu, DSC-60 model, with aluminum sampler, was used. Crystalline melting temperature (T m ) and degree of crystallinity were determined according to ASTM D3418. 21 The Onset Oxidation Temperature (OOT) test was conducted according to ASTM E2009, 22 using synthetic air as carrier gas.
Rheometric analysis
Rheometric tests were performed on a rotational rheometer, AR-G2 model (TA Instruments), using plate–plate geometry, at 190°C. The linear viscoelastic region was determined from storage (G') and loss (G'') moduli plots as a function of strain (%), in a strain sweep test. The frequency sweep test was performed to determine the variation of the weight average molecular weight (M w ) of the samples as a function of aging. The software Rheology Advantage Data Analysis version 5.7.0 was used. The frequency was varied from 0.8 to 400 rad s−1, and, as a control variable (% strain), the value of 2.5% was used, which is within the linear viscoelastic region.
Results and discussion
FTIR analysis
The FTIR spectrum of HDPE is characterized by three intense methylene (CH2) group bands, which appear as doublets at 730 cm−1 and 718 cm−1, 1472 cm−1 and 1460 cm−1, and 2917 cm−1 and 2849 cm−1. Other characteristic peaks include vinyl group peaks (−C = C) in the range of 1000 cm−1–900 cm−1, carbonyl group peaks (−C = O) in the range of 1800 cm−1–1500 cm−1, and hydroxyl group peaks (−OH) in the range of 3600 cm−1 to 3100 cm−1.
23
A comparison between the FTIR spectra of the non-aged sample (A0 and B0) and the samples aged for 2000 h, by Method 1 (A3) and by Method 2 (B3), is shown in Figure 1(a). Concerning the FTIR spectra of these samples, characteristic bands of polyethylene were identified, attributed to CH2. High intensity bands at 2917 cm−1 (asymmetric stretching), at 2849 cm−1 (symmetric stretching), between 1472 cm−1 and 1462 cm−1 (bending angular strain), and a medium intensity band between 730 cm−1 and 718 cm−1 (rocking). No significant differences were observed, in the FTIR spectra, for samples, aged for 200 h and for 1000 h, by both methods. (a) FTIR spectra for samples not aged and aged by Methods 1 and 2 to 2000 h. (b) In detail the same scaled-down spectra for absorption.
It is possible to observe the emergence and/or intensity increase of some bands, indicated in Figure 1(b). The bands around 3348 cm−1 and 1736 cm−1 are related to the degradation of polyethylene, due to the formation of hydroperoxides and carbonyl, respectively.
23
The increase of the band intensity, at 3348 cm−1, as shown in the FTIR spectra of the samples aged for 2000 h, in comparison with the spectra for the non-aged ones, might be probably related to the polymer loss of hydrophobicity, along aging and according to the aging method. The other bands, indicated in Figure 1, might well be related to a possible presence of additives at the samples surface, that is,
Haider and Karlsson 10 and Du and collaborators 16 studied the loss and migration of additives in LDPE films and in epoxy resin surface, respectively. The FTIR results of these studies indicated the loss and migration of these additives during aging.
According to Haider and Karlsson, 26 the loss rate of the additive depends on its compatibility with the polymer, and it is controlled by its mobility, ease of extraction, and solubility. The additive migration process, during the polymer lifetime, results in changes in polymer properties. Yang and collaborators 27 verified that small volatile molecules can migrate to the surface during polymer aging, and these changes can be detected and used to represent the aging condition of the polymer.
High temperatures favor the diffusion rate of additives, as a consequence of a higher chain flexibility. During accelerated aging, Method 1 samples were exposed to a higher temperature than Method 2 samples, due to radiation contribution (UV-Vis region). In Method 1, the surface temperature of the samples reached a maximum value of 70°C, what might have contributed, in a more significant way, to the additive diffusion process to the surface of the samples, aged by this method. In Method 2, the maximum temperature was 63°C.
CI values for samples before and after accelerated aging by Methods 1 and 2.

It can be observed, from Table 2, that the carbonyl group is not present in samples non-aged and aged for 200 h, independently of the aging method. Nevertheless, in samples, aged for 1000 h and 2000 h, the carbonyl is present, the CI being greater for samples aged by Method 1, suggesting a higher level of oxidation of the samples aged by this method. It is also noted that the CI values increase significantly between 200 h and 1000 h, such increase being more significant in Method 1.
In the study of Gulmine and collaborators, 28 stabilized HDPE samples were exposed to accelerated aging, up to 1600 h, at the same temperature, humidity, and radiation used in Method 2. By FTIR, a CI value of 0.2, for 1600 h, was obtained. This value is pretty much close to the one obtained, in the present study, for sample B3 (2000 h of accelerated aging).
Passador and collaborators 29 and Carrasco and co-authors 30 studied the artificial aging of HDPE and suggested that chemical modifications such as the formation of carbonyl and vinylic groups would be relevant only for exposure time superior to 60 days (1440 h). In the present study, carbonyl groups were not identified in samples exposed for 200 h (8.33 days) of aging, but in samples exposed to 1000 h (41.67 days), these groups could be identified. Also, in the analyzed samples, vinylic group bands were not identified (vinylidenes—absorption at 888 cm−1 and vinyl groups—absorption at 910 cm−1 and at 990 cm−1, trans-vinylenes—absorption at 964 cm−1. This result suggests that there was no crosslinking during the accelerated aging process.
Therefore, the obtained FTIR results point out that the HDPE of the samples underwent degradation with time and according to the aging method used in the present study, resulting on the formation of hydroperoxide and carbonyl, being more intense for Method 1. It seems that the difference in humidity condition contributed to the higher incidence of hydroperoxides in samples aged by method 1.
Differential scanning calorimetry analysis
Differential scanning calorimetry curves of the samples, before and after accelerated aging by Methods 1 and 2, for the determination of OOT (exothermic event) are shown in Figure 2. DSC curves for the determination of crystalline melting temperature (T
m
) and of crystalline melting enthalpy (ΔH
m
) are shown in Figure 3. These results refer to DSC first run. OOT values, T
m
, and ΔH
m
are presented in Table 3. Differential scanning calorimetry curves (OOT) for samples before and after accelerated aging: (a) Method 1 and (b) Method 2. Differential scanning calorimetry curves (Tm) for samples before and after accelerated aging: (a) Method 1 and (b) Method 2. OOT, Tm, and ΔHm values for samples before and after accelerated aging by Methods 1 and 2.


In Table 3, a comparison between OOT results for samples, before and after accelerated aging, by Methods 1 and 2, can be seen. We observed a reduction in the OOT with time, for both methods. Also, it is observed that the lowest values for this temperature are for samples aged for 2000 h, independently of the method. The OOT values decrease for samples aged for 200 h and 1000 h, in comparison with the non-aged sample, were more significant in Method 1 than in Method 2. For 200 h of aging, there was a 35°C decrease (13%), in Method 1, compared to a 6°C decrease (2%), in Method 2. For 1000 h of aging, there was a 52°C reduction (19%) in OOT value, in Method 1, while, in Method 2, this reduction was 20°C (7%). These results suggest that the concentration of antioxidants at the surface of the samples aged by Method 1 is, probably, lower than at the ones aged by Method 2, at least considering the aging times of 200 h and 1000 h. This would be a consequence of the more aggressive weathering conditions imposed by Method 1, when compared to Method 2. The migration and consequent loss of additives hypothesis, based on the FTIR results, corroborate the analysis based on the OOT results.
Gulmine and collaborators 28 reported a reduction, around 10%, in the OOT value (240°C), for a sample aged for 800 h, under similar conditions used in Method 2 of the present work. In our case, for sample B2 (1000 h of aging), a reduction of 7% in the OOT value of the non-aged sample (276°C) was observed.
After 2000 h of accelerated aging, the OOT values obtained by both methods are practically the same (218°C and 220°C, for Methods 1 and 2, respectively). It suggests that the concentration of antioxidants at the region where the samples were taken reached similar values, at 2000 h of aging, independently of the aging method and of the sample shape. According to Volponi, 31 the reduction if the OOT is directly related to the consumption of additives and/or to the degradation of the polymer. The results for the OOT, obtained in the present work, point out to a consumption of additives for the samples aged up to 2000 h, converging to a same value, for both methods. Nevertheless, the reduction if the OOT for the samples aged up to 1000 h was much more significant (higher rate) when Method 1 was used, compared to Method 2. According to CI values, calculated by FTIR spectra (Figure 1), it can be inferred that sample A3 seems more degraded than sample B3. As the OOT values for both samples (A3 and B3) are practically the same, it implies that the greater degradation of sample A3 might well be related to the more intense consumption of additives, during the first 1000 h of aging.
The crystallinity degree, calculated from the ΔH m values, obtained from DSC curves (Figure 3), as a function of aging time, is also presented in Table 3, where it can be observed that the values of the crystallinity degree of the samples aged by Method 2, for 0 h, 200 h, and 1000 h, are slightly superior to the ones obtained for the samples aged by Method 1. Such result is probably related to the specimen’s preparation. The samples used in Method 2 were subjected to processing (melting dumbbell-shaping insulators specimens, according to ASTM D638), while the ones used in Method 1 were taken directly from the polymeric insulator surface, without any further processing. There is no significant difference in the crystallinity degrees of the samples aged for Method 1, and it presented a crystallinity degree between 52% and 56%. This behavior is the same when compared with samples, aged until 1000 h, using Method 2, presented a crystallinity degree of the 58% and 59%. From 1000 h to 2000 h of aging, by Method 2, there can be seen a reduction in the crystallinity degree of the samples, decreasing from 59% to 51%. In Table 3, it is worthwhile to observe the convergence of the crystallinity degree of the samples, aged by both methods, at 2000 h of aging. This result can be interpreted as a decrease, with aging, of the thermal history influence on the crystallinity. Such convergence was also observed concerning the OOT. Carrasco and collaborators 30 observed a small and random variation of the crystallinity degree of HDPE as a function of aging time for a 120 days period (2880 h). The authors concluded that there is little influence of the UV radiation on the crystallinity degree of HDPE, a result similar to that found in the present study.
As it can be observed in Table 3, the crystalline melting temperature of the aged samples presented a small variation compared to the respective non-aged sample. Therefore, as observed for the crystallinity degree, the crystalline melting temperature was little influenced by the aging method and by the sample shape.
Rheometric analysis
M w values and PI for samples before and after accelerated aging by Methods 1 and 2.

From this Table, it can be observed that the order of magnitude of the Mw for all samples is the same, that is, 105. The molar mass for the samples varied from 2.1 × 10⁵ g mol−1 to 2.7 × 10⁵ g mol−1, which is not significant. This result suggests that there was no considerable degradation of the samples. Although the FTIR results pointed to the occurrence of degradation, for 1000 h and for 2000 h, considering the formation of carbonyl and hydroperoxide groups, it seems, to the results of the rheometric tests, that the accelerated aging induced just a mild degradation of the samples, affecting mainly the side groups, with no significant effect on the molar mass. In Table 4, it can be observed a small variation of the PI up to 2000 h, especially for Method 2. For this method, the PI varied from 2.0 to 2.3, while for Method 1, it varied from 2.0 to 2.8. This result supports the inference of a mild degradation of the samples, as it indicates a variation of the molar mass, but not a significant one.
In addition, from the frequency sweep test, it was observed that, for samples A0 and A1 and all samples of Method 2 (B0, B1, B2, and B3), at lower angular frequencies, up to the crossover point, the viscous behavior predominated over the elastic one (G" > G'). For samples A2 and A3, the elastic behavior predominated over the viscous behavior (G' > G"), along the whole angular frequency interval evaluated. Samples aged by Method 1 presented a gradual increase in the elastic contribution, what was not observed for samples aged by Method 2. This result suggests that the two different methods used for HDPE samples aging result in different aging effects over the samples.
Hoekstra and collaborators 32 observed in HDPE samples, in conditions similar to those used in Method 2, that the molar mass of the samples remained at the same order of magnitude, with the PI decreasing from 3.0 to 2.4. In the study of Maria and collaborators, 33 HDPE-aged samples did not present any significant change in molar mass and their PI remained the same.
Conclusions
The accelerated aging conditions, used in Methods 1 and 2, affected the aging of HDPE pin type insulators samples differently, the changes being, as expected, more significant in Method 1, considering that it is more aggressive than Method 2. Both methods led to sample oxidation, after accelerated aging for 1000 h. A reduction, up to 21%, if the OOT, after 2000 h of accelerated aging, was observed. The T m and the crystallinity degree were little affected by aging, independently of the used method and of the sample shape. The M w remained at the same order of magnitude, while the PI presented a small variation. The obtained results suggest the occurrence of additive migration to the surface of the samples, followed by an additive loss, as a function of accelerated aging time. Finally, it is important to emphasize, as can be observed from the obtained results, that, with aging, the polymer undergoes a significant change on its structure–property relationship.
Footnotes
Acknowledgments
The authors thank PETROBRAS, CAPES, and CNPq for their technical support.
Declaration of conflicting interests
The author(s) declared no potential conflicts of interest with respect to the research, authorship, and/or publication of this article.
Funding
The author(s) disclosed receipt of the following financial support for the research, authorship, and/or publication of this article: This work was supported by the CEMIG/TAESA grant numbers 4020000609 – D-447 and FAPEMIG grant numbers APQ-03259-11 – D-530.