
Abstract
In this article, the effect of irradiation dose and incorporated nanoparticles of kaolin (K) and graphite (G) on the lattice structure, thermal analysis, electrical conductivity, morphology, and mechanical properties of high-density polyethylene (HDPE) were studied. Infrared spectroscopy analysis (FTIR), transmission electron microscopy (TEM), and X-ray diffraction (XRD) were used to characterize and prove the nanostructure of kaolin and graphite. Subsequently, HDPE was reinforced with a fixed percentage of nanokaolin at 3 phr and different contents of nanographite at 2 and 4 phr via melt-mixing and then molded by the hot press to sheets of suitable thickness. The fabricated sheets will be exposed to various gamma radiation doses at 50, 100, and 150kGy to investigate the impact of ionizing radiation on the prepared nanocomposites. It was found that the presence of a fixed percent of nanokaolin and graphite nanoparticles at 2 phr inside the HDPE matrix improved various properties of the prepared nanocomposites. Furthermore, the synergistic effect of nanokaolin with nanographite and irradiation doses led to the improved crystal structure, thermal analysis, mechanical properties, and electrical conductivity of HDPE nanocomposites.
Keywords
Introduction
Due to its low cost, high chemical resistance, high impact energy, and excellent process ability, polyethylene (PE) is one of the industry’s most widely used semi-crystalline polymers. However, due to its low strength, weak electrical characteristics, and lack of stiffness, the use of PE in the industry has been limited. Incorporating an inorganic reinforcing agent into this engineering material might increase its quality and have a substantial financial influence on expanding the applications for PE.1–6
Along with the development of nanomaterials, new products like nanocomposites have received attention. Many investigations have considered the utilization of polymer-based nanocomposites, among different types of nanocomposites, because of their wide area of use, and simpler, and less costly, production methods.7–12
Graphite is one of the most important inorganic fillers because of its high modulus and high electrical conductivity. It is naturally abundant and inexpensive. Graphite is a material with multiple layers made up of alternating carbon layers. The carbon particles are in-plane covalently bonded while graphite layers are limited by much weaker van der Waals forces, which makes intercalation possible. Graphite is widely used to improve the conductivity of polymers due to its low cost, availability and desired conductivity.13,14
Furthermore, Kaolin is layered silicate clay with an octahedral structure, which has attracted wide attention because of its rich resource, low cost, and loose structure. Because it has a lot of active sites and hydroxyl groups on its surface, it performs well when combined with graphite. Not only its electrical conductivity can be significantly increased, but its mechanical properties and thermal analysis can also be improved.15,16
Researchers have paid greater attention to polymer radiation processing because it may be used as an alternative to more common chemical procedures for changing the molecular structure of polymers. The irradiation technique additionally reduces energy consumption and cure time requirements. Additionally, because it doesn’t require solvents or initiators at high temperatures and allows one to avoid degradation phenomena and other side reactions typical of polymer processing in the melt, polymer processing by ionizing radiation is both environmentally and economically safe.6,17 The addition of kaolin filler has led to some improvement in the mechanical characteristics of the polymer mix. This study will look into how different gamma radiation doses and the incorporation of nanokaolin individually or reinforced with nanographite into HDPE affect the physico-mechanical characteristics of fabricated HDPE/K/G nanocomposites. The study would examine the processing potential and the contribution of hybrid fillers to their quality.
Experimental
Materials
The polyethylene used in this study is HDPE, M.P. 129°C, melt flow 3.7 g/10 min, and density 0.963 g/cc, from Sidi Kerir Petrochemical Company (SIDPEC), kaolin powder is an industrial product from Sinai Manganese Company. SiO2 makes up 52% of the material, Al2O3 makes up 34%, Fe2O3 makes up 0.9%, TiO2 is between 1.5 and 2.3%, Na2O is 1%, K2O is 0.07%, MgO is 0.11%, Ca is 0.12%, and MnO is less than 0.01%. Graphite fine powder extra pure 98%, MW: 12.01 with 98% carbon content were supplied by LOBA-Chemie, Mumbai, India.
Preparation of high-density polyethylene nanocomposites
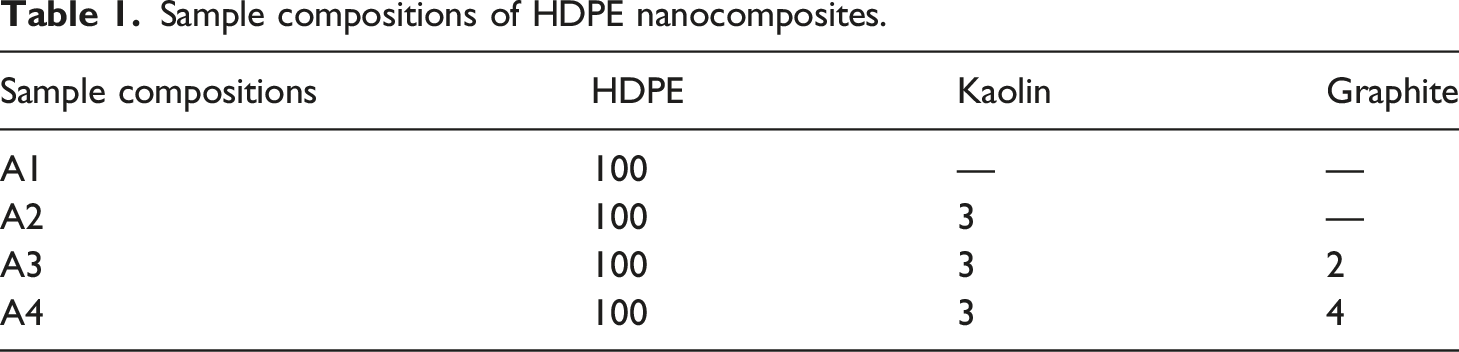
Sample compositions of HDPE nanocomposites.
Gamma irradiation
A cobalt −60 gamma cell type 4000 A, India, located at the National Centre for Radiation Research and Technology (NCRRT), Egyptian Atomic Energy Authority (EAEA), Egypt, was used to gamma irradiate the prepared nanocomposites. Gamma radiation was applied to the prepared samples at ambient air, humidity, and room temperature in doses of 50, 100, and 150 kGy at a dose rate of about 1.0 kGy/h.
Instrumental analysis
Infrared spectroscopy analysis (FTIR)
The functional groups investigation was concluded via the attenuated total reflectance Fourier transform infrared (ATR-FTIR) Vertex 70 FTIR spectrometer, Bruker Optik GmbH, Ettlingen, Germany at a resolution of 0.5 cm−1 in the range of 4000 – 400 cm−1.
Transmission electron microscopy (TEM)
The shape and size of the nanoparticles were determined using a TEM 1230 microscope, JEOL Co., Japan, at an accelerating voltage of 100 kV.
X-ray Diffraction (XRD)
An X-ray Philips X’pert diffractometer was utilized for the investigation of nanocomposites. At a scan rate of 2°C min−1, Cu kα radiation, a power of 40 kV, a current of 30 mA, a wavelength of 0.1546 nm, and room temperature, the XRD patterns ranged from 4 to 90. According to the Scherer equation (1), the crystallite size (L) was calculated as follows.
Where FWHM is known as the full width at half maximum intensity. Furthermore, the average inter-crystallite separation (S), inter planner spacing (d), distortion parameters (g) and dislocation density (δ) of the samples were calculated by using the following equations from (2) to (5).
6


Thermal stability measurement
Using a sample mass between 1 and 4 mg, Thermogravimetric analysis (TGA) was carried out using a Shimadzu TGA-50 system (Japan) in the temperature range of 20–600°C at a rate of 10°C per minute under a controlled dry nitrogen flow of 20 ml per minute.
Thermodynamic parameters calculation
The activation energy was calculated according to the Horowitz – Metzger equation
18
in the formula as presented in equation (6).
Where the decomposition fraction is expressed as α, R gas constant, T is known as the total temperature (K), T max is known as the greatest degradation temperature (K), and Ea is the activation energy. By plotting ln (ln1/(1−α) against (T−Tmax) and taking a slope that is equal to Ea/R(Tmax)2, we can obtain the values of Ea. Calculations of the entropy ΔS, equation (7), activation enthalpy ΔH, equation (8), and free energy ΔG, equation (9), were displayed as follows.
19


Differential scanning calorimetry (DSC)
Using a DSC Shimadzu type DSC-50 system in a nitrogen atmosphere at a flow rate of 20 mL/min and a temperature range of ambient to 200°C at a heating rate of 10oC/min, the melting point of the prepared samples was examined.
Electrical conductivity
A Keithley 196 System DMM Digital Multimeter (USA), was used to evaluate the electrical conductivity of HDPE and nanocomposites of graphite at room temperature
Mechanical testing
Using the tensile testing machine Qchida computerized testing machine, Dongguan Haida Equipment Co. Ltd., China, the mechanical parameters were measured using dumbbell-shaped test pieces at a crosshead speed of 500 mm/min at 25 ± 2°C. The mechanical parameters of tensile strength, elongation at break and modulus of elasticity at 100% elongation (M100), were measured following ISO 527-2 and ASTM D 412a-98 standards. By comparing three samples, the mechanical property’s average value was determined.
High-resolution SEM
After the samples were sputter-coated with gold for 3 minutes, the cross-section morphology of the samples was evaluated using SEM using a ZEISS EVO 15 SEM, UK.
Results and discussions
Characterization of kaolin and graphite
Transmission electron microscopy, FTIR, and XRD were used to characterize kaolin and graphite as received and represented in Figures 1 and 2 respectively. Transmission electron microscopy (TEM) was used to investigate the particle size of kaolin and found to be sited in nanoscale within the range 25–50 nm (Figure 1(a)). On the other hand, based on the absorption of FTIR spectra of nanokaolin sample in Figure 1(b), the absorption bands appearing at wave numbers 1010 and 1022 cm−1 display vibration Si-O- which is a typical of kaolinite minerals.
20
The peak at 3660 cm−1 indicates the existence of vibration –OH which is bound to Aluminum octahedral atoms on the surface of the inter-layer silicate. Whereas, absorption at 1633 cm−1 was related to buckling vibration –OH.
21
The band at 900 cm−1 is referred to as the Si-C stretching vibration.
22
The X-ray diffraction (XRD) pattern of nanokaolin is shown in Figure 1(c). According to the XRD pattern, the signals at 2θ = 13°, 20°, 25°, 41°, 46°, 61° and 68° identify the presence of kaolin. Furthermore, the four signals at 2θ = 21°, 27°, 39° and 50° designate of SiO2.
23
(a) TEM, (b) FTIR and (c) XRD of kaolin. (a) TEM, (b) FTIR and (c) XRD of graphite.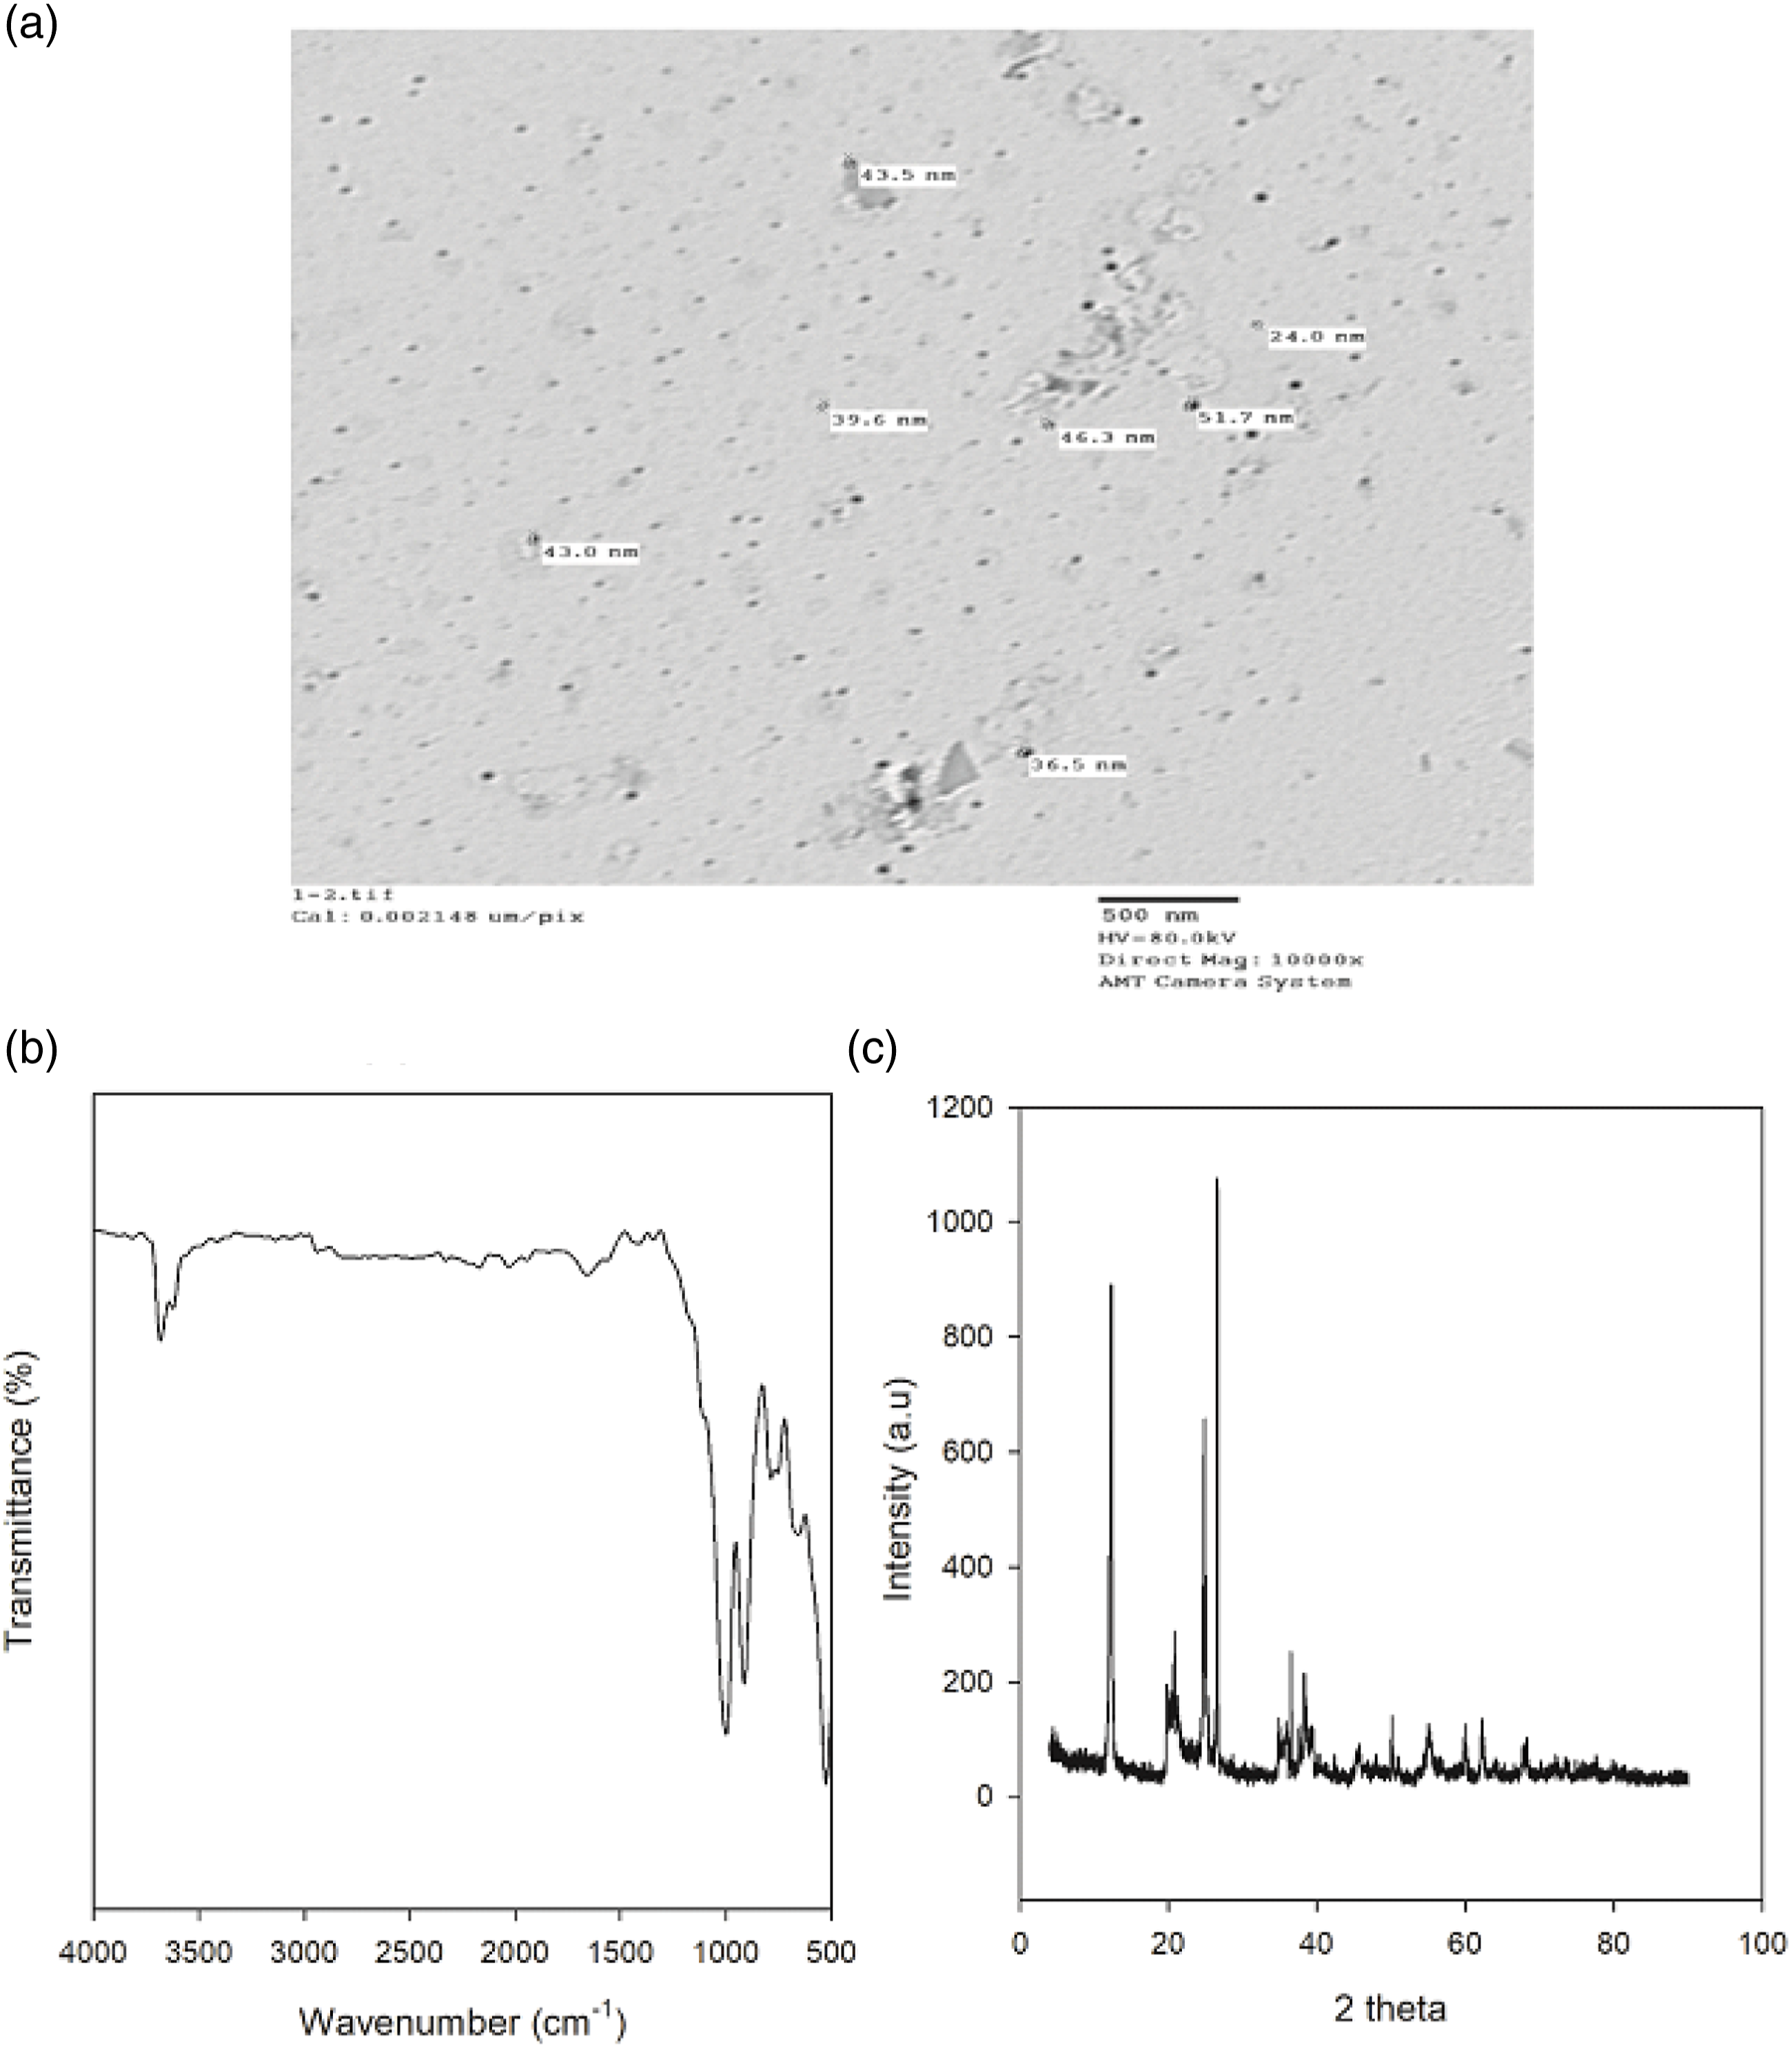
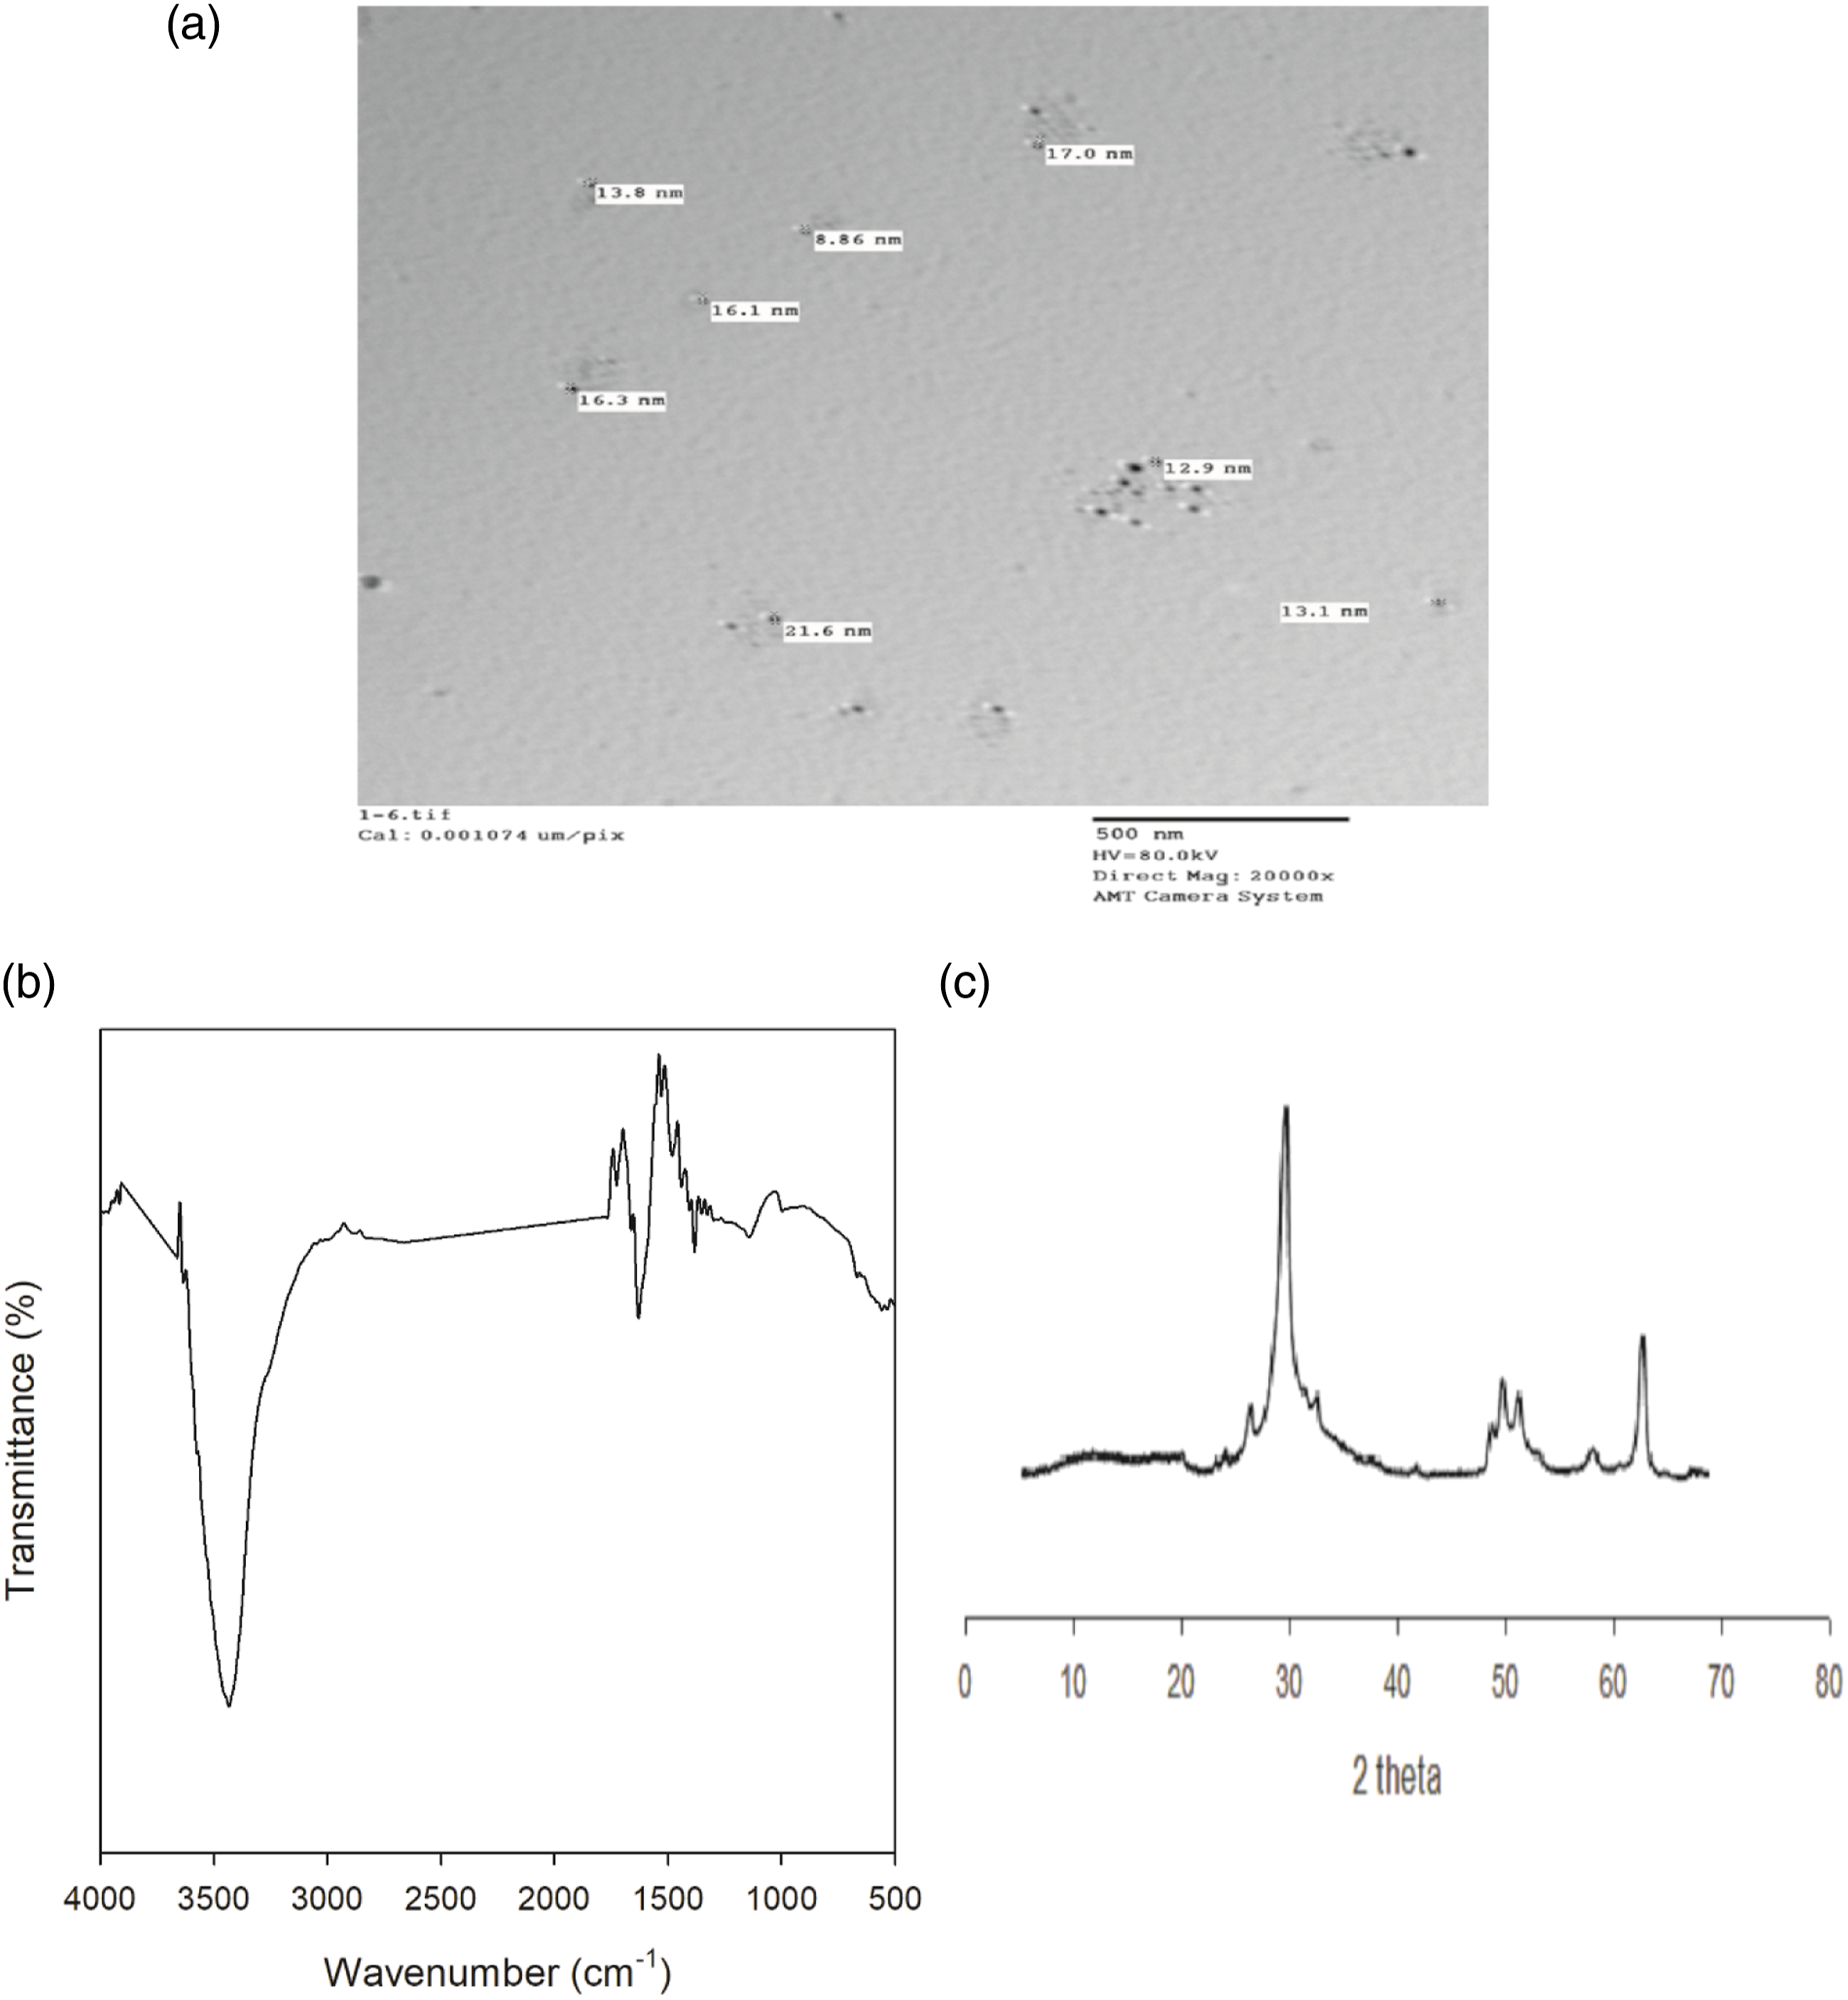
For graphite, it was found that the size of its particle is in a nanoscale at a range 9.0–22 nm. The FTIR spectra of nanographite powder exhibited a strong absorption peak that acted at 3434 cm−1, which matches to the stretching of O–H functional group, revealing the occurrence of hydroxide groups in the raw sample. Moreover, the peak at 1625 cm−1 being credited to the distinctive bands of graphite structure (sp2 hybridized C=C). 15 The XRD pattern displays the typical crystal structure of graphite powder wherever a characteristic sharp and tight peak (2θ = 26.5° and 23.88°) which corresponds to the diffraction line C (002) with the intercellular spacing in the crystal (d) respectively is 3.36 and 3.72 Å. Also, the characteristic peaks of (101) at 42.31° and (004) at 54.60° with average intensity were detected.
Characterization of high-density polyethylene nanocomposites
X-ray diffraction diffraction pattern of high-density polyethylene and its composites
Figure 3 shows the X-ray diffraction patterns of HDPE and HDPE loaded with kaolin and graphite. Figure 3, HDPE exhibits two strong reflection peaks at 2-theta around 21.5° and 23.9° that correspond to the (110) and (200) lattice planes; these peaks are typical of HDPE and show that the orthorhombic structure of the HDPE used in this investigation.
24
With the presence of kaolin in HDPE moiety, XRD represents new peaks around 2-theta 12° and 24.9° which are assigned to aluminosilicate plates, kaolinite, (Si2Al2O5(OH)4).
25
Figure 3, shows that with the incorporation of graphite into HDPE/kaolin, a new peak at about 2-theta = 26° was seen.
13
XRD of unirradiated HDPE blended with 3phr kaolin and various concentration of graphite.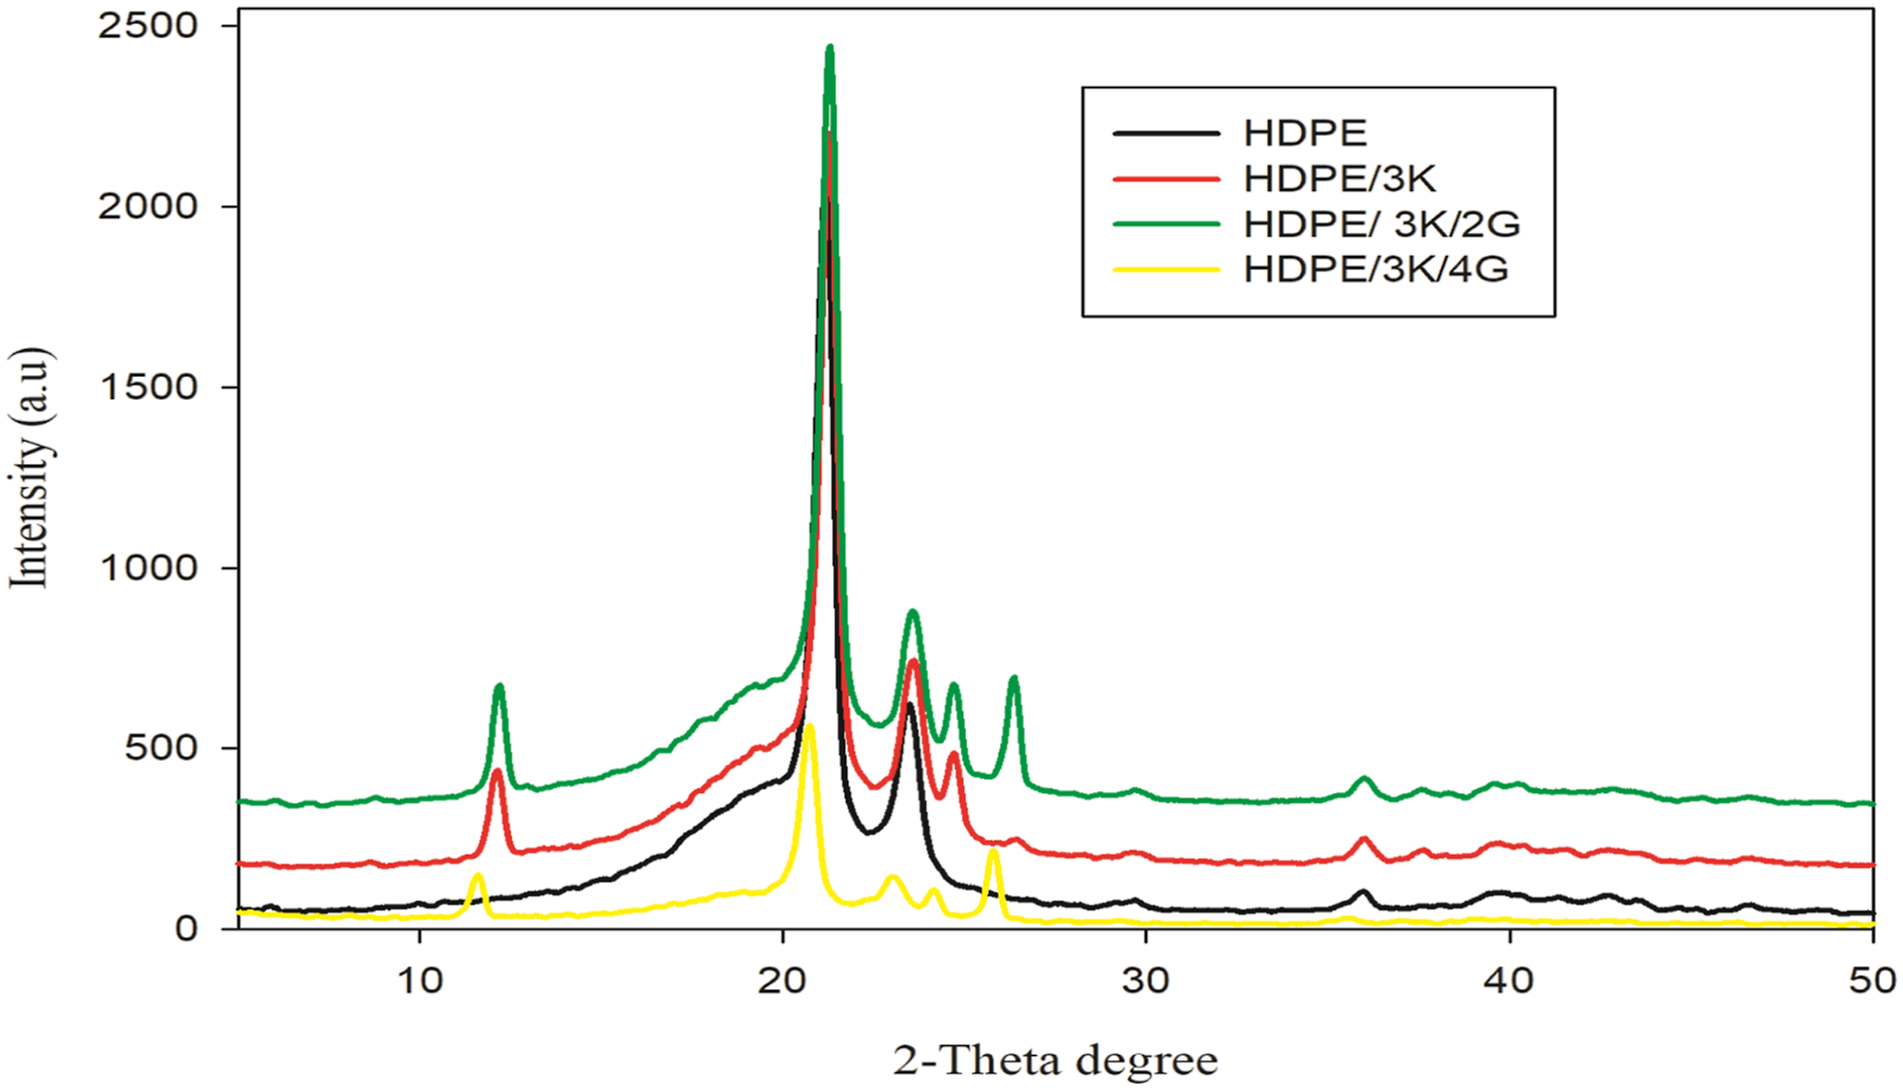
According to Figure 3, as graphene content increases up to 4phr, the strength of the peak at 2-theta = 23.9° drops. Moreover, the concentration of the kaolinite-specific signal decreased as the amount of graphene in the HDPE/Kaolin moiety increased. This observation suggests that kaolin is being exfoliated, and the good dispersion of the kaolin occurred during the mixing procedure. 26
Figure 4 shows the X-ray patterns of the HDPE nanocomposite at various gamma radiation doses., The increase in dose renders 2θ to shift to higher values with a notable rise in intensity of the peak. The increase in intensity demonstrates how irradiation increased the percentage of crystallinity in nanocomposites. This rise in crystallinity may be the result of polymer chains that have been cross-linked at the edges of the crystalline region experimentally supported by the shifting of peak positions to higher values of 2-theta. XRD of nanocomposite HDPE/3K/2G exposed to various gamma doses.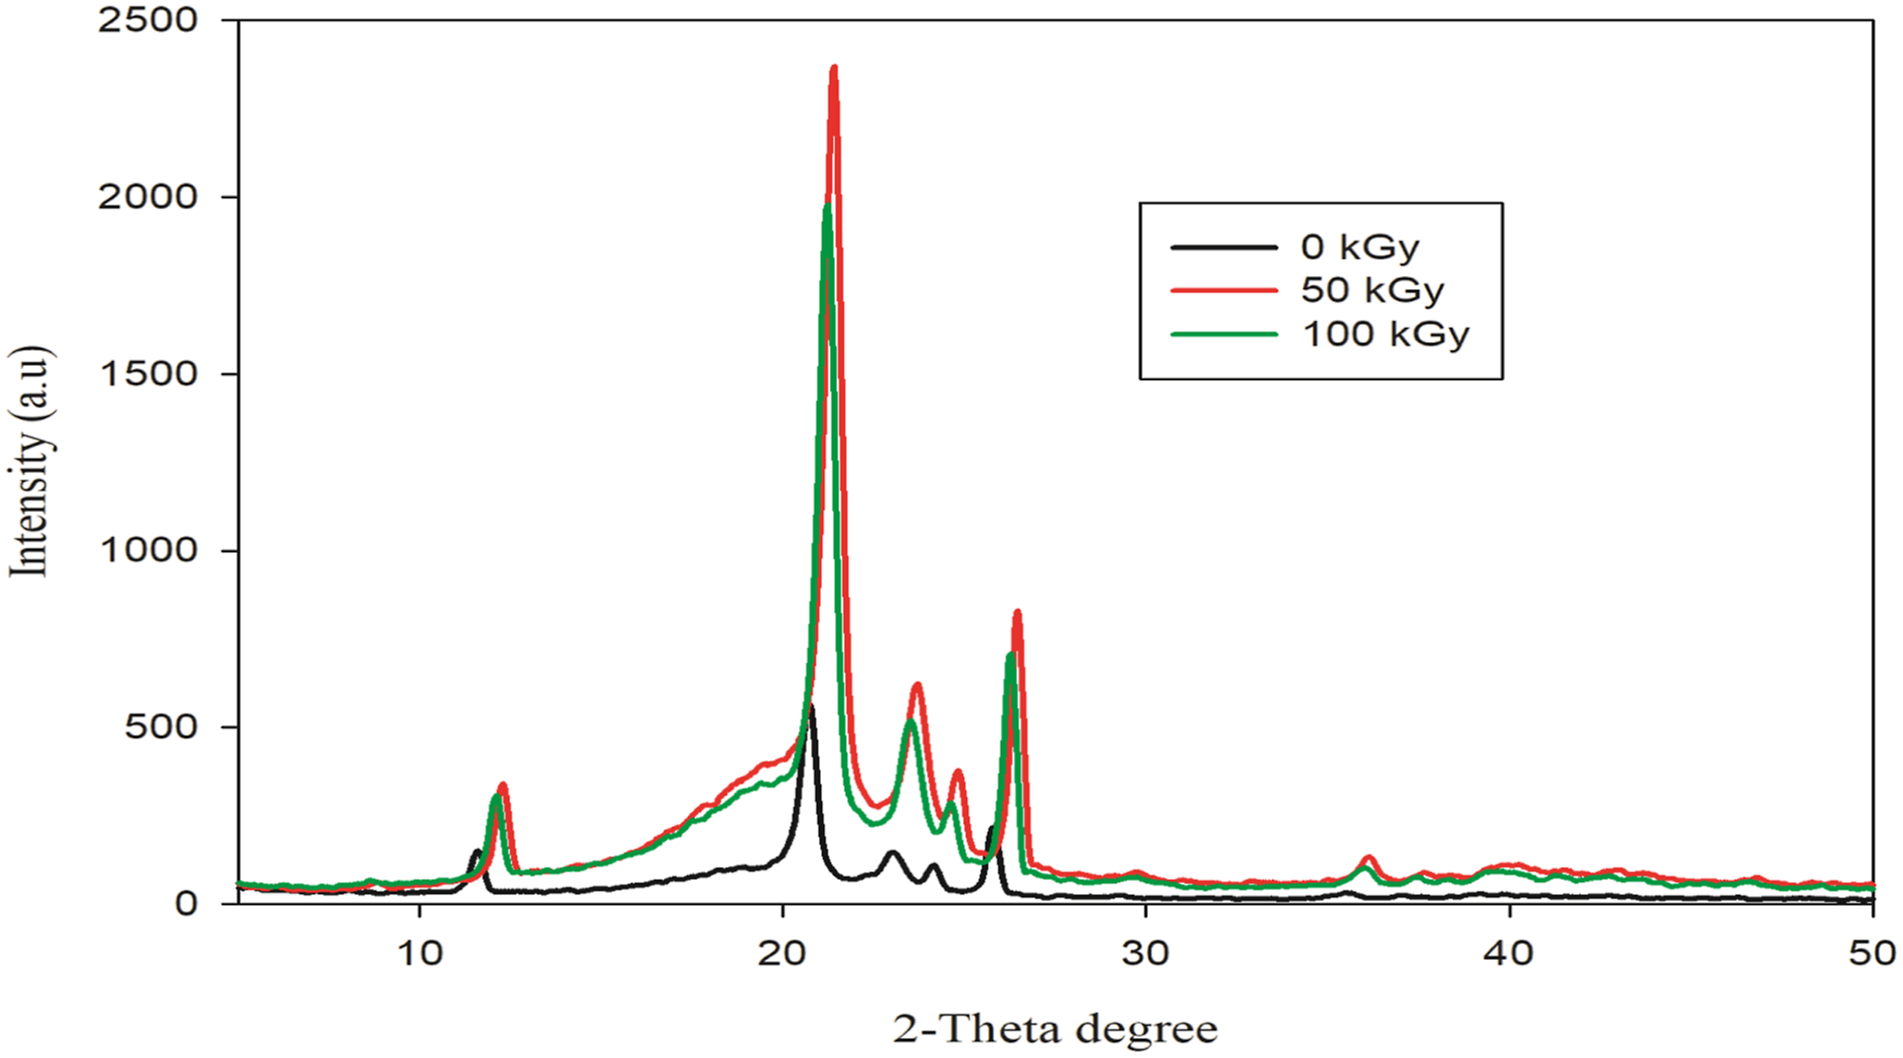
Structure analysis X-ray diffraction
XRD parameters of unirradiated and irradiated HDPE nanocomposites.
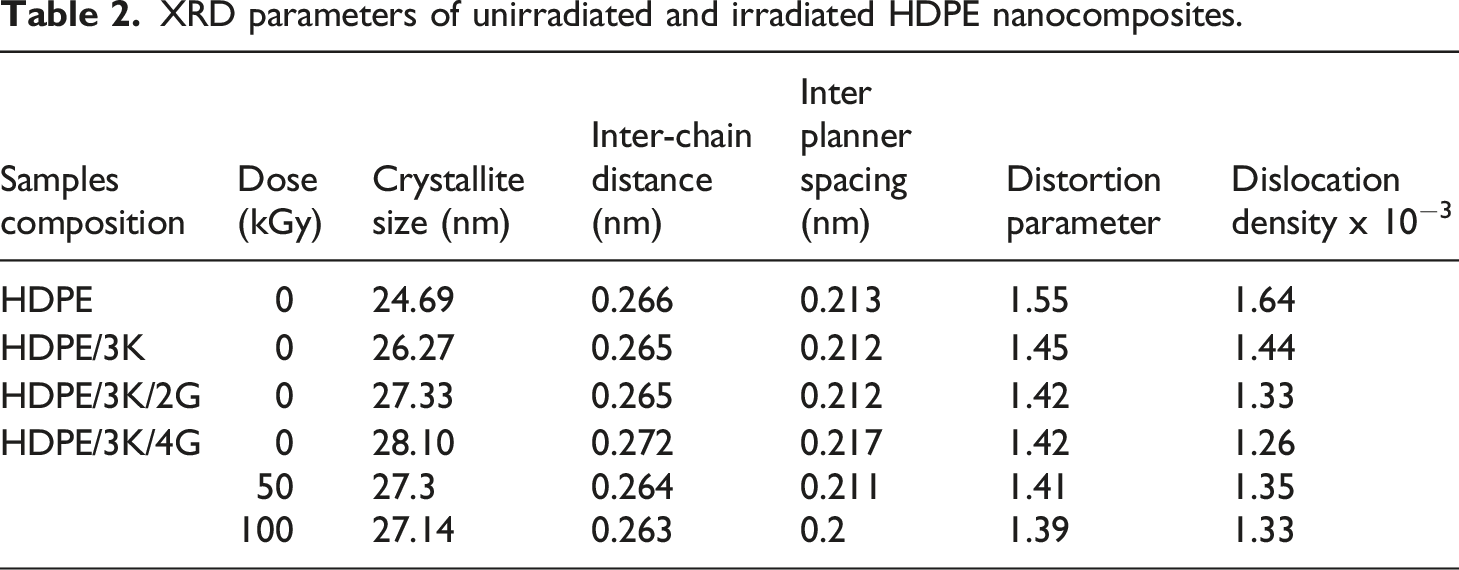
Furthermore, inter-chain distance and inter-planner spacing slightly decrease with the presence of kaolin and graphite up to 3phr into HDPE moiety, because of the occlusion of nanoparticles to the inter-spherulitic region of the HDPE chain. 6 For irradiated HDPE nanocomposite, shifted inter-chain distance and inter-planner spacing to lower values with increasing gamma radiation doses confirming that crosslinking occur between polymer chain lead to a decrease in inter-planner distance and inter-chain distance.
The distortion parameter for unirradiated nanocomposites shifted to a lower value with the incorporation of nano-particles into the HDPE moiety due to the regular dispersion of nano-particles into HDPE matrix which usually tends to modify the interaction between nano-particles and HDPE. For irradiated nanocomposites decrease values of distortion parameter with increased gamma doses, due to the short-range distribution of d spacing which originates from the internal stress distribution as a result of dislocations. 6
Dislocation density shifted to higher values for unirradiated HDPE with the presence of nano-particles and for irradiated nanocomposites decreasing dislocation with increased gamma doses up to 100 kGy attributed to the fragments of molecules in the amorphous region and linking molecules rearranging themselves on the crystallites causing an increase in the crystallinity of the polymer, which reflects the formation of the ordered system after irradiation. 27
Thermogravimetric analysis
To evaluate the decomposition temperature of unirradiated HDPE and its nanocomposites with kaolin and graphite, which are shown in Figure 5 and Table 3, TGA and DTG analysis were completed. Thermal stability of HDPE shifted to higher values with the incorporation of nanokaolin, attributed to kaolin particles acting as a heat barrier during the initial stages of thermal degradation. Moreover, non-flammable products like AlO, SiO2, and H2O are encouraged to enhance residual weight, proving that kaolin acts as a synergist to influence gaseous phase products from thermal decomposition.
28
Furthermore, the presence of nanographite in the prepared matrix shift thermal stability to higher values, due to fillers acting as thermal barriers, this may be explained by the uniform dispersion of nanographite in the composites together with their tortuous path, which, in contrast to HDPE, hinders oxygen and volatile breakdown products from diffusing through them. The TGA results demonstrate the good thermal stability of these polymer nanocomposites, especially with increasing filler loadings. to hinder the degradation of HDPE.29,30 TGA and DTG thermograms of unirradiated HDPE blended with 3 phr kaolin and various concentration of graphite. Thermal parameters of unirradiated and irradiated HDPE nanocomposites.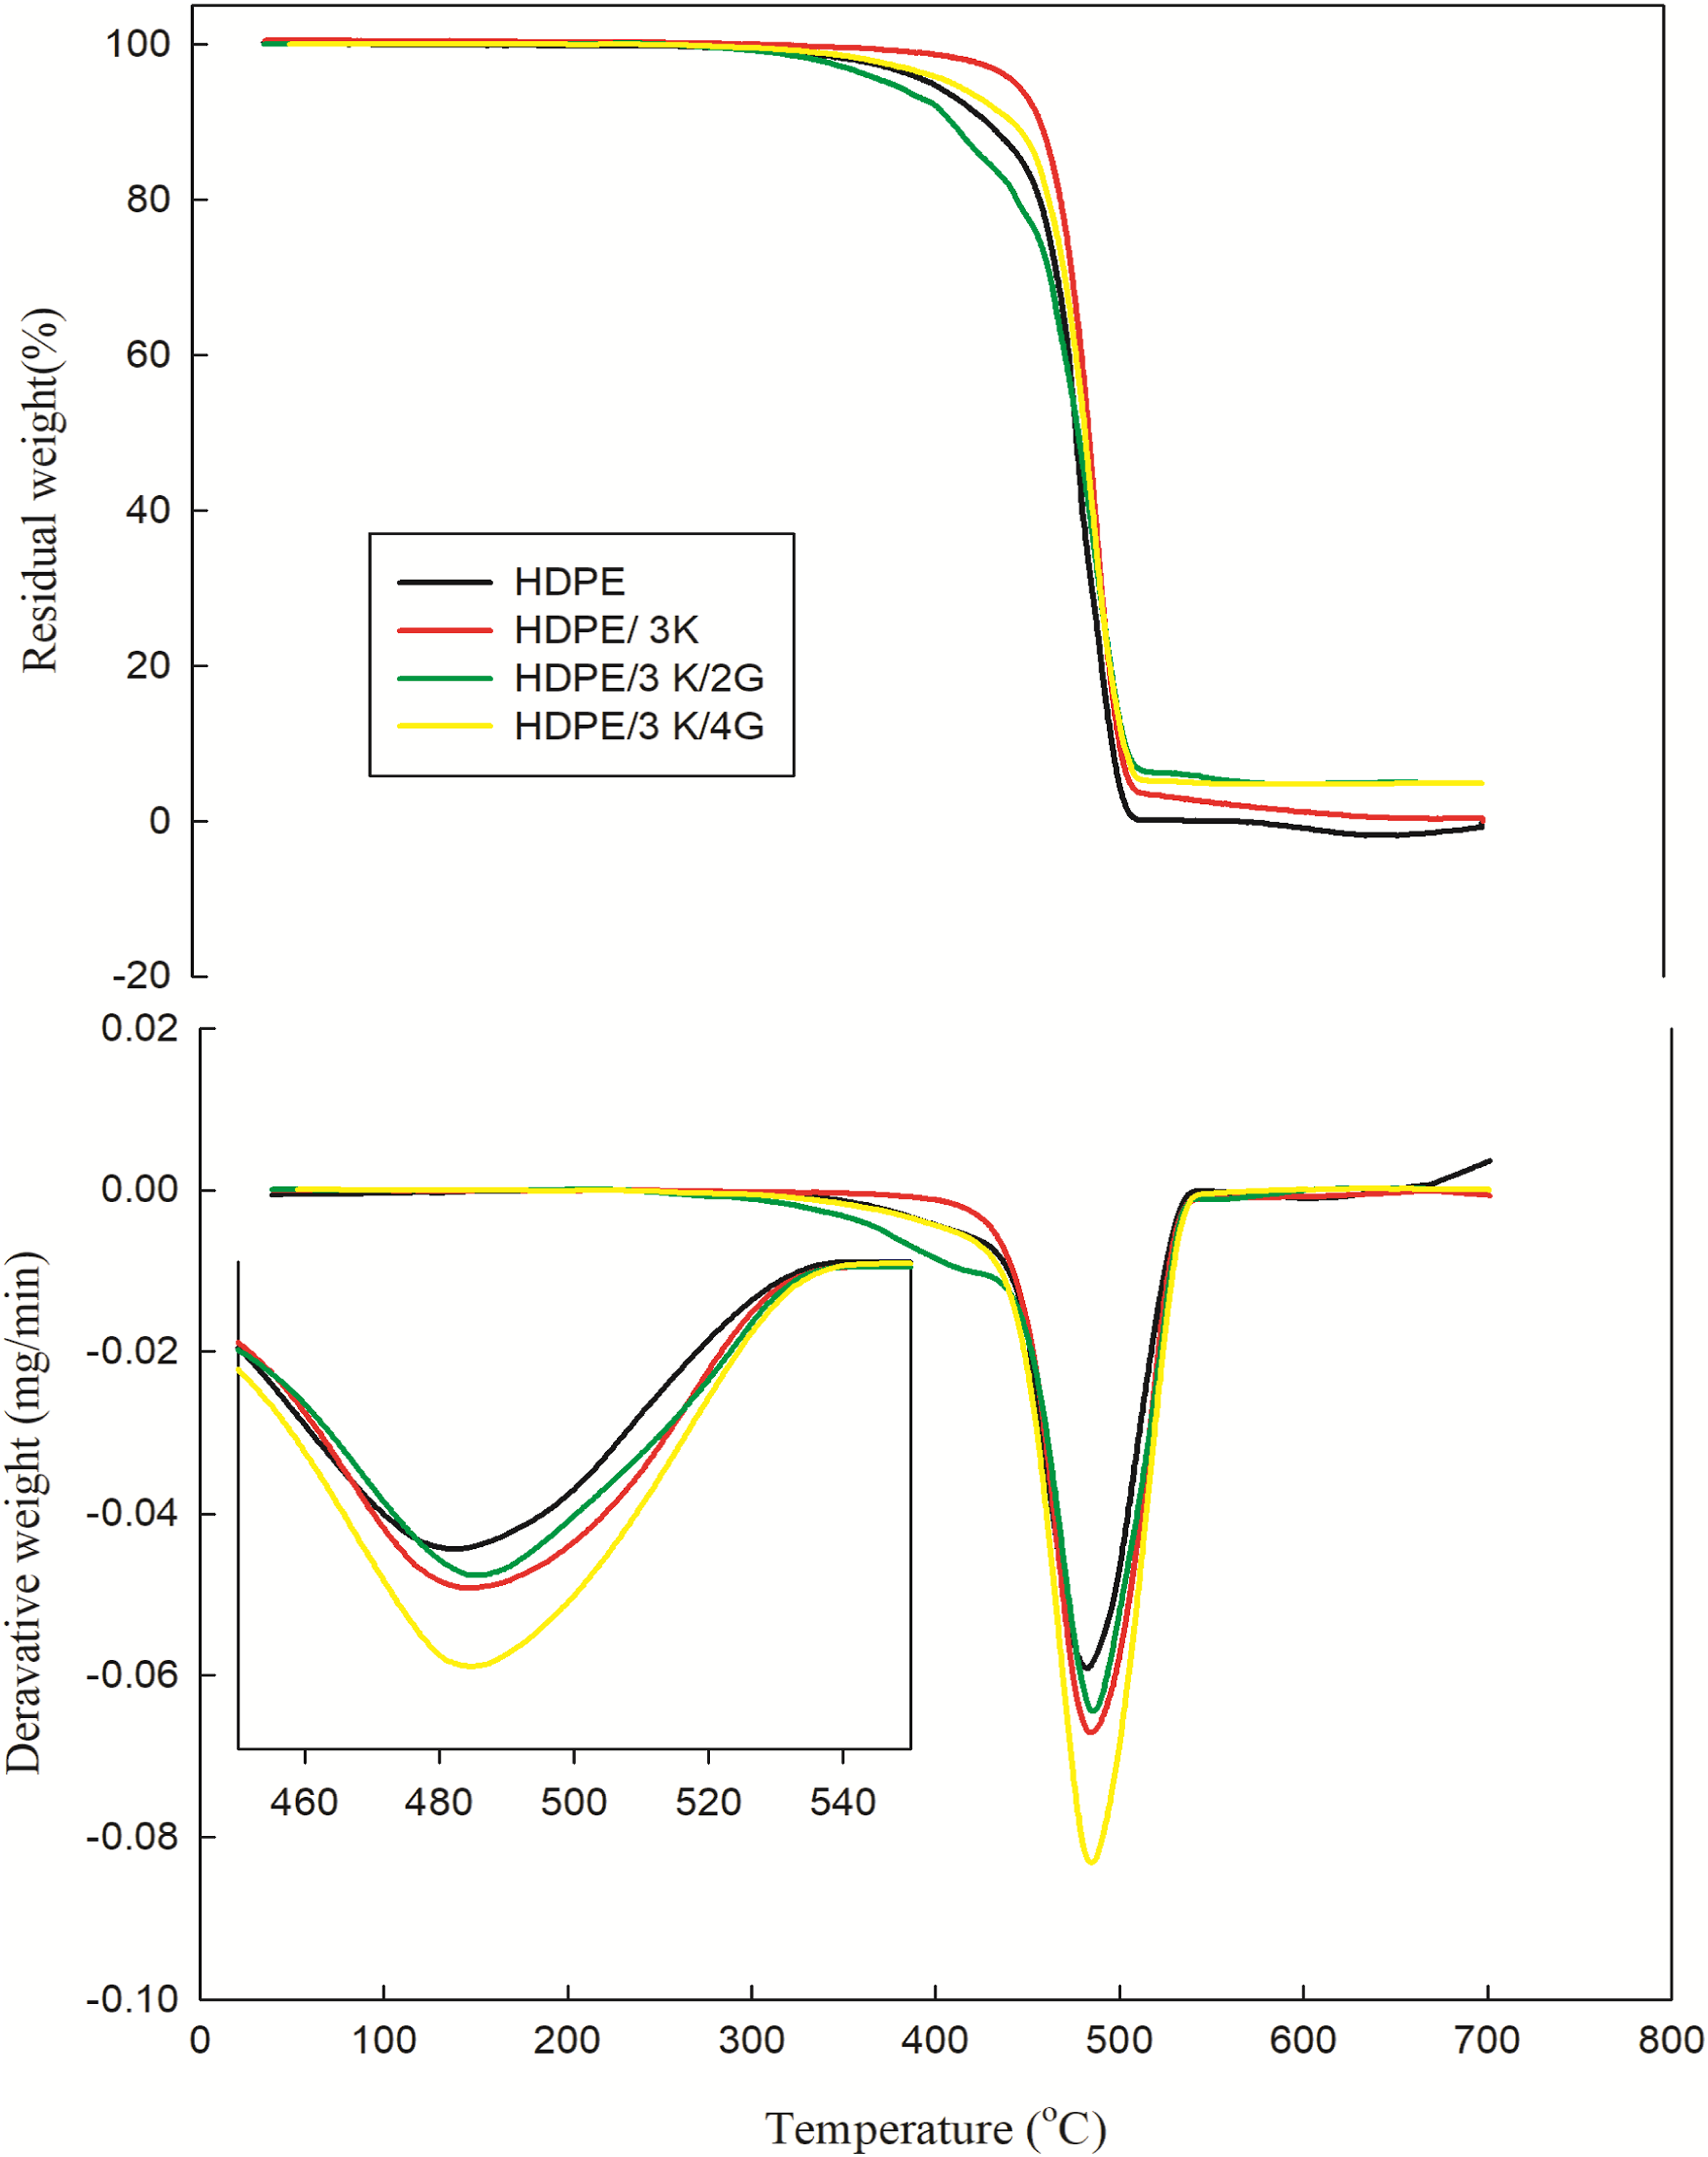
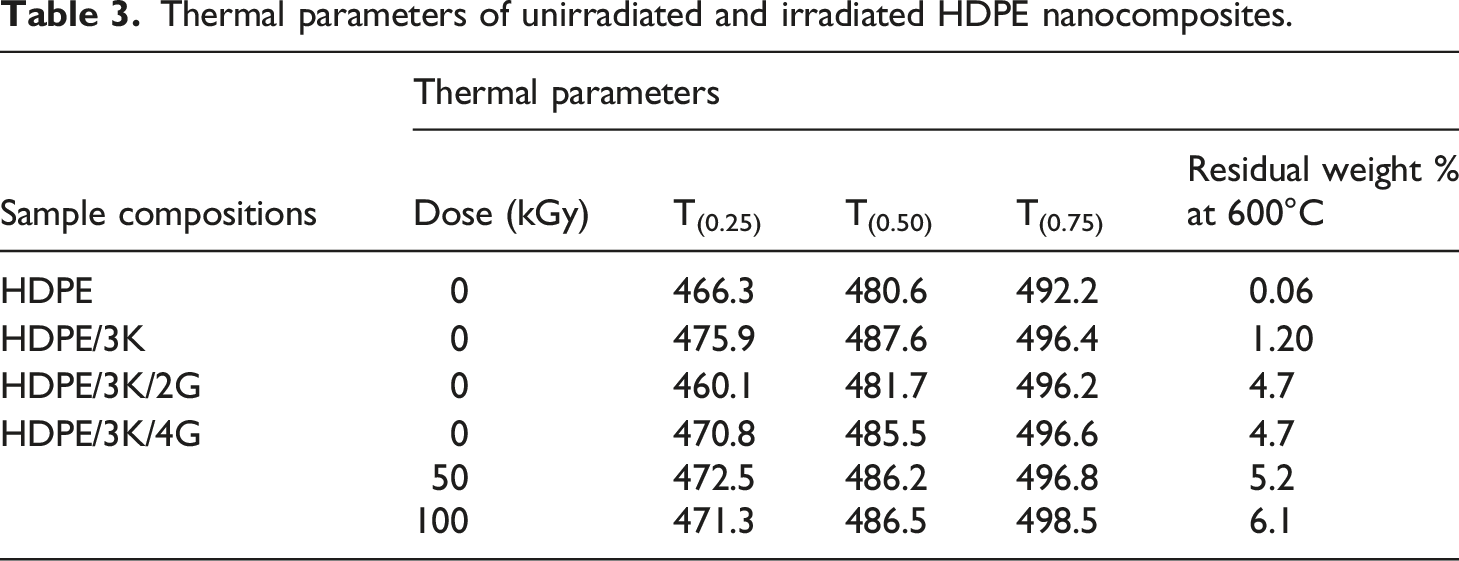
Figure 6 and Table 3 for irradiated nanocomposites indicate an improvement in thermal stability with dosage. The molecular structure of the polymer matrix, which is directly related to its thermal stability, could be utilized to explain the impact of irradiation on thermal stability. The increase in the thermal stability of composite by exposure to ionizing radiation is presumably due to crosslinking reaction which resulted from irradiation.
31
TGA and DTG thermograms of HDPE/3 K/4G exposed to various gamma radiation doses.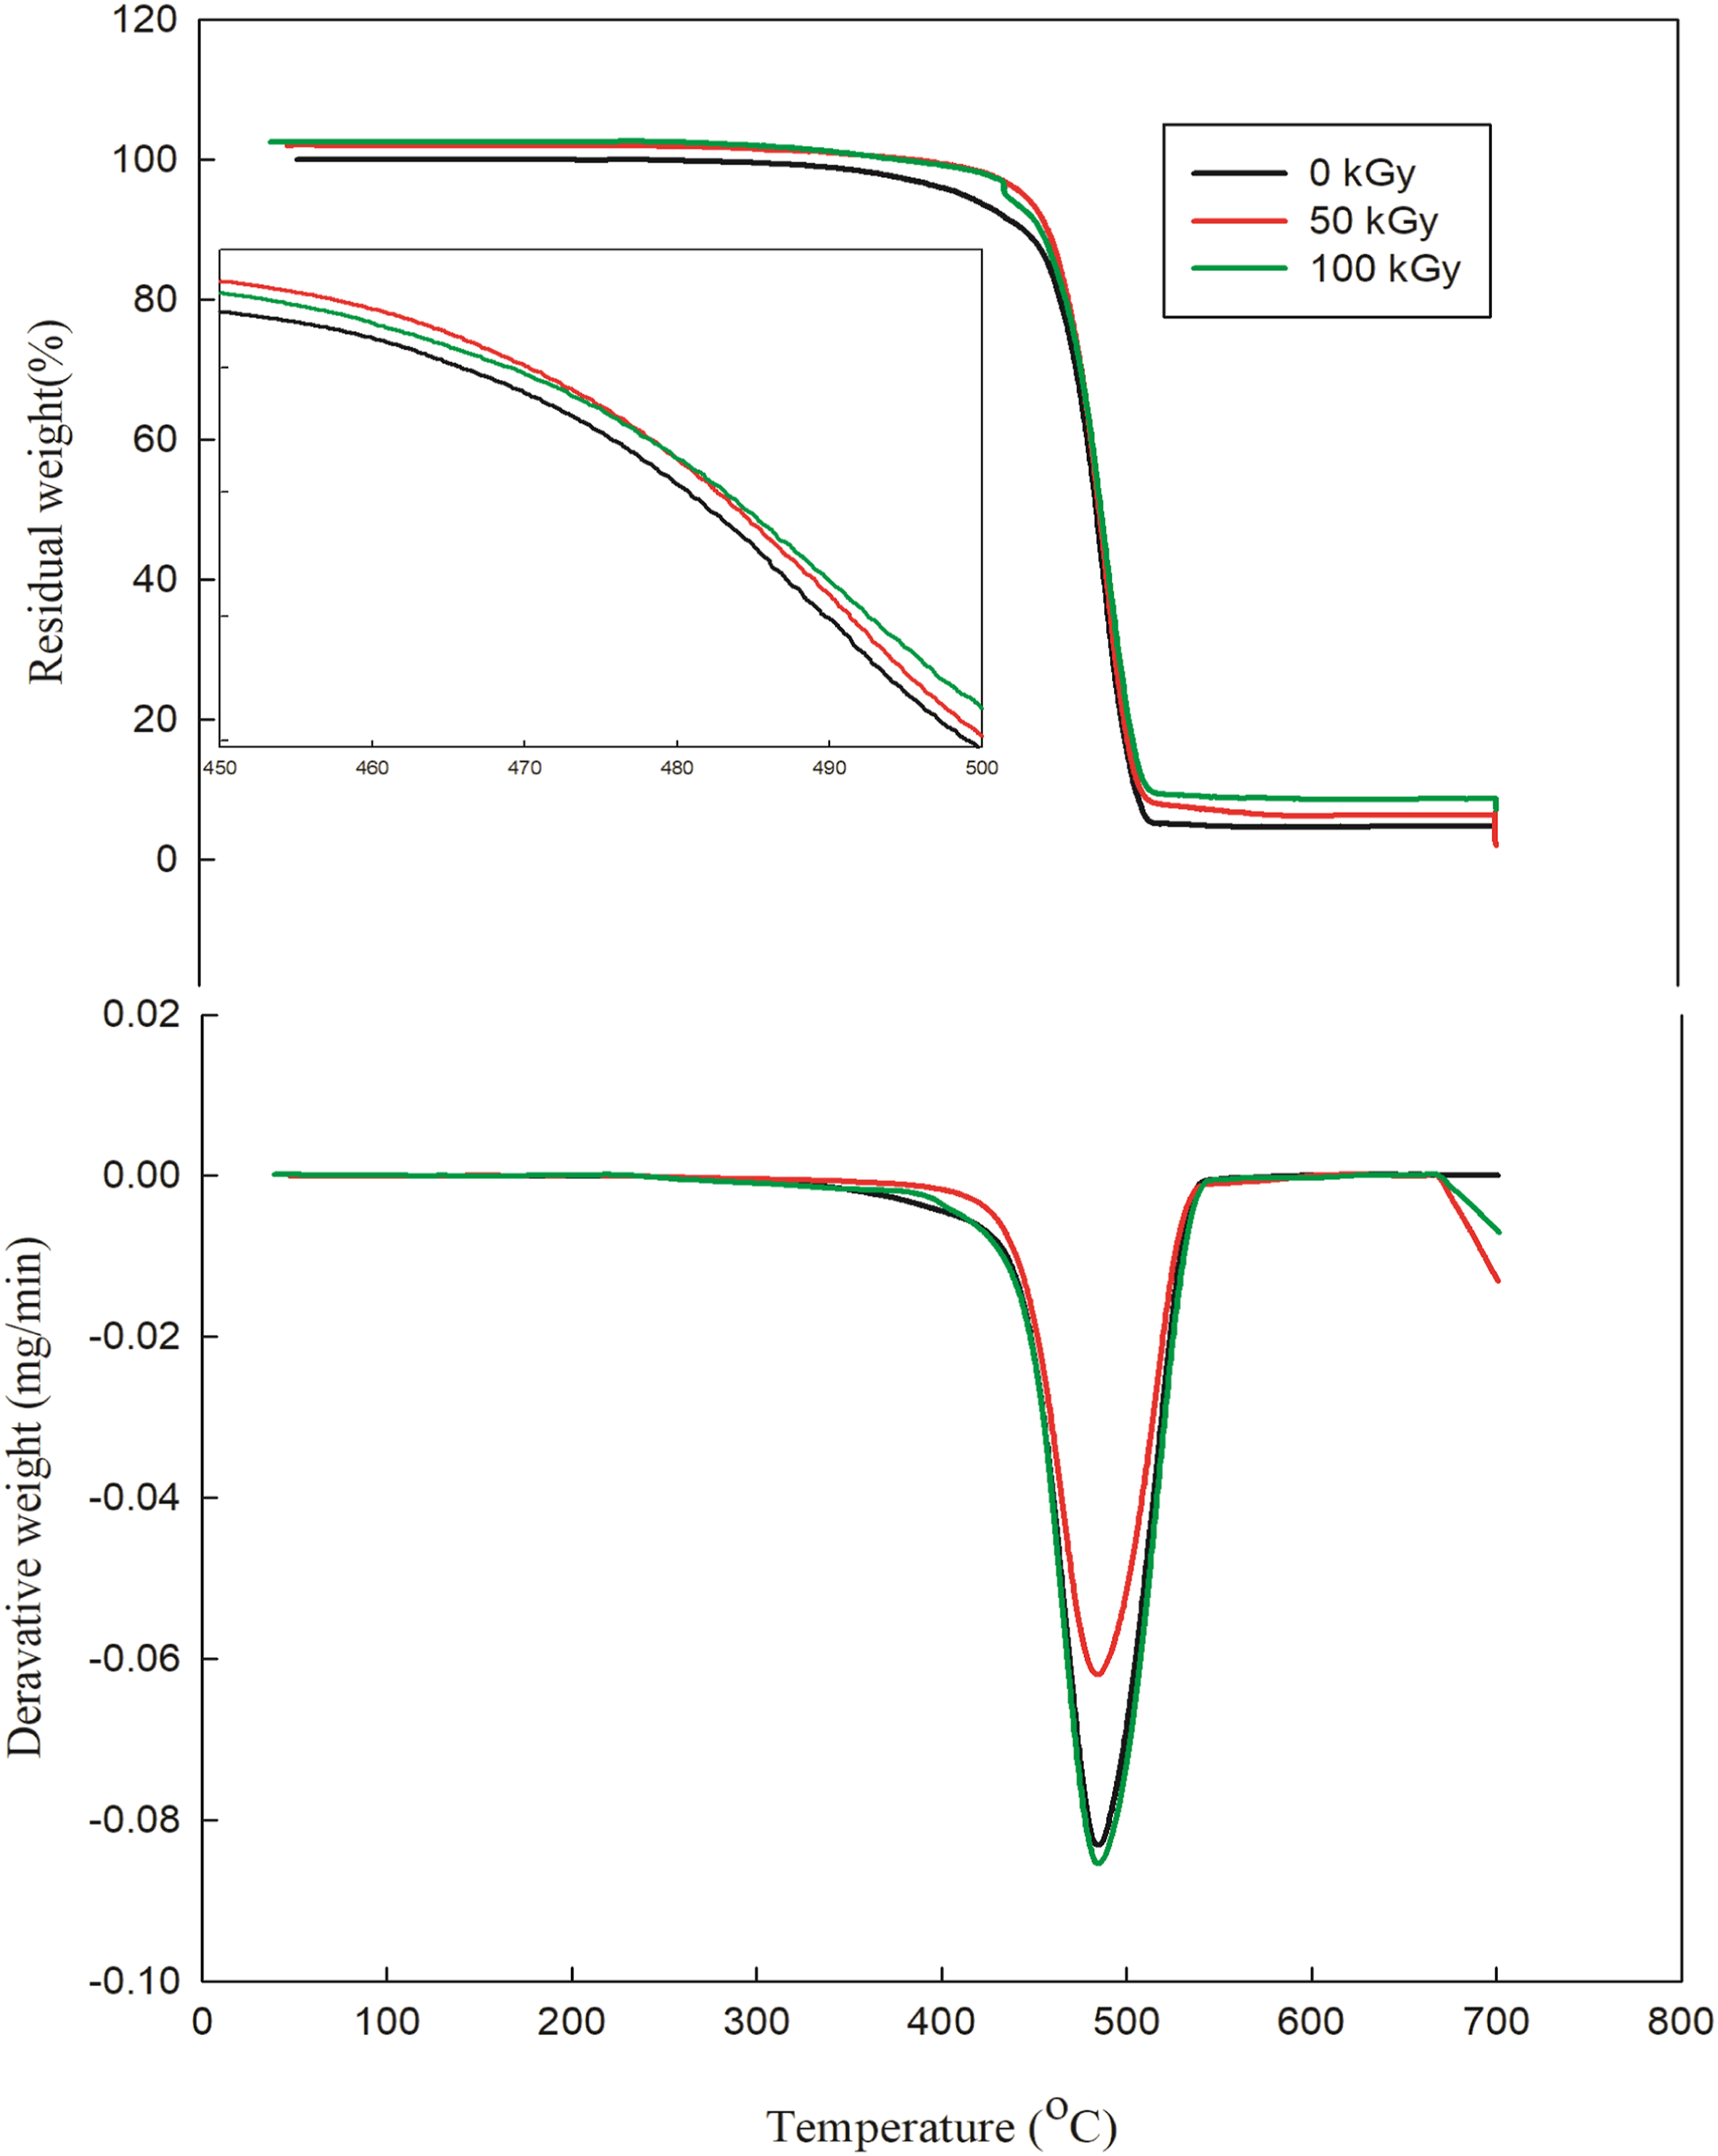
Thermodynamic analysis
Thermodynamic factors of the decomposition method namely activation energy (Ea), ΔS, ΔH, and ΔG are calculated and presented in Figure 7 and Table 4. It is known that entropy provides information about the degree of order of the system, enthalpy provides information about the total thermal motion, and free energy provides information about the stability of the system. Horowitz-Metzger plot of HDPE nanocomposites. (a) Unirradiated HDPE/3K with various concentration of graphite. (b) HDPE/3K/4G exposed to different gamma radiation doses. Thermodynamic parameters for unirradiated and irradiated HDPE nanocomposites.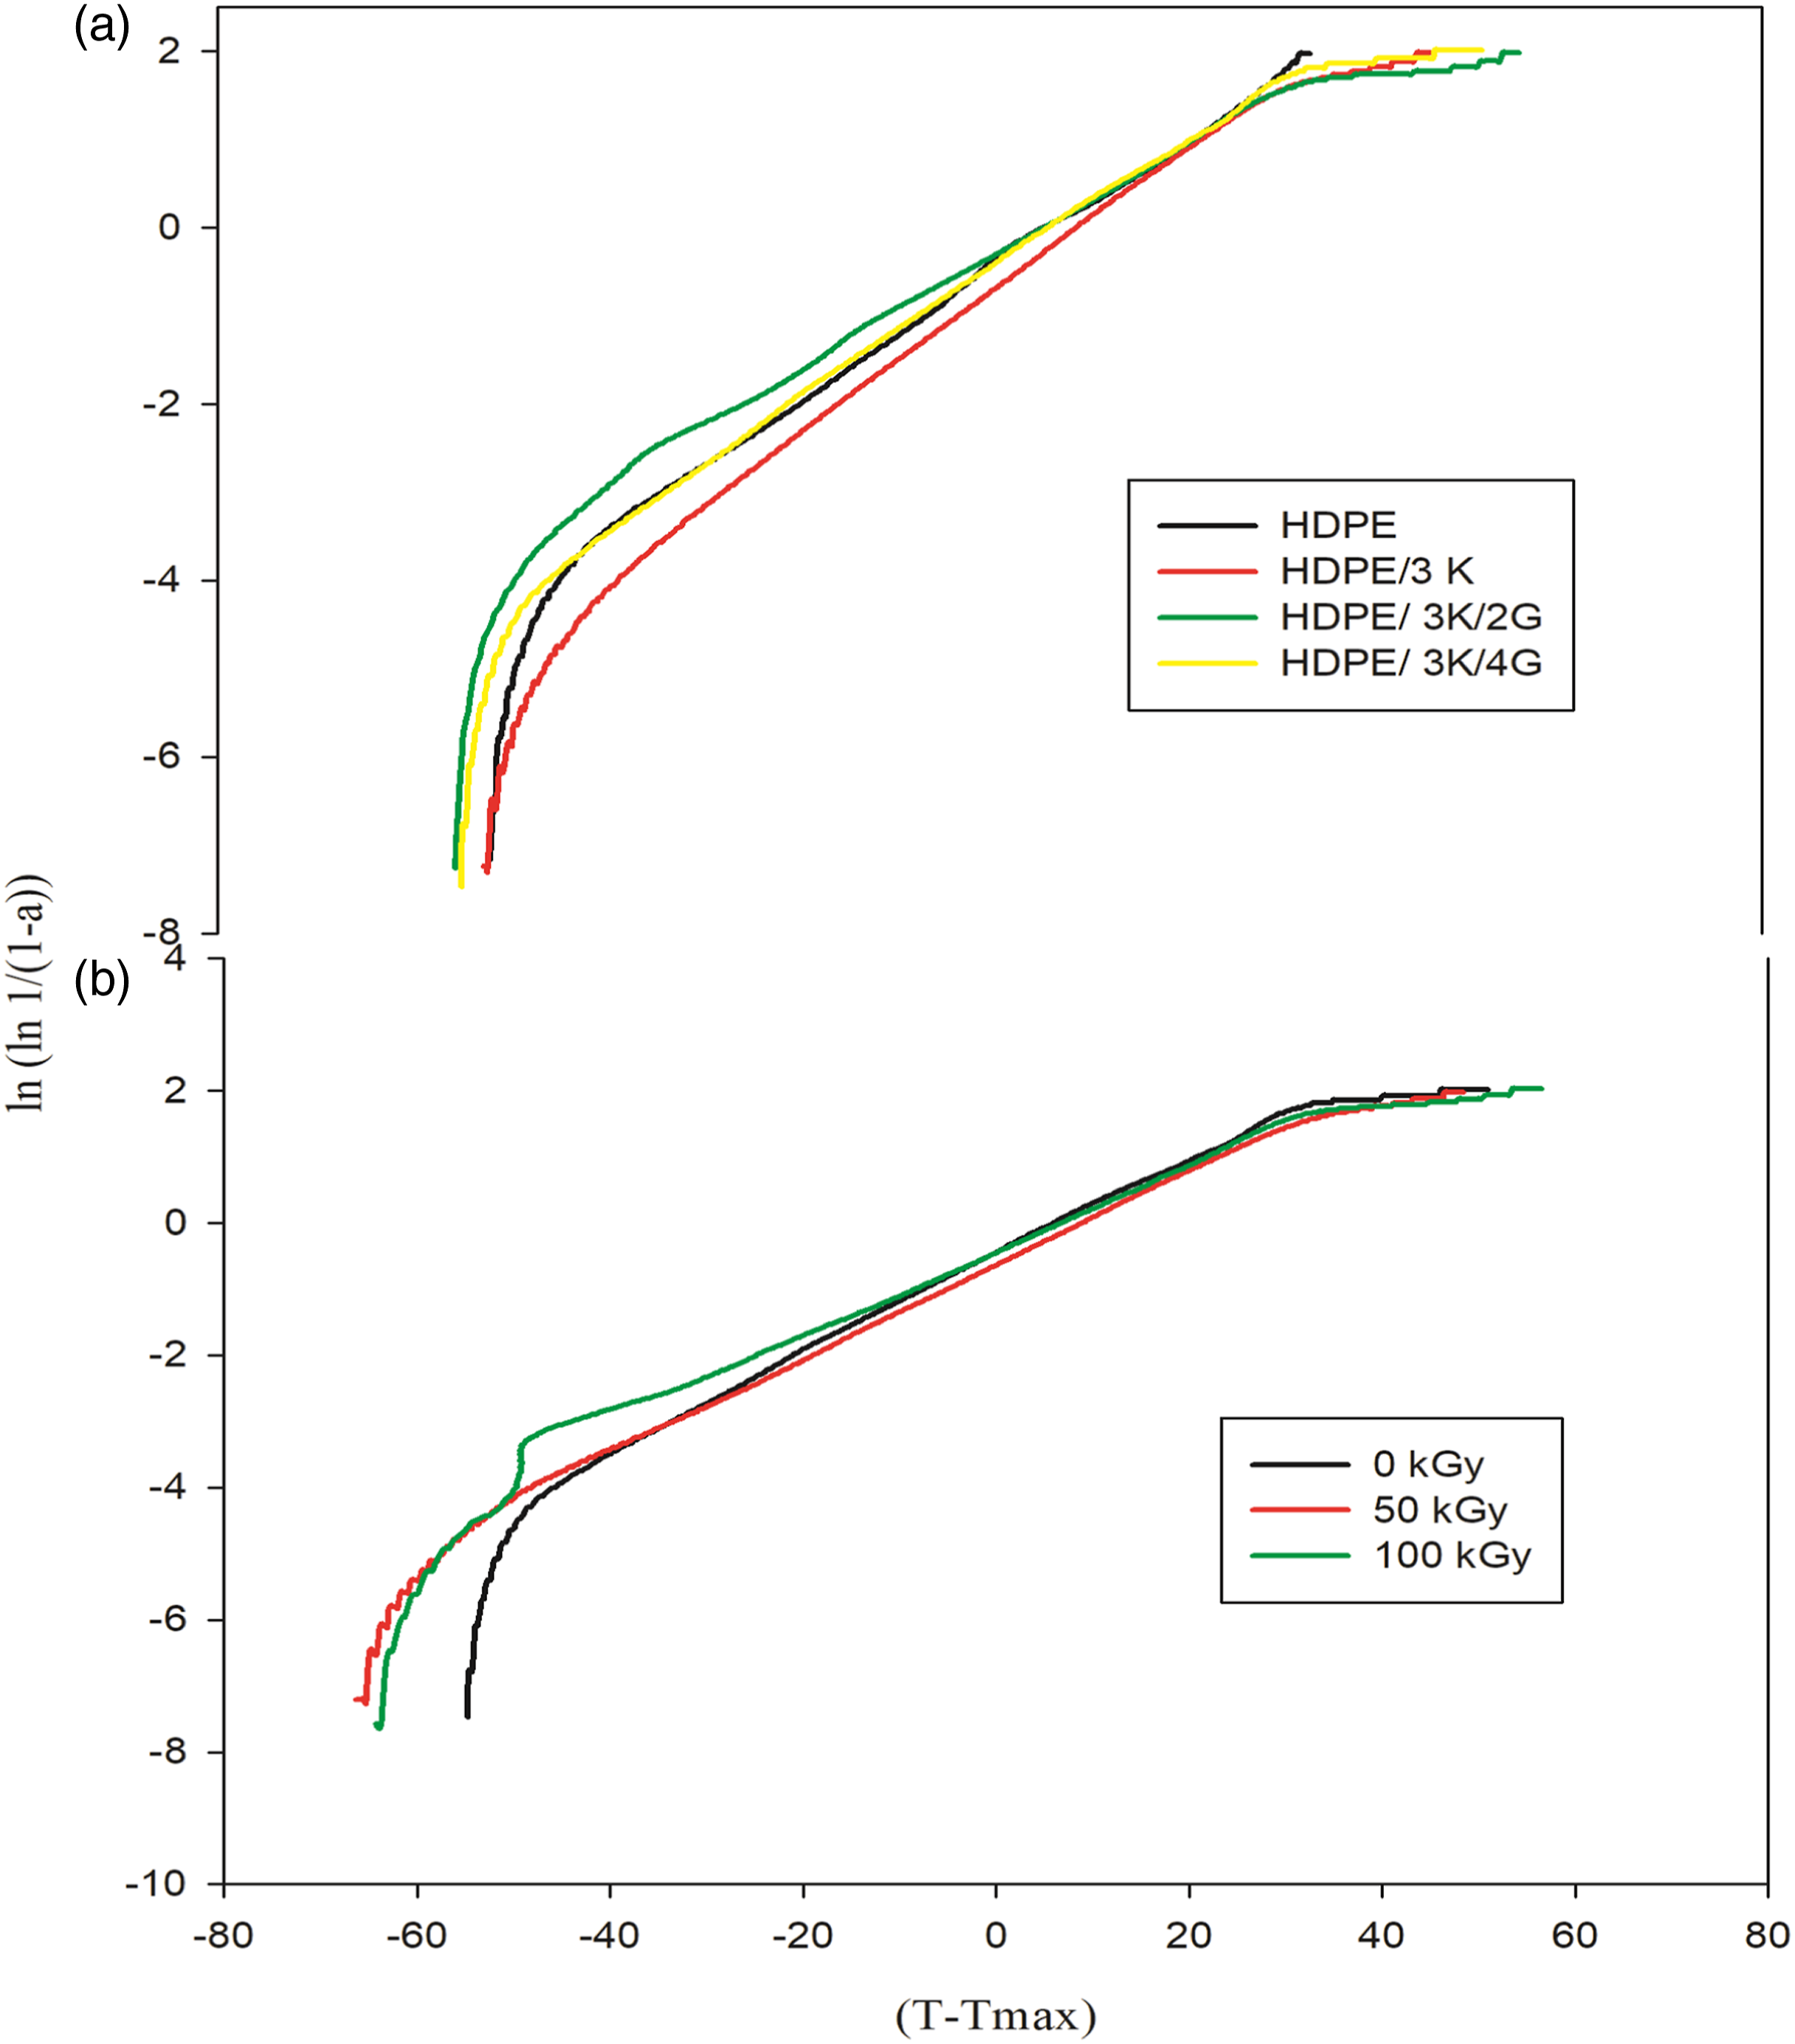
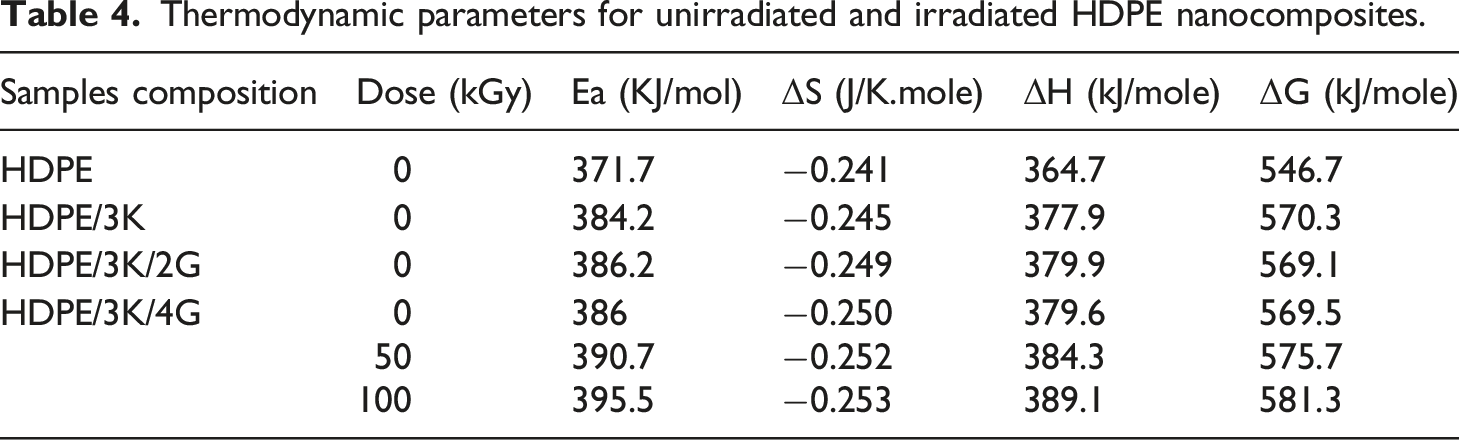
For unirradiated nanocomposites, it is showen that the values of various parameters Ea, ΔH, and ΔG of HDPE nanocomposites increased with the presence of kaolin and graphite. Those data tell that the thermal motion and thermal stability of the HDPE increased with the presence of kaolin and graphite in the HDPE matrix because of the better interaction between the HDPE and nanoparticles, which reduces the thermal degradation process of the nanocomposites. However, values of ΔS display decrease with the presence of nanoparticles in the HDPE matrix as a result of the order development of the HDPE nanocomposite system. The last results coincide with the TGA data, which was discussed before.
For irradiated nanocomposites, it is displayed that the various thermodynamic factors Ea, ΔH, and ΔG were increased when subjected to irradiation, whereas ΔS was decreased compared with unirradiated nanocomposite suggesting increased thermal stability, thermal motion, and order as a result of the positive effect of irradiation on nanocomposites texture.
Differential scanning calorimetry
Differential scanning calorimetry analysis is generally one of the most useful methods for identifying melting temperatures for polymers. The HDPE nanocomposite samples with the presence of kaolin and graphite were examined by DSC analysis under non-isothermal conditions. For unirradiated nanocomposites which are represented in Figure 8, the Tm of HDPE shifted to higher values with the incorporation of nanoparticles (kaolin and graphite). These increments in Tm resulted from the nucleating effect of nanoparticles and the fast crystallization of the HDPE matrix. Furthermore, the presence of nanoparticles resulted in reinforces the interaction between molecular chains in the HDPE matrix, which greatly restricts chains’ movement, dispersion, and Tm shifts to a higher temperature.32–34 DSC analysis of unirradiated HDPE blended with 3 phr kaolin and various concentration of graphite.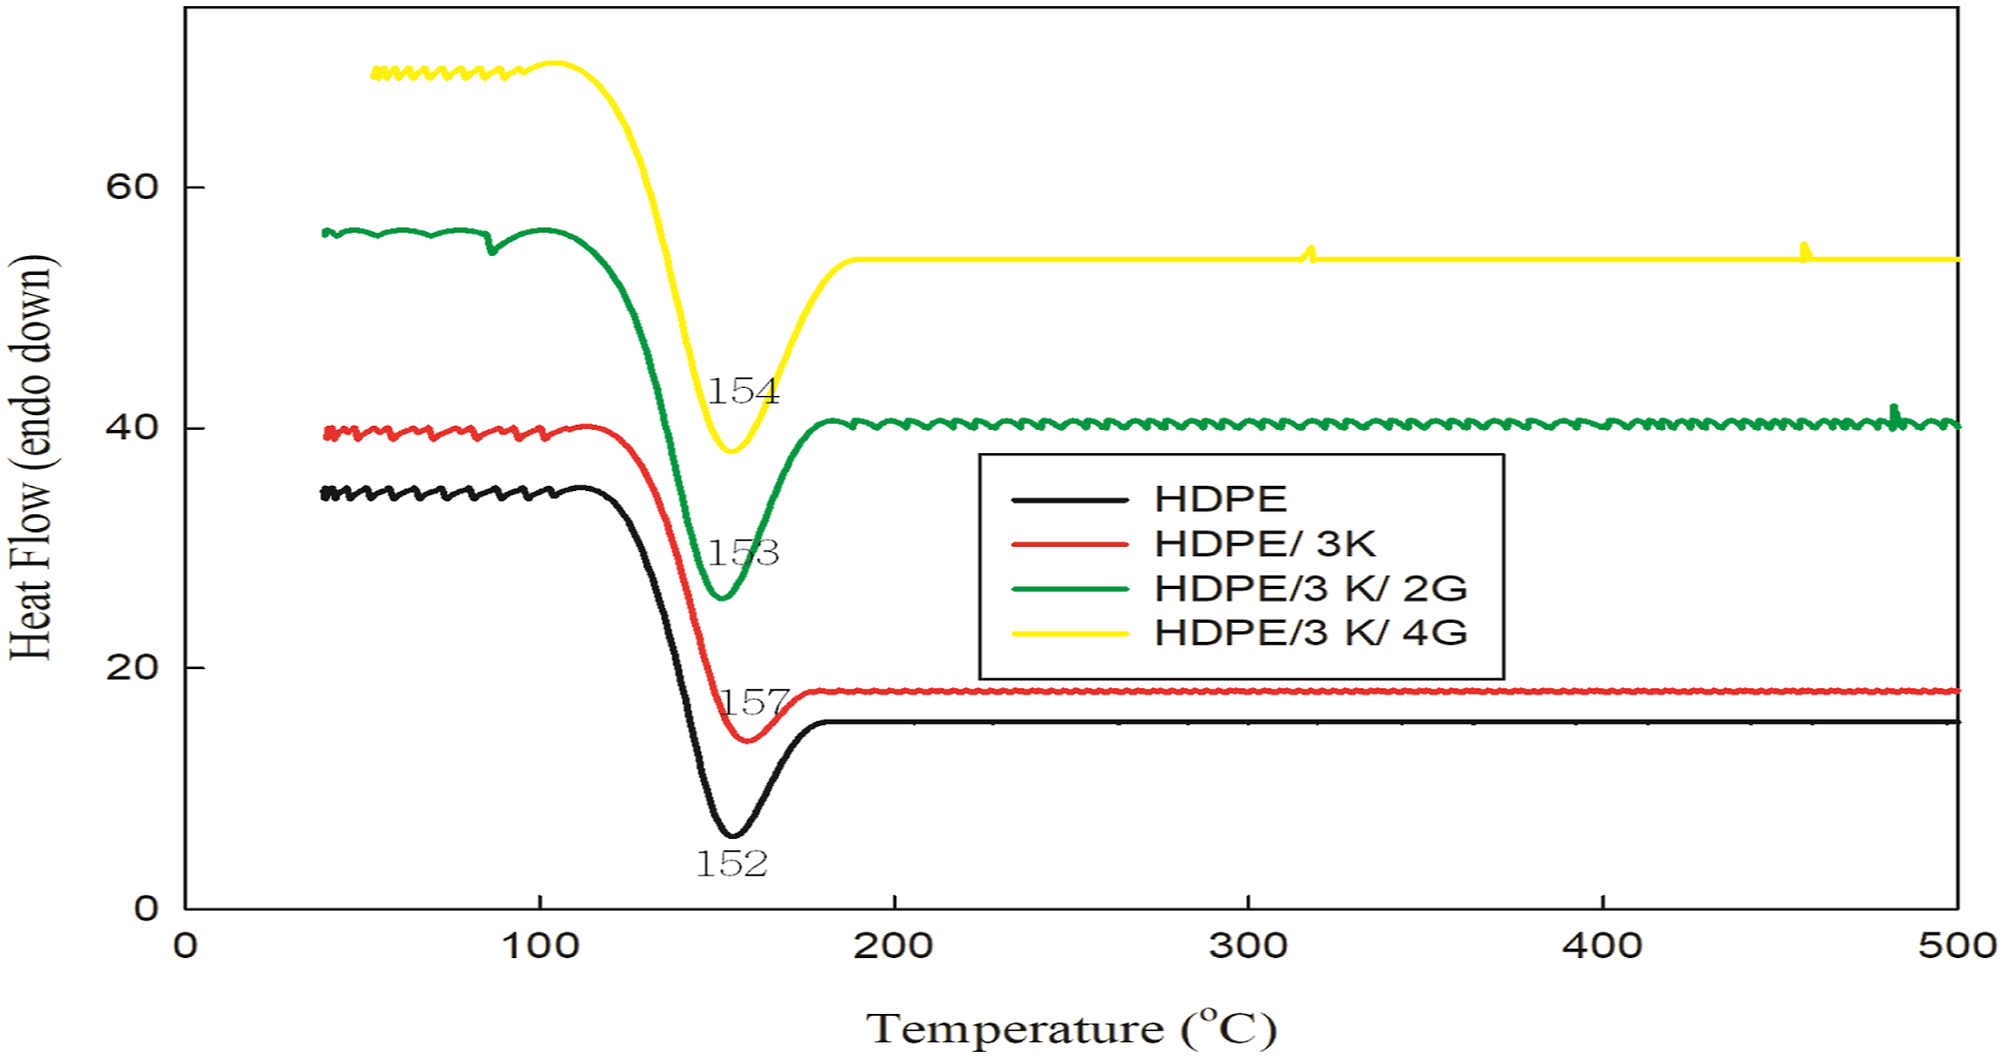
For irradiated nanocomposites, Figure 9, Tm shifted to higher values with increased gamma radiation doses up to 100 kGy attributed to radiation-induced crosslinking and/or chain scission near the crystalline lamellae boundaries due to PE free radical radiation oxidation chain reactions.
35
On the other hand, as the dose of radiation increased, the melting temperature increase. this might be ascribed to the crosslinking thickness brought about by irradiation. Wherein the induced vulcanization caused by irradiation results in an increase in the melting temperature because the crystallization process moves more quickly and produces smaller crystals.
5
DSC analysis of HDPE/3K/4G exposed to various gamma radiation doses.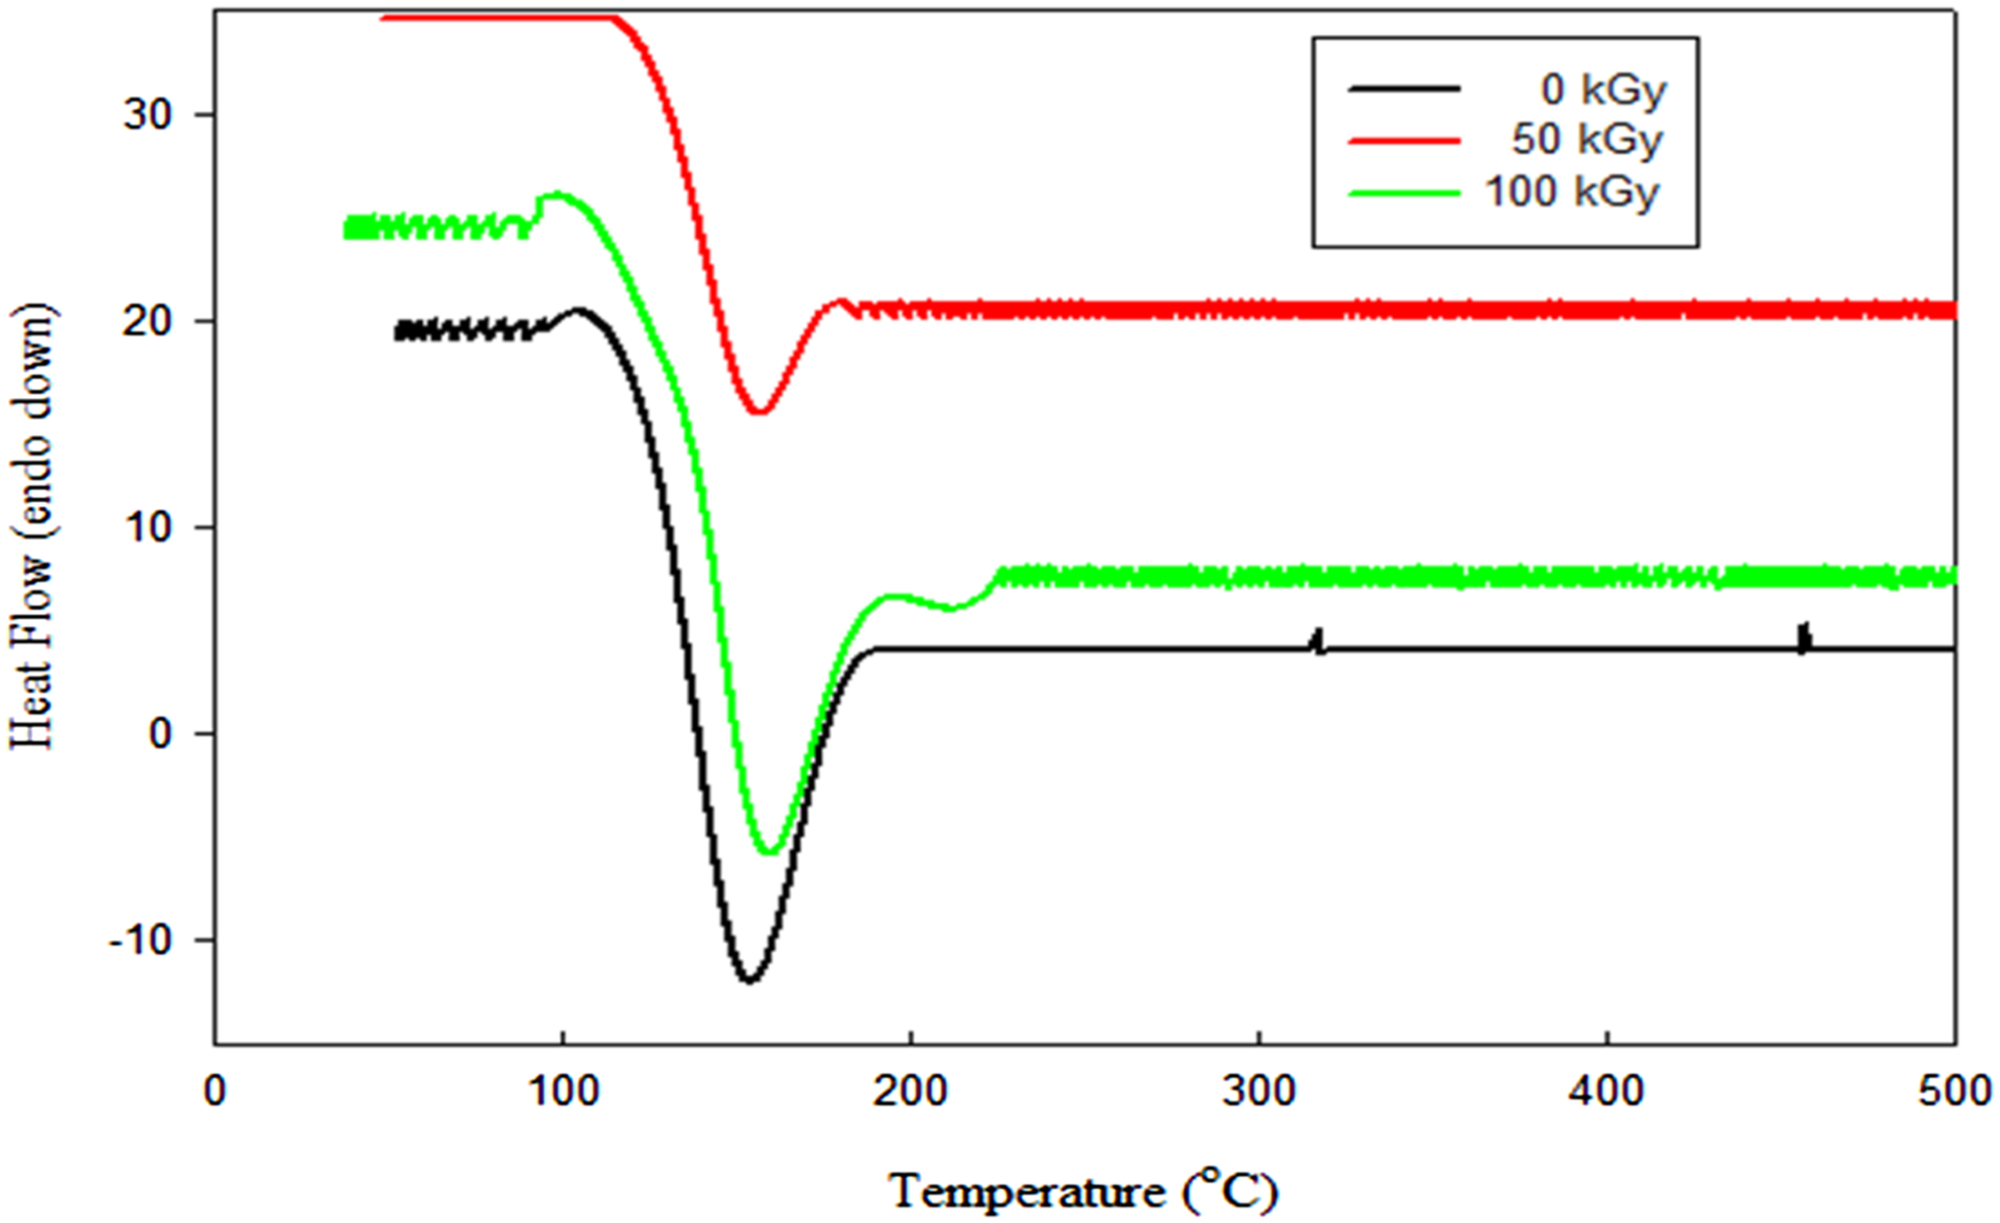
Electrical conductivity
In general, the extent, size, and type of reinforced fillers, as well as the polymer’s shape and crystallinity, determine the electrical conductivity of nanocomposites. Figure 10 shows the electrical conductivity of HDPE/kaolin/graphite nanocomposites. The electrical conductivity of these nanocomposites was often directly proportionated by the interference of both kaolin and graphite nanoparticles into the HDPE matrix. The electrical insulating properties of HDPE had been significantly changed in all tested samples by the creation of conductive networks with kaolin and graphite. Since the electrical impedance of the nanocomposite samples was lower than HDPE itself, there was improved dispersion of kaolin and graphite nanoparticles in HDPE. To make sense of the obtained results, it should be noted that the conductive nanoparticles must be joined to form a continuous percolated channel inside the nanoparticle-loaded nanocomposites to generate a conductive pattern.
26
Electrical conductivity of HDPE nanocomposite exposed to various gamma radiation doses.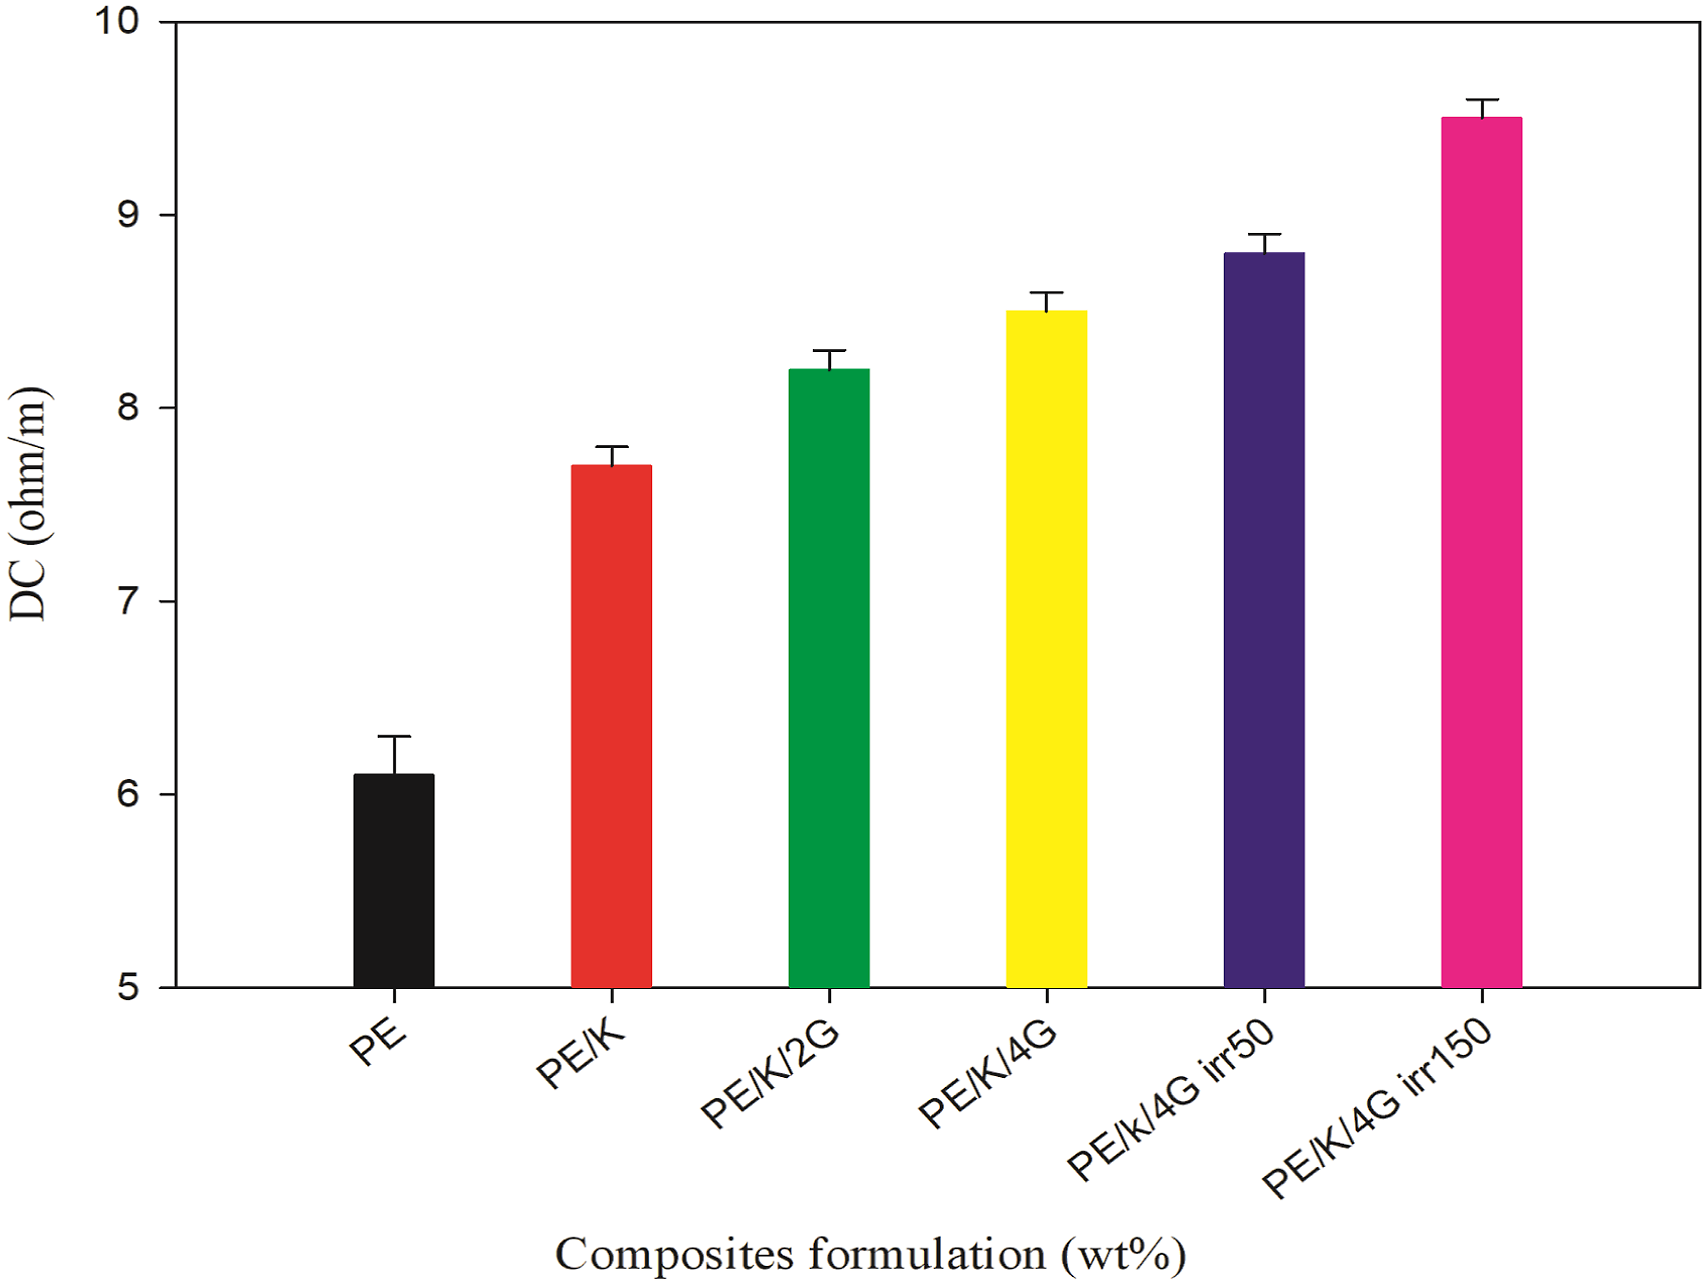
Mechanical properties
Tensile strength
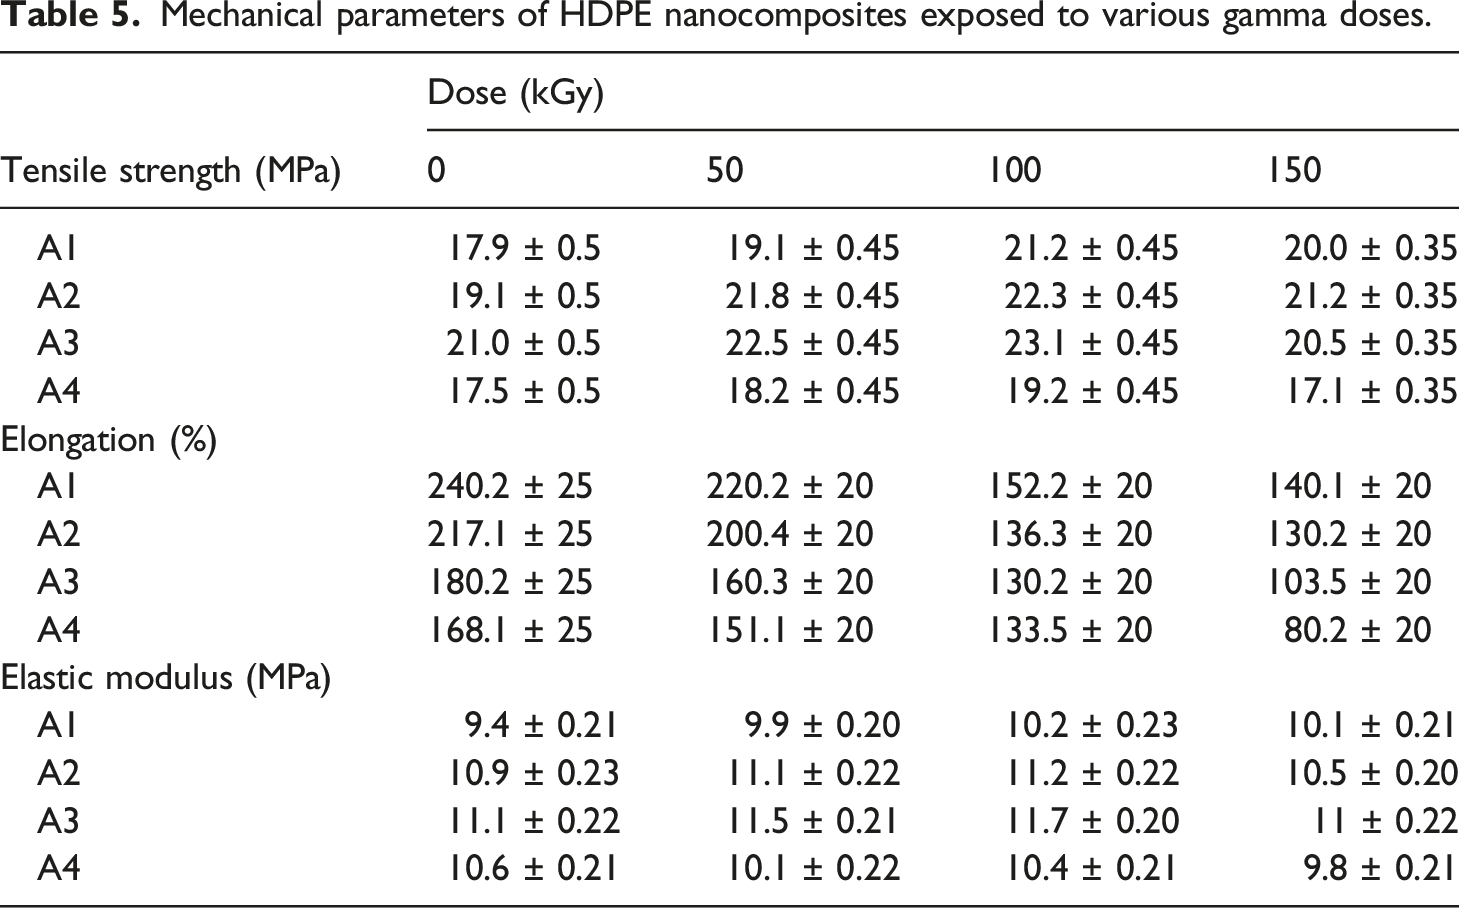
Mechanical parameters of HDPE nanocomposites exposed to various gamma doses.
From the literature, found that using graphite of less than 10% leads to a decrease in tensile strength, due to the agglomeration of graphite nano-sheets, nano-size to micro-size process and weak interfacial connection between graphite nano-sheets and polymer significantly hindered the mobility of polymer chains, preventing them from effectively dissipating externally supplied mechanical energy.37–39 The aforementioned statistics show that utilizing kaolin prevented the decrease in tensile strength caused by using graphite lower than 10%, as indicated in the literature.
The tensile strength of irradiated samples increases linearly with absorbed doses up to 100 kGy, then decreases with increased doses up to 150 kGy. Improvement in TS is attributed to the chain scission and cross-linking occurring simultaneously. The limited movement of the molecular chain in irradiated nanocomposites accounts for its high tensile strength due to its more closed network and as a result, irradiation increased the tensile strength. 6 Furthermore, the TS value of irradiated HDPE/3K/2G at 50kGy and 100 kGy increased by nearly 26% and 29%, respectively, compared to pristine un-irradiated HDPE
Tensile strength decreases with increased irradiation doses up to 150 kGy attributed to irradiation creates free radicals that can either combine to form crosslinking or accelerate the chain scission of HDPE. This type of reaction can also result in the production of unsaturated polymer chain structures in the matrix, which would finally deteriorate the mechanical properties of the prepared nanocomposites.
Elongation at break
The elongation at break (E%) of unirradiated and irradiated HDPE and its nanocomposites contain nano kaolin powder and graphite, shown in Table 5. The values of the unirradiated nanocomposites were consistent, whereas the values of the irradiated nanocomposites decreased slightly with increasing doses. This observation can be argued based on the fact that radiation may lead to a more rigid polymeric matrix because radiation enters crosslinking and that makes macromolecular chains unable to stretch upon deformation, or because as the radiation dose increases, more crosslinking is produced in the sample matrix, which prevents structural reorganization during drawing. Hence, when three-dimensional networks become more predominant, internal chain mobility and elongation are reduced. 35 Where elongation at break (%) of pristine un-irradiated HDPE/3 K/4 G is decreased by nearly 37% of irradiated HDPE/3 K/4 G at 50 kGy, 44% of the same irradiated nanocomposites at 100 kGy, and 65% of it when irradiated at 150 kGy.
Kaolin incorporation causes a reduction in elongation, which is followed by a further reduction when graphite is added. The polyethylene molecules are strongly restrained by fillers at the concentrations utilized, which can be assumed as structural parts incorporated in the polymer matrix.
Elastic modulus
According to Table 5 results, the elastic modulus increased for unirradiated nanocomposites containing both kaolin and graphite (3K/2G) before shifting to a lower value, which was attributable to kaolin’s improved stiffness. Moreover, the interactions between the kaolin, graphite, and PE were excellent due to the presence of kaolin and graphite. Due to these interactions, more PE chains become entangled within the nanocomposite and can exchange external loads with the added fillers, improving the mechanical characteristics of HDPE with the addition of 3K/2G. Where the elastic modulus value of HDPE/K/2 G increased by 18% compared to pristine HDPE.
For irradiated nanocomposites, the Elastic modulus increases with the increase in gamma doses up to 100 kGy. Where the elastic modulus value of irradiated HDPE/3 K/2 G at 100 kGy increased by 25% compared to un-irradiated pristine HDPE, due to as dose increase, the crosslinking density of the polymer matrix increase yields more tightly bound material. As a result, the sample’s ability to respond to a load or stress is hindered by the chain’s limited mobility.
SEM of nanocomposite
Figure 11 shows HDPE loaded with both kaolin and graphite at two different ratios. The polyethylene nanocomposite loaded with either 3% kaolin, Figure 11(a), or 3% kaolin and 2% graphite, Figure 11(b), showed good uniformity and spread of the fillers within the polyethylene. Whereas, the polyethylene/3% kaolin nanocomposite loaded with 4% graphite showed clear agglomeration of graphite nanoparticles within the polymer texture as displayed in Figure 11(c). The irradiation of HDPE/3% K/2% G showed a very cohesive and symmetrical texture and did not contain any agglomerations within the polymer matrix, Figure 11(d). SEM of (a) HDPE/3K, (b) HDPE/3K/2G, (c) HDPE/3K/4G and (d) irradiated HDPE/3K/2G at 100 kGy.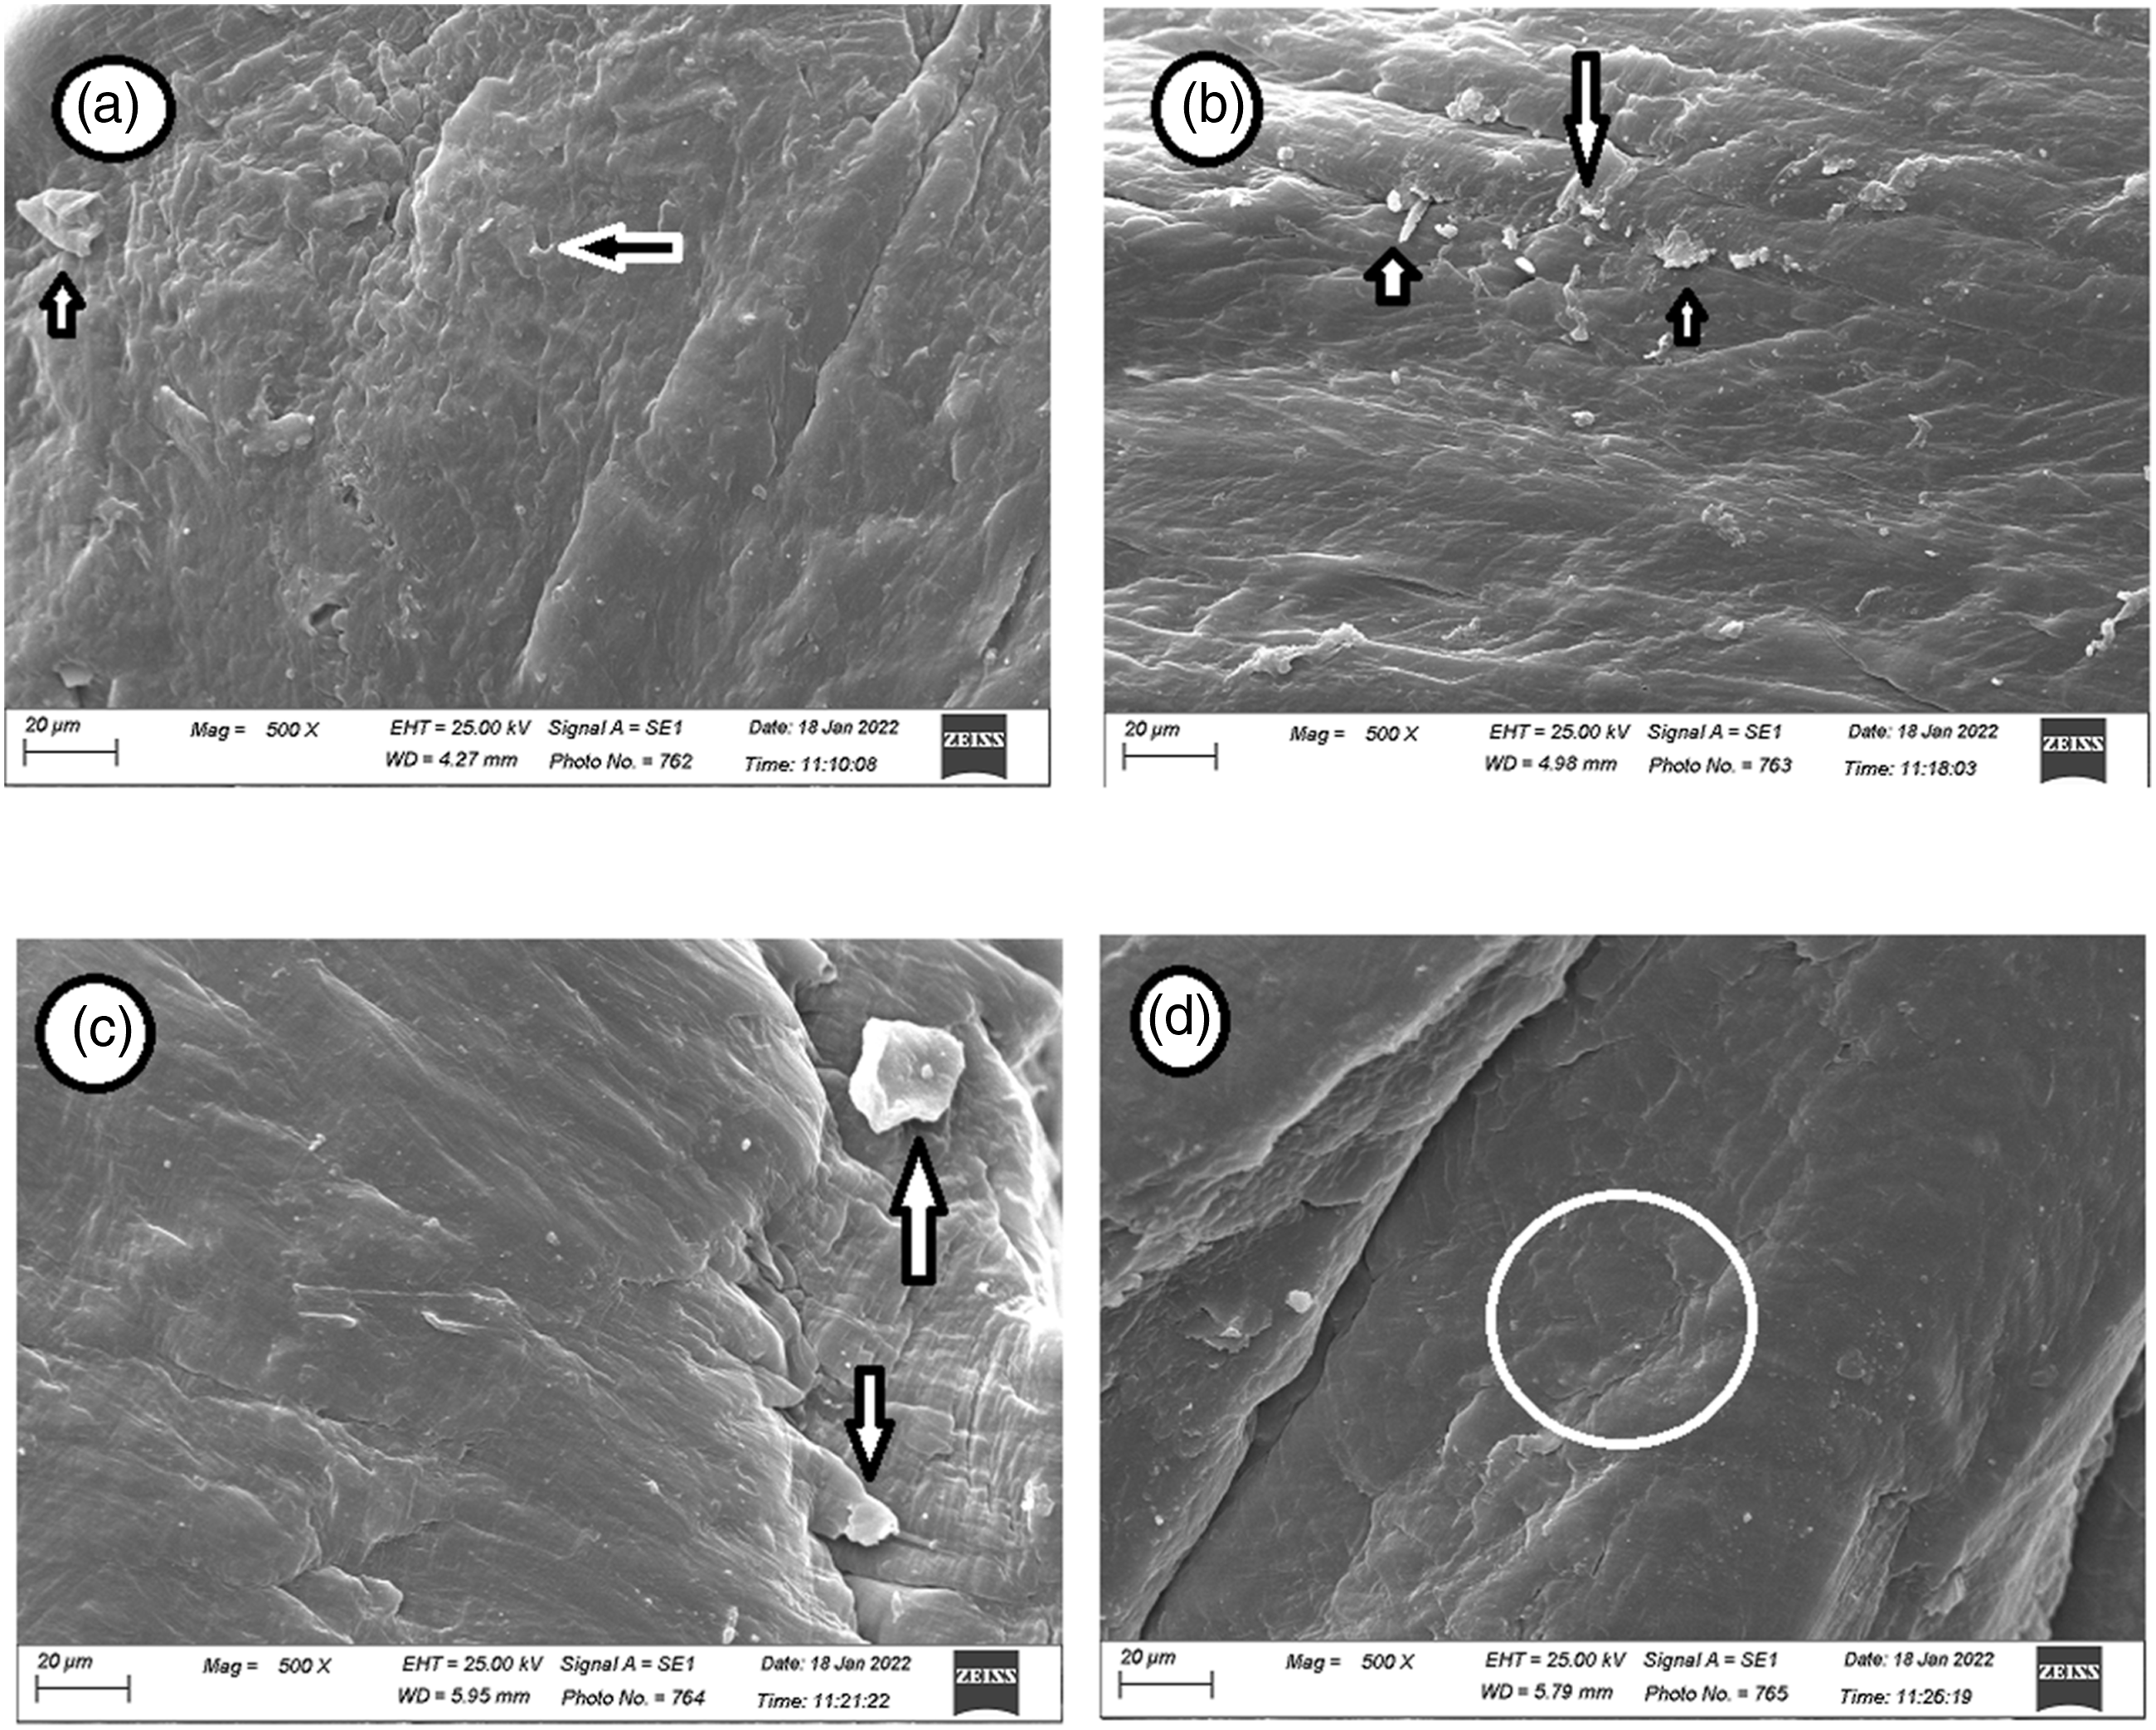
Conclusions
Modifications in HDPE polymer samples induced by the addition of nanoparticles of kaolin at a fixed percent, different amounts of graphite, and gamma irradiation were investigated using XRD, TGA, DSC, SEM, and mechanical analysis. TEM was used to elucidate the nanostructure of both kaolin and graphite particles. XRD analysis showed significant data about the structural variations taking place when blended HDPE with a fixed amount of kaolin and various concentration of graphite and then exposed to various gamma irradiation doses. The HDPE matrix parameters such as grain sizes (L) and dislocation density (δ), shifted to higher values with the presence of kaolin and graphite, whereas the other factors like distortion parameter (g), inter-chain distance (r), and inter-planar spacing (d) lowered. Moreover, various parameters of the irradiated nanocomposites decreased via increasing gamma radiation doses.
The presence of a fixed amount of kaolin, graphite percent and exposure to various gamma doses lead to changes in the morphology of HDPE. Thermal analysis of the prepared nanocomposites enhanced with the presence of kaolin and graphite. Furthermore, the mechanical properties of HDPE nanocomposites are significantly improved by the addition of nanoparticles and irradiation up to 100 kGy. The electrical conductive properties of HDPE had been significantly changed in all tested samples by the creation of conductive networks by kaolin and graphite. The overall findings display that kaolin and graphite nanoparticles have excellent potential as polymer fillers for a range of engineering and electrical applications.
Footnotes
Declaration of conflicting interests
The author(s) declared no potential conflicts of interest with respect to the research, authorship, and/or publication of this article.
Funding
The author(s) received no financial support for the research, authorship, and/or publication of this article.