
Abstract
This study investigates the efficiency of recovered brown alumina (RBA) particles filled in epoxy glass-fiber composites. The RBA particles were obtained from grinding wheel rejects with the help of the mechanical crushing process. Recovered particles finer than 120 grit were used as particulate filler for composite preparation. Composites were processed through a hand-layup technique by varying RBA filler loading percentages (0, 5, 10, 15, and 20 wt.%) in a glass fiber–reinforced epoxy matrix. Physical, mechanical, water absorption, and thermal properties of the composites were tested experimentally. By suitable addition of RBA, it is possible to tailor the shore-D hardness, tensile modulus, flexural strength, flexural modulus, and maximum degradation temperature. The 20%-filled RBA composite shows the maximum flexural strength of 382 MPa, and the shore-D hardness value was 85. The fracture surface shows a failure mechanism dominated by matrix cracking and debonding of fiber/particles from the interface. Hygrothermal testing of the RBA20-filled composite reveals 9% and 4% reduction in tensile and flexural properties. The thermal stability of the glass fiber–reinforced composite improves as the filler percentage increases. Maximum thermal stability of 435°C was observed in 20%-filled RBA polymer composite.
Introduction
The vitrified brown alumina grinding wheel is used in various grinding operations, namely, bench, surface, and tool room grinding, etc. 1 The type of grinding operations determines the size and shape of the grinding wheel. During grinding operation, grinding wheel reject or waste is generated in two ways, either from a used portion or unused portion of the grinding wheel. The used portion is called as “muck,” which consists of cutting fluid, abrasive grain, and swarf materials. 2 The reprocessing of muck requires more energy and time. The unused portion of the grinding wheel is called a stub portion. It consists of fresh grains and bonds. Certainly, recovering and reusing grains from the stub portion is highly possible.
The authors previously worked on the grain recovery by the acid-leaching process. 3 This process, however, leads to the generation of additional hazardous chemical waste. Disposal of this chemical waste is harming the human and living environment. An alternative approach for recovering abrasive particles from the unused portion of the grinding wheel without generating any additional chemical wastes has been reported. Particularly, mechanical crushing 4 is an optimal and efficient one for recovering abrasives from the spent grinding wheels. During the crushing process, a range of grain sizes are generated, of up to 120 grit size; the grains are used in various abrasive applications like a resinoid grinding wheel, coated abrasives, etc. Abrasive grains that are finer than 120 girt can be used as particulate filler in the polymer composites.
Fillers are the secondary reinforcement in the polymer composite to improve the strength of the composite. In the polymer composites, industrial wastes such as ceramic waste, 5 fly ash, 6 red mud, 7 and flue dust 8 were used as low-cost reinforcement. Moreover, the ceramic waste filler will be beneficial in terms of improvement in mechanical and thermal properties.
Agarwal et al. 9 reported the use of micron-sized alumina fillers in epoxy polymer composite. The result shows that the addition of 25% alumina particles improves glass transition temperature from 98°C to 116°C. Patnaik et al. elucidated the influence of fly ash addition to the polyester composite. Due to the addition of fly ash in the polymer composite, it increased the impact strength, but the tensile strength of the composite is decreased. 10 Khanam et al. 11 have demonstrated the alumina ceramic as the reinforcement particle in the recycled LDPE (low-density polyethylene) polymer composite. Their finding states that mechanical, thermal, and dielectric properties of polymer composites have been increased. They indicated that above 4% filler addition, the tensile strength values were decreased due to aggregation of particles. Interestingly, it improved the thermal stability of composite by 7.1% than neat resin.
Polymer composites have versatile outdoor applications. To assess the environmental impact, the composites need to be evaluated in various environmental conditions. Mechanical strength of the electrical insulator waste-filled epoxy polymer composite at dry and water-absorbed conditions was studied experimentally. 12 The tensile strength of the moisture-absorbed composite was less by 24% and flexural strength was less by 14% when compared to the dry condition.
A limited study reported on the usage of ceramic waste filler as secondary reinforcement in polymer composites.13–14 Erklig et al. 15 utilized various ceramic wastes like sewage sludge, silicon carbide, and fly ash as fillers in the epoxy polymer composite. Experimental results indicate that the addition of each type of filler (5 wt.%) improves tensile and flexural strength. Further, addition of ceramic filler loading decreased the mechanical properties. Nayak et al. 16 revealed the impact of adding 10% of various ceramic fillers like Al2O3, SiO2, and TiO2 in the glass fiber–reinforced polymer composite. Among those, the Al2O3-reinforced polymer composite exhibits higher hardness and impact strength which was due to the good interaction between polymer matrix and reinforced particles.
The aim of this study is to convert industrial vitrified brown alumina waste into recovered brown alumina (RBA), which will be used as filler particles in glass fiber–reinforced polymer composites. In order to assess the performance of RBA filler, physical, mechanical, and thermal properties of the fabricated composites were studied experimentally. Fractured surface features of the composite were studied using scanning electron microscopy (SEM).
Materials and methods
Recovering of alumina particles from the vitrified rejects
Vitrified brown alumina rejects were collected from an industrial scrap yard (supplied from Ganapathi Enterprises, Hosur, India). The collected scraps were crushed into powder form by a mechanical crusher (used machine: Rajco, India; maximum capacity: 1000 kg). Then, they were sieved into various sizes of abrasive grains using a sieve shaker; specifically, grains finer than 120-grit size were collected. The recovered abrasive grain was used as a filler particle to improve some properties of the E-glass–reinforced epoxy composites.
Characterization of recovered alumina grains
Particle size distribution (PSD)
The size and particle distribution of the recovered alumina particles play a major role in the final properties of the composite. Therefore, the particle size was measured before making the composites. The mean and median particle size of the recovered brown alumina was measured by a particle size analyzer (model: Horriba LA-950, United Kingdom).
Elemental analysis of recovered grain
Morphology and chemical composition of the recovered vitrified brown alumina grain was analyzed by scanning electron microscope (SEM, JEOL JSM840A, Japan) with energy-dispersive X-ray spectroscopy (EDX).
Preparation of RBA filled E-glass fiber–reinforced epoxy composites
Physical and mechanical properties of resin and the curing agent.

Physical and mechanical properties of E-glass fiber.
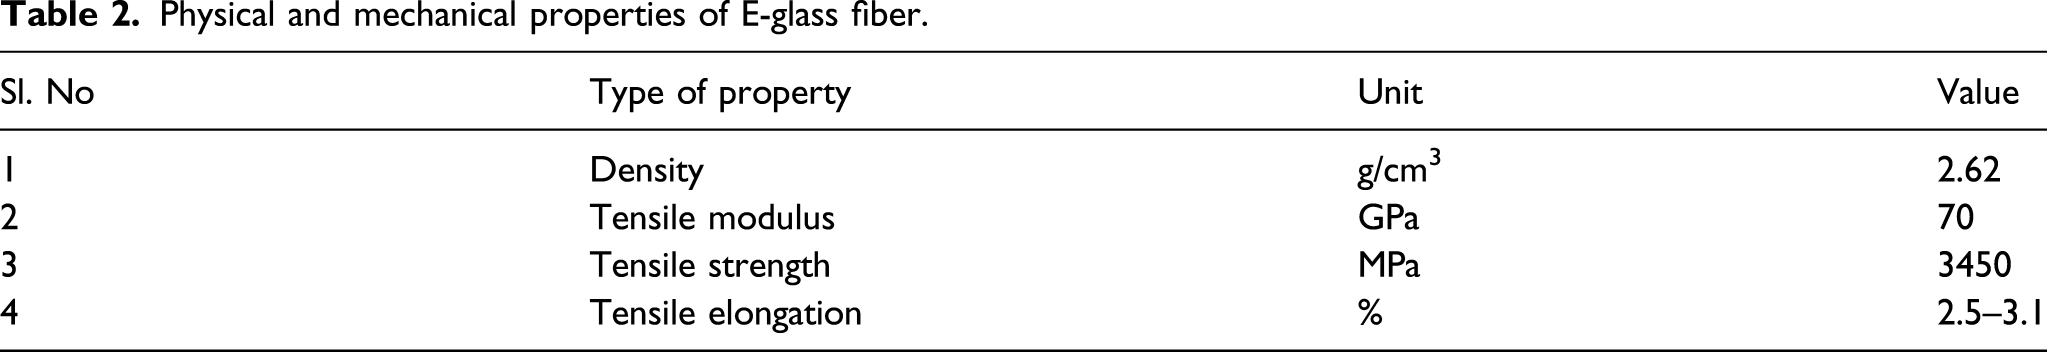
Figure 1 shows the pictorial process layout for the fabrication of the polymer composite. The epoxy polymer composite was filled with recovered grain that was finer than 120 grit. Polymer composites were designated on the basis of weight fraction of fiber and filler, as shown in Table 3. Samples with various filler loadings (0, 5, 10, 15, and 20 wt.%) were designated as RBA0, RBA5, RBA10, RBA15, and RBA20. The recovered vitrified brown alumina filler was mixed with the epoxy resin by adopting an established procedure.
19
Abrasive filler was dispersed in the resin by two steps. Initially, magnetic stirring (used machine: Remi 2MLH, magnetic stirrer) was used to disperse filler particles in the epoxy resin at 1750 r/min for 5 min, followed by probe ultrasonication (model: Johnson Plastosonic; power: 1 kW ) for 30 min with an ultrasonic frequency of 20 kHz. Finally, the resin and hardener in proportion 10:1 ratio were mixed manually for initiating the curing reaction. According to the formulation, composites with the dimension of 310 × 310 × 5 mm were fabricated using a hand-layup technique. Pictorial layout of recovered brown alumina–reinforced E-glass fiber composite production. Composition of RBA-filled E-glass fiber–reinforced epoxy composites. RRA: recovered brown alumina.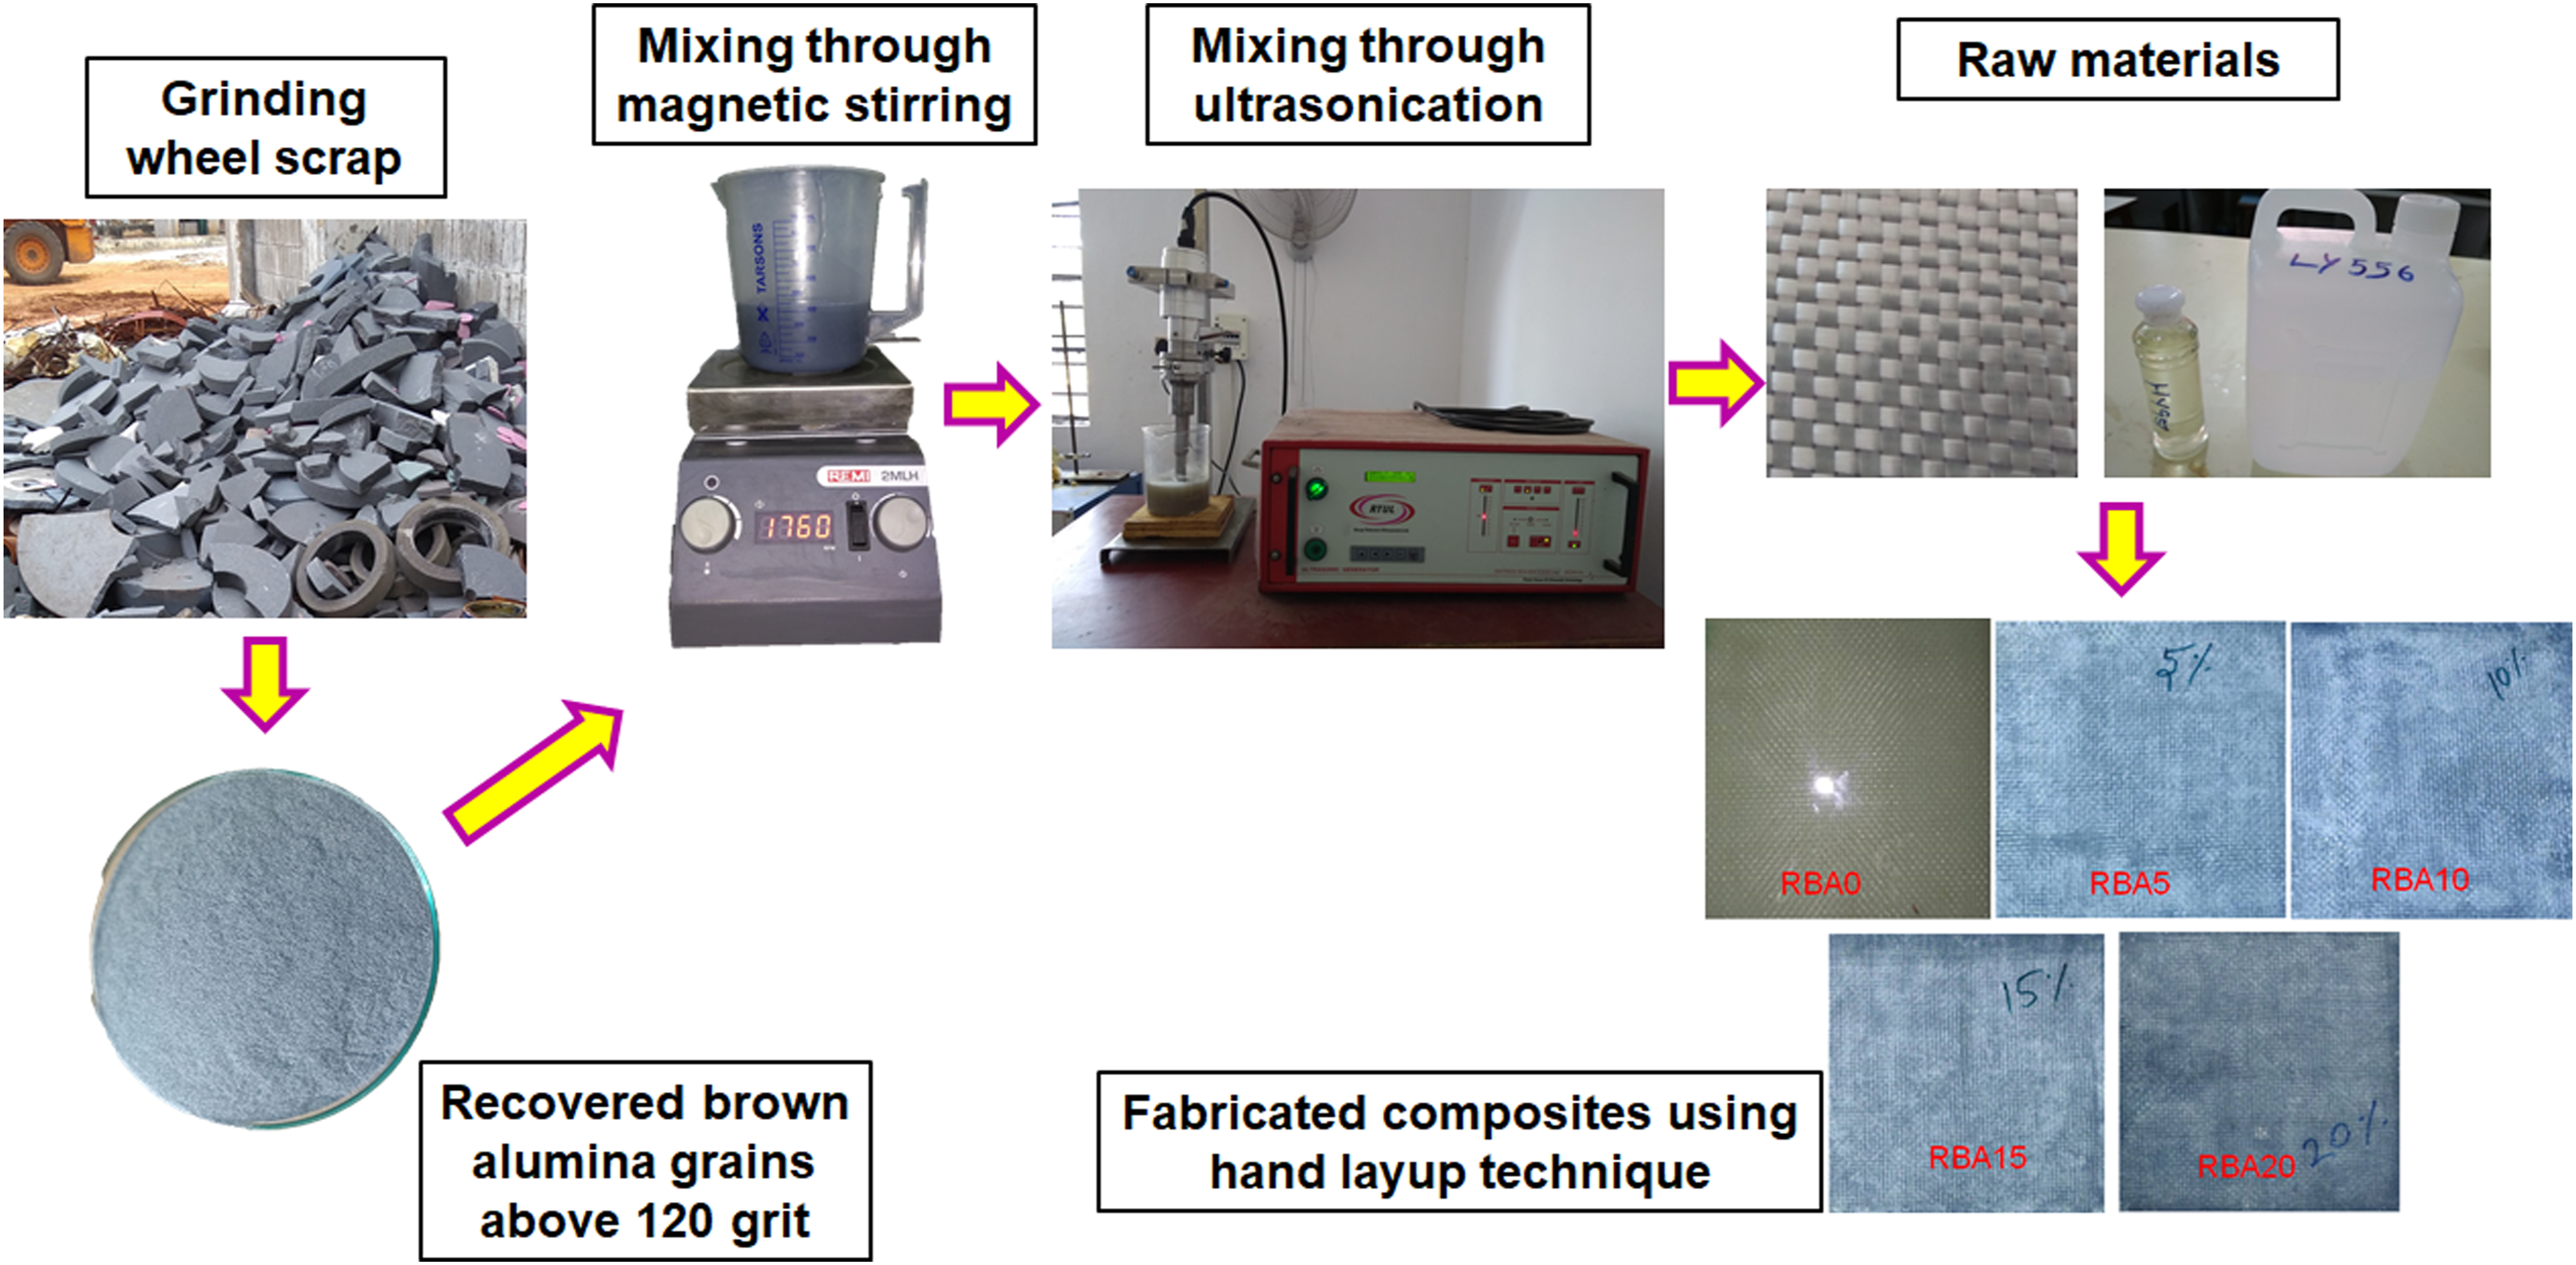

The mold’s sidewalls were covered with manson wax, and Teflon sheets were spread on the top and bottom surfaces to aid easy removal of the laminate. As a base coat, the required amount of resin with well-distributed fillers was poured, and the glass fiber mat was then mounted over it. The filler-mixed resin was spread over the glass fiber mat and evenly spread on the fiber surface by a hand roller and brush. Finally, composites were allowed to cure at room temperature for 24 h with a compressive load of 25 kg. 20 Abrasive water jet machining technique was used to cut down samples as per ASTM standards.
Physical property measurement
In the polymer composite, the presence of voids decreases the mechanical properties. The ASTM D2734-94 norm is used to determine the void content of particles in reinforced polymer composites. The Archimedes principle and ASTM: D792 standard were used to find the experimental density of RBA filler and RBA-filled composites.
Theoretical density (ρct) of the RBA filler-loaded epoxy composite was measured using a given formula
The void content in percentage (Vc) of the RBA-filled composite was measured by the equation mentioned below
The theoretical and experimental densities of the RBA-filled composite are denoted by ρct and ρce, respectively.
Mechanical properties of polymer composite
ASTM D638 standard was used to perform the tensile test on fabricated composite samples. A computerized universal testing system (used machine: Bluestar, model-LDW 50) with a crosshead speed of 2 mm/min was used for the test. Dog bone–shaped tensile samples with a gauge length of 50 mm, a width of 19 mm, and an overall length of 165 mm were prepared as per the ASTM standard. Five samples were tested for each composition, and the average value is described with standard deviation. Figure 2(a, b) shows the standard and fractured tensile samples. Tensile and flexural samples: (a) standard tensile samples, (b) fractured tensile samples, (c) standard flexural samples, and (d) fractured flexural samples.
The flexural test was also conducted on fabricated composite samples by a universal testing machine with a cross-head speed of 5 mm/min. The three-point bending test method was used for measuring the flexural strength of polymer composites. Flexural samples were prepared and tested as per the ASTM D-790 standard of length 125 mm, thickness 4 mm, and width 13 mm. Five samples were tested, and the variation in the flexural strength is described with standard deviation. RBA-filled polymer composites before and after the flexural test are illustrated in Figure 2(c, d). The hardness of the RBA-filled composite was measured using a shore-D durometer (model: CASA) with a hardened steel needle of 1.4-mm diameter as indenter. A hardness test was performed as per the ASTM D2240 standard. The test was conducted in five different locations in the sample across the size of 50 × 50 mm. The variation in the hardness is reported with standard deviation.
Scanning electron microscopy analysis of micro-fractured surfaces
Fractured surface of tensile tested samples, the mode of fracture, filler, and fiber morphologies were analyzed through scanning electron microscopy.
Water absorption test
The moisture intake of polymer composites is measured in seawater to assess its usage in marine applications.
21
The seawater was collected from the Bay of Bengal, Kovalam, Tamil Nadu, India, and the measured pH value is 7.65. The water absorption test was conducted as per the ASTM D570-10 standard. The weight of the polymer samples was measured before and after water immersion. Every 24 h, the sample was taken out, and the excess water was wiped out. The final weight was measured. Water intake of the RBA-filled polymer composite sample is measured by the following equation
Thermogravimetric analysis
Thermogravimetric analysis measures the thermal stability of the RBA-filled polymer composite. The thermal stability of the composite was determined using a Diamond TG/DTA, Perkin Elmer (USA)–type thermal analyzer. A powdered sample with 3–5 mg of each composition was placed in the platinum crucible. The experiment was conducted with a ramp temperature of 20°C/min under a nitrogen environment.
Results and discussions
Characterization of recovered brown alumina
Particle size distribution
The particle distribution of RBA filler is shown in the Figure 3. The filler size affects the resultant properties of the polymer composite. From the particle distribution analysis, the particle sizes are in the range between 91.21 µm and 99.89 µm. The particles size at D10 and D90 are noted from the distribution analysis. The fine (D10), median (D50), and coarse particle size (D90) of the recovered RBA fillers were 49.12 m, 91.21 m, and 164.18 m, respectively, according to the experimental results. The median and mean sizes were 91.21 µm and 99.89 µm, respectively. Particle size distribution of recovered brown alumina particles.
Energy-dispersive X-ray spectroscopy analysis of recovered brown alumina filler
Elemental analysis of RBA filler.

RRA: recovered brown alumina.
Physical properties of polymer composite
Physical properties of the fabricated polymer composite.
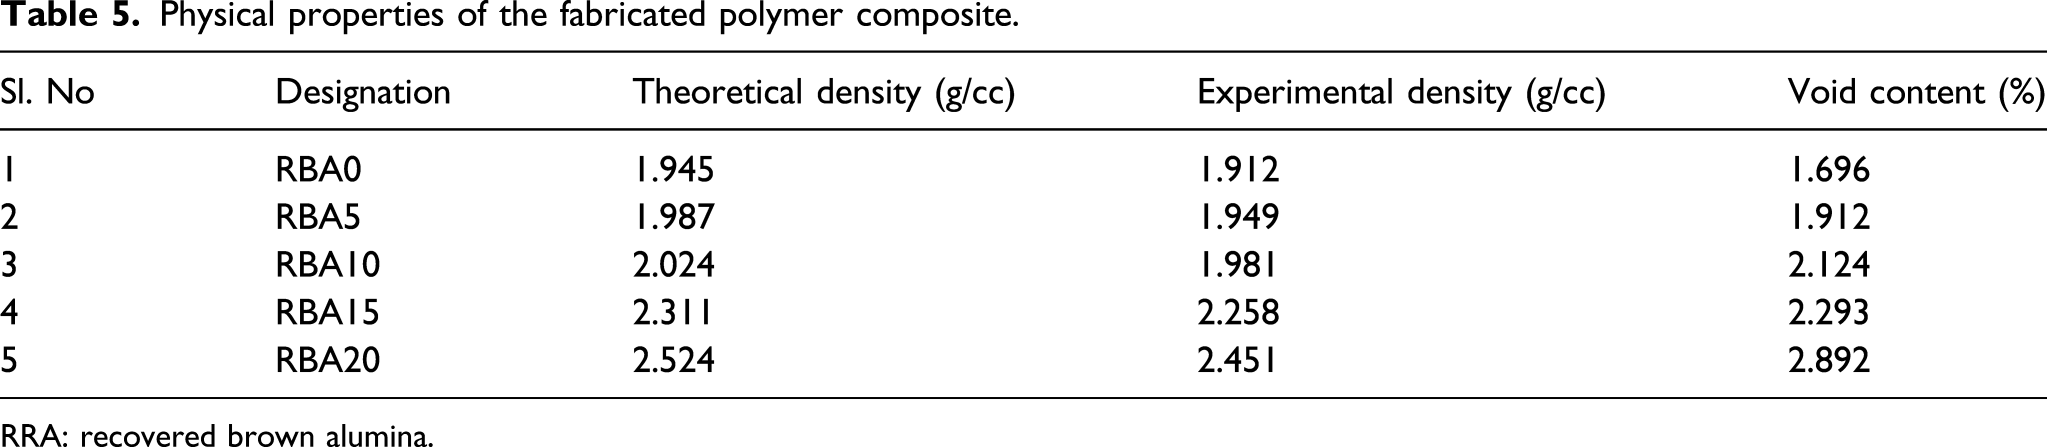
RRA: recovered brown alumina.
Tensile strength
The tensile strength and modulus of RBA-filled polymer composites is shown in Figure 4(a). The results indicate that the maximum tensile strength of 233 MPa was found from the RBA0 composite. This could be due to the strengthening effect of the glass fibers. With an increase in RBA filler (5–20%), the tensile strength decreases to an extent. The recovered RBA particles with irregularly shaped morphology are stress concentrators in the epoxy matrix,
23
leading to the reduction of strength of composites. A similar effect has been reported in a red mud–filled glass fiber–reinforced polyester composite .
24
In addition, a high volume of filler increases the void content, resulting in a weak interfacial bond between filler and epoxy matrix.
25
It can be confirmed with the fracture surface of the RBA20 composite. The SEM image, as shown in Figure 4(b), indicates the presence of voids and debonding of fiber/particle from the matrix. This finding is also supported by Anand et al.,
26
who described that failure of the vinyl ester matrix composite is mainly attributed to the debonding of alumina particles. (a) Tensile strength and modulus of the fabricated RBA polymer composite, (b) the SEM image of the RBA20 composite fractured tensile sample. RBA: recovered brown alumina; SEM: scanning electron microscopy
Tensile modulus of the fabricated composites is also shown in Figure 4(a). The lowest tensile modulus of 3.1 GPa was observed in the RBA5 composite. An increasing filler loading in a polymer composite shows an increase of tensile modulus. An increase of the tensile modulus trend continued up to 15% RBA loading. The maximum tensile modulus of 3.7 GPa was observed in the RBA15 composite. This may be due to the added filler distributing the load effectively. When exceeding 15% RBA filler, there is a reduction in the tensile modulus, owing to the agglomeration of RBA particles in the polymer matrix.
Flexural strength
Figure 5 depicts the flexural strength and modulus of the fabricated RBA filler-loaded polymer composites. Composites loaded with 0, 5, 10, 15, and 20% RBA filler attain the flexural strength of 370 MPa, 256 MPa, 281 MPa, 350 MPa, and 382 MPa, respectively. The maximum flexural strength was observed in a 20%-filled composite. The RBA5 composite shows a decrease in the flexural strength of about 30.8%; however, as compared to RBA0 composite, RBA20 composite has a 3.24% improvement in flexural strength. The RBA20 composite showed an increase flexural strength which was due to the toughening of the matrix by alumina filler particles. Flexural strength and modulus of the fabricated recovered brown alumina polymer composites.
As filler loading increases, flexural modulus also increases. A maximum flexural modulus value of 4001 MPa was observed in the RBA20 composite. This is due to the intrinsic toughening effect by the RBA filler to the epoxy matrix. Wang et al.,
27
reported a similar epoxy matrix toughening offered by the micron-sized alumina particle in a carbon fiber–reinforced polymer composite. The added RBA fillers improve the stress transfer capacity of the polymer composite and restrict the bending force. This is the result of less fiber dismantling
28
in the RBA20 composite than the RBA5 composite, as revealed in Figure 6(a, b). SEM image of fractured flexural sample (a) RBA5 and (b) RBA20, RBA: recovered brown alumina.
Besides, the failure mode of RBA0 and RBA15 composites are depicted in Figure 7(a, b). The predominant failure modes of RBA0 and RBA15 were a high order of matrix cracking and debonding of glass fibers. In addition, SEM images of the fractured surface revealed a brittle mode of failure, which was due to brittle behavior of the epoxy matrix under mode 1 failure.
29
SEM image of fractured sample (a) RBA0 and (b) RBA15, RBA: recovered brown alumina.
Shore-D hardness and water absorption property of polymer composite
The shore-D hardness of the fabricated RBA filler–filled polymer composites is shown in Figure 8(a). From this figure, a linear increasing trend in composite hardness is observed with an increase in RBA-filler loading. The RBA20 composite exhibited a maximum hardness value of 85. Hardness improvement was in an order of 20% than that of RBA0. With the increase in filler loading, the interparticle distance between polymer matrix and filler particles is reduced considerably, leading to exposing more load-bearing sites.
30
Ackibas et al.
14
reported that the inclusion of ceramic waste improves the hardness of the urea-formaldehyde composite. (a) Shore-D hardness and (b) water absorption trend of the recovered brown alumina–filled E-glass fiber–reinforced epoxy composites.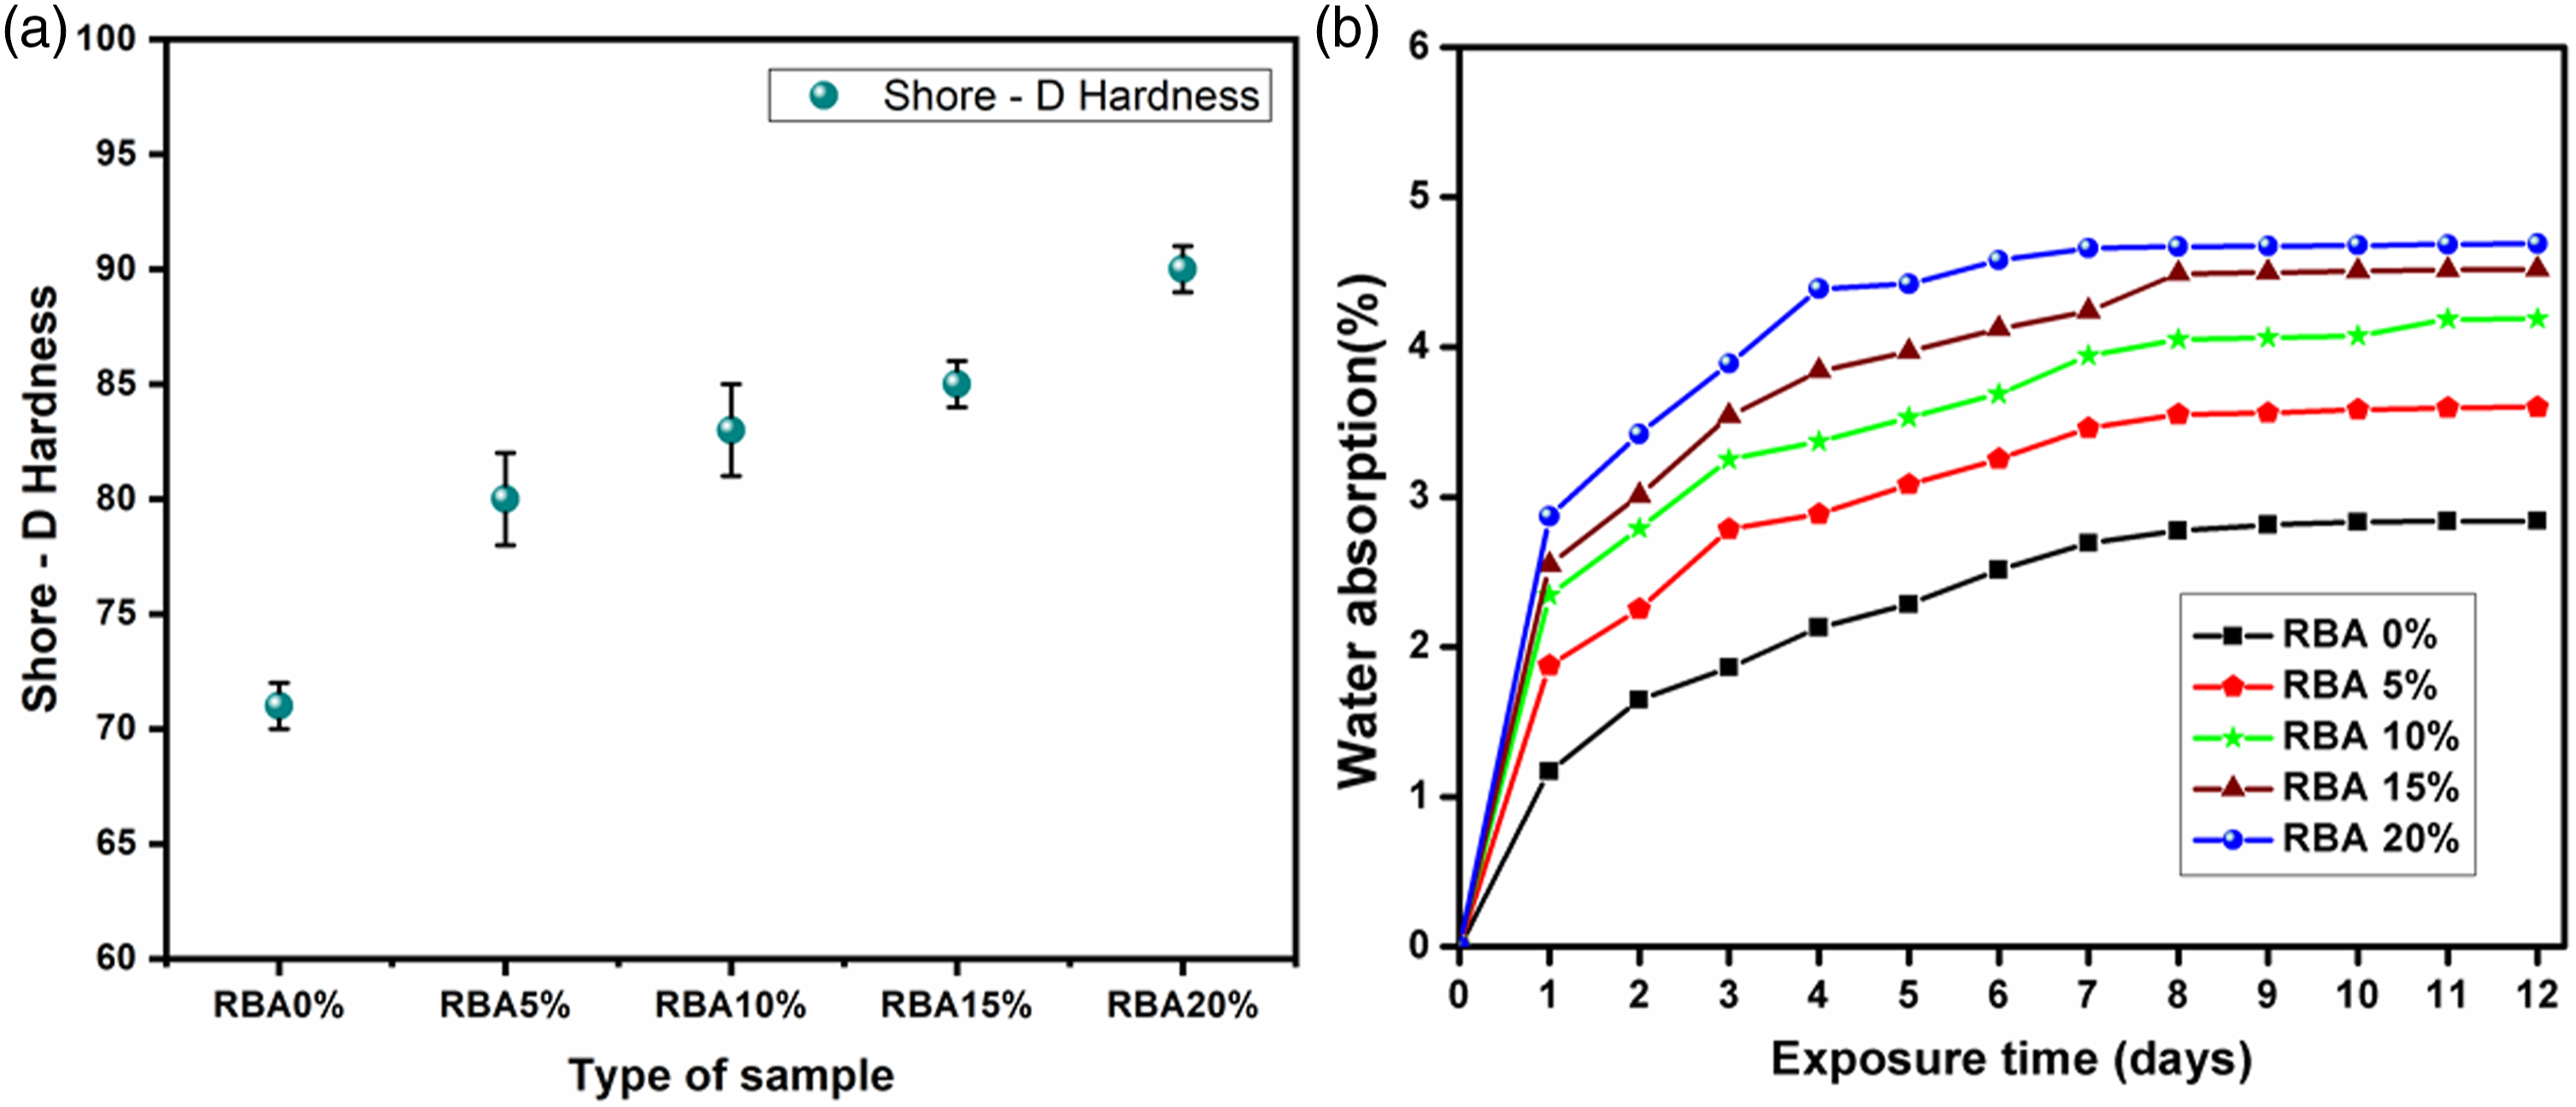
Figure 8(b) shows the moisture intake of RBA-filled polymer composites. Based on the Fickian diffusion theory, 31 there is a steep increase in water absorption during the initial period, and it then slows down, after reaching a steady state. The results show that the addition of filler increases water intake. The glass fiber is hydrophobic in nature. In this case, an increase in filler percentage increases the void content of the polymer composite, in addition to own water absorption tendency of the filler. These voids act as an additional pathway for water molecule transportation and may reach the interface of the matrix/fiber/particle. Thus, water intake is steadily proceeding in the composite. The RBA20-filled composite exhibits the highest water intake of 4.69% in 12 days. Many researchers32,33 claimed that the addition of particles/fibers in a polymer composite affects water absorption.
Hygrothermal effect on mechanical properties of RBA filled epoxy composites
Figure 9 reveals the tensile and flexural strength of RBA-filled E-glass fiber–reinforced epoxy composites under dry and seawater-absorbed conditions. The results show that the tensile and flexural strength decreases under seawater-absorbed condition. The RBA20-filled composite under seawater-absorbed condition shows a 9% reduction in tensile strength. The flexural strength of composites for various RBA filler loading (0, 5, 10, 15, and 20%) at water-absorbed condition was 357, 245, 275, 333, and 364 MPa, respectively. The obtained flexural strength of composites at water-absorbed condition was lower than the dry condition RBA composites. Water absorption leads to a reduction of 4% flexural strength when compared to dry condition. Generally, the water intake tendency reduces the mechanical properties and also leads to a state of incompatibility among the fillers/ fibers and matrix.
34
Hygrothermal effect on (a) tensile and (b) flexural strength of the recovered brown alumina–filled E-glass fiber–reinforced epoxy composites.
Thermogravimetric analysis
Thermogravimetric analysis of different percentage of the RBA-filled composite.

RRA: recovered brown alumina.
In the second stage, thermal degradation of the composite is related to the type of filler loading, bonding strength, and compatibility of filler with the matrix. The RBA20 composite becomes more thermally stable than all other RBA-filled composites. This is due to ceramic RBA filler being more stable and harder than the epoxy matrix, as shown in Figure 10. Alumina and silicate materials are capable of withstanding high temperature. Hence, there is a scope for improvement in thermal stability of the composite incorporating the RBA filler. The abrupt changes in degradation temperature were steadily decreasing with an increase in RBA filler. Joshi et al.
36
and Rajkumar et al.
37
reported that ceramic filler enhances the thermal stability of polymer composites. Thermogravimetric analysis of recovered brown alumina–loaded composites.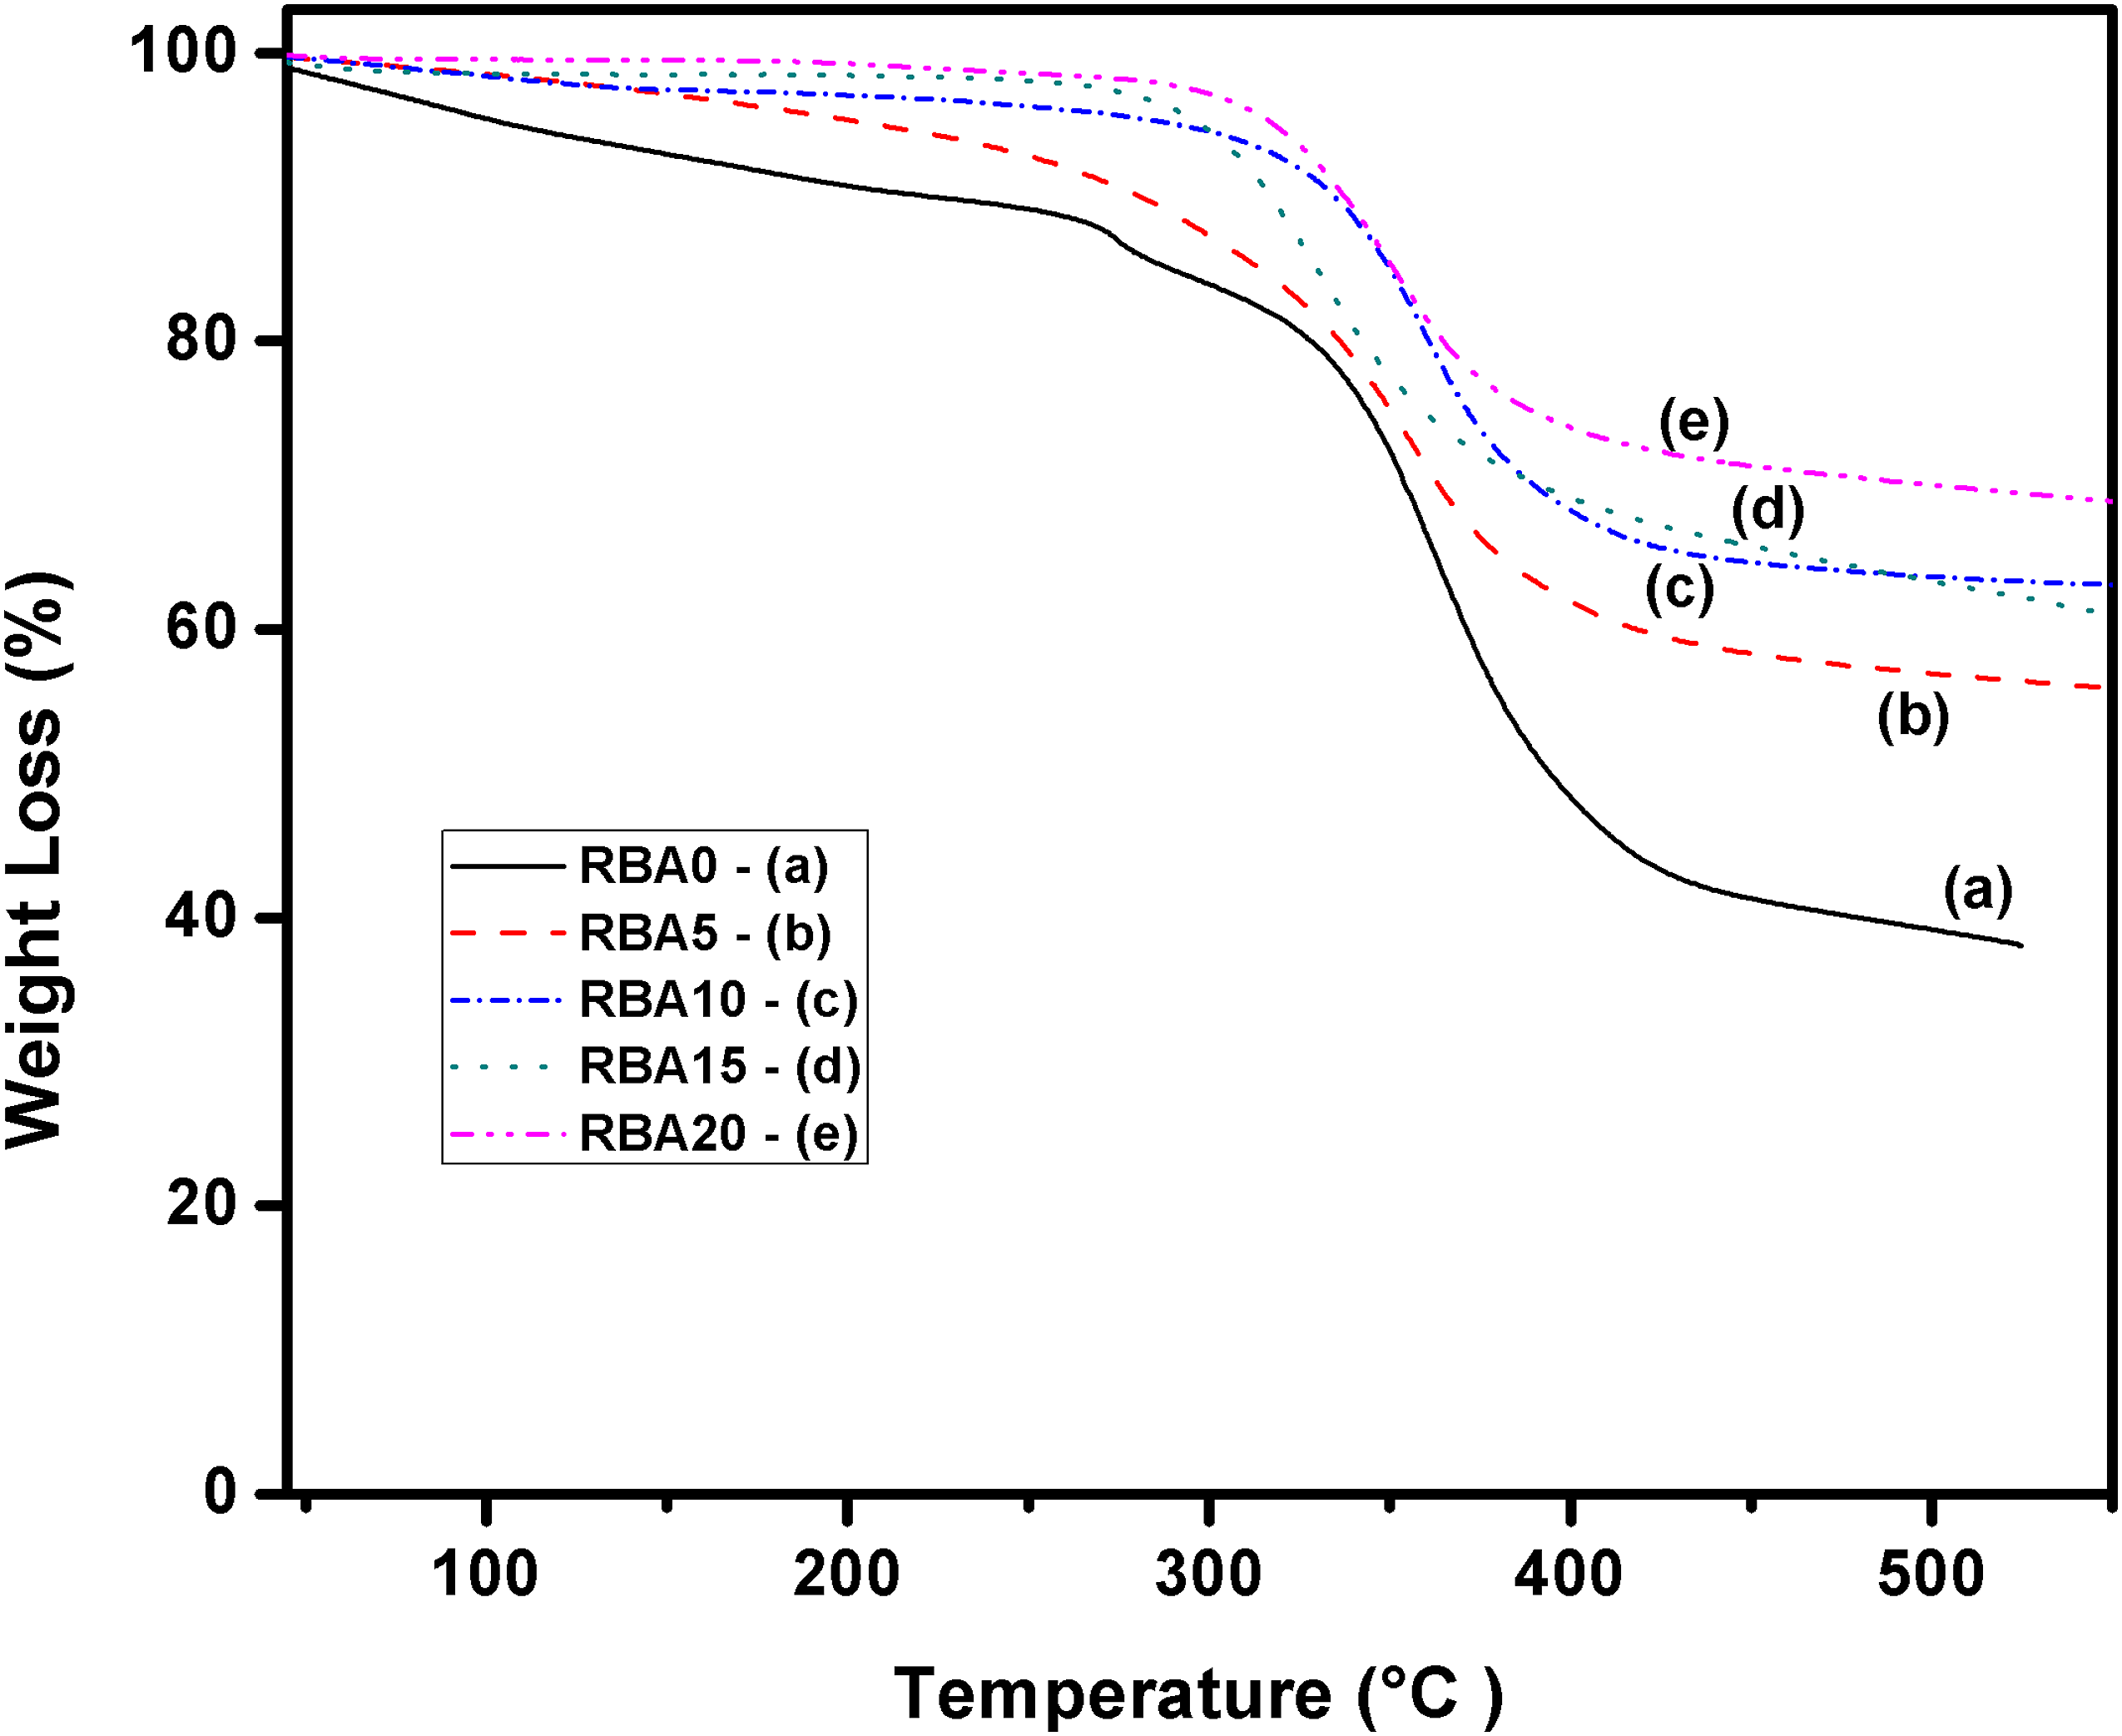
Conclusions
In the current work, finer-than-120-grit brown alumina particles, recovered from vitrified grinding wheel rejects, were used as filler material in epoxy glass fiber polymer composites. Physical, mechanical, and thermal properties of the fabricated composite were studied. From the experimental results, the following conclusions are made, 1. By suitable addition of RBA fines, it is possible to tailor the tensile strength and modulus, flexural strength and modulus, shore-D hardness, and thermal stability of glass-reinforced epoxy polymer composites. 2. Effect of RBA filler addition on mechanical properties is given below: a) Tensile strength decreases with an increase in RBA filler addition. b) Tensile modulus varies with filler percentage, showing a higher value at RBA 15%-filled composite. c) Flexural modulus and shore-D hardness increase with an increase in RBA filler and reaches its maximum at RBA 20%. This is due to the toughening effect offered by the micron-sized brown alumina filler. 3. Addition of RBA in the epoxy composite improves thermal stability from 404°C to 435°C. It could be due to the ceramic RBA filler being more stable and harder than the epoxy matrix 4. The developed composites can be used in an under-hood structure of automotive vehicles and electronic packing applications where toughness and thermal resistance are importantly sought properties.
Footnotes
Declaration of conflicting interests
The author(s) declared no potential conflicts of interest with respect to the research, authorship, and/or publication of this article.
Funding
The author(s) disclosed receipt of the following financial support for the research, authorship, and/or publication of this article: This article is supported by Department of Science and Technology, India (DST/TSG/WM/2015/567/G).