
Abstract
This study evaluates the efficiency of castor oil–based polyurethane foams for oil sorption S10 and S500, focusing on the influence of the pores’ size. Different foams were produced by varying the polyol: isocyanate ratio (1:0.3; 1:0.5; 1:1.0; 1:1.5; and 1:2.0). The physicochemical properties, morphology, density, and Hg porosity were determined. The sorption capacity was influenced by exposure time, oil viscosity, and concentration of the reagents, considering variations in the hydrophobicity, void content, and morphology. The results showed that the foam produced at an in the same mass proportion (PUC) has a higher sorption capacity in exposure time from 25 to 40 h due to higher void content and larger pore diameter size. It was observed that the lower viscosity of S10 diesel contributes to the higher sorption efficiency compared to S500 one. The Taguchi method corroborated the mentioned results, indicating a higher sorption trend by varying the reagent concentration and exposure times.
Introduction
The environmental disasters caused by the oil spill and their derivatives, mainly in the marine environment, have caused concern. Thus, studies on developing techniques to prevent and mitigate its effects have increased in recent decades. 1 The contamination by oil and organic solvents is from natural process infiltration, exploration, production, and petroleum transport.1–4 It is possible to apply different remediation techniques such as chemical treatments, mechanical treatments, bioremediation, and in situ burning. 5 The sorption method is considered one of the most efficient technologies due to its wide applicability, lower cost, and good recyclability.4,6
Synthetic organic sorbents are used in the oil spill problem due to intrinsic aspects such as sorption capacity, hydrophobicity, oleophobicity, biodegradability, availability, and reuse. Among the adsorbents, polyurethane foam (PU) has good oil sorption, lower energy processing, and capital investment.7,8 The cost by volume is low because the foams have low density and are easy to fabricate. 9 Furthermore, it is an attractive material as its hydrophilicity and porosity promote an excellent performance as an adsorbent. 10 According to Al-Majed et al., 4 an open-cell PU foam can absorb 100 times its weight in oil. The physicochemical properties of PU and its surface nature favor kinetic sorption. 11 Oils and their high viscosity derivatives can obstruct the PU pores, decreasing the oil sorption capability 12 and the more stable retention of oil due to the high tortuosity of the sorbent structure. 9
The most used fuel in Brazil is diesel (e.g., S500 and S10), mainly in road and sea transport. 6 Consequently, the environmental concerns involving it are one of the most pertinent.8,13 The studies about PU utilization as adsorbent materials have increased,13,14 mainly castor oil–derived polyurethane, which are good alternatives for fabricating biological-based polymer due to polymer from petrochemical sources degrades slow, causing damage in the environmental.15–20 Therefore, different studies using bio-renewable sources are used for PU foam preparation. 21
The use of castor oil to synthesize PU is attractive due to the higher number of hydroxyl groups (-OH) that react to isocyanate (-NCO) to form urethane bonds. The hydroxyls are from the higher ricinoleic acid, about 80% in weight.12,22,23 The triglycerides’ hydrophobic essence presented on castor oil proportionate excellent chemical and mechanical properties, such as high tensile strength, elongation, and thermal stability.5,22,24,25 The main properties of PU foams are attributed to the density and morphological structure, which are influenced by the concentrations of polyol and isocyanate, resulting in different foam structures (flexible, semi-flexible, or rigid).10,22,23,26–29 About 60–70% of the polyurethane properties are defined by the reagents employed. 30 The polyol from the castor oil allows flexible segments, which gives extensibility, while the chain extensor and isocyanates originate rigid segments that act as physical crosslinks.20,30,31 The crosslinking degree depends on the excess of isocyanate due to an enhanced reactivity with a polyol, increasing the urethane crosslinking and the rigidity.32,33 This “mix” of rigid and flexible segments gives PU versatility for a wide range of applications and properties.30,34,35
Sorption is a phenomenon that englobes two processes: absorption and adsorption, where factors like porosity, morphology, and functional properties of the material’s surface must be considered.4,7–9,36,37 Porous sorbents as PUs have a promising perspective for this finality.38–40
This study proposes a method to prepare green PU foams with different polyol: isocyanate concentrations (1:0.3; 1:0.5; 1:1.0; 1:1.5; and 1:2.0) for the diesel sorption (S500 and S10).
Materials and method
Materials
For the synthesis PU foams were used the castor oil–based polyol (Biopol L40H, 531 mg KOH) and isocyanate (Biopol p-MDI, 4,4-diphenylmethane diisocyanate, average functionality equal to 2.6, average molar mass equal to 349.9 g mol−1, solvent-free and average %NCO equal to 30–32) supplied Polyurethane Ind e com. (Ibirité, Brazil). Castor oil–based polyol is formulated with additives, blowing agent (water), and ready to use. The diesel oils S500 and S10 were purchased at the Graal Ambassador Petrobrás post (Resende, Brazil), with viscosity values of 3.99 and 2.80 mm2 s−1, and densities values of 0.850 and 0.830 g ml−1, respectively.
Methodology
Polyurethane foams were synthesized with polyol and diisocyanate by mass mixing using different molar masses of the prepolymer. The identification of the foam samples was PUA, PUB, PUC, PUD, and PUE, which correspond to polyol and diisocyanate mass proportions of reagents: (1:0.3), (1:0.5), (1:1.0), (1:1.5), and (1:2.0).
The homogenization of reagents was manually done at 25°C by 50 s. A cylindrical plastic recipient was used as a mold. The temperature of polymerization reached around 55°C. After 24 h for the complete cure of the material, the foams were removed from the mold and cut, as observed in the Supplementary Material (S1).
Characterization of polyurethane foams
Apparent density was determined by ASTM D 1622-14 standard, cutting and weighing the materials specimens (10 × 10 × 10 mm3), and dividing the weight of the specimens by the calculated volume.
The foams morphology was examined by scanning electron microscopy (SEM) on a HITACHI TM 3000 microscope with tungsten filament, operating at 15 kV, employing the low-vacuum technique and a secondary electron detector. Samples were dispersed on brass support and fixed with double-faced 3M tape. The foams morphology was also analyzed by Stereomicroscopy using ZEISS Axio Imager 2 (optical microscopy (OM) technique). ImageJ software analyzed the pore sizes of polyurethane cells, and 100 values were measured.
Void volume fraction was determined by the Hg porosimetry technique, using a POROMASTER® GT 33 porosimeter, applying parameters of up to 7 kPa, motor speed set at 25 r/min, and dwell time of 10 s.
The foams were analyzed on a PerkinElmer FTIR spectrometer, model SPECTRUM GX, using the attenuated total reflectance method. The analysis was conducted in transmittance mode, in the range of 4500–400 cm−1, with a resolution of 4 cm−1 and with 64 scans.
The wettability was analyzed using a Ramé-Hart Goniometer 100-00 goniometer measuring the contact angle between deionized water (100 μL), and the foam surface, corresponding to the arithmetic mean of 15 measured values. In this procedure, drops (100 μL) of deionized water were applied to the polyurethane surface at room temperature.
Oil sorption and efficiency sorption
Sorption experiments used two types of diesel: S500 and S10. The foams were immersed in a container (with 25 mL of S10 or S500 diesel) in a pre-established time (1/2/6/12/24/36/48 h) at room temperature, as evidenced on Supplementary Material (S2). The oil absorption capacity (CS) of PU foams was calculated according to equation (1), where CS is diesel absorption capacity for each foam gram, and Mi and Mf are the initial and final weight. The foams were drained for 60 s to remove diesel and weighted

The sorbed oil mass for each specimen was also calculated according to equation (2), where

Design of experiments approach
Distribution of levels of Hg porosimeter parameters.

Hg porosimetry parameters application in L4 array.

Table 2 results from the combination of factors and levels, which is the subsequent experimental distribution for this specific array. 18 Experiments 1–4 represent the variation in factors and levels; meanwhile, experiments 5–7 are triplicate analyses to measure the error in the analysis. The material compositions are the same as those described in Methodology, and experiments 1–2 represent PUA, 2–4 represent PUE, and 5–7 represent the PUC tests conducted for different times (h). The analysis of variance (ANOVA) and response surface methodology (RSM) was conducted to determine the effect of the factors on the sorption capacity.
Results and discussion
Density and morphology
Foam’s density.
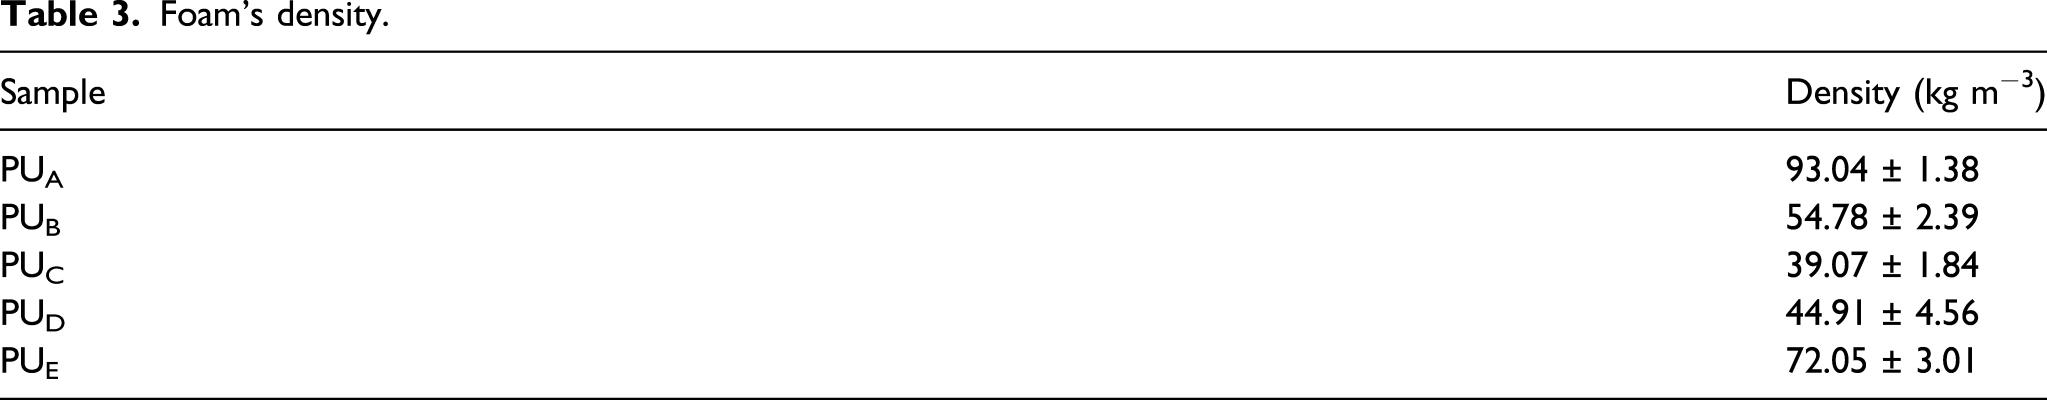
It was observed that PUC had a lower density than the other foams. Fenner et al. 43 demonstrated the same tendency, in which the mass proportion (1:1) leads to lower density values. The mass proportion (1:1) of the reactants creates functional groups, ensuring all reactant consumption. 42 The diisocyanate reacts with the polyol to form the urethane bond and reacts with the water to form the urea bond with CO2 responsible for the cellular structure and the decrease in density. With excess diisocyanate, there is more water consumption, reducing CO2 production. The diisocyanate creates allophonate and biuret bridges between the polymeric chains which hinder the expansion of the foam, that is, a decrease in density, as observed in the PUD and PUE samples. 44
Similar behavior is observed for the first and last foams, which had the highest density values. The density values tend to decrease with isocyanate addition until equilibrium proportions (1:1) (PUC). The density then tends to increase with an increase in the isocyanate (PUD and PUE). The higher density is related to a smaller void of the material, corroborating the greater number of pores per area and smaller diameter of them, due to the lower availability of carbon dioxide for cell growth due to the excess of a reagent.45,46
Figure 1 shows the morphology of cell pores using the OM and SEM techniques. The proportions of the reagents used in the synthesis modified the void morphology. The material synthesized with the same amount of reagents (1:1) has a smaller pore number with a larger diameter. The nucleated bubbles of the foams were observed by three-dimensional arrangements of open and closed cells, which occur due to the expansion process.
47
The cell sizes and foam porosity were analyzed using OM and post-processed images treated in ImageJ software (Figure 1). Morphology of the foam specimens (OM, SEM, pore size, and porosity values of foams). OM: optical microscopy; SEM: scanning electron microscopy.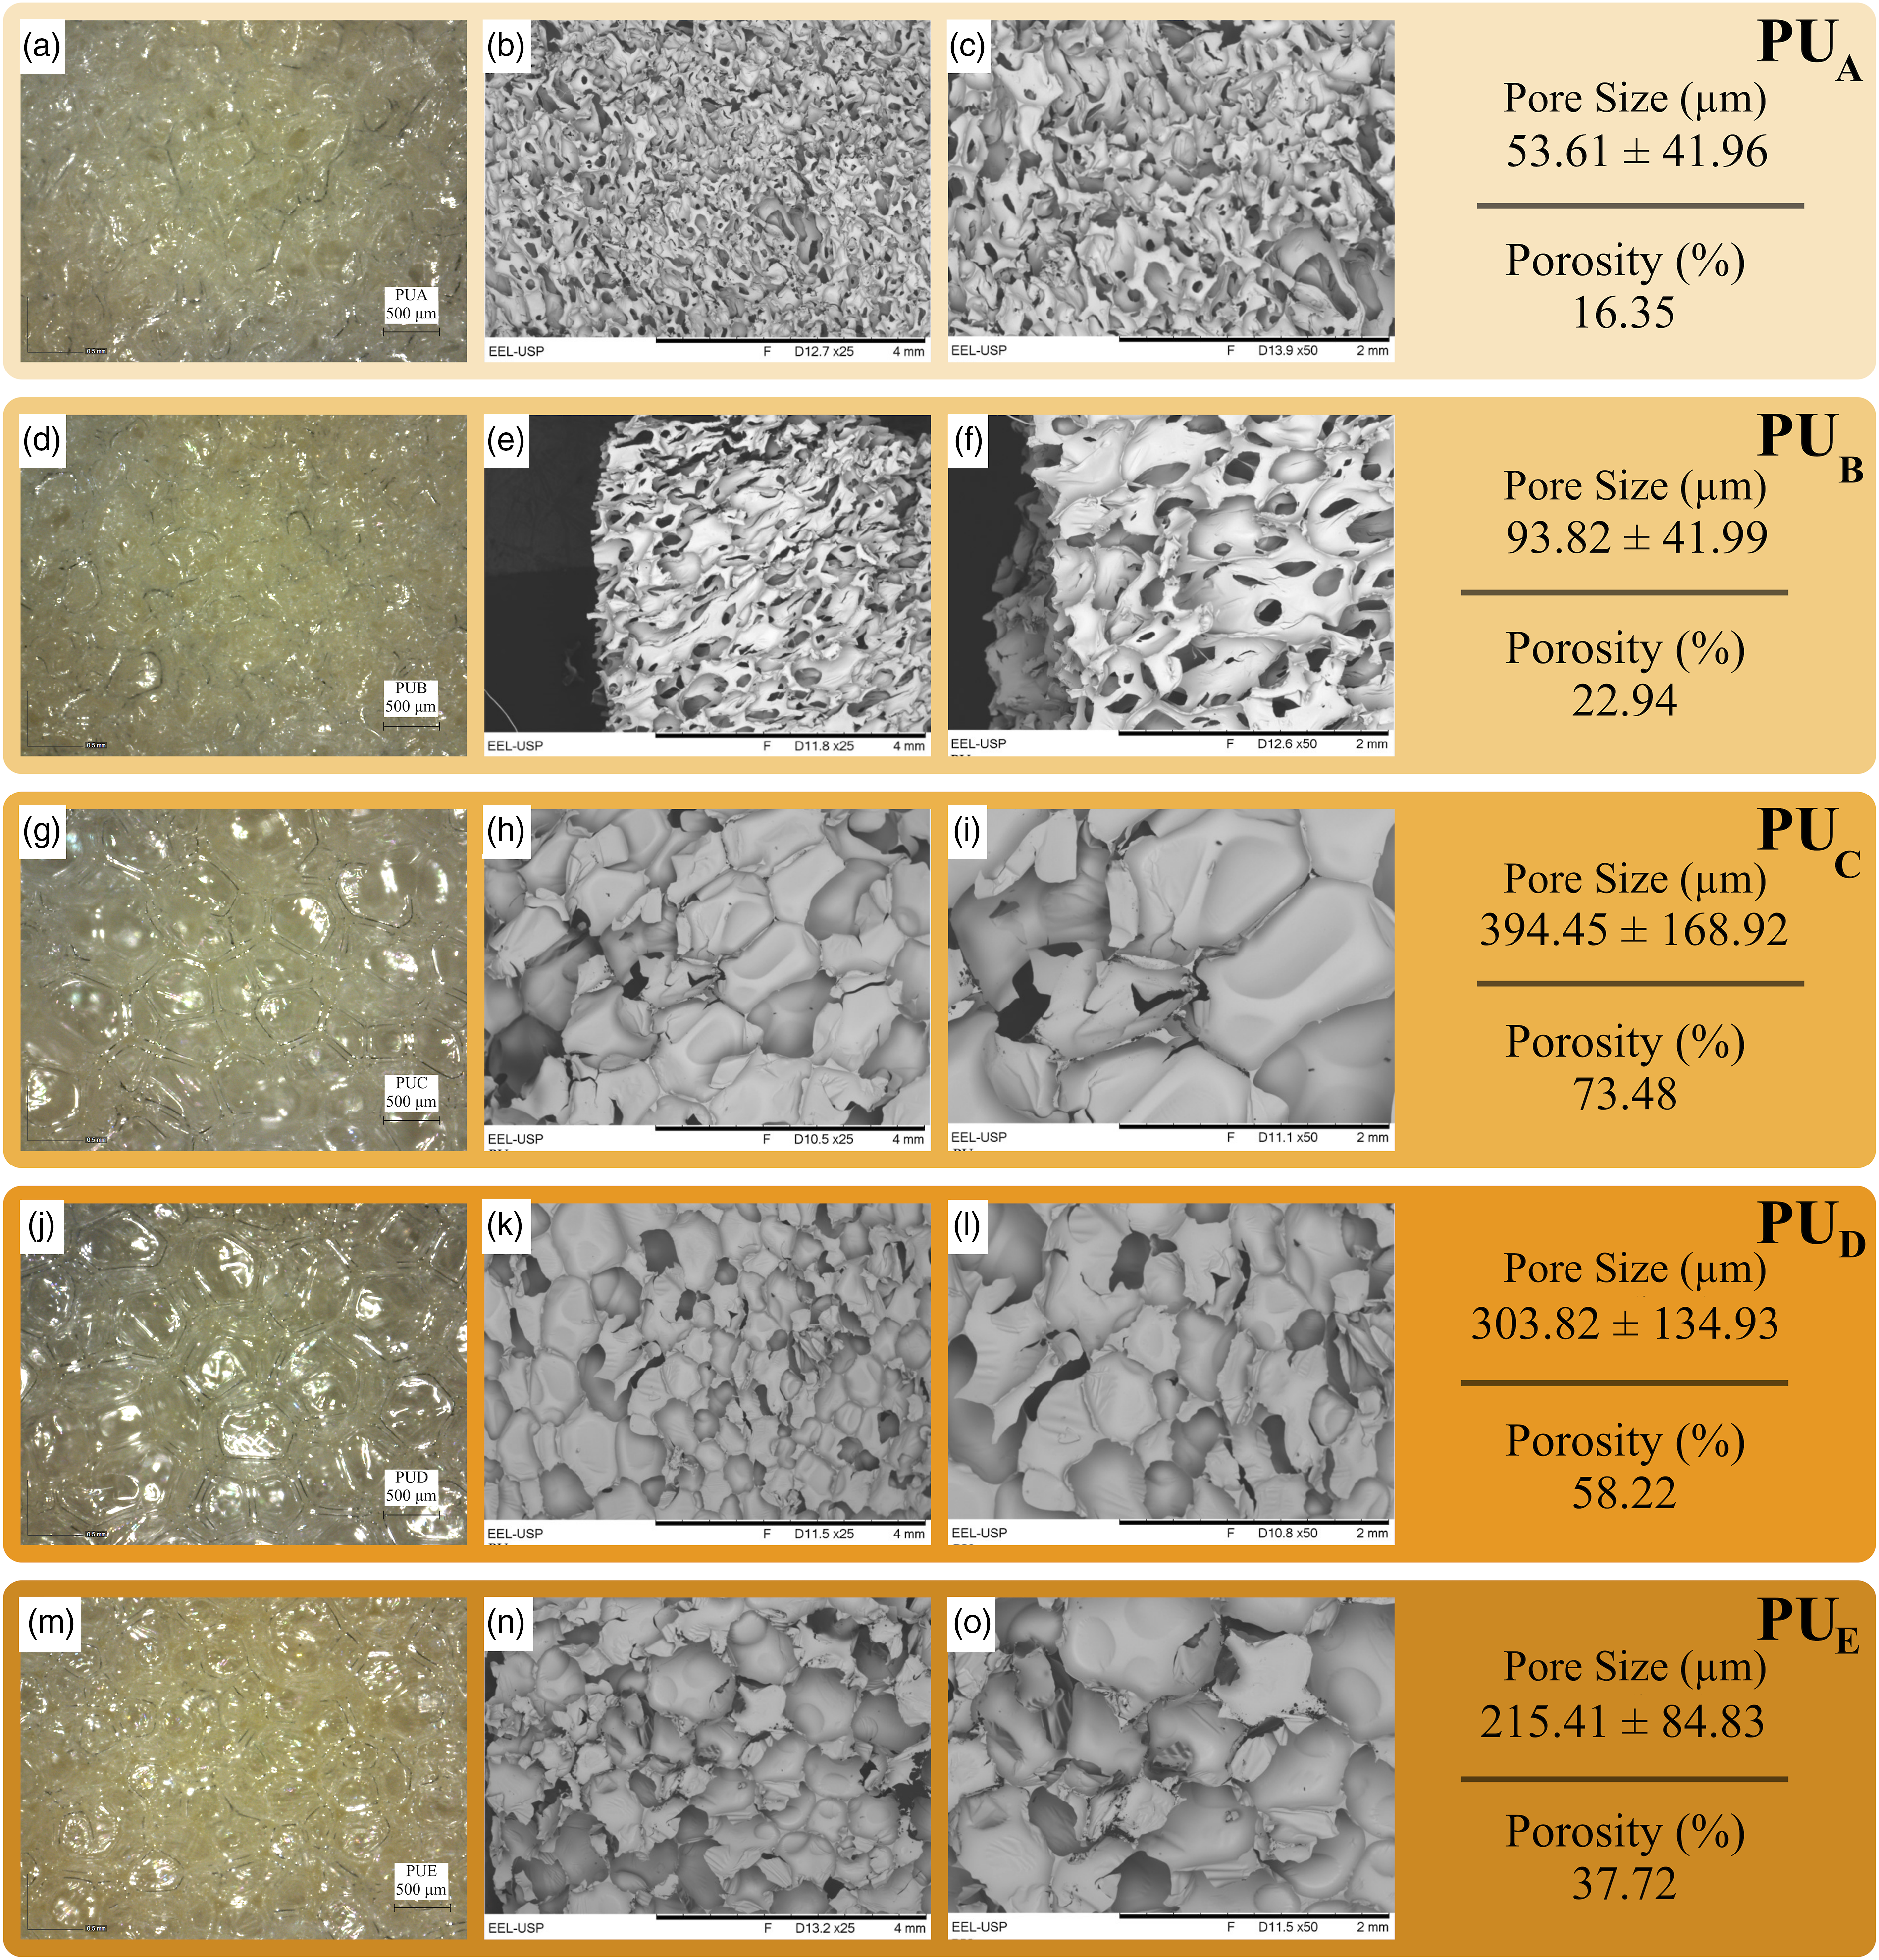
The same mass amount of the reagents contributed to a greater expansion of the PUC, producing a larger pore diameter (approximately 394 μm). Likewise, the porosity was influenced by the mass reagent ratio. Excess of polyol (PUA and PUB) or isocyanate (PUD and PUE) c foam caused less expansion during the synthesis, providing a smaller void volume fraction. It was also possible to observe a direct relationship with density, in which foams with greater porosity had lower density.
The characterization of void volume fraction and size performed by OM has a 2D limitation. However, the proposed method by Hg porosimetry has the advantage of quick analysis and three-dimensional measurement of the exposed and internal pores.
Figure 1(a)–(o) showed the foams morphology, which agrees with the density results. Other images obtained by SEM with different amplifications are shown on the Supplementary Material (S3).
The brighter regions represent the distribution of cells, and the dark areas show cells with open pores. The most extensive pore size distribution is observed for PUC. However, the foams with higher density showed an increase in the number of pores with small diameters. A non-homogeneous pore distribution was observed, common in foams due to increased viscosity, promoting the mixing of cells during the material curing. The images show a large difference in the pore size, quantity, and geometry, but all samples exhibit a thin film due to the expansion phase, classified as closed cells. It was observed that for foams (Figure 1(b), (c), (e), and (f)), the cells are elongated in the foam formation direction, and there are a larger number of open pores. This fact occurs due to the loading direction (rise direction), which was affected by the manual process without a closed system to control the expansion.
Hg porosimetry
Hg porosimetry results (porosity).

Analyzing results, a larger void volume led to greater consumption of mercury during the intrusion. The void content of >100% found for PUA and PUB is due to the pressure used as the main parameter during the Hg intrusion. Since PUA and PUB present low stiffness, these foams underwent compression during the test. Thus, during Hg injection into the foams, the porosity measurement and material compression occurred simultaneously. The proportions of the reagents used for PUA and PUB resulted in an imprecise measurement, and the Hg porosimetry results for these two specimens were neglected. For the other specimens, there was no compression during the analysis.
Previous works were carried out using the Hg porosimeter.12,38,39 A pressure value is defined and guaranteed to maximize the porosity measurement and minimize the material compression to avoid analysis errors for PUC-E. However, for PUA-B the sorption occurs with an increase in the foam volume, which requires additional strength during the sorption—reducing the capillarity effects.
Pore diameter was calculated following Equation Pb = Kγ/D based on Mayer and Stowe theory, in which P b is the injection pressure, K is the so-called MS proportionality constant, γ is the surface tension of mercury, and D is pore diameter.
The pore diameter varied with polyol: diisocyanate proportion, showing differences in the void formation and their sizes. Figure 2 shows the frequency of the volume injected according to diameter porous distribution, which is related to the volume of the void of each material. PUD showed higher frequency (35.45%) for higher diameters pores of 55.6 μm. PUE showed a higher frequency (27.83%) for pores with a diameter of 102.5 μm. Pore size distribution.
The pores’ size is an essential factor in the initial oil sorption. 49 Small pores are important in the sorption capability because the capillary effects create a sorption force of the liquid, facilitating the oil’s retention.49–51 The PUC presented a balance between great and small pores, contrasting with PUD-E, and a wider pore distribution (4.9 a 131.4 μm). This distribution tends to influence the sorption capacity.52,53 PUC presented a higher void content, with a more extended pores concentration with a frequency observed (18.4%) due to pores with 131.4 μm diameter. These results are correlated with SEM images (Figure 1) where it is possible to note the differences among the pores for each sample. PUC showed higher porosity due to higher Hg volume on the sample.
FTIR spectroscopy
Figure 3 shows the infrared spectra results for the polyurethane reagents (Figure 3(a)) and the foams (Figure 3(b)). FTIR spectra of the samples.
Figure 3(a) evidence a characteristic peak associated with (O-H) stretching vibrations close to 3330 cm−1. This same peak is also found in Figure 3((b)), due to the stretching vibrations of O-H and N-H.25,55,56 At 3011 cm−1, the vibration peak of the unsaturated -CH group can be identified. The asymmetric (-CH) stretching vibration is detected in the range of 2920–2930 cm−1, and the absorption band of 2850–2861 cm−1 corresponds to the symmetrical (-CH) group. The methylene group of the polyurethane main chain is observed in all infrared spectra. The 1735 cm−1 band corresponds to the stretching of the carbonic ester group (C=O) from the castor oil.56,57 At 1457 cm−1, peak corresponds to the flexural vibrations of CH2. 56 The peak at 2260 cm−1 is assigned to the free N=C= O group.54,56,58
The FTIR spectrum of PUs foams (Figure 3(b)) presented bands at 3351 cm−1 and 3338 cm−1 attributed to the stretch band O-H with intermolecular hydrogen bonding. The 2969 cm−1, 2925 cm−1, and 2856 cm−1 bands correspond to the stretching of alkanes (C-H bonds). The 2273 cm−1 band is constituted of the isocyanate groups (NCO) and the bands at 1703 cm−1, 1509 cm−1, and 1227 cm−1, characteristic of polymerized urethane groups (deformation of the C=O and N-H bonds). The 1082 cm−1 band is associated with the NCO group urethane. The 1014 cm−1 band is related to carbonyl groups present in the polyester structure of the polyol derived from castor oil. Comparing the results of Figure 3(a) and (b), it can be noted that the intensity of the N=C=O peak is higher for the MDI castor oil. With an increase in the polyol concentration, the intensity of the N=C=O peak (Figure 3((b))) decreases, especially for the PUA and PUB foams, for which the complete reaction of the N=C=O group occurs. The 1217 cm−1 peak corresponds to the stretching of the carbonyl ester (CO-O).54,59 The bands found at 1309 cm−1, 1510 cm−1, and 1534 cm−1 represent the stretching of CN, CH2-CH3, and NH2, respectively. 60 The 1600 cm−1 band relates to the benzene ring segment in the MDI castor oil. 61
Contact angle
Figure 4 shows the contact angles obtained for each foam. The results obtained for PUA and PUE classified them as hydrophilic materials since the value of θ is lower than 90°. PUB, PUC, and PUD are classified as hydrophobic, with θ values >90°. The rigid segments formed during PU processing influence these results related to their polarity, and higher contents of rigid segments lead to greater hydrophilicity. Both the presence of rigid segments and the hydrophobic behavior are appropriate characteristics for oil sorption, as reported in the literature.6,62 Contact angle results.
Sorption capacity
Figure 5 shows the mass of oil sorbed, as the amount of oil contained in each foam, where it can be noted that PUA had greater amounts for both types of diesel. For the S500 diesel, PUA presents better performance after 36 h of testing, while for the S10 diesel, the performance remained similar after 12, 24, and 36 h of testing. The viscosity and density of the oil can influence sorption.
63
S10 diesel presented faster mobility, which improves the sorption rate and the amount absorbed, showing similar saturation times (between 12 and 36 h). S500 diesel requires a longer time to reach the maximum sorption capacity (36 h). The oil with lower density and/or viscosity can diffuse faster from the foam’s surface to the pores, while the denser and/or viscous oil slowly adheres to the pores’ surface. Sorption mass versus time: (a) S500 and (b) S10.
The best results obtained for the PUA and PUB samples are due to the higher mass of the PU raw material. Therefore, the sorption capacity will be normalized using a relative property, and oil sorbed mass by foam mass (g.g−1).
Figure 6 shows that lower density results in higher values for sorption capacity due to the higher void content of materials with lower density. In addition, the sorption capacity was strongly influenced by the time the specimen remained in contact with the diesel. Sorption capacity versus time: (a) S500 diesel and (b) S10 diesel.
After 36 h of testing, all foams presented the best sorption capacity. In addition, PUC showed the best performance of all samples. The variation in the sorption capacity at different times for the same material occurs due to desorption and material heterogeneity. A factor that must be considered when quantifying the sorption capacity of a material is the fluid’s viscosity. In this study, the two types of diesel tested (S500 and S10) had different viscosities. The less viscous S10 diesel easily penetrates through the pores and has a better sorption capacity. However, the S10 characteristics also facilitate the desorption process, as seen after 36 h of testing.
Taguchi approach
The sorption capacity for the two types of diesel (S500 and S10) shows fluctuations since the material parameters and test time varied. The Taguchi approach’s objective was to quantify the influence of each parameter in the current analysis and estimate a prediction method for other combinations of PU proportion and sorbent exposure time.
ANOVA results for S500 sorption capacity.

aPC, percent of contribution.
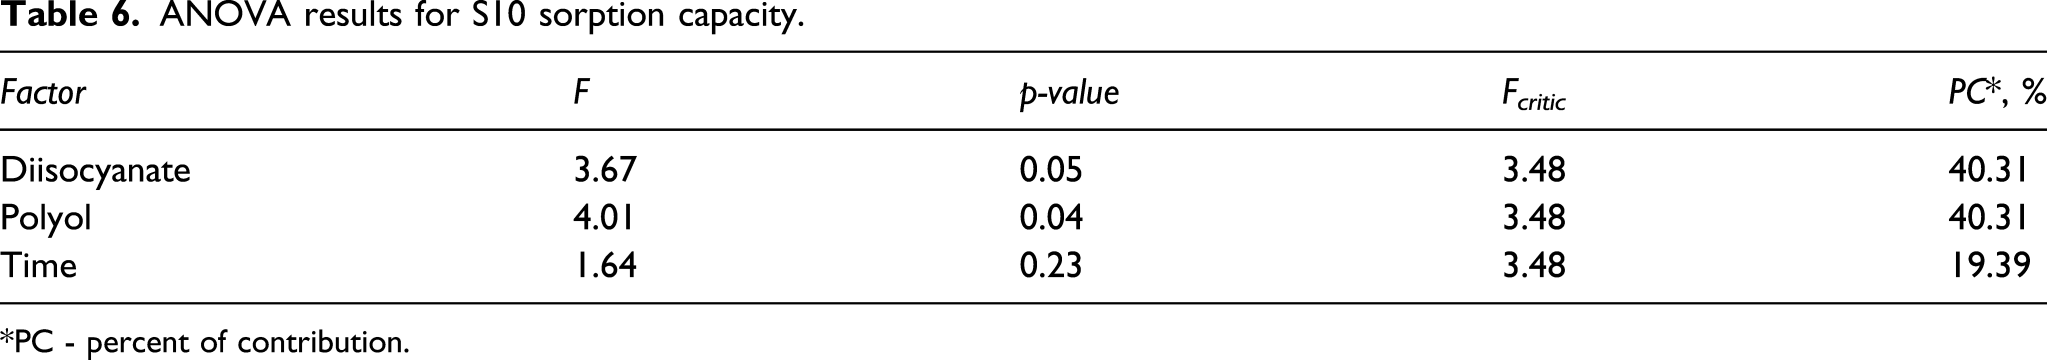
ANOVA results for S10 sorption capacity.
*PC - percent of contribution.
Polyol and isocyanate present the same PC values, which was expected, considering that both parameter variation are proportional to each combination. In other words, an increase in diisocyanate means a relative decrease in the polyol content, resulting in the same influence of the polyol and diisocyanate variations on the response, as shown in Tables 5 and 6. A similar contribution was found for polyol and diisocyanate because both represent a variation in material proportion as if the two parameters represented a single variable. The sum of the contribution percentage for both (polyol and diisocyanate) is greater than 50%, indicating that the change in proportion influences response.
It can be observed in Table 6 (S10 ANOVA results) that all combinations affected the sorption capacity (F >F critic ). The opposite behavior was observed for S10 compared to the S500. The p-values were <0.05 for diisocyanate and polyol, confirming a 95% reliability for the current analysis. Considering the facility with which S10 is sorbed (due to the lower viscosity), the F and PC values are higher for polyol and diisocyanate resulting in less dependency on the exposure time than S500. The material composition shows a greater influence in the S10 sorption capacity than the time parameter because of this type of diesel with lower viscosity.
The RSM was applied to observe the distribution tendency of the sorption capacity (g g−1) according to time (h) and reactants ratio. Figure 7 shows the variation in the isocyanate proportion, creating a direct variation in PU (PUA-E) proportion. There is a high variation in the sorption capacity of S500 (Figure 7(a)), which is strongly influenced by the exposure time and material composition. An acceptable sorption capacity for S500 is observed between 0.6 and 1.2 of diisocyanate (proportionally) after 25–40 h of testing. The S10 sorption (Figure 7(b)) shows a similar tendency based on the ANOVA, where time has a lesser influence on the sorption capacity than the proportions of reactants. A higher sorption capacity for S10 was found in the range of 1.0–1.4 of diisocyanate (proportionally) after 25–40 h of testing. Sorption capacity response surface methodology results for diisocyanate proportion versus time: (a) S500 diesel and (b) S10 diesel.
A higher sorption capacity was observed for the S10 due to its lower viscosity (compared with S500). In addition, S10 showed a better affinity with the different PU compositions, being more suitable for an application, especially for intermediate polyol/isocyanate proportions and more than 25 h of testing. According to the RSM results, the sorption capacity for both types of diesel could be predicted for another polyol/isocyanate proportions and testing times.
Conclusions
In the present study, five different castor oil–based polyurethane foams were synthesized, and varying polyol: isocyanate proportion for the diesel sorption (S500 and S10) was studied. It was observed that different proportions presented distinct void content, distribution of pores, and hydrophobic characteristics. Regarding the morphology and structure of the foams, two distinct characteristics were observed: the PUA-B foams had a flexible structure with a smaller pore size and irregular shape, while the PUC-D-E foams had a more rigid structure, with a larger pore size with regular shape. The PUC presented higher diesel sorption efficiency than other forms due to its lower density from the higher pore diameters, corroborating the higher void content, besides a wider diameter range. The results also showed that higher hydrophobicity is favored in reactions with the same mass proportion of reactants. The sorption tests showed that the maximum sorption capability of diesel oil occurred between 25 and 40 h. The fluid’s viscosity also influenced the sorption capability since the sorption process usually presents a better performance with lower viscous fluids, as S10 diesel. Due to the higher viscosity of S500, the exposure time seems to influence the sorption results compared to S10 diesel. A higher variation of the oil capacity between the exposure times was observed for the foams that showed small pore diameters.
Supplemental Material
sj-pdf-1-ppc-10.1177_09673911211040360 – Supplemental Material for Efficiency of castor oil–based polyurethane foams for oil sorption S10 and S500: Influence of porous size and statistical analysis
Supplemental Material, sj-pdf-1-ppc-10.1177_09673911211040360 for Efficiency of castor oil–based polyurethane foams for oil sorption S10 and S500: Influence of porous size and statistical analysis by Fillip C Alves, Vanessa F dos Santos, Francisco M Monticeli, Heitor Ornaghi, Hernane da Silva Barud and Daniella R Mulinari in Polymers and Polymer Composites
Footnotes
Acknowledgments
The authors are grateful for the research support by FAPERJ (process E-26/010.001800/2015 and E-26/010.101232/2018).
Declaration of conflicting interests
The author(s) declared no potential conflicts of interest with respect to the research, authorship, and/or publication of this article.
Funding
The author(s) received no financial support for the research, authorship, and/or publication of this article.
Supplementray material
Supplemental material for this article is available online.