
Abstract
The dynamic mechanical behavior (storage modulus, loss modulus, and tan δ) of hybrid sisal/glass composites was investigated in the temperature range of 30–210 °C, for two different volume percentages of reinforcement along with the different ratios of sisal and glass fibers. Based on the experimental outcome, an artificial neural network (ANN) approach was used to predict the dynamic mechanical properties followed by a surface response methodology (SRM). The ANN analysis showed an excellent fit with the storage modulus, loss modulus, and tan δ experimental data. In addition, the fitted curves with the ANN approach were used to propose equations based on SRM. The simulation result has shown that the ANN is a potential mathematical tool for the structure–property correlation for polymer composites and may help researchers in the development and application of their data, reducing the need for long experimental campaigns.
Keywords
Introduction
Hybrid composites have been drawing the attention of researchers in the composites field because of their high flexibility in tailoring properties by fiber hybridization. 1 The dependency of the hybrid composite on nature, amount, processing parameters, type of reinforcement, among others, broadens the range of applications of these materials.2–7
In particular, glass fiber/natural hybrid polymer composites combine the high performance of synthetic fibers with the ecological appeal of natural ones. Also, there is an increasing pressure related to the preservation of natural resources and political awareness on exploring green alternatives to decrease global fossil fuel emissions.8,9 Natural fibers arise from natural resources and they fulfill renewability and marketing requirements. From the 80s, composites comprised of thermosetting polymers and natural fibers have been extensively studied and applied in different sectors due to their low density, good processability, low abrasion, and high resistance to corrosion.1,10,11 However, the application is restricted to low-to-medium responsibility components and they cannot fully substitute synthetic fiber composites. To minimize the drawbacks and to broaden the range of applications, there are an increasing number of studies on hybrid synthetic/natural fiber-reinforced composites. When the fibers are adequately combined, some resulting properties can be comparable to pure synthetic fiber composites and may hence partially replace synthetic fibers, depending upon the application.5,12–14
Several key technologies related to fiber hybridization have improved recently. Swolfs et al. 1 state three main developments: (i) new fiber types, (ii) performing technologies, and (iii) simulation tools. Some of the areas that are receiving attention include environmental impact studies, composites with multifunctional properties,15–17 and pseudo-ductile and ductile composites.
In this study, an artificial neural network (ANN) is applied to simulate and predict the dynamic mechanical behavior of sisal/glass hybrid composites. A simple strategy using artificial neural network followed by surface response methodology is proposed to rapidly recognize the dynamic mechanical curves and to predict the behavior of compositions not experimentally tested. This methodology demands fewer data points to achieve more accurate predictions compared to available models in the literature and may help researchers in the development and application of their data, reducing the need for long experimental campaigns.
Artificial neural network
Artificial neural networks are composed of simple elements (or neurons) operating in parallel. This grouping occurs by creating layers, which are connected to each other. Variations can also occur in the connection of these layers. The topological structure of the ANNs is based on a non-linear operation (hidden neurons) from the input information, and so it interprets an output. The learning of the input data is based on real data, and more input data result in a more robust output. By exemplifying, in a hybrid composite containing different overall volume contents, if it has been analyzed the tensile strength of the composites by using the result data (be the stress vs strain curve or only the data points of the tensile strength), it is possible to use all data in the learning process and to predict intermediary overall volume contents.
Each input for a given neuron has an input weight that determines the “strength” of the interconnectivity and, hence, its contribution to the following neurons. ANNs can be trained to perform particular functions by fitting values of the input weights, from information outside the network, or from the own neurons in response to the input data. This is key to the ability to acquire knowledge and memory.
Training the backpropagation algorithm of ANNs
Artificial neural networks can use a series of algorithms required for obtaining the results. In this study, a backpropagation algorithm was used, which is based on the calculation of the error on the output layer of the neural network and the recalculation of the value of the weight vector of the last layer of a neuron, and then proceeding to the previous layers, updating all weights.
The algorithm can be used to train these multilayers with different transfer functions and to develop an approximation function, model association, and pattern of the models. Backpropagation is referred to as the process derived from the network error, with respect to the network weight and biases. ANN training by backpropagation involves three stages: (i) feedforward of the standard training input, (ii) backpropagation calculation of the associated error, and (iii) errors fit. This process can be used with a different number of optimization strategies. Figure 1 schematically illustrates a conventional network configuration with three layers: input, output, and hidden layer. Illustration of an artificial neural network containing the input, hidden, and output layers [based on
18
].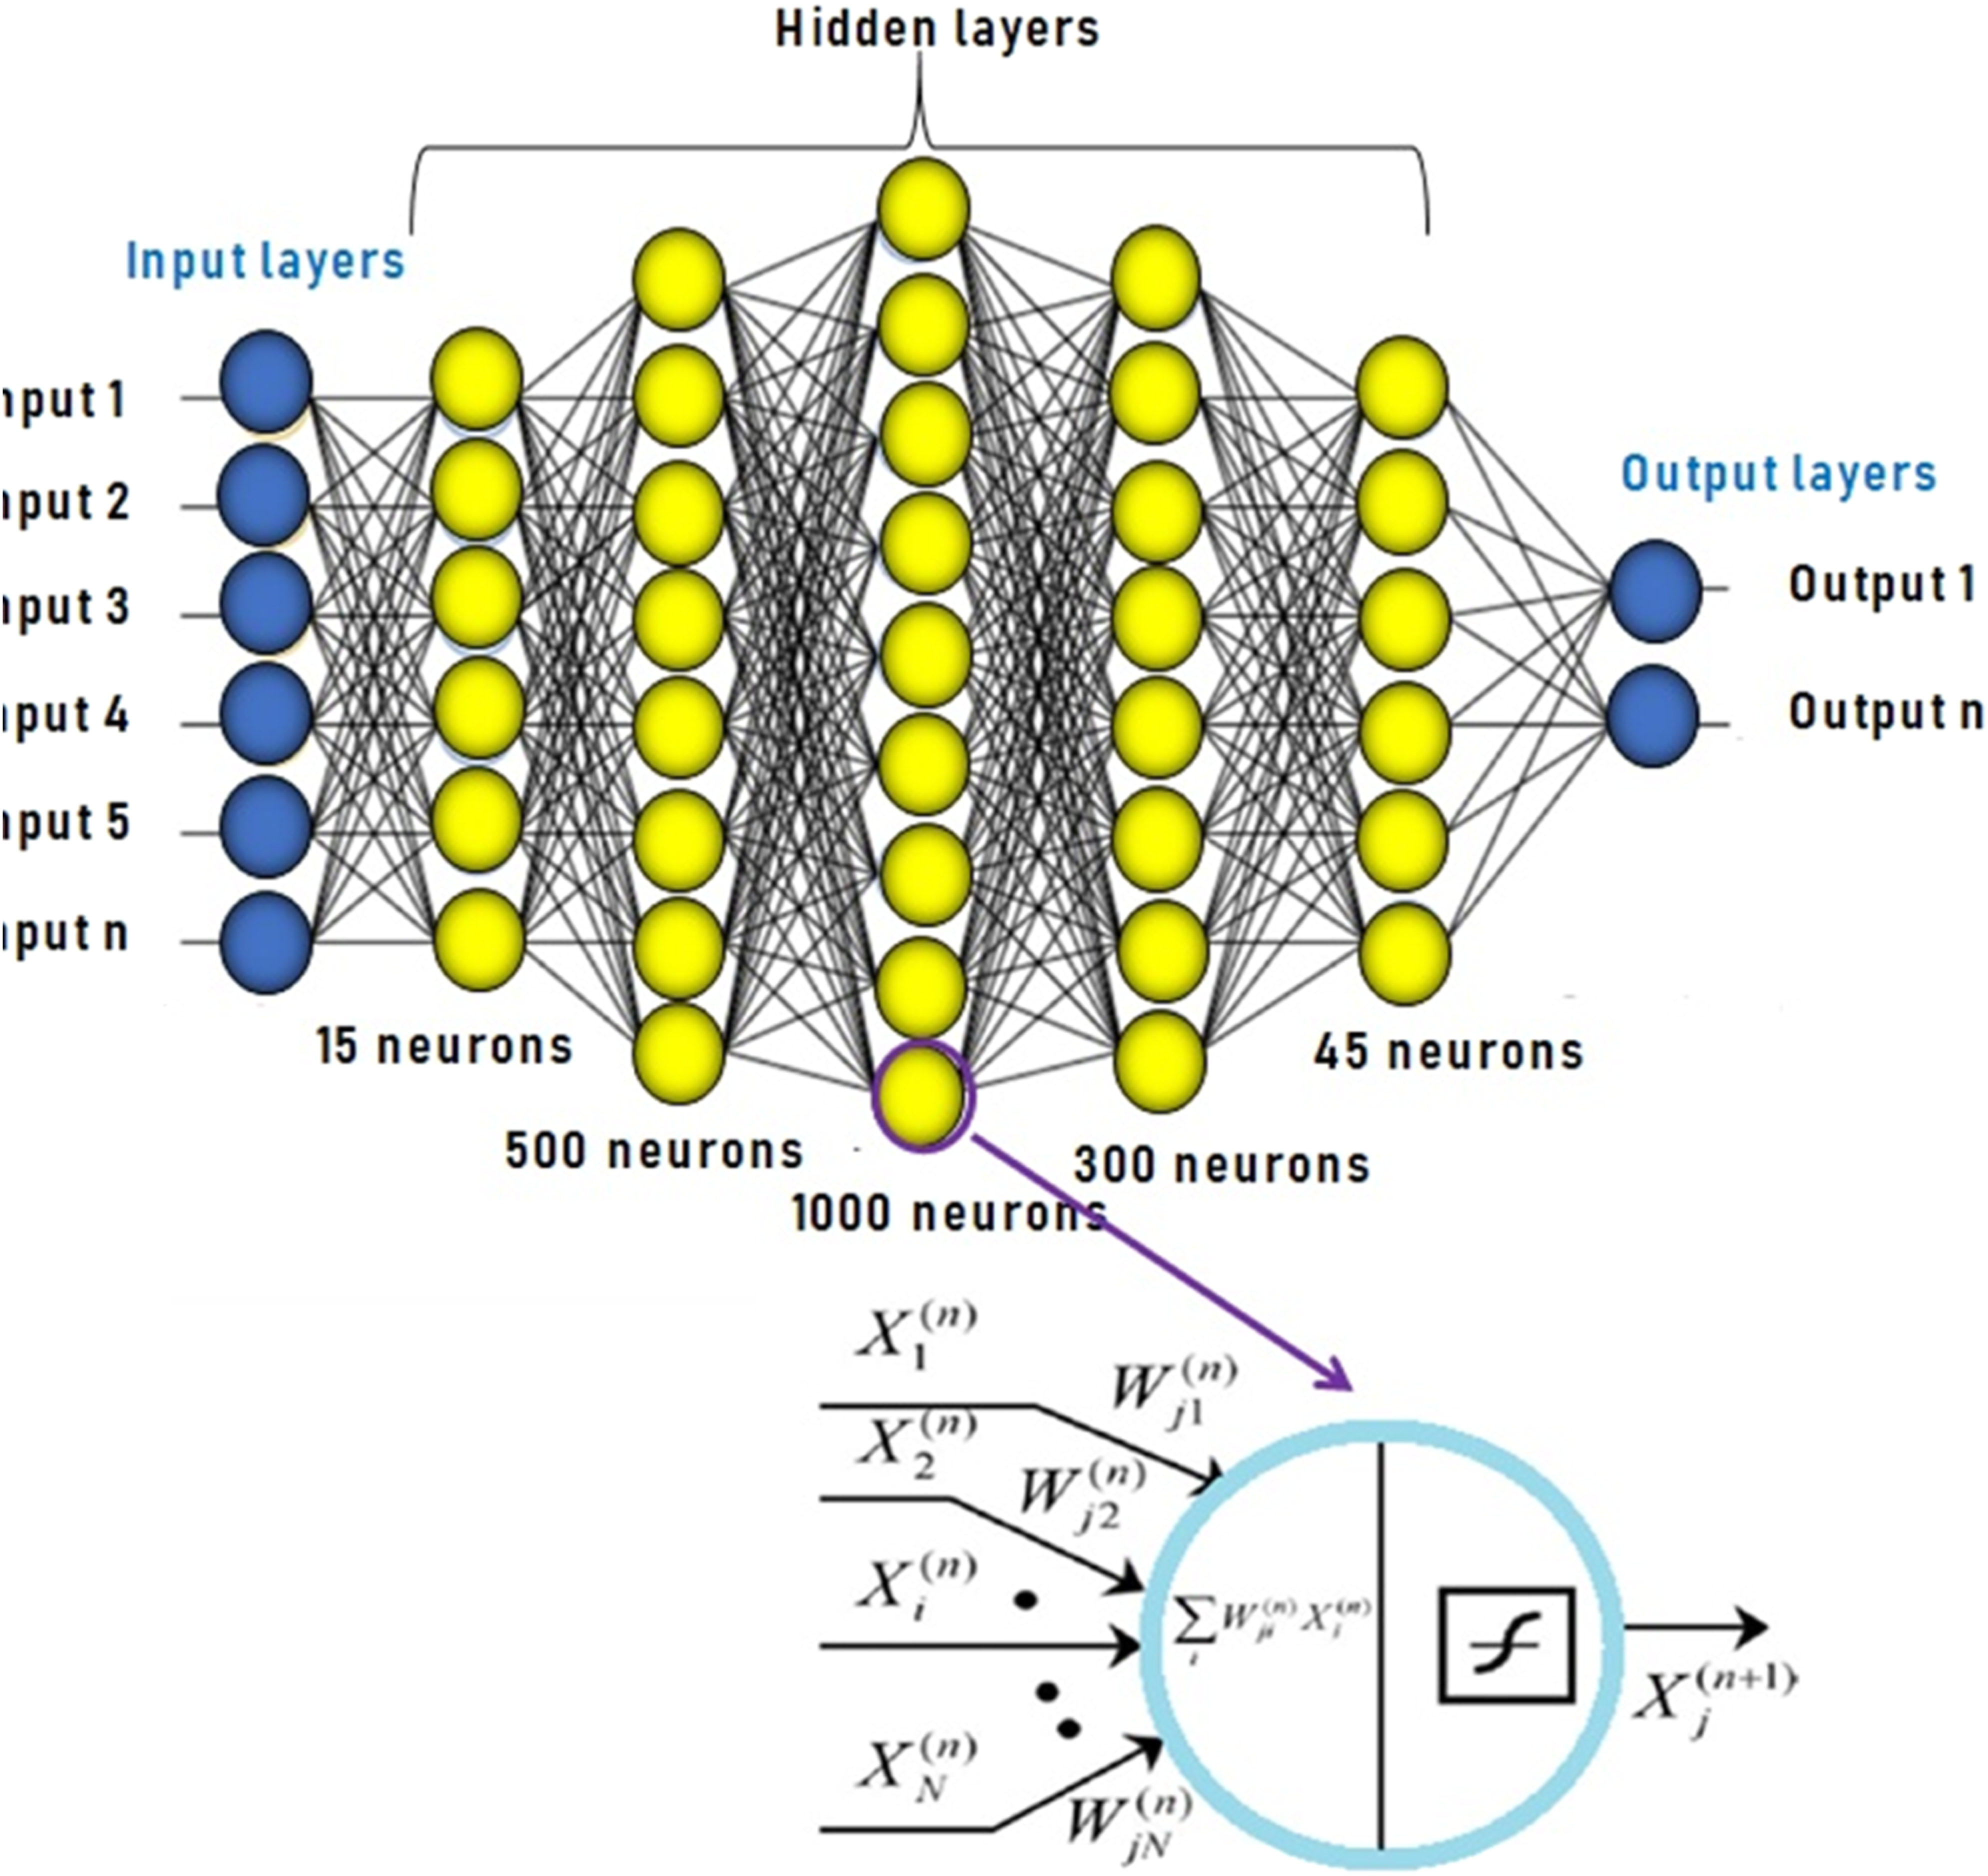
Hidden layers can contain one or more layers for a practical purpose. Each layer has a different number of neuron elements. As in nature, the function of the network is widely determined by the connection among these elements. The correlation between the input vector


The total sum of the error E is measured under all patterns in a training pattern, in which d
p
is the output predicted to the pth way and o
p
is the measured output. In the minimization process, all weights of all connection nodules are fit until the desired error or until the maximum number of cycles is reached. The algorithm used as an example is given in equation (3)


Materials and methods
Specifications of the materials used in this study.
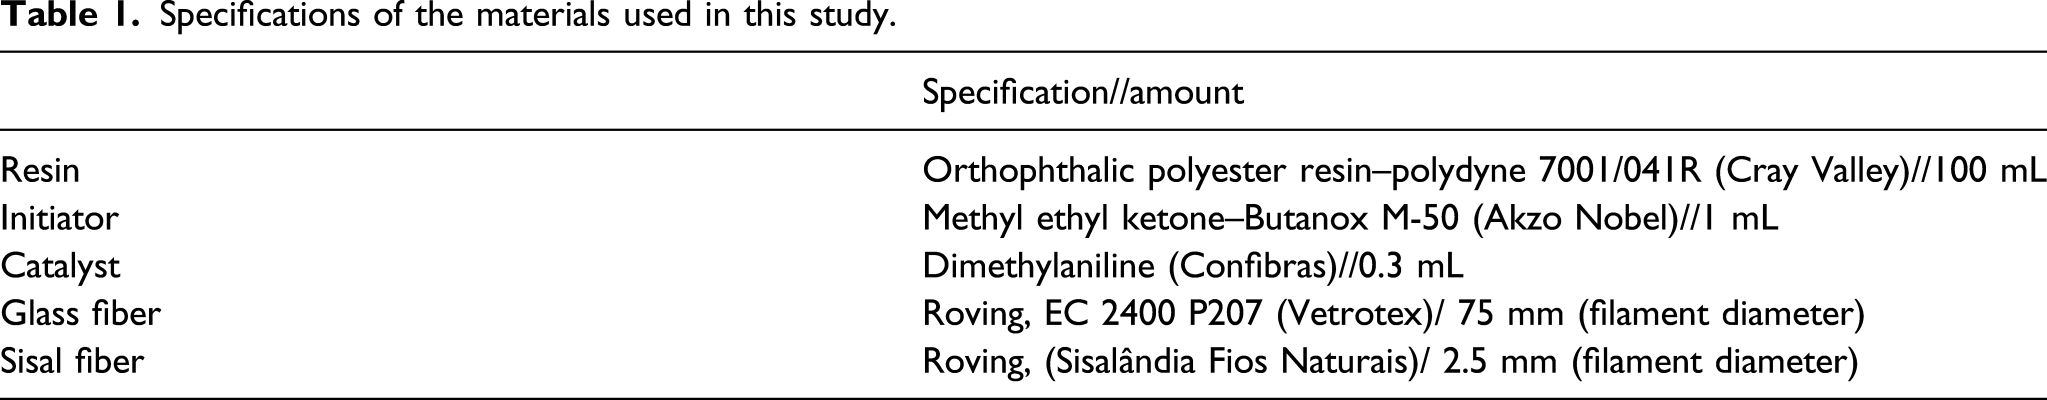

Illustration of the produced hybrid composites.
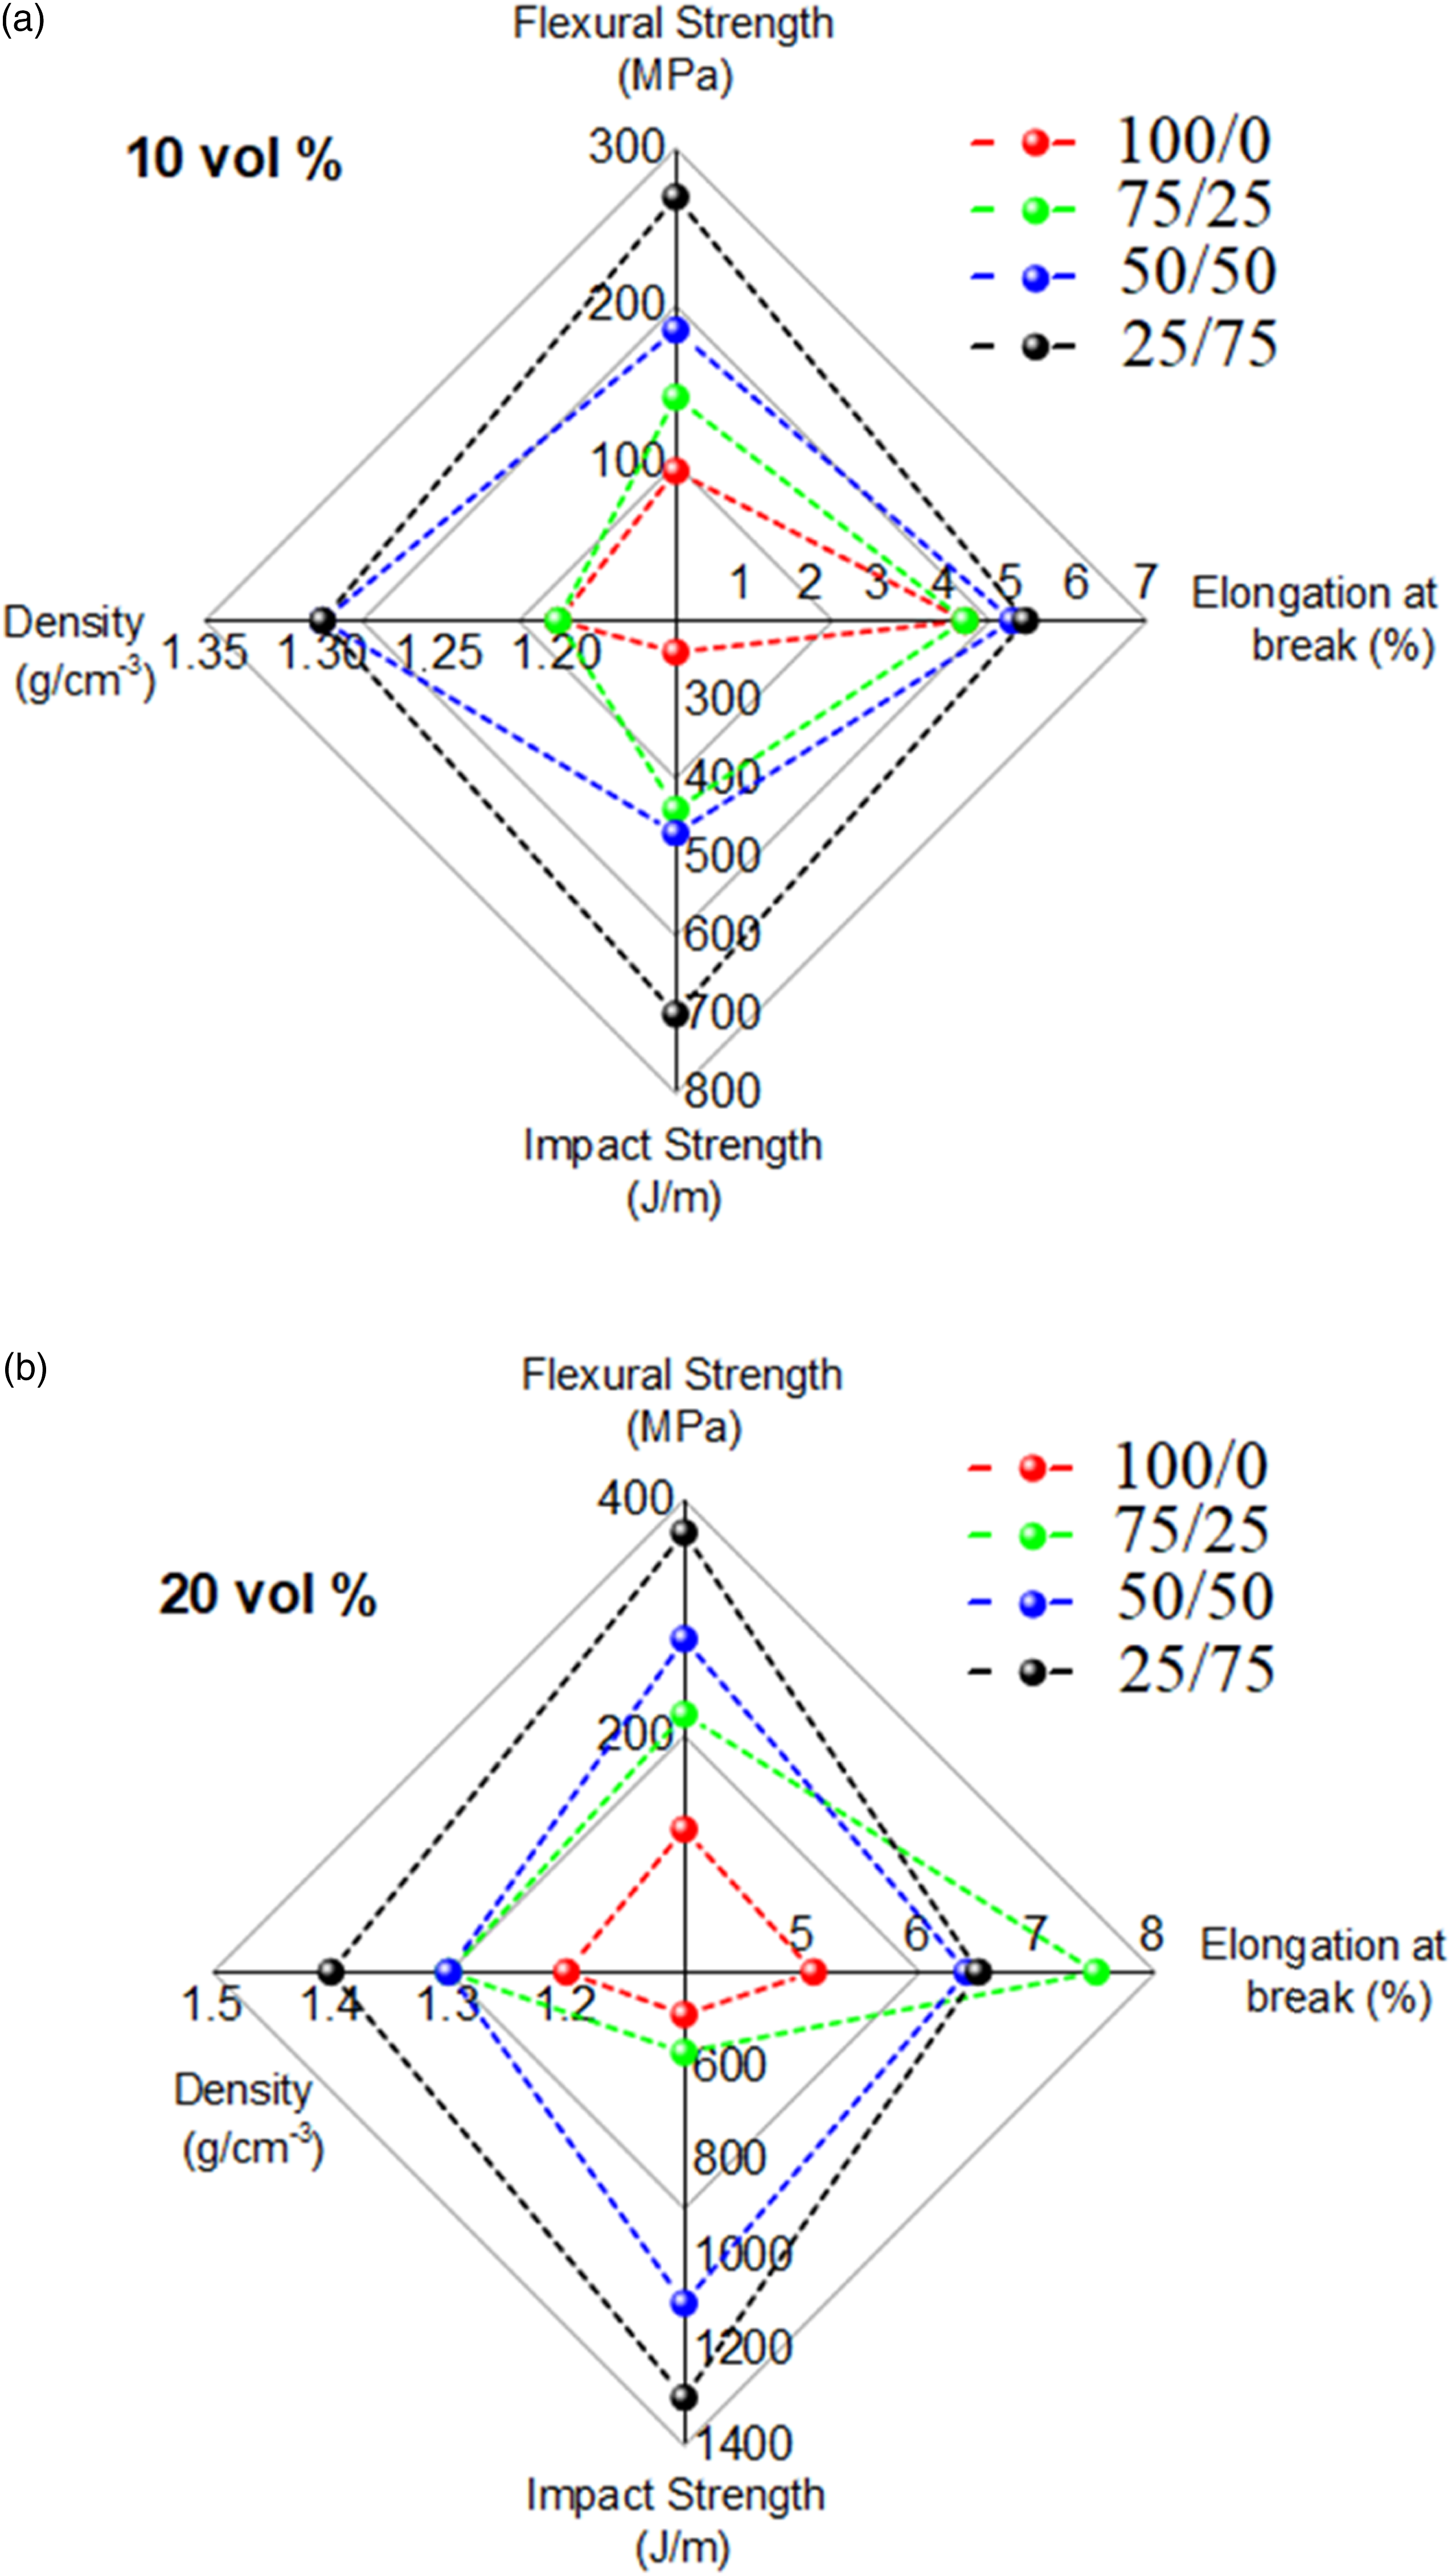
Compiled mechanical properties data for the studied composites for overall fiber sisal/glass content of: (a) 10 vol% and (b) 20 vol% (extracted from 19 ).
Specifications of the artificial neural network approach used in this study.

Results and discussion
The dynamic mechanical properties (storage modulus, loss modulus, and damping factor) of the studied hybrid composites are represented in Figure 4. Higher storage modulus (E´) in the glassy region is obtained with the increase of the overall fiber content and for higher relative glass content. This is mainly due to more restrictions imposed by the fiber and the intrinsic (higher) properties of the synthetic fiber. At higher temperatures, molecular mobility increases and the ability to store energy decreases. At Tg, an abrupt drop is observed for all composites. In the previous study,
19
the relative measurement of the decrease in the storage modulus was calculated, and the results indicated lower values (meaning a lower difference among the values) by fiber content and glass incorporation. With the increase in fiber content, fewer matrix-rich regions are present, resulting in a more efficient distribution of load throughout the matrix. Also, the increase in glass fiber content in the composites increases molecular restriction and chain rigidity. Then the curves show a plateau in the elastomeric region for all samples. Storage modulus, loss modulus, and tan δ curves for (a) 10 vol% composites; (b) 20 vol% composites.
19
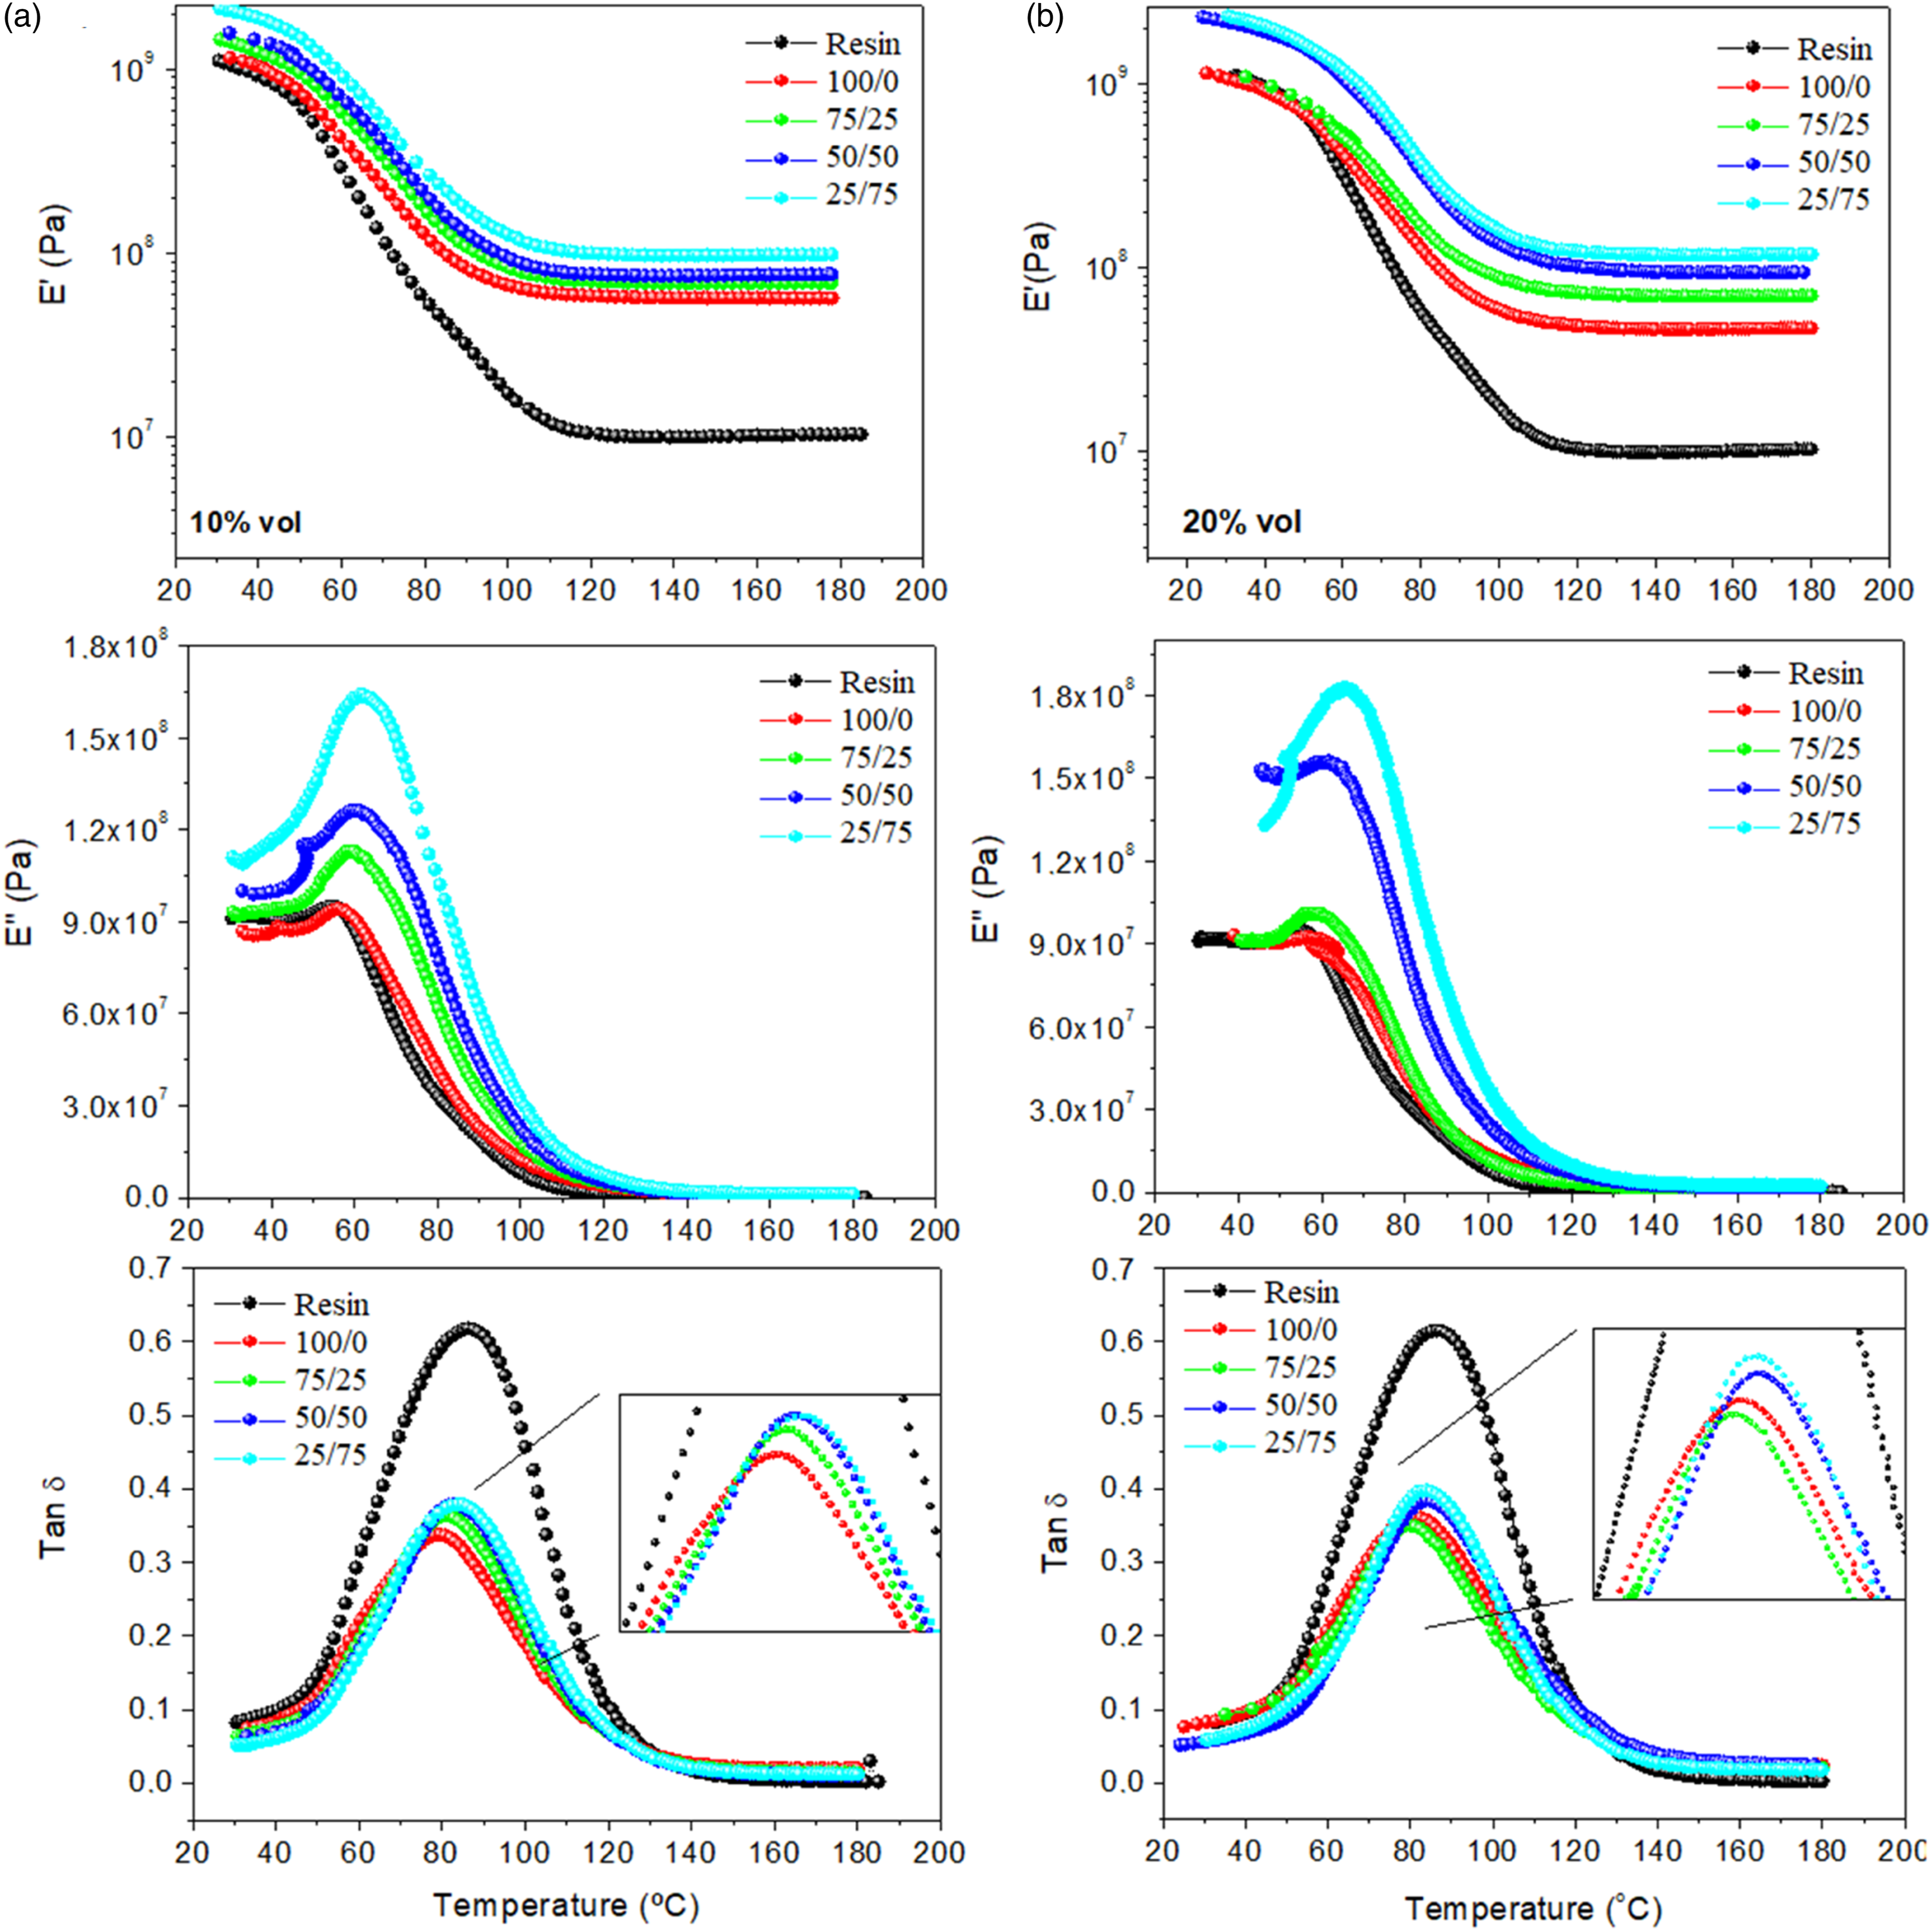
The loss modulus is more sensitive to molecular motion and therefore the broadening of the peak with glass incorporation can be associated with the inhibition of the relaxation process (corroborated by the lower E′ difference in the glassy and elastomeric regions). Glass fiber yields more constraining on the segmental mobility of the polymeric molecular chains at the relaxation temperatures compared to sisal fiber, which broadens the loss modulus peak. This is also expected considering the better adhesion (due to the coupling agent) for the glass fiber compared to sisal (used without any surface treatment). The greater the energy stored in the glassy region, the higher the energy dissipation when molecular mobility takes place.22,23
From Figure 4, it can be seen that the peak of tan δ of the hybrid composites is always below that for the neat polyester resin. The stress is transferred from the matrix to the fibers through the interface; hence, the lower peak can be indirectly associated with the reinforcement effect of both fibers that impose constraints to the molecular motion, restricting energy dissipation in this region. For the neat resin, the relaxation process is dependent only on the amorphous molecular chains, and therefore greater dissipation occurs.24,25
A datasheet was built with the experimental results shown in Figure 4
26
using the two input parameters (E´vs T, E” vs T, and tan δ vs T) and the own curves as output. The ANN fit showed an excellent agreement with the experimental data (Figure 5(a)). In Figure 5(b), the regression plot shows the effect of adding another variable to a model that already has one or more independent values, resulting in an excellent fit. In the residual plot (Figure 5(c)), the residuals are plotted on the y-axis while the independent variables are plotted on the x-axis. (a) Experimental dynamic mechanical behavior for 50:50 composite (10 vol%) and artificial neural network fit, (b) regression plot, and (c)–(f) residual plots.
Statistics and cross valid data of artificial neural network approach for the 50:50 composite containing 10 vol% reinforcement (similar fitting values were obtained for all samples).

The rule of mixtures (ROMs) can also be used to predict composite properties and is widely used. Nevertheless, ROM has some drawbacks because it usually does not take into account non-homogeneity in fiber diameter, misalignment of fiber orientation, voids, fiber anisotropy, yarn twist angle, available fiber stress transfer area, fiber curvature, among others. Also, for natural fiber composites, the variation in physical and mechanical properties is significant and the fiber/matrix adhesion is far from perfect, leading to greater deviation, and therefore, the modification of existing ROM models is needed to improve the predictive accuracy.27,28 On the other hand, ANN models are able to fit curves without any previous knowledge of the physical meaning of the process. The possibility of predicting new data is based on previous input data; hence, any unexpected variations in the original dataset are taken into consideration and reproduced in the output dataset. This broadens the ANN range of applications, allowing the prediction and optimization of material properties before testing. Another interesting feature is that the property analysis (as ANN combined with SRM) can provide additional help in the prediction and reduction in the experimental campaign.29–32 A well-trained ANN may contribute to the prediction of the mechanical behavior of hybrid composites with sisal/glass fiber ratios other than those experimentally produced, reducing the cost and time of experimental campaigns.
The surface response methodology was performed based on the ANN and experimental E′, E″, and tan δ curves. Figure 6 represents the obtained SRM curves for sisal/glass fiber ratio (y-axis) and temperature (x-axis). The storage modulus (Figure 6(a)) presents a linear increment according to the increase in glass fiber content for composites with 10 vol% reinforcement. Surface response trend behavior of artificial neural network data for composites with 10 vol% ((a) E′, (c) E″, and (e) tan δ) and with 20 vol% ((b) E′, (d) E″, and (f) tan δ).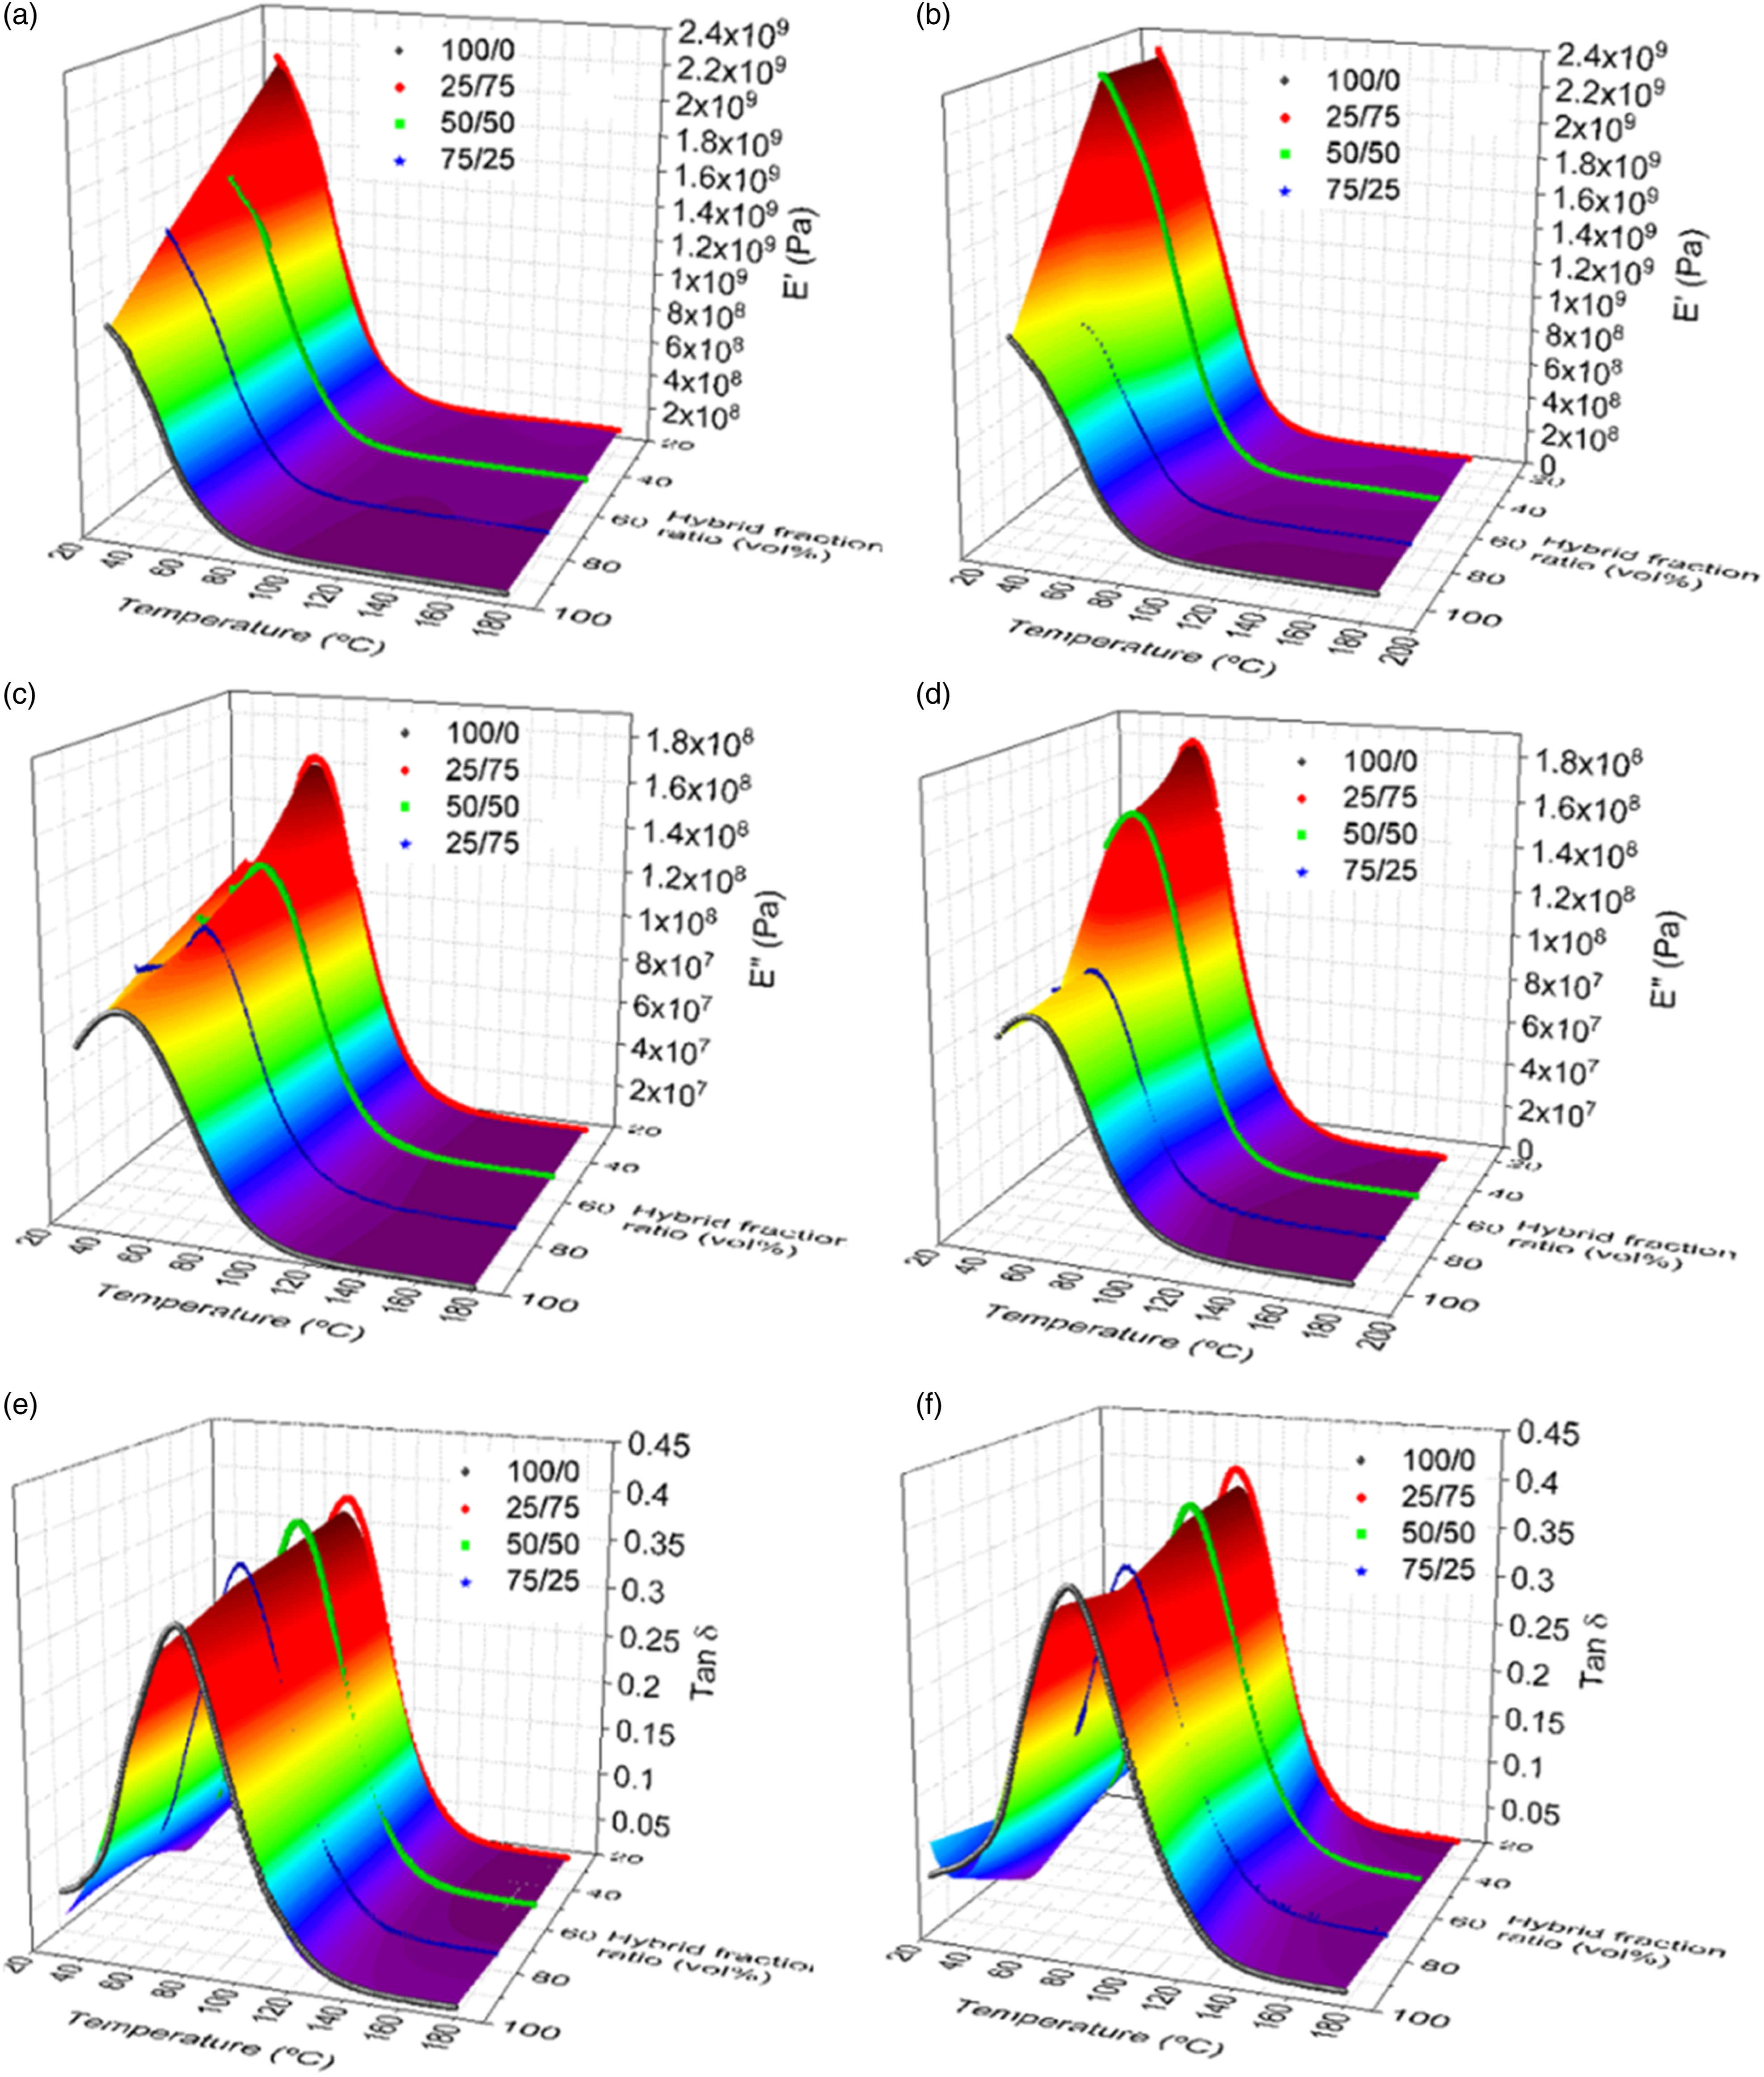
The increase in reinforcement content to 20 vol% (Figure 6(b)) modifies the aforementioned behavior, keeping the same dynamical mechanical behavior between the sisal/glass ratios of 50:50 and 25:75. For 20 vol%, the hybrid ratio only influences the storage modulus up to 50% (v/v). After that, the addition of glass fiber reaches a saturation level. This saturation with glass fiber addition is also observed for the loss modulus and tan δ prediction for the 20 vol% reinforcement, whereas a more linear trend was observed for the 10 vol% reinforcement. All curves showed a coefficient of determination ratio of R 2 > 0.9.
Figure 7 presents the SRM based on ANN data, for the 50:50 of sisal/glass hybrid composites. E′, E″, and tan δ showed a linear increment with the increase in the overall reinforcement content. Surface response trend behavior of artificial neural network for the 50:50 hybrid composite: (a) E′, (b) E″, and (c) tan δ.
Conclusion
This work focused on the prediction of E′, E″, and tan δ behavior of hybrid composites produced with sisal/glass fibers and polyester resin, applying an ANN combined with the surface response method. A three-dimensional prediction of their dynamic mechanical response with the variation in temperature, hybrid ratio fraction, and reinforcement fractions was also studied using the ANN-based approach. The ANN analysis showed an excellent fit with the experimental data and indicated that it is possible to reduce the experimental campaign, showing the optimum combination of overall reinforcement content and hybrid ratio, maintaining statistical relevance. From the results presented here, it is possible to conclude that the ANN is a potential and powerful mathematical tool in helping study the properties of polymer composites.
Footnotes
Acknowledgments
The authors would like to thank Universidade de Caxias do Sul (UCS) for the DMA analysis, and CAPES, FAPESP, and CNPq for the grants.
Author contribution
Declaration of conflicting interests
The author(s) declared no potential conflicts of interest with respect to the research, authorship, and/or publication of this article.
Funding
The author(s) disclosed receipt of the following financial support for the research, authorship, and/or publication of this article: Funding Sources Fundação de Amparo à Pesquisa do Estado de São Paulo, Coordenação de Aperfeiçoamento de Pessoal de Nível Superior, Conselho Nacional de Desenvolvimento Científico e Tecnológico.