
Abstract
Dynamic mechanical analysis (DMA) is an essential procedure for characterizing the performance of composites and effectively simulate with the real-world applications. This research work aims to characterize the dynamic mechanical (DM) properties of sisal fiber reinforced polyethylene terephthalate (PET) composites as a factor of fiber content and fiber surface modification. The effect of elevated processing temperature (>260°C) on the thermal degradation of sisal fibers is also analyzed. To study the effect of sisal fiber loading, PET composite specimens; one with 25% by weight fraction of raw sisal fiber (w/w), abbreviated as 25% RSC and the other with 40% by weight fraction (w/w) of raw sisal fiber, hereafter abbreviated as 40% RSC, were prepared by injection molding. Similarly, to analyze the impact of fiber surface modifications, PET composite samples containing 40% by weight fraction (w/w) of alkali-treated sisal, hereafter abbreviated as (40% Al-SC), and 40% by weight fraction (w/w) of a combined alkali/acetylation-treated sisal, hereafter abbreviated as (40% Al-ASC), were prepared. It was found that the fiber volume fraction and fiber surface modifications affected the DM properties of the produced composites. The improved storage module and glass transition temperature (Tg) with minimized damping has been demonstrated by increasing fiber content. With the same 40% fiber content, the composites produced from modified fibers enhanced the storage modulus and Tg values. However, with increasing temperature, the storage modulus decreased, the loss modulus increased, and the damping factor increased with composites containing higher fiber content and surface modified fibers. This indicates the low thermal stability of the sisal fiber and the interface damage at elevated temperatures.
Keywords
Introduction
Every aspect of modern life relates to the materials and the benefits of advances in materials engineering, characterization, and modeling. Automobiles, aerospace industries, building technologies, electronics, medical devices, pharmaceuticals and so on rely on materials and the advancements in materials characterization. Today’s modern technologies require materials not only for their strength and performance, but also for specific desires of safety to humans and the environment.1,2 Composites are one of the most widely used category of materials in several industries including automotive, aerospace, construction, military and so forth. Fiber reinforced polymer composites (FRPC) constitute a significant share among the variety of composite types. FRPCs are composed of reinforcement fibers embedded with polymeric matrices.3,4 Glass, carbon, and aramids are the most widely exploited reinforcing fibers for the automotive and aerospace industries because of their excellent mechanical and end-use performance properties.3-7 However, synthetic fibers have certain drawbacks such as non-renewable, non-biodegradable, carcinogenic and cause respiratory complications in humans, and increase the abrasion rate of the machine.1-7 As a sustainable solution to such issues, natural fibers receive particular attention from industry and scientists. 8 Besides, other determinants include government environmental regulations.1-3,5,9-11 A study by Holbery and Houston showed that the European Union (E.U.) and Asian countries issued strict guidelines regarding end-of-life requirements of automotive body parts. It aims to apply for natural fiber-reinforced plastics in auto body parts and reuse them after life. 12 According to Zhao and Zhou, and Mahato et al., all major automakers, including Daimler Chrysler, Volkswagen, BMW, Ford, General Motors, Toyota and Mitsubishi have tried to integrate bio-composites into automotive components.13,14
Although natural fiber composites attract industries to widespread applications, their use as reinforcing materials in polymers is still limited. The primary problems are poor compatibility and weak interfacial strength between the hydrophilic natural fibers and the hydrophobic matrix.9-13 The lack of an established supply chain, standardization, and available test data for a sort of composite formulations are other vital issues. 13
Dynamic mechanical analysis (DMA) is a method for characterizing materials based on temperature, time, frequency, stress, and a combination of these parameters.15-25 It enables the response of the material to stress, temperature, and frequency with the application of a small cyclic deformation. The outputs from the DMA test are storage modulus (E′), loss modulus (E″), and damping or loss factor (tanδ). As explained by Ashok et al., in a cyclic deformation, a material’s capacity to keep energy is called a storage module, E′.20,26,27 It indicates the stiffness behaviors and load-bearing ability of the composites. The rate of energy disseminated in the form of heat by the materials is termed as loss modulus, E″, which represents the viscous response of the composites. Energy dissipation depends on many factors, such as fiber structure, matrix structure, state of the interface and frictional resistance at the fiber-matrix contact, fiber breakage and matrix cracking. Thus, it can be said that higher energy dissipations are an indication of poor fiber-matrix interface.20,26,27 The property of the material at dampening or dissipating energy is called tanδ or loss factor.20,26,27 It refers to the molecular mobility of materials. Its characteristic feature is the relationship between the loss and the storage modulus. The larger estimation of tanδ is described by the high molecular movement among the interfaces.26,27
The Perkin Elmer and TA instruments explained the viscoelastic behavioral regions for a typical DMA output graphically as illustrated in Figure 1. In the figure, the area between the initial temperature and the onset of the curve E′ is the glassy part. Here, the sample is hard, elastic, and rocky. The glass transition zone is characterized by a softening of the material, a sharp reduction of E′, maximum peaks of E″ and tanδ. In the rubbery region, the sample is springy, thick, and soft like a putty. The backbone of the polymer matrix shows a progressive slippage. In the viscose region, the material flows like a fluid and large-scale molecular chain mobility occurs.15,19,20,26,27

Many studies have been carried out concerning the characterization of the viscoelastic phase change (DMA) behaviors of natural fiber reinforced polymer composites.14-27 Da Luz et al., examined the DM properties of coir fiber-reinforced composites. 16 Thomas et al., studied the DM properties of sisal fiber reinforced polyester composites produced by resin transfer molding. 18 Reddy and Reddy studied the DMA of a polymeric composite reinforced with hemp fibers. 19 Ashok et al., discussed the effect of fiber content and fiber surface treatment on the dynamic mechanical properties of sisal-fiber reinforced polypropylene (PP) composites. 20 Devi et al., also studied the DM properties of polyester composites reinforced with pineapple leaf fibers. They reported variation in E′ with temperature, increase in E′ with increased fiber volume and improved Tg values. 21 Li et al., experimented with the effect of sisal fiber surface treatment on the properties of polylactide compounds reinforced with sisal fiber. 22 Bassyouni characterized the DM properties of chemically enhanced sisal fiber strengthened PP composites. 23 Kalusuraman et al., also investigated the dynamic-mechanical properties as a function of Luffa fiber content and adhesion in a polyester composite. They concluded that increase in fiber content and fiber surface treatment improved the storage modulus, loss modulus and damping behavior due to the restricted mobility of the polyester molecule and enhanced fiber-matrix adhesion. 27
This research aims to characterize the DM properties of injection-molded PET composites reinforced by sisal fiber. It considers the effects of fiber volume fraction and fiber surface modifications on DM properties. It also investigates the level of thermal damage to sisal fiber caused by using high temperature during the manufacture of composite samples. For the analysis, thermogravimetric analysis (TGA) results of the differently treated sisal fibers were coupled with the PET melting temperatures used during the extrusion and injection molding processes. Finally, based on the outcomes of the characterization, potential application areas were concluded.
Materials and methods
Materials
Industrial quality sisal fiber was purchased in the lap form from Seilerei SAMMT Elsterberg, Germany. The chemicals used to change the surface of the fibers, namely glacial acid, sodium hydroxide, acetic anhydride, and sulfuric acid, is commercially available and used with no adjustment. The polyethylene terephthalate (PET) used was purchased as a granular material. It is a PET co-polymer called PAPET COOL with a density of 1.4 g/cm3 and a melting point of 245 ± 3°C. It has excellent processability and optical clarity, high resistance to stress cracks, toughness and excellent thermal stability.
Experimental
To scrutinize the effect of fiber loading on the DMA of the composites, a raw sisal with fiber volume of 25% w/w and 40% w/w was considered. Alkalization and combined alkaline/acetylation treatment of sisal fibers were conducted to investigate the effects of fiber surface modification on the DMA of the resultant composites. Raw sisal chopped to a length of 3–5 cm was used. The alkaline treatment was carried out with 10% w/w (0.2 M) NaOH at 50°C for 2 h with a material to liquor ratio of 1:5. Finally, it was washed with distilled water, diluted with acetic acid droplets to neutralize the pH, and dried at 80°C overnight. The acetylation process was conducted on the alkalized sisal fiber. It was initially immersed in glacial acid for 1 h and then transferred in a solution containing 250 ml of acetic anhydride and 0.1% w/w of sulfuric acid, about 5 min. The last process consisted in washing until pH neutral and drying at 80°C for 24 h.
Composite preparation
For the production of untreated sisal-reinforced PET composites, 25% w/w and 40% w/w raw sisal was used. Similarly, sisal-PET composite samples were produced from a 40% w/w of alkaline-treated and alkaline/acetylation-treated sisal fibers. The former formulation was used to study the effect of fiber content while the latter was used to investigate the effect of surface treatment. The mixing was achieved using HAAKE PolyLab OS RheoDrive 7 twin-screw extruder. Since the extruded pellets were large and unsuitable for feeding the injection molding machine, an appropriately sized crushing was conducted for feeding to the injection system. It was made using a DREHER S15/20L milling machine with a size of about 5 mm for a suitable supply to the molding machine. Prior to injection molding, the crushed pellets were taken into a vacuum dryer and dried to 80°C for 72 h to minimize the effect of moisture. Lastly, tensile specimens were prepared with the ARBURG 320 C injection moulding machine based on the ISO 527 type 1A sample size.
Characterization of DM properties
DMA of the composite specimens was performed using the TA Instruments DMA Q800 V21.3 Build 96 modulated by multi-frequency deformation using a single overhang flange. It was conducted by varying temperature ranging from 20°C to 200°C, with the Ramp method, a heating rate of 2°C/min at a constant deformation frequency of 1 Hz. The dimension of the test specimens, adopted from ISO 6721-11, 28 was 50 × 10 × 4 mm, cut from the center section of an ISO 527 type 1A tensile bar. From the DMA test results, the storage modulus, E′, loss modulus, E″, loss factor, tanδ, glass transition temperature, Tg, and viscoelastic phase change responses of the composites were evaluated.
Result and discussion
Optimal sisal fiber content selection
The optimal fiber volumes of 25% and 40% w/w were used in this study. The tensile strength and tensile module were used to select the best mix of sisal and PET. Initially, the optimization of sisal fiber content was carried out with a sisal fiber weight fraction of 10%, 20%, 30%, 40% and 50% (w/w). Table 1 displays the mean tensile strength and modulus values with the corresponding sisal fiber volume for the RSC, Al-SC, and Al-ASC samples. As can be seen in the table, the maximum tensile strength of the RSC was between 20% and 30% fiber volumes.
The average tensile strength (σ) and tensile modulus (E) values for sisal fiber reinforced PET composites produced with different sisal fiber volume.
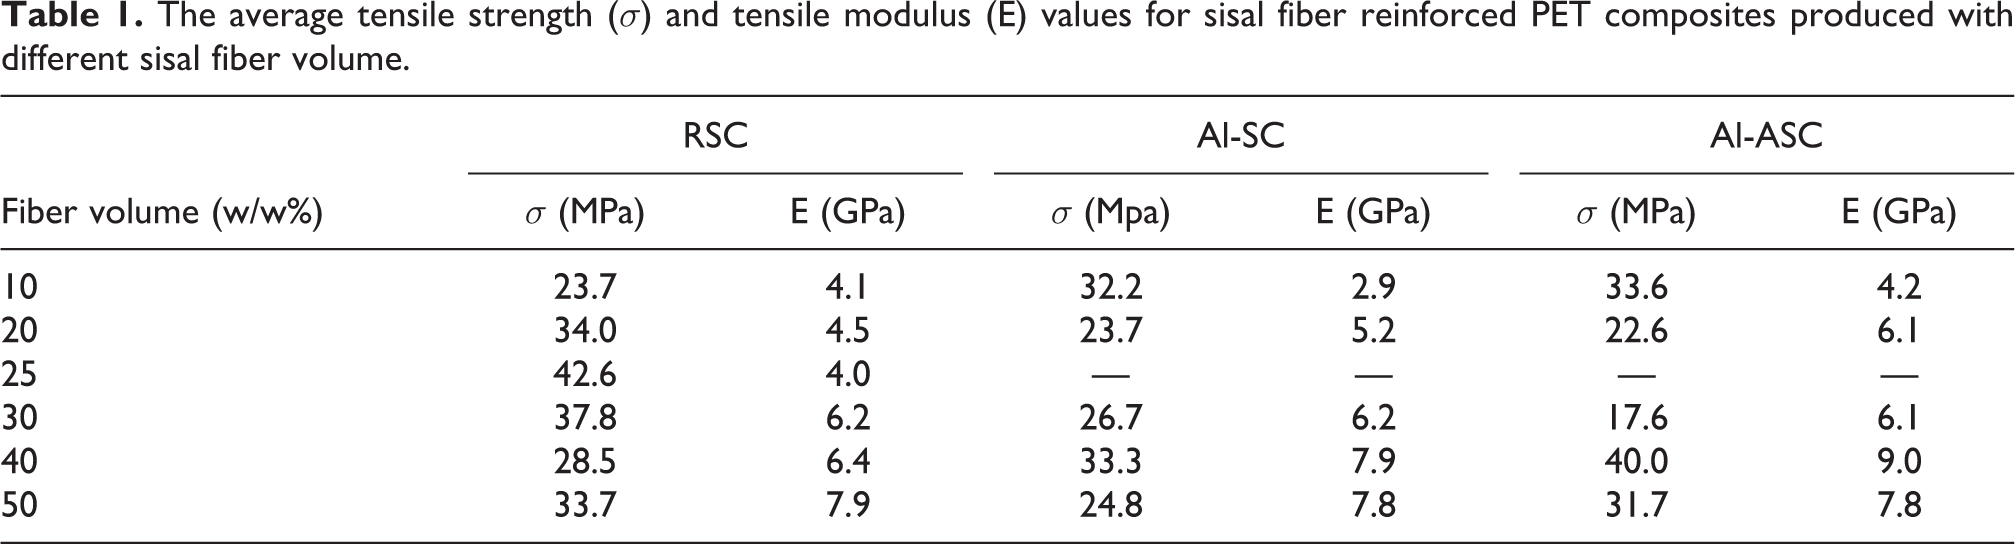
This is why the production of a composite with 25% raw sisal was necessary, which registered the maximum tensile strength as expected. As shown by the numbers, the 25% RSC and 40% Al-ASC composites recorded improved tensile strength and were therefore selected for this study.
Damage level of sisal fiber during thermal processing of Sisal-PET Mix
One of the biggest challenges of using natural fibers with thermoplastic resins like PET is the thermal deterioration of natural fibers because of the elevated melting temperature of thermoplastic polymers.29-32 As the investigators also pointed out, thermal treatment of natural fibers above 200–230°C caused damage to cellulose.33,34 For example, Azwa and Yousif examined that approximately 60% of the thermal decomposition of natural fibers occurred within a temperature range of 215°C to 310°C. 31
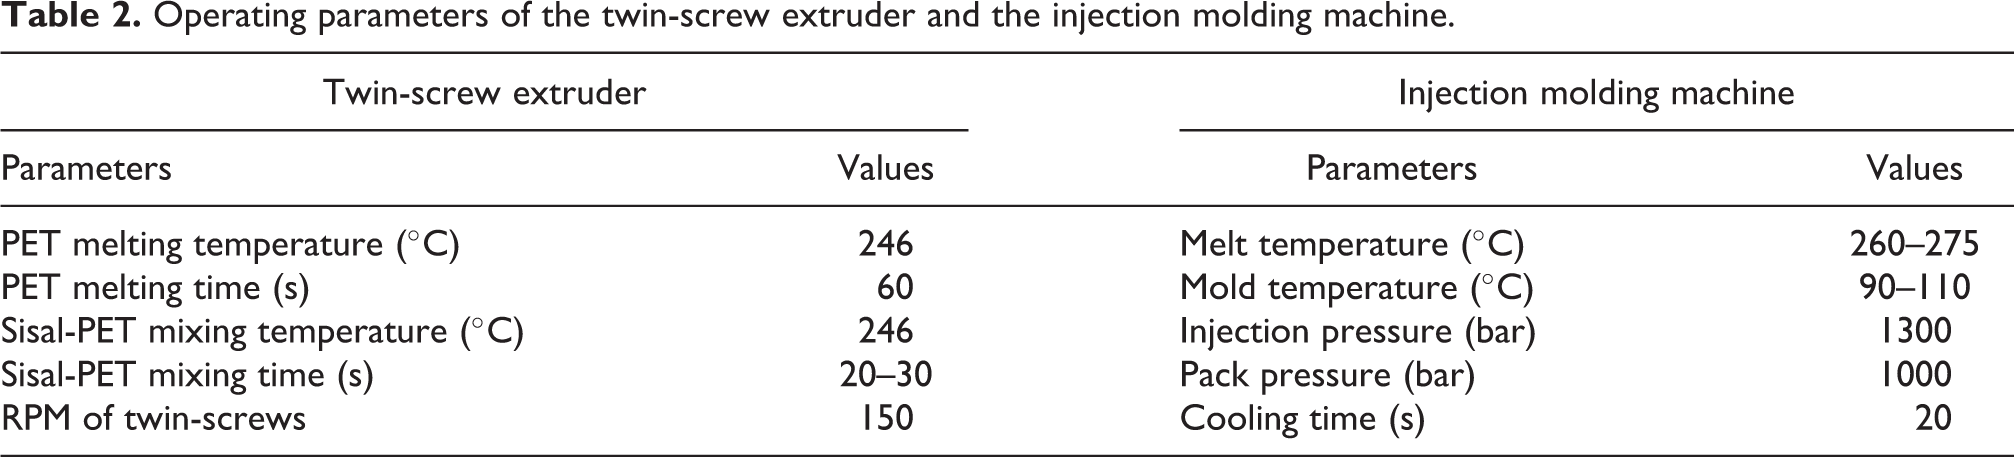
Because of the high melting temperature of the PET polymer, thermal damage of sisal fiber has occurred during the twin-screw mixing and injection molding processes. This can be evidenced by the TGA results of the studied sisal fibers. 30 Table 2 presents the operating specifications of the twin-screw extruder and the injection molding machines. Since the processing temperatures are lower than the maximum decomposition temperature of sisal fiber, and slightly above its onset values, there is some level of damage to the fiber. 30 Studies show that, the damage is accompanied by the dehydration combined with the emission of volatile components, initiated at a temperature of about 260°C.31-34 According to the TGA based thermal analysis of the neat and surface modified sisal fibers considered in this study, 30 the total weight loss of the fibers at the 246°C (during mixing) and 275°C (during injection molding) is 12.6%, 11.0% and 14.5% for the raw, alkaline-treated and alkaline/acetylation-treated sisal fibers, respectively in which some of the loss is due to the dehydration and emission of volatiles. It can therefore be concluded that the damage to the fiber caused by both processes could be tolerable. However, further works should be conducted with emphasis on fiber modifications to enhance the thermal stability of sisal fiber.
Operating parameters of the twin-screw extruder and the injection molding machine.
Effect of fiber loading and surface modification on the DM properties of Sisal-PET composite
Figure 2 illustrates the DM properties of all composite specimens. But to make the comparison simple, the plot is divided in the discussion of each section.

The stacked (all in one) plot of the DM properties of the produced composite samples.
Effect on the storage modulus
The plots of the storage module (E′) versus temperature at different fiber contents and fiber surface modifications are presented in Figure 3. With reference to Figure 3(A), compared to RSC with a fiber load of 25%, there is a considerable improvement in E′ for RSC with a sisal fiber content of 40%. As storage modulus characterizes energy stored in stable state of material, 26 compared with the initial E′ for the 25% RSC, the value shows a significant improvement for the 40% RSC. Thus, the increase in fiber loading from 25% to 40% have resulted in a 51.6% increase in storage modulus. This indicates that, increase in fiber content in natural fiber composites can be said to have a positive effect on the improvement of E′ in the composite.20-23,26,27 This is due to the increased stiffness of the matrix resulting from the incorporation of a stronger sisal fiber as a reinforcement.19,20,22,23,26,27 Similarly, from Figure 3(B), with the same fiber content of 40%, compared to the RSC, the Al-SC and Al-ASC samples achieved an improved E′ up to around 90°C. Comparing their initial E′ values, relative to the raw sisal composite, 40% RSC, the alkali-treated sisal composite, 40% Al-SC, showed 17.3% improvement and the combined alkali/acetylation-treated sisal composite, 40% Al-ASC, recorded 22.4% increase in E′. It is attributed to the improvement of compatibility and the formation of a robust fiber-matrix adhesion between the two parts because of the fiber surface treatments used. This will increase the effectiveness of stress transfer between sisal fiber and PET matrix.24,25 Due to the reduced aspect ratio, the formation of surface grooves and a decrease in the surface tension of the fiber resulted from alkali treatment, the wettability of the sisal with respect to the PET matrix was improved. Hence, the strength of the interface between the two parties got enhanced. The acetylation treatment of alkaline sisal rendered the fiber hydrophobic, further enhancing compatibility among the two. Also, as compared with the alkali-treated sisal composite, 40% Al-SC, the combined alkali/acetylation-treated sisal composite, 40% Al-ASC, resulted in an increase in E′ by 4.3%.

Effects of (A) fiber loading, and (B) surface modification on the storage modulus of the composite.
Effect on loss modulus
Figure 4 shows the variation of the loss module, E″, for composite systems with change of fiber load (A) and fiber surface treatment (B). From Figure 4(A), the increase in fiber content results in an increase and widening of the peak of E″, as observed in the composite specimen with a fiber load of 40%. The peak widening can be attributed to the hindrance of the polymer relaxation in the composites.18,19,26,27 The E″ in the transition region, (approximately 70–90°C, which is the glass transition range of PET), is much higher for both the 25% RSC and 40% RSC composites. Moreover, the E″ of composites was increased as the fiber content increased. The higher the E″ at this temperature is due to the softening of the PET matrix and the increased internal friction which facilitates energy dissipation.15-28 Compared with the 25% RSC, the loss modulus of 40% RSC was also increased by 35.2%. This is because, for a composite within the effective free volume, addition of sisal fibers created a greater number of chain segments which result more relaxation process inside the composite system. Due to this fact, peaks of E″ were increased for increasing fiber loading in composites.26,27
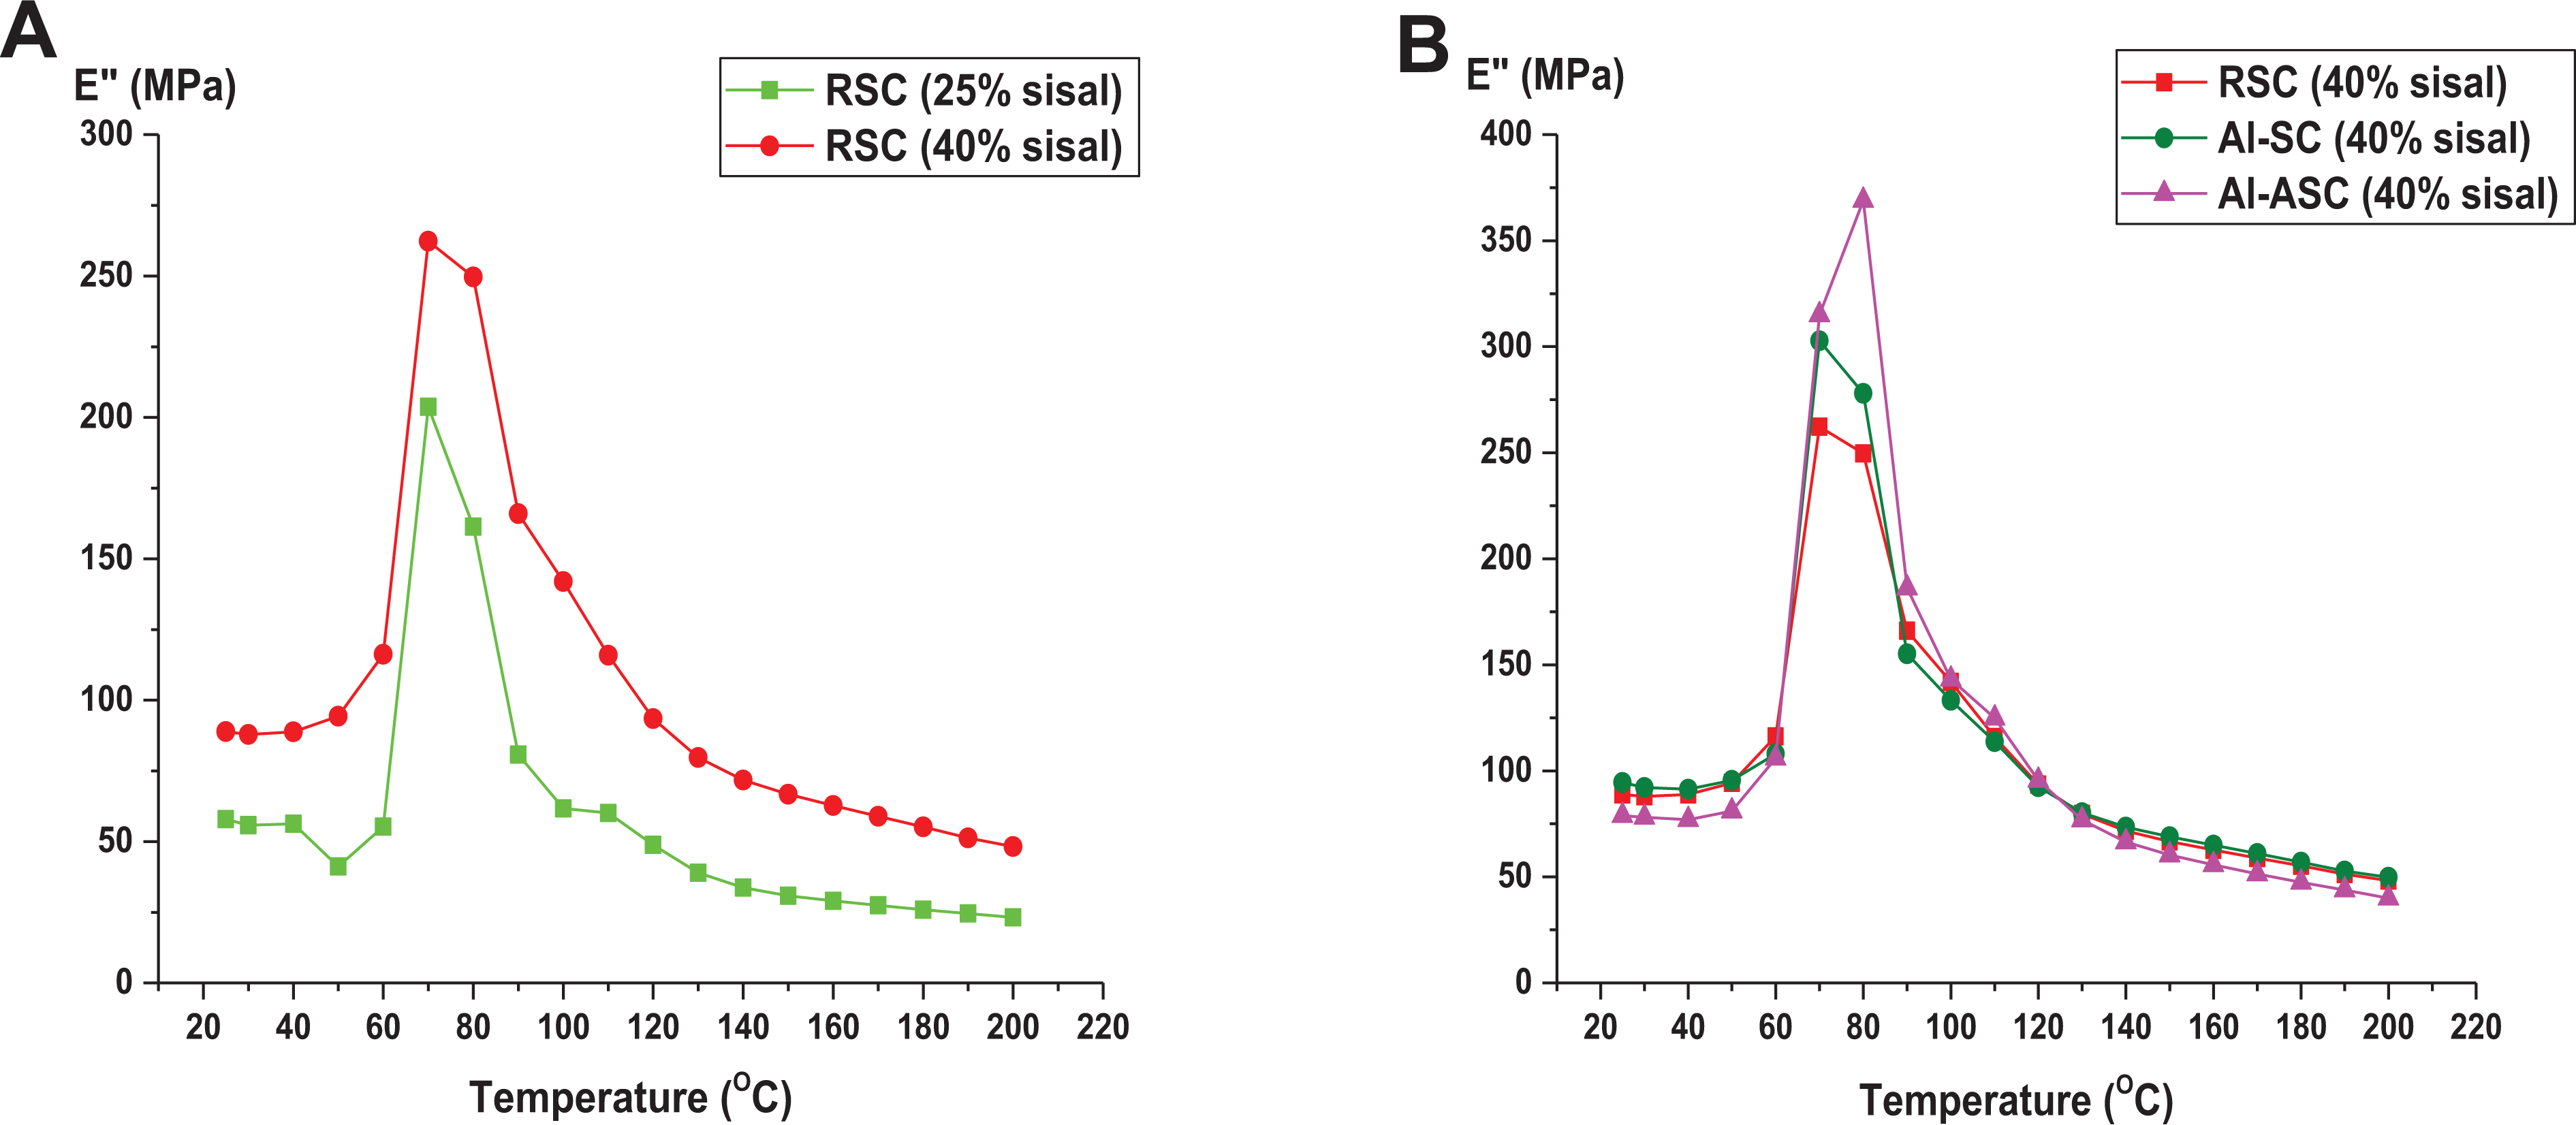
Effects of (A) fiber loading, and (B) fiber surface modification on the loss modulus of the composite.
Similarly, with the same fiber content of 40%, compared with the raw sisal composite, 40% RSC, the alkali-treated sisal composite; 40% Al-SC showed an increase in E″ by 4%. But, the combined alkali/acetylation composite, 40% Al-ASC have registered an increase by 18.4%. The peak of E″ for the treated sisal composites is sharper than the peak for the raw sisal composites. The peak sharpening shows the restriction of segmental mobility at the interface because of the enhanced sisal-PET interface binding strength due to the sisal fiber surface modification. Generally, for all the composite systems, the loss modulus increases with increasing temperature, which may be due to the weakening of the fiber and matrix interface or the decreasing in frictional resistance between them for higher temperature. The loss modulus of the composite for higher fiber content is higher in the transition region since it must increase the internal friction which promote energy dissipation. 27
Effect on damping (loss) factor, tanδ
The damping performance of the material assures the equilibrium between the elastic and viscous phases in a polymer structure. In composites, damping is affected by the addition of fibers.15,16,18-28 Figures 5(A) and (B) illustrate the variation in the mechanical damping parameter of the composites with the altered fiber content and sisal fiber surface modifications, respectively. In general, as the temperature rises, damping passes a maximum in the glass transition area and then diminishes in the rubbery area. In the glassy and transition regions below Tg, damping is low. Because, in these regions the composite is more elastic and crystalline, and the chain segments are in the compacted state.15,18 Thus, the deformations are principally elastic, and the molecular movements resulting from viscous flow are low. Besides, in the rubbery region, the molecular segments are entirely free to move, and consequently the damping is low.15,18 The height of tanδ peak indicates the structure and characteristics of the composite material.

Effects of (A) fiber loading, and (B) fiber surface modification on the damping of the composite.
By looking at Figure 5(A), the RSC with a sisal fiber content of 40% has a reduced the tanδ than the RSC with 25% sisal. Peak heights are significantly lowered with the increment of fiber contents. The peak value of tanδ for the composite with 25% raw sisal content was reduced by 48.6% when the fiber loading increases to 40%. This shows the formation of a better sisal-PET interface with increased fiber volume, leading to restricted motion of polymer molecules and low energy dissipation.15-28 The presence of molecular segments in the fiber-matrix system possesses high stored energy. Due to this, the energy dissipation is high at low temperatures. vibrations of fibers inside the surrounded matrix volume causes the damping in the composite system. This internal vibration is influenced by the fiber loading and strength of fiber-matrix interface. It is generally known that the vegetable fibers have poor compatibility with the hydrophobic PET matrix. Hence such vibrations are high in natural fiber composites. Nonetheless, increase in the fiber content in the PET matrix significantly reduced the internal vibration which in turn leads less damping behavior.17,18,26,27
In Figure 5(B) the Al-SC and Al-ASC samples have lower tanδ values than their RSC equivalent in the glassy area. This suggests a more enhanced sisal-PET interfacial strength and minimized energy damping in this area.23-27 But, in the glass transition region, the damping is maximum for the 40% AL-SC and 40% AL-ASC samples relative to the 40% RSC one. Relative to the 40% RSC, it shows an increase by 25.3% for the 40% Al-SC and 40.7% increase for the 40% Al-ASC ones. This may be due to the lower thermal stability of the treated fibers at relatively higher temperatures because of the removal of impurities such as lignin and hemicellulose during alkali treatment. This can weaken the fiber and be subjected to thermal damage at elevated temperatures.21-24,30
Effect on glass transition temperature (Tg)
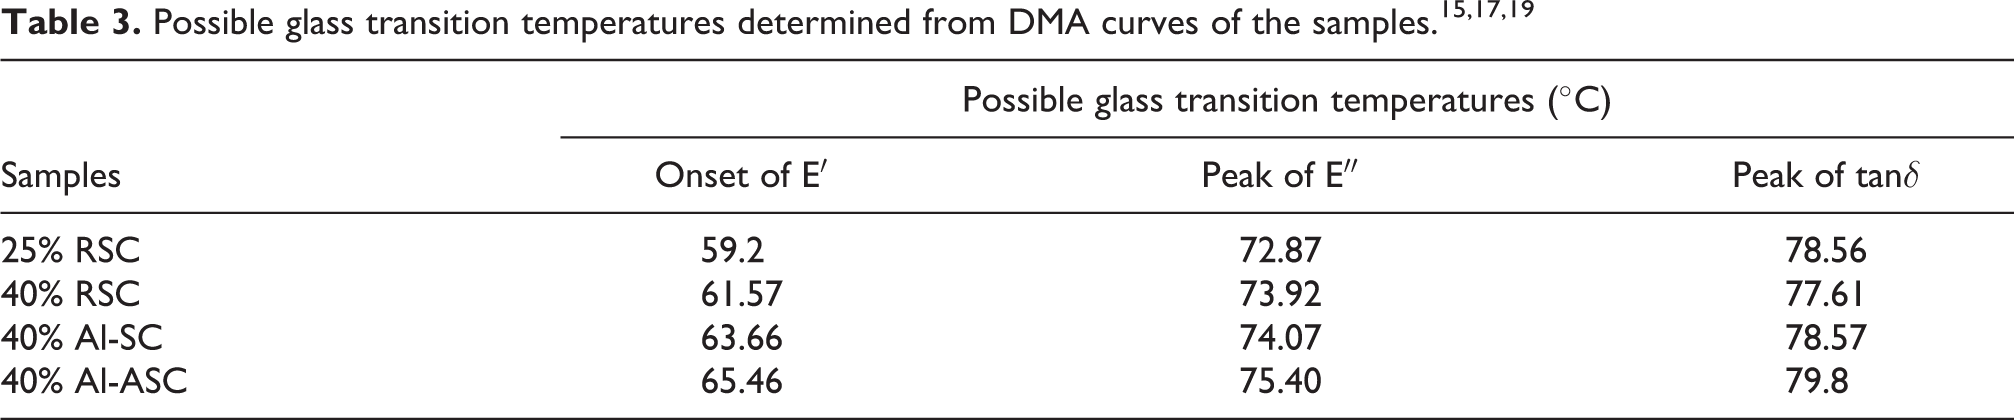
The glass transition temperature (Tg) is a temperature region at which the material changes from a rigid, vitreous solid to a more flexible, strong elastomer. The glass transition is a reversible change of the polymer between rubbery and glassy states. The Tg is detected as the onset of E′ or the peak of E″ or a peak in the tanδ curve.15,25-27 These three points usually coincide in pure polymers. However, when there is a fiber reinforcement, the Tg of the reinforced composite is primarily dependent on the DM properties of the polymer matrix. In FRCs, the presence of the fiber will restrict the movement of molecules in the matrix. As a result, they exhibit a complex dynamic mechanical behavior, and these points will not coincide.
Table 3 presents the three points for detecting the glass transition temperature from the DMA curve. Many literature studies have shown that the peak of the loss module was used as the glass transition temperature of the composite.15,18-20,25 Considering the peak of E″ as a Tg, there is an improvement in the Tg value with the increase in sisal fiber content as well as the modification of the surface of sisal fiber. There is a slight increment in the Tg with increasing fiber content that is associated with reduced mobility in the PET polymer chain due to increased fiber volume.18-22 Similarly, compared to the 40% RSC, the Tgs of the 40% Al-SC and 40% Al-ASC were increased due to the change in fiber surface and the resulting improved interfacial compatibility.18,20,23,24,27 Higher Tg values go with a secure fiber-matrix interface that features lower energy dissipation.18-24,26,27
Effect on visco-elastic phase change regions
The transition from elastic to viscoelastic and viscose phases is one of the major events that characterize DMA testing of fiber-reinforced polymers and composites.15,18,19,25 Phase changes involved throughout the DMA test are glassy (elastic), glass transition, rubbery and viscous flow (melting) regions.15,18,19,25 Table 4 presents The DMA phase regions with their corresponding range of temperature, T, for the composite samples. Broader temperature range in the glassy region is an indicator for the stable packing, robust fiber-matrix interfacial strength and thermal stability of the composite. Thus, compared to the temperature range of the 25% RSC (26°C), the broad temperature range of the RSC with 40% fiber content (36.5°C) at the glassy region indicates improved rigidity and thermal stability of the composite sample with increased fiber content.16-19 This shows a more sisal-PET packing, restricted mobility at the interface, and improved interfacial strength between sisal fiber and PET polymer because of increasing sisal fiber volume fraction. Similarly, chemically treated sisal-PET composites resisted broader temperature ranges in the glassy region (39.8°C for Al-SC and 41.0°C for Al-ASC) than the untreated sisal-PET composites (36.5°C for RSC) with 40% fiber content. This can be taken as a good indication of the favored effect of chemical surface modification of sisal fibers and improved sisal-PET interfacial strength. The process brings a positive effect on the stability of the composite under dynamic load.
The DMA phase regions with their corresponding range of temperature, T, for the composite samples.
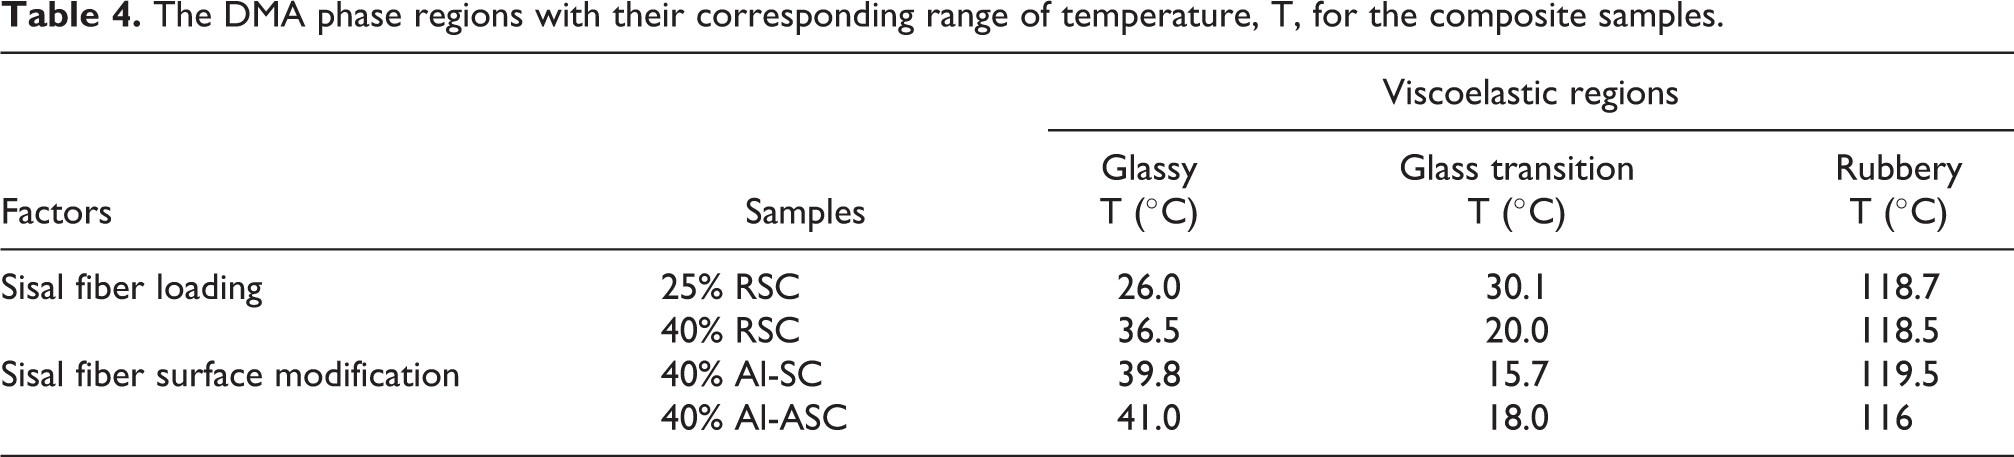
Although the alkaline treatment enhanced the DM properties of the composites, a combined alkali/acetylation process brought more improvement than the alkaline treatment alone. This is due to the improved hydrophobicity and wettability of sisal fiber toward the PET matrix after acetylation.
Conclusion
The research characterizes the DM properties of composites produced from sisal fibers, with different fiber loadings and surface treatment, and PET polymer. The study leads to the following conclusions:
The work is an indicator that the natural fibers can be injection-molded with engineering polymers such as PET. But further work is recommended with a focus on minimizing the thermal damage of natural fibers. The DMA of sisal fiber reinforced PET composites was significantly affected by sisal fiber loading and its chemical surface modifications. The increase fiber volume led to an improved E′ with a minimal damping (tan δ) due to the formation of a rigid and sturdy composite. Likewise, increasing fiber content has improved the Tg peak points, which implies a reduced mobility of PET molecules at the interface because of the increased sisal fiber content. At elevated temperatures, as the fiber content increased, the E″ was increased to a broader peak. The higher fiber content goes with thermal exposure to fiber, while lower fiber content results in polymer melting. The peak broadening in the E″ curve is due to the restriction in the relaxation of PET polymer chains. The fiber surface treatments have also affected the DMA of the composites. Compared with the untreated sisal-PET composite, the surface modified sisal-PET composites improved in E′ and Tg values with a more enhancement observed the combined alkali/acetylation-treated sisal-PET composite specimens. The Loss factor (tanδ) was decreased for the treated sisal-PET composites in the glassy region and increased with increasing temperature. The result is indicative for minimum energy dissipation in the glassy region because of a robust interfacial bond among the treated sisal fiber and the PET matrix. From the experimental investigations, sisal fiber reinforced PET composite can effectively be used for applications that operate at temperatures below, approximately, 60°C. They can be molded for the interior body parts of automobiles.
Footnotes
Acknowledgements
The authors express their sincere thanks to the German Academic Exchange Service, DAAD, and the Ethiopian Ministry of Education, MoE, for this would be impossible without their support. The next gratitude is in the administrations of the Institute of Polymer Materials and Plastics Engineering, PUK, TU-Clausthal, Clausthal-Zellerfeld, Germany, for their support and empathy to use all the analytical, production and testing laboratories.
Declaration of conflicting interests
The author(s) declare there are no potential conflicts of interest concerning the research, authorship, and publication of this research article.
Funding
There are no specific financial support for the research, authorship, and/or publication of this article. But, this work is part of a Homegrown doctoral project based on a scholarship from the German Academic Exchange Service, DAAD and Ministry of Education, MoE of Ethiopia.