
Abstract
The aims of this research are to elucidate the role of graphene oxide on the mechanical properties of epoxy and also to obtain an equation for the modeling of its behavior. Accordingly, graphene oxide/epoxy nanocomposite samples are fabricated using the solution casting method. Tensile, flexural, SEM and FTIR tests are conducted on epoxy and the nanocomposite samples afterwards. The obtained results show that the tensile strength of epoxy improves even at low contents of graphene oxide such that 0.3 wt.% of GO yields an improvement of approximately 11.5%. The flexural strength of epoxy is also enhanced by 5.8% with 0.5 wt.% GO. Then, it decreases due to the agglomeration with increasing the GO content. In order to predict the tensile strength of GO/epoxy nanocomposites, a modified Halpin–Tsai equation is obtained with a new introduced correction factor as K = 39.5Vf1.135exp(2.9−1644.6Vf). The obtained equation is in good agreement with the experimental data.
Introduction
Nanoscale reinforcing materials have recently come into attention in fabrication of polymer nanocomposites. 1 Their high surface to volume ratio and fascinating zero, one- or two-dimensional structures, in comparison with the micro-size fillers, result in forming numerous new characteristics in the reinforced polymer.2–4 The new filler boundaries form suitable bonding with the polymer matrix which consequently affects the material properties such as mechanical, thermal and electrical properties. 5 Carbon nanotube, 6 graphene oxide, 7 and ceramic nanoparticles such as TiO2 8 and SiO2 9 are examples of the most used fillers for the fabrication of nanocomposites.
Graphene oxide (GO) as a nanostructured carbon based material, is produced by the oxidation process of graphite. It has different application in supercapacitors, pollutants degradation, medicine and fabrication of composites.10–12 GO various functional groups such as carboxylic acid and hydroxyl group allow the material to be dispersed in water, many organic solvents and also the polymers. 7 Furthermore, these functional groups can form acceptable bonding with the polymer matrix. The two-dimensional materials like GO exhibit a range of functional groups like hydroxyl and carboxyl, available on its surface and edges. A strong bonding can be created between filler and matrix by carefully targeting these functional groups. 13 Recent studies show high Young’s modulus and tensile strength of GO/polymer nanocomposites due to the superior mechanical properties of graphene oxide.14–16 These nanocomposites have wide range of applications in civil, electronics, automobile, defense and aerospace industries.17–19 Suk et al. reported the Young’s modulus of monolayer GO to be approximately 207 GPa. 20 Addition of 0.3 wt.% GO resulted in an increase of 17% in the Young’s modulus, 33% in the tensile strength and 88% in the toughness of polybenzimidazole polymer in a study by Wang et al. 21 The amount of oxidation states of GO affects the mechanical properties of the nanocomposite; thus, such properties can be controlled. Graphene oxide with lower amount of oxidation state contains less defects and better mechanical properties which consequently enhance the mechanical properties of the nanocomposite. Wand et al. showed a great improvement in reinforcing polyvinyl alcohol (PVA) by less oxidation of GO. 7 Eqra and Moghim studied strain rate dependent tensile properties and fracture mechanisms of epoxy nanocomposite incorporated with reduced graphene oxide. It was demonstrated that the maximum strength of GO/epoxy nanocomposite can be obtained at the graphene content of 0.1%wt.%. 22 Haghighi et al. investigated the effects of defects and functional groups on carbon nanotube and graphene-reinforced epoxy nanocomposites. 23 Bian et al. fabricated chemically covalent bonded graphene oxide (MGO)/Poly(3-hydroxybutyrate) (PHB) nanocomposites and showed that MGO was dispersed well in the nanocomposites during solution intercalation. 24 O’Neill et al. produced chemically engineered polyamide 6 (PA6)/graphene oxide (GO) nanocomposites via the functionalization of GO with an amide (CONH2) functional group, in order to produce amide-GO with improved interfacial bonding and dispersion in the host polymer matrix. 25
Many industries use epoxy resin due to its excellent mechanical properties, thermal stability and moisture/corrosion resistance.26–28 However, epoxy resin shows brittle behavior due to easy crack propagation. It also has low wear resistance that limits its application.15,29 Variety of studies were done with the purpose of reducing these limitations.30,31 In this regard, the fracture toughness of epoxy resin can be enhanced by the addition of thermoplastic polymers; but this method decreases Young’s modulus and glass transition temperature (Tg) of epoxy. 32 Although inorganic materials, such as silica and alumina can improve fracture toughness of epoxy, they can cause problems in the composite fabrication by increasing the viscosity.33–35
Overall, GO seems to be an appropriate nanofiller to enhance the mechanical properties of epoxy, although conflicting results were also reported in some studies. 36 It is stated that graphene oxide sheets can improve the toughness and the fatigue life of epoxy. 37 Considerable progress in the impact strength, the flexural strength and the Young’s modulus have also attained with the incorporation of 1 wt.% GO to epoxy matrix. 38 Qi et al. reported that tensile strength and flexural modulus of thermotropic liquid crystalline epoxy (TLCP) were improved by 46% and 48%, respectively by the addition of 1.0 wt.% grafted GO. The impact strength of this nanocomposite reached 51.43 kJ/m2 which shows that GO can also toughen TLCP. 39 Galpaya et al. showed that the addition of 0.1 wt.% and 0.5 wt.% GO to epoxy results in 50% and 135% improvement in the fracture toughness and the Young’s modulus, respectively. 40 Improvements in the mechanical properties of epoxy such as Young’s modulus, tensile strength and hardness were shown in presence of the low amount of GO by Abdullah and Ansari. 36 However they reported a decrease in the impact strength unlike other studies. Several works also reported positive effect of GO on the viscoelastic performance of epoxy.41,42
As described, limited research was done on the simultaneous experimental and modeling investigation of graphene oxide-epoxy nanocomposites. Therefore in the current research, GO/epoxy nanocompositeis fabricated up to 1 wt.% graphene oxide, by the solution casting method firstly. Then, tensile and flexural tests are conducted on the nanocomposite samples and the fracture behavior of this compositeis investigated. Finally, in order to predict tensile behavior of samples theoretically, a modified Halpin–Tsai equation is used by introducing a new correction factor.
Experiment
Materials
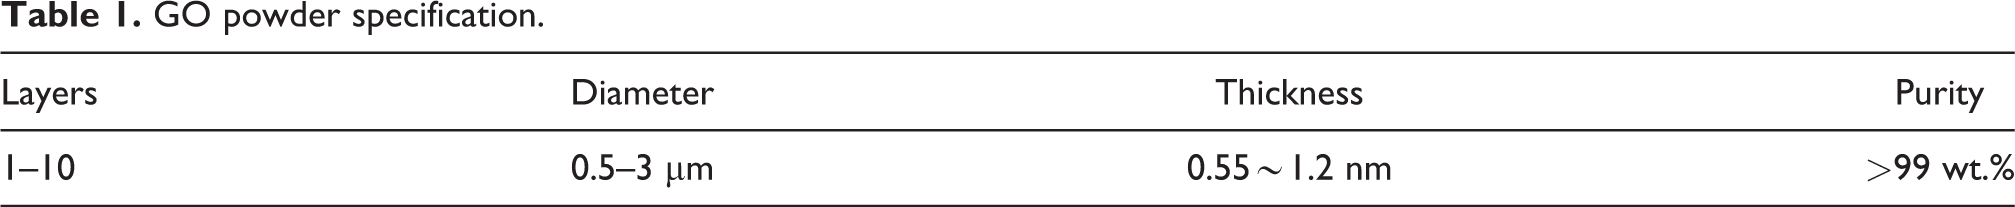
GO powder was used with the specifications shown in Table 1. Hardener (HA11) polyamine and epoxy resin (M506) based on bisphenol-A were purchased from Mavad Mohandesi Mokarrar Co., Tehran, Iran.
GO powder specification.
GO/epoxy nanocomposite synthesis
Graphene oxide/epoxy nanocomposite samples were fabricated with different contents of GO, i.e. 0.1 to 1.0 wt.% (EP-0.1wt.%GO to EP-1.0wt.%GO) using the solution casting method. Accordingly, GO was dispersed in acetone by an ultrasonic device with 60 W power in 60 min. Then, epoxy resin was added to the solution and left to be agitated under the same power for 1 h. Acetone was removed from the solution in a vacuum chamber of 60°C during 24 h and a magnetic stirrer was used to mix the solution with the hardener. After degassing in the vacuum chamber, the obtained mixture was injected into the tensile/bending sample molds. The samples were left 7 days at room temperature in order to complete the curing process. Pure epoxy samples were also produced to be used as the reference.
Testing devices
Hegewald and Peschke inspect 50 mechanical testing machine (Germany) was employed for measuring the mechanical properties of the samples. Tensile test was done according to ASTM D638 with the cross-head speed of 1 mm/min and a 100 kN load cell. Bending properties of the samples were obtained by conducting three-point flexural test according to ASTM D790 with 60 mm support span and constant cross-head speed of 1 mm/min. FTIR spectrum of the pure epoxy samples and the nanocomposites was taken by a Bruker Tensor 27 FT-IR (Germany), between 500 cm−1 and 4000 cm−1 wavelength numbers. Scanning electron microscopes (FESEM, Hitachi S4160, Japan) was used to investigate the fracture surface of the nanocomposites and the pure epoxy samples.
Results and discussion
GO/epoxy characterization
Figure 1 demonstrates AFM micrograph of GO. This micrograph confirms the reported size of the filler. Figure 2 shows the Raman spectra of graphene oxide. As can be seen, the G band at 1587 cm−1 reflects bond stretching of sp
2
carbon pairs in the graphite plane and the D band at 1311 cm−1 is due to the edge effect and the inherent defects. Moreover,

AFM micrograph of graphene oxide.

Raman spectra of the graphene oxide.
Figure 3 shows the FTIR spectra of the nanocomposite samples, GO and epoxy. It can be seen that GO has only two sharp peaks at 3430 cm−1 and 1625 cm−1 which are related to the stretching vibration of hydroxyl (O–H) and carbonyl (C═O) groups, respectively. The main peak of the pure epoxy is the broad band around 3300 cm−1 which is attributed to the stretching vibration of hydroxyl (O–H) groups. Peaks at 2925 cm−1 and 2855 cm−1 are related to the stretching vibration groups (C–H) in CH2 and CH3 bands. Peaks at 1726 cm−1, 1226 cm−1 and 1103 cm−1 are also in the range of stretching vibration bands of carbonyl (C═O), carboxyl (C–OH) and epoxide (C–O) groups, respectively. As shown, the peaks of the pure epoxy are not changed throughout the synthesis of the nanocomposite samples but are present at lower intensities. Furthermore, the change of the sharp peak of hydroxyl groups to the broad band and its shift toward a lower wave number confirms the change in stretching vibration of these groups. It also verifies the contribution of these groups at the interface bonding and also generation of a new interface between epoxy and graphene oxide.
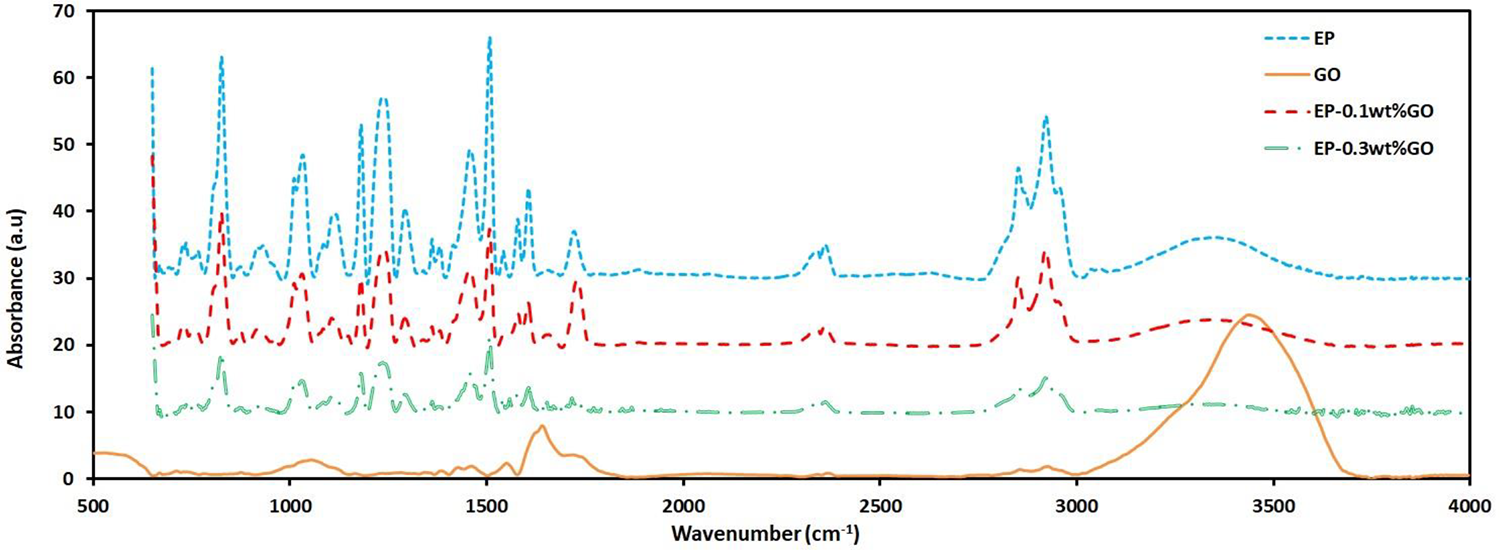
FTIR spectra of the samples together with the pure epoxy.
Tensile test
Uniaxial tensile stress–strain curves of the nanocomposite samples are illustrated in Figure 4. As can be seen, GO improves the tensile strength of the pure epoxy at low contents; but decreases it at higher contents because of the agglomeration. This is comparable with the other works. 21 An improvement by approximately 11.5% was achieved at 0.3 wt.% GO. At high filler contents, GO nanoparticles agglomerate because of their poor dispersion in the polymer matrix and their tendency to reduce their surface energy. As the result, strength drops sharply caused by the crack initiation in the agglomerated regions of GO. Actually, these agglomerations act as defect regions which serve to initiate fracture. Moreover, tensile strength’s dependence of nanocomposites to the stress transfer between rigid fillers and the matrix may be responsible for later effects. If the interface between the nanofiller and the matrix is sufficiently strong, stress would be successfully transferred to the reinforcing material and the strength would be improved. Addition of more reinforcing material results in the reduction of the strength, due to the weak interfacial bonding in the presence of agglomeration. On the other hand, the elastic modulus of epoxy would be improved with incorporation of graphene oxide. It is because of reduction in the molecular mobility of the epoxy chains which become stiffer. As a fact, GO particles with their higher stiffness are located within the existing space among the polymer chains, thus reduce the chains’ flexibility. Furthermore, the presence of defects in the nanocomposite’s structure causes the ductility to decrease.

Stress–strain curves of the samples.
Prediction of the tensile strength
A Halpin–Tsai equation is employed in order to predict the tensile strength of epoxy/graphene oxide nanocomposites. According to the Halpin–Tsai equation, the strength of a composite assuming ideal distribution and ideal impregnation in the polymer can be obtained as6,44:

where:

In which C = 2(l/d) is a constant shape factor related to the aspect ratio (l/d), l and d are minimum and maximum size of the filler. These values are substituted with respect to investigation done on morphology of filler particles. For example in the case of graphene oxide, l is selected as particles width in the range of micrometer and d as particles thickness in the range of nanometer. Moreover, Vf is the volume fraction of the filler and Sm, Sf and SC are the tensile strengths of matrix, filler and composite respectively.
Equation (1) is modified by introducing and multiplying a new correction factor K = aVfbexp(c-dVf) as the shape factor. The parameters a, b, c and d, obtained according to the experimental data, are constants which describe the effect of GO volume percent on the value of the correction factor. Substituting the new shape factor in equation (1), we get to the modified Halpin–Tsai equation which can be expressed by:


Figure 5 represents the experimentally obtained tensile strengths of GO/epoxy samples versus the content of graphene oxide together with the predicted values from the modified Halpin–Tsai equation with the correction factor as K = 39.5Vf1.135exp(2.9−1644.6Vf). Constant parameters were extracted regarding the best fit of equation (3) to the experimental results. Results show that the modified Halpin–Tsai equation predictions are in good agreement with the experimental results.
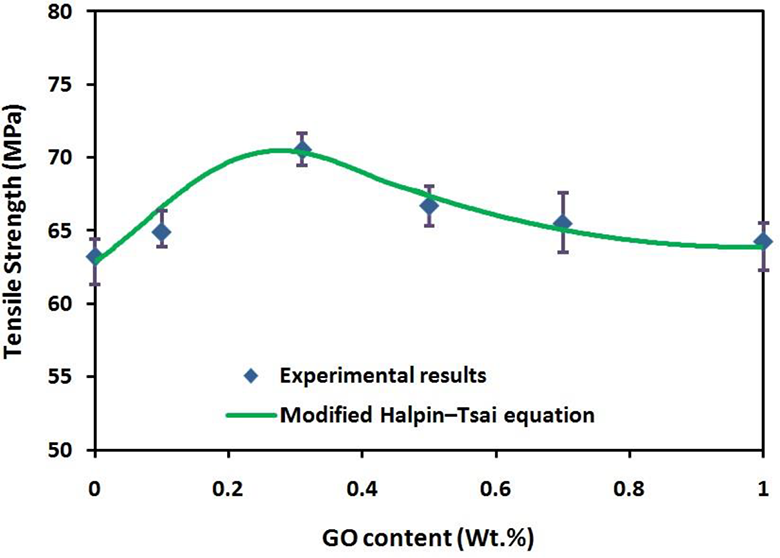
Experimental results together with the modified Halpin–Tsai equation results with K = 39.5Vf1.135exp(2.9−1644.6Vf).
Flexural test
The flexural test curves are represented in Figure 6 and the flexural strength of the samples are shown in Figure 7. The flexural strength of epoxy is enhanced by 5.8% with the incorporation of 0.5 wt.% GO and then decreased with increasing GO content due to agglomeration. The improvement is compared to the other works. 38 According to the obtained results, the influence of GO on the tensile properties of epoxy is higher than its effect on the flexural properties.

Flexural stress–strain curves of the samples.
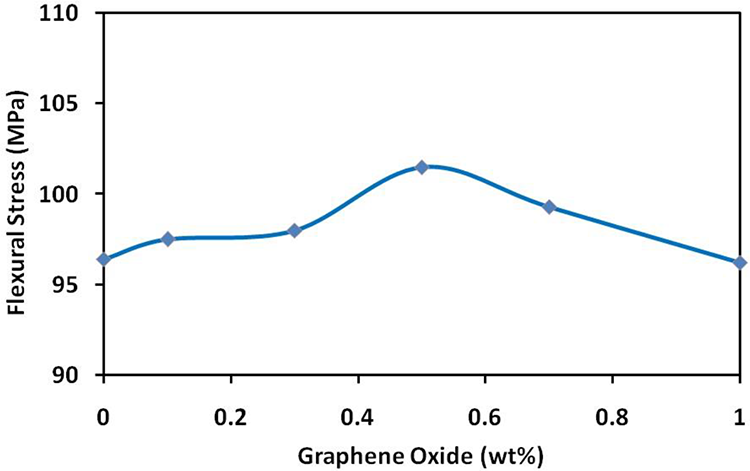
Flexural strength of the samples.
Fracture toughness
Figure 8 shows the effect of graphene oxide on the fracture toughness of epoxy. It is obvious that graphene oxide enhance fracture toughness of epoxy by approximately 12%. As observed, an inverse effect is observed at high loadings. These results are comparable to other researches. 40 Figure 9 also illustrates the fracture surface of the pure epoxy and the nanocomposite samples. As shown, smooth fracture surface of the pure epoxy is transformed into a rough surface. This happens due to the existence of GO sheets as the reinforcing material in epoxy as well as their contribution in toughening that acts as obstacle to prevent crack growth. As a fact, GO changes the cracks propagation direction which results in cracks deflection. Moreover, agglomeration of GO sheets is illustrated in Figure 10 which verifies the reduction of mechanical properties of the nanocomposite samples. As can be seen, agglomeration regions act as area for initiating the cracks and cause the final fracture.

Effect of graphene oxide on fracture toughness of epoxy.
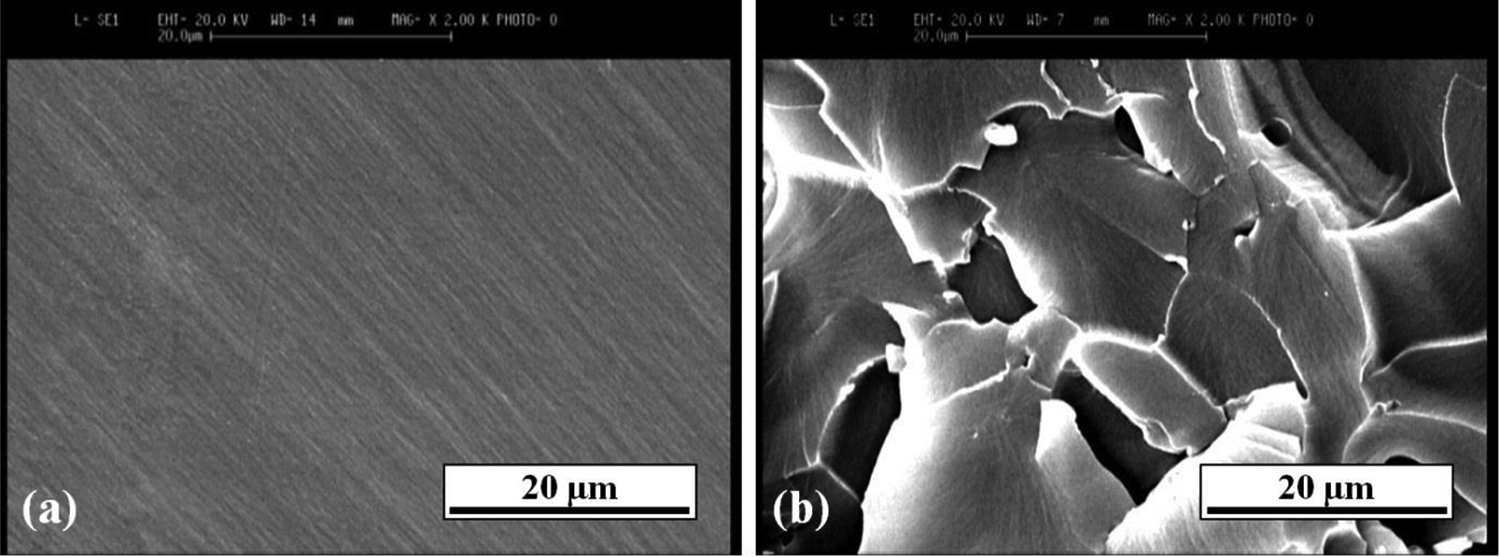
SEM images of the fracture surface of (a) Pure epoxy (b) 0.3 wt.% GO.

SEM images of the fracture surface of (a, b) EP/0.7wt.%GO and (c, d) EP/1.0%GO.
Conclusion
Tensile results of epoxy/graphene oxide nanocomposite show that GO improves the tensile strength of the pure epoxy even at low contents. However, the tensile strength decreases with increasing the GO content due to the agglomeration of GO at higher contents. An improvement of 11.5% is achieved for EP-0.3wt.%GO. The flexural strength of epoxy is enhanced by 5.8% for EP-0.5wt.%GO nanocomposite sample and then decreased with increasing the GO content because of the agglomeration. Improvements are due to the existence of GO nanosheets and their contribution in toughening which acts as obstacle to prevent the crack growth and deflecting them. Halpin–Tsai equation with a new correction factor which is introduced for theoretical prediction of the tensile strength shows that the predictions are in good agreement with the experimental data.
Footnotes
Declaration of conflicting interests
The author(s) declared no potential conflicts of interest with respect to the research, authorship, and/or publication of this article.
Funding
The author(s) received no financial support for the research, authorship, and/or publication of this article.