
Abstract
This research was targeted to investigate the effect of oxygen plasma treated graphene nanosheets (tGNSs) on the thermal stability of benzoxazine resin and to have a further and deeper mechanistic understanding of thermal decomposition kinetics of such nanocomposites in 0.5, 1 and 3 wt% of tGNS. The samples were prepared as reported in our previous study. The quality of dispersion of tGNSs within benzoxazine was investigated by X-Ray diffraction (XRD) and scanning electron microscopy (SEM) technique. Also, to ensure the complete curing of samples the differential scanning calorimetry (DSC) analysis was performed. Using thermogravimetric analysis (TGA), it was found that the addition of tGNS improved the char yield and thermal stability parameter of benzoxazine nanocomposites and this improvement was more prominent at 1% and higher amount of nanoparticles. Moreover, the first stage of thermal degradation kinetic of benzoxazine was disappeared above 1 wt% of tGNS. The samples were kinetically analyzed through Kissinger, Flynn-Wall-Ozawa and Friedman and Coats-Redfern method. It was revealed that the overall activation energy was enhanced from 168 to 224 kJ mol−1 and 275 to 420 kJ mol−1 for the second and third stage of degradation using 1 and 3 wt% of tGNS.
Introduction
As a novel class of phenolic thermosetting resins, polybenzoxazine (PB) has been attracting both scientific and industrial attentions during the past decade, 1 mostly due to its desirable thermal stability, 2 low water absorption, 3 excellent dielectric properties 4 and facile production in a solvent-less procedure. 5 These remarkable properties make PB a real candidate for use in smart materials and coatings mainly in aerospace engineering, integrated electronics and the like. 6
Many attempts have been done in order to further enhance the thermal stability of PB via tailoring the molecular structure,7-9 blending and copolymerizing with other polymers10-12 and introducing nanoparticles.13-15 Among aforementioned procedures, preparation of nanocomposites could drastically improve thermal behavior of PB resins as suggested by Ramdani et al. 16 and Yan et al. 17 In this regard, layered nanoparticles such as graphene nanosheets,18,19 layered silicates,20,21 graphites 22 and layered double hydroxides 23 owing to their shape geometry could improve the kinetic decomposition temperature of base polymer to a higher order of magnitude. A detailed survey in the researches showed that embedding graphene nano particles as a second reinforcing part into polymer matrix could substantially cast light on its thermal stability as well as thermal diffusivity and conductivity.24,25 In this regards, Zhou et al. 26 showed that the addition of only 0.5 wt% graphene oxide (GO) into phenolic resin could improve the residual weight of nanocomposite by 5.8%. Another work by Liu et al. 27 was carried out to investigate the effect of graphene nano sheets on the thermal degradation of epoxy resin. They found that nanoparticles can act as thermal insulator and mass transport barrier in 3 wt% and in turn the total heat release was decreased from 33.4 to 28.2 kJ m−2. Also, the effect of grafting of epoxy chains onto GO was investigated by Wan and his research team 28 and it was concluded that applying 0.5 wt% of functionalized GO rather than GO significantly increased the decomposition temperature of epoxy nanocomposite by approximately 30°C. Moreover, Sedaghat and her team work 29 revealed that in the case of poly (vinyl alcohol)/starch, upon addition of GO, the degradation kinetics of the blend was efficiently lowered and the kinetic function changed from A2 to A3. Xu et al. 30 considered the effect of GO on the thermal stability of PB and compared it with graphite nanoparticles. They found that due to strong molecular interaction of functional moieties on the surface of GO with PB, the char yield 31 as well as flame retardancy of nanocomposite were greatly improved.
Concerning the improvement of PB thermal stability, there has been few publications that dealt with the effect of nanoparticles and in the case of graphene nanosheets (GNSs), no detailed information about thermal decomposition kinetics was surveyed so far. The novelty of this work lies on designing the optimum formulation for PB/graphene nanocomposite to either get the most out of thermal stability and also the best dispersion properties in the vicinity of nanoparticles percolation threshold. We also provided a symmetrical sigmoidal equation as a way to predict the thermal stability of samples in various weight percentages of tGNS. We first synthesized the benzoxazine monomer and its characterization was carried out through proton nuclear magnetic resonance (1H NMR) and carbon NMR (13C NMR) and also Fourier-transform infrared (FTIR) spectroscopy. Then, to better disperse the GNSs within benzoxazine, plasma treatment was done under oxygen media to form functional moieties with minimum deterioration of nanoparticles at the predetermined time. The results of these two parts were reported in our previous publication. 32 Herein, the nanocomposites were prepared and characterized by SEM and DSC technique to ensure the quality of treated GNSs (tGNSs) dispersion and complete state of curing. At last, the thermal behavior of nanocomposites was examined by TGA and the kinetic models were used to postulate the kinetic parameters as well as lifetime of nanocomposites.
Experimental
Materials
Aniline (a light-yellow liquid, C6H5NH2, Mw= 93.13 g mol−1, bp 184.1°C), paraformaldehyde (white fine powder, [CH2O]n), 2,2-Bis(4-hydroxyphenyl) propane ([4-(HO)C6H4]2C(CH3)2, Mw= 228.29 g mol−1, known as Bisphenol A-[BPA]), diethyl ether and tetrahydrofuran (used as monomer solvent) and sodium hydroxide (received as pellets) were all supplied by Merck Chemicals Co. (Darmstadt, Germany) and used without further purification. Graphene nanosheets, N002-PDR, (thickness <1 nm, average diameter <10 μm, average aspect ratio of about 4000, specific surface area of 400–800 m2 g−1 and comprised of stacks of one to three monolayer graphene sheets) were supplied by Angstron Materials, Korea.
Preparation of materials
The details of all the preparation methods including benzoxazine synthesis, plasma treatment of GNSs and nanocomposites preparation used in this study can be found in our previous work. 32 Briefly, to obtain the benzoxazine/GNSs nanocomposites, different weight percentages of treated graphene (0.5, 1, and 3 wt%) were added to synthesized benzoxazine monomer dissolved in THF. The dispersed tGNSs were mildly sonicated for 15 min at the power of 70 W then after agitated with dissolved monomer for another 1 h at room temperature and afterwards poured onto the respective silane-coated glass and was kept at 60°C in vacuum chamber for 24 h to be completely dried. Finally, curing of samples was carried out in an ordinary oven through step-wise procedure at 150°C for 1 h, 160°C for 1 h, 180°C for 1 h, 200°C for 1 h and 210°C for another 1 h.
Characterization of samples
X-ray diffraction (XRD) was performed at room temperature using an X-ray diffractometer (Philips model X’Pert, Netherlands) over an angular range (2θ) of 5–40° at a rate of 1° min−1 and a step size of 0.03. The X-ray beam was a Co Kα radiation (λ=1.78897°A) using a 40 kV voltage generator and a 30 mA current.
The morphology analysis of the samples was carried out by SERON AIS 2100 scanning electron microscope (South Korea) at an operating voltage of 25 kV. The samples were gold-coated to prevent build-up of electrostatic charge and to improve resolution under the SEM by (Eiko IB, Tokyo, Japan) with an accelerating voltage of 15 kV.
Non-isothermal DSC tests were performed on a DSC Q 1000 of TA (USA), with samples of about 5 mg sealed in aluminum pans, under dynamic nitrogen atmosphere (flow rate 50 mL min−1) in a temperature range between 25 and 300°C, at a heating rate of 10°C min−1.
The thermal degradation of the samples was studied using a thermogravimetric analyzer (PL-STA 1500, UK) in a dynamic mode under nitrogen atmosphere at the heating rates of 5, 10, 15, and 20°C min−1 from ambient temperature to 800°C.
Theoretical background
The kinetic analysis was performed through the implementation of non-isothermal methods33,34 to verify the effect of tGNS addition on the kinetic parameters so as to understand the thermal behavior of the nanocomposites. From the TGA thermograms, the degree of conversion α was calculated as shown below (equation (1)):

where mo is the initial mass of the sample, mt is the sample mass at time t, and mf is the final mass of the sample after the thermal degradation. Deriving Equation (1), the rate of conversion dα/dt can be represented as shown in Equation (2). This equation combined with the Arrhenius equation (equation (3)), can be stated as shown in Equation (4):


where A is the pre-exponential factor, K a temperature-dependent kinetic rate constant, Ea is the activation energy, R is the universal gas constant, T is the absolute temperature, and f(α) is the reaction model.
Calculation of kinetics parameters was performed through multiple-temperature programs, which can be generally divided into differential and integral methods. The differential method of Friedman as one of the most used and simplest methods was applied in this study to solve Equation (4). Equation (5) can be derived by logarithmization of Equation (4) as below:

Using this equation, for a fixed degree of conversion, straight lines are obtained by plotting ln[β(dα/ dT)] against 1/T for which the slope is defined as –Ea/R.
Model-free methods of Flynn-Wall-Ozawa (FWO) and Kissinger allow for evaluation of kinetic parameters without any knowledge of the reaction mechanisms. The prerogative of using such methods is that they are not based on any assumptions concerning the temperature integral. 35 The FWO equation can be expressed as follow:

where g(α) is the integrated form of the kinetic rate as shown in Table 1. The values of Ea were calculated from the slope of the straight lines logβ versus 1/T. The Kissinger equation can be described as below:

Algebraic expressions of g(α) for reaction models. 37

Accordingly, the average activation energy Ea of the whole thermal degradation process can be obtained from a plot of ln (β/Tp 2 ) against 1/Tp at different heating rates where Tp is the absolute temperature at maximum mass loss rate.
In addition, the kinetic mechanisms can be accomplished using a simplified version of the Coats–Redfern (CR) method 36 in form of Equation (8).

Based on this equation, at a specific heating rate, the activation energy can be estimated for every g(α) of Equation (8), as listed in Table 1, 37 by plotting (ln [g(α)/T2]) versus 1/T.
Results and discussion
Structure and morphology
XRD technique was used to investigate the quality of dispersion and exfoliation state of the tGNSs in the PB resin. The patterns of the tGNS, the neat PB and their corresponding nanocomposites are presented in Figure 1. The weak diffraction peak at 2θ of 25.4° in tGNS, features an interlayer spacing of 0.35 nm which can be attributed to the coexistence of single graphene layers and some intercalated assemblies. 38 Comparing other researches 39 the plasma treatment has no considerable effect on the d-spacing and crystal structure of GNS as it is approved by Raman spectroscopy in our previous study. Moreover, the broad amorphous peak of PB is observable with peak-centers around 18.6°. Also, there is no detectable XRD feature from tGNS in the nanocomposites, implying that the stacked structures of graphene nanosheets disappeared and demonstrating the exfoliated structure within the PB resin. A careful look at the graph reveals that no significant change was found in the structural performance of nanocomposites by increasing the tGNS contents.

XRD patterns of tGNS, neat PB and their nanocomposites.
SEM technique was used to ensure the state of tGNS dispersion and to investigate the morphological behavior of fracture surfaces of neat PB and its corresponding nanocomposites. As illustrated in Figure 2(a), the smooth surface of neat PB after fracture, stems from its brittle nature as it is common among thermosetting resins. However, with the addition of tGNS the roughness of the surface increased remarkably compared to that of unfilled PB which is attributed to the crack deviation mechanism. The fractography of all nanocomposites confirmed the formation of semi-cleavage structure. However, by increasing the tGNS loadings, less resin is available to intercalate the nanosheets and hence the cleavages are smaller in size. The sign of agglomerations at high loadings of tGNS is evident (Figure 2(d)) yet, strong interface between resin and nanoparticles could be traced with the formation of white spots after fracture and this approves that even above 1 wt% of tGNS, the chemical interaction between resin and functional moieties of tGNSs brought about excellent bonding and in turn formation of polymer network around tGNSs.

SEM micrographs of fracture surfaces of (a) neat PB, (b) BZ-0.5%tGNS, (c) BZ-1%tGNS and (d) BZ-3%tGNS. (The arrows indicate tGNSs.).
To ensure the complete curing of samples and trace any structural transitions after curing, DSC was used in non-isothermal mode. Figure 3 shows the thermograms of unfilled PB and its corresponding nanocomposites at the rate of 10°C min−1. DSC graphs in all samples showed nearly straight lines without any distinct deviation from the baseline and its trend was retained up to 300°C, suggesting that within the given temperature and time of curing, the degree of conversion reached its highest value and hence complete curing was achieved. The test could be an endorsement to prove that almost no unreacted monomer was remained after curing and the thermal behavior (as will be discussed in the 3.2 section) is interrelated to the degradation of 3D network of thermoset resin and tGNSs.
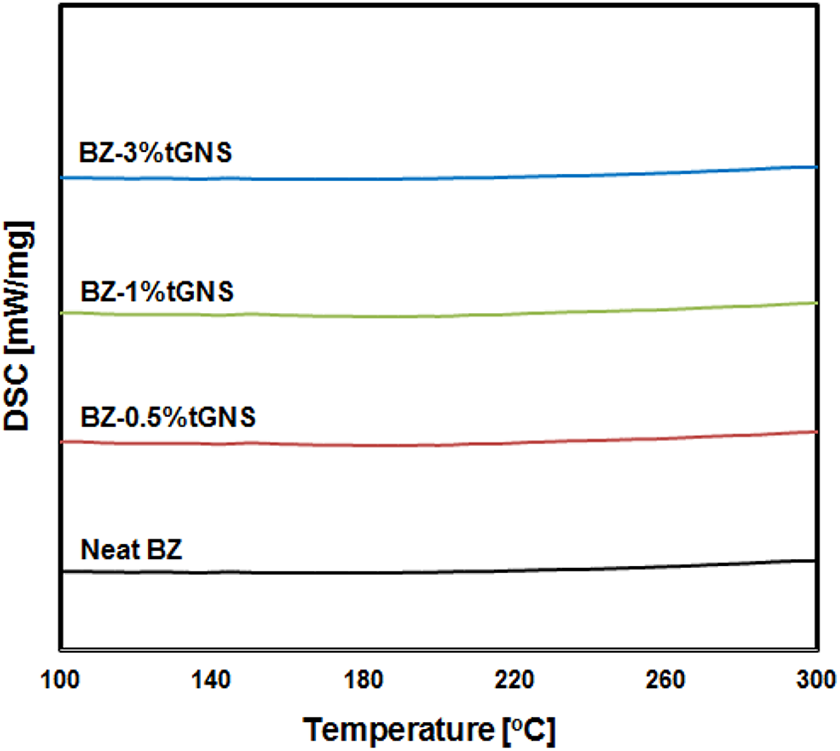
DSC thermograms of neat PB and its nanocomposites at the rate of 10°C min−1.
Thermogravimetric analysis
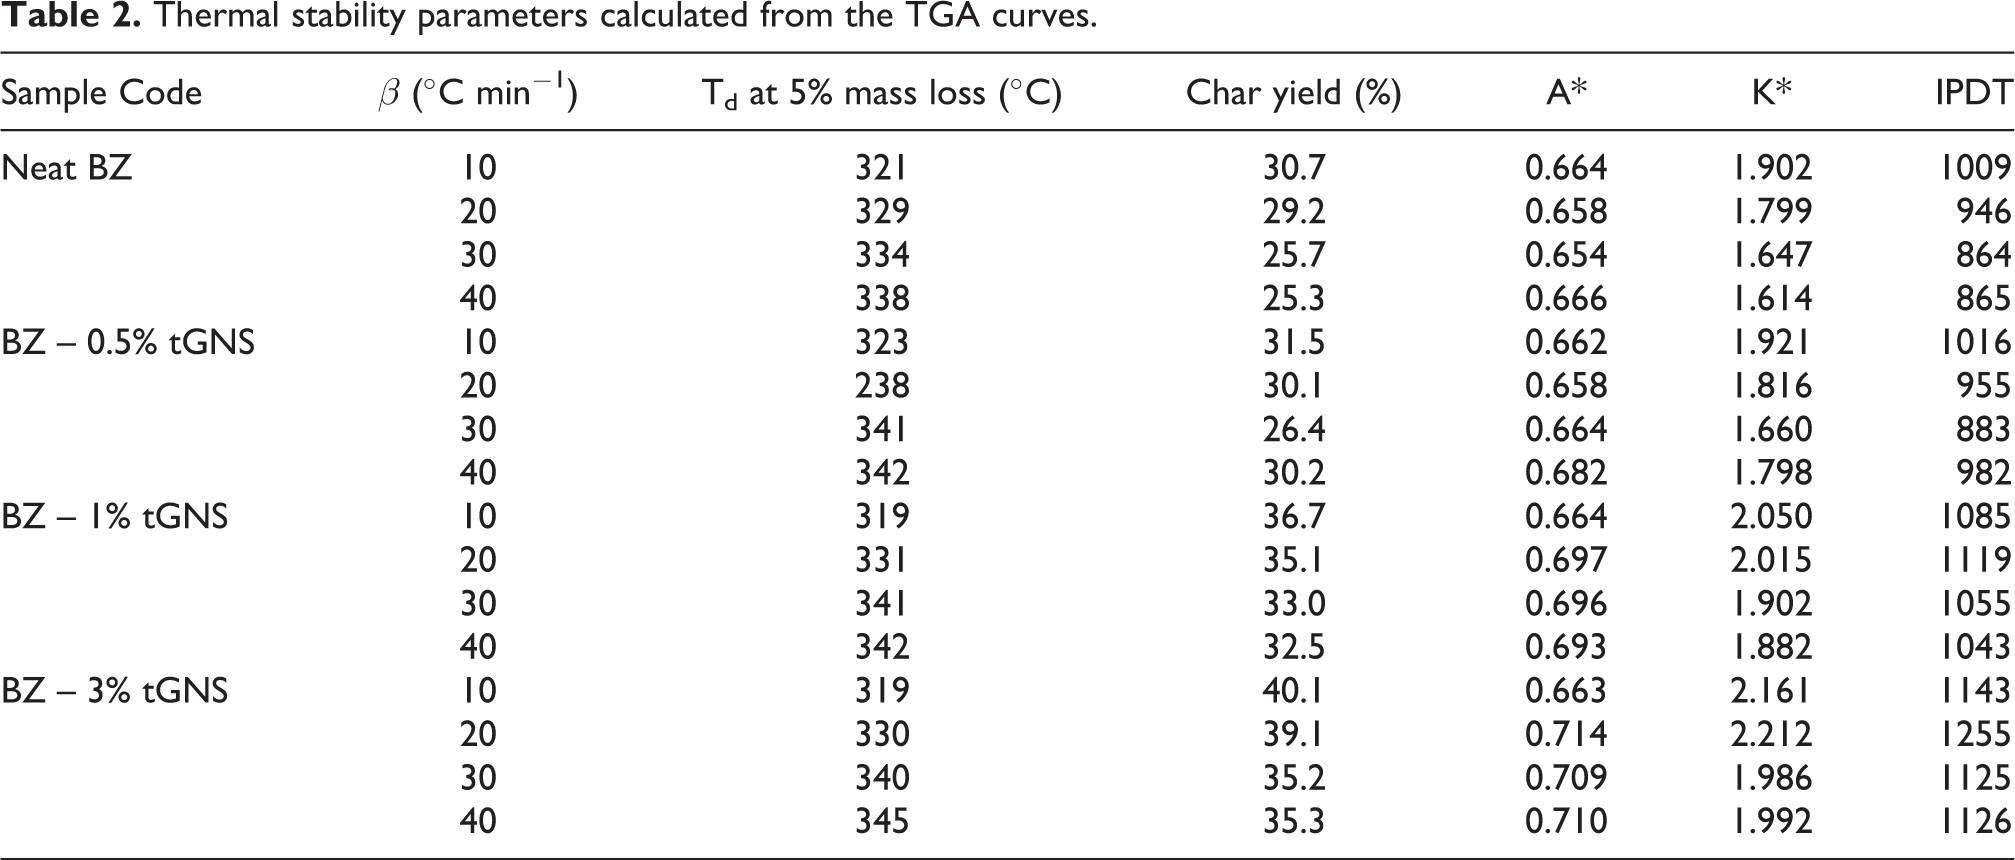
The influence of the tGNS composition on the thermal stability of nanocomposites was analyzed by TGA and shown in Figure 4. With the addition of tGNS into PB up to 0.5%, the thermal decomposition temperature at 5% mass loss was increased to about 6°C and then decreased at 1 and 3% (Table 2). When polymerized in the presence of tGNS, the network of formed PB could be in various sizes, i.e. at lower amounts, the tGNS help benzoxazine monomer form greater polymer network whereas at higher amounts, functional moieties on the surface of graphene provide a suitable circumstance for the PB to get polymerized from the nanoparticles and hence more polymer networks were arranged with smaller sizes as reported for phenolic resin at 0.5% of GO. 26 Another reason lies beyond the fact that the decomposition of oxygen functional groups on the surface of the tGNS, accelerates the overall decomposition of sample when compared to neat PB.

TGA spectra of neat PB and its corresponding nanocomposites under a nitrogen atmosphere at the rate of (a) 10, (b) 20, (c) 30 and (d) 40°C min−1.
Thermal stability parameters calculated from the TGA curves.
Typically, the thermal degradation of PB can be divided into three stages including chain-end degradation, Mannich bridge cleavage and char formation, successively.31,40 As can be seen in Figure 5, the first degradation step for PB mainly occurs within 320 to 350°C temperature span. A careful consideration shows that in all heating rates, the introduction of tGNS drastically lowered the peak intensity and finally above 1%, the maximum peak temperature was faded away which may be due to relatively stronger intermolecular interactions between tGNS and PB. 30 The second weight loss process developed as a results of phenolic moieties degradation and mainly appeared within 370–400°C. It also could be noticed that the addition of tGNS remarkably lowers the peak intensity and shifts it to higher temperatures (Table 3). This is mostly due to layered structure of graphene which block the released gaseous products such as 2,3-benzofuran derivatives, iso-quinoline derivatives, biphenyl compounds and phenanthridine derivatives 41 from degradation. These products are capable of undergoing successive dehydrogenation, cross-linking, and aromatization which in turn lead to formation of char in the last stage of the degradation. The data tabulated in Table 2 reveals that by the introduction of tGNS into PB resin, an ascending trend of the char formation is achieved. This increase of char yield (CY) is more pronounced for 1% of tGNS, proportionally. Layered structure of graphene nanosheets creates barrier effect on the surface of the PB through which the mass and heat transfer from underlying material were slowed down and further combustion was prevented as well. 42 All these effects brought about the formation of a compact and dense charred layer.
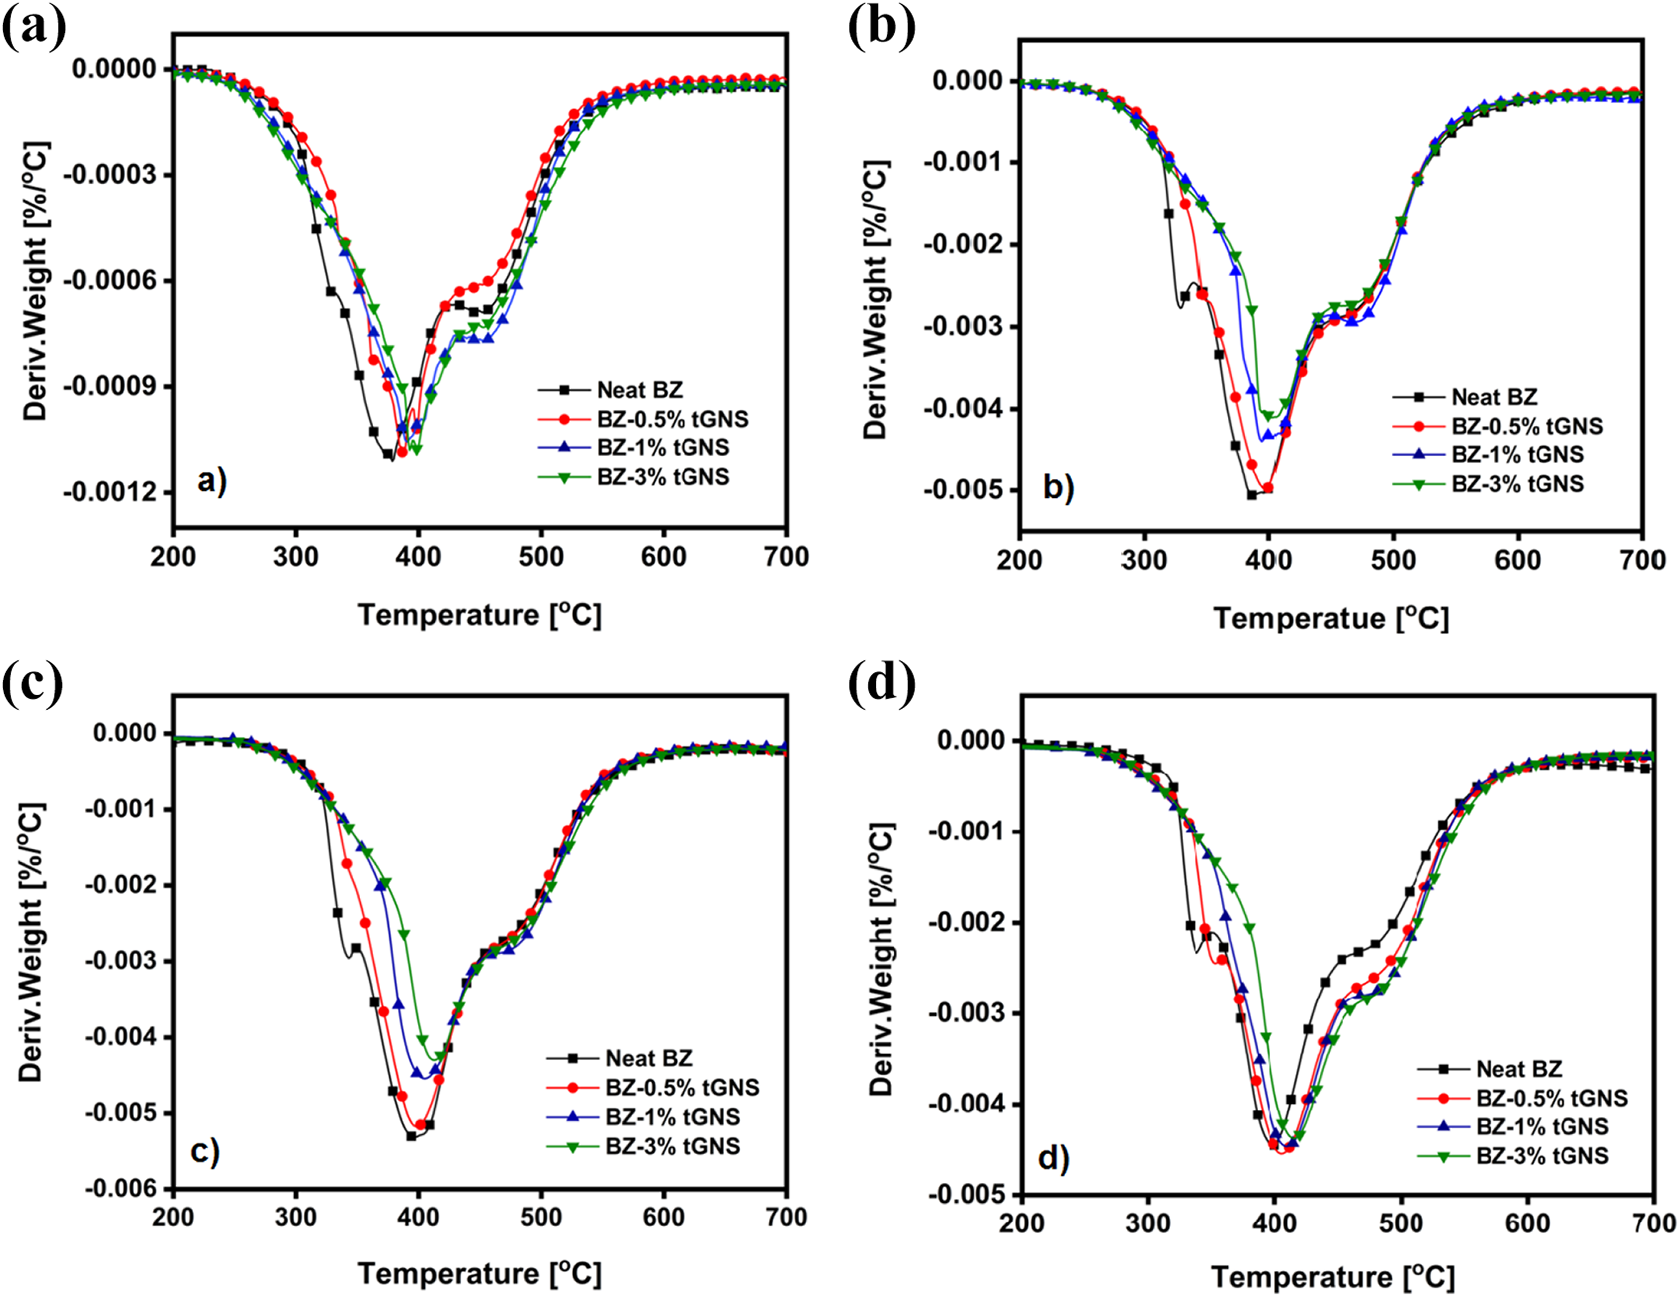
DTG thermograms of neat PB and its corresponding nanocomposites under a nitrogen atmosphere at the rate of (a) 10, (b) 20, (c) 30 and (d) 40°C min−1.
Temperature of maximum thermal decompositions at each stage from DTG thermograms.

To have a better understanding of the effect of tGNS on the thermal behavior of filled and unfilled samples, the integral procedure decomposition temperature (IPDT) was calculated and presented in Table 2. The method was first proposed by Doyle 43 which is correlated with volatile materials of samples and used to evaluate the inherent thermal stability of samples. As a reliable procedure that takes account the whole shape of TGA graph, it gives advantage to precise data comparison by not involving the experimental conditions, particle size, shape, and appearance of the samples. The IPDT can be calculated as follows:

where A* is the area ratio of the total experimental curve defined by the total TGA thermograms. Ti is the initial experimental temperature and Tf is the final experimental temperature. In this study, Ti and Tf were 25°C and 800°C, respectively. A* and K* can be calculated by Equations (10) and (11). The representations of S1, S2, and S3 for calculating A* and K* have been shown in some reported works.44,45


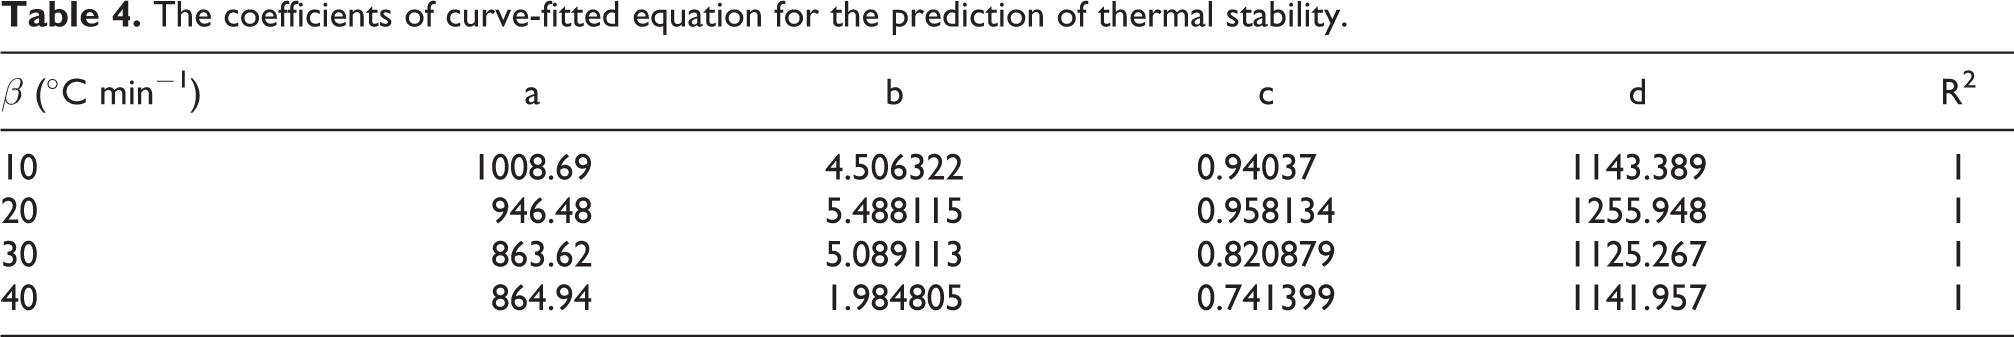
As presented in Figure 6, the IPDT values enhanced with the increasing of tGNS in all heating rates and trends had a noticeable jump at 1%. This could be attributed to different behavior of graphene nanoparticles below and above their percolation volume fraction for network formation. 46 The network of arranged layered graphene essentially hindered the released volatile materials above 1%, consequently led to improvement of thermal stability of samples. The IPDT from the average value of 921°C for neat PB was enhanced to 959, 1076 and 1162°C for 0.5, 1 and 3% of tGNS, respectively. When compared to the system of highly filled nano-SiO2 PB from Dueramae, 47 it could be concluded that the IPDT at lower amount of tGNS is comparable to that of high amount of SiO2. Also, a nonlinear curve fitting was done with the symmetrical sigmoidal equation as a way to predict the thermal stability of samples and the derived coefficients were presented in Table 4.

IPDT results for the neat PB and its corresponding nanocomposites at the heating rates of 10–40°C min−1.
The coefficients of curve-fitted equation for the prediction of thermal stability.
Thermal degradation kinetics parameters of PB-filled tGNS
The effect of nanoparticles on the degradation mechanism of PB was investigated with great extent of scope, using calculated thermal kinetic parameters. After the samples were characterized at different heating rates (i.e. 10, 20, 30, 40°C min−1), the activation energies of each sub-stage were obtained from the slope of the curve of ln(β/Tp2) versus 1/Tp using Equation (7) as presented in Figure 7(a–d). The calculated values of Ea from Kissinger method are listed in Table 5. Results showed that the addition of tGNS in each sub-stage increases the required activation energy for decomposition to proceed, except for stage 1. Two competitive factors are supposed to affect the changes of activation energy in this regard; one is the degradation of functional moieties of tGNS that accelerates the decomposition of base resin and other the barrier effect of graphene that causes thermal stability enhancement. With this in mind, it can be concluded that in early stages of decomposition the first effect dominates the second one yet, at higher conversions, the layered structure of GNS sheds light on the enhancement of thermal stability. The effect is prominent when considering the changes of activation energy within third stage. It is seen that the value raised from 275 kJ mol−1 for neat PB, to 433 kJ mol−1 for nanocomposite containing 3 wt% of tGNS.
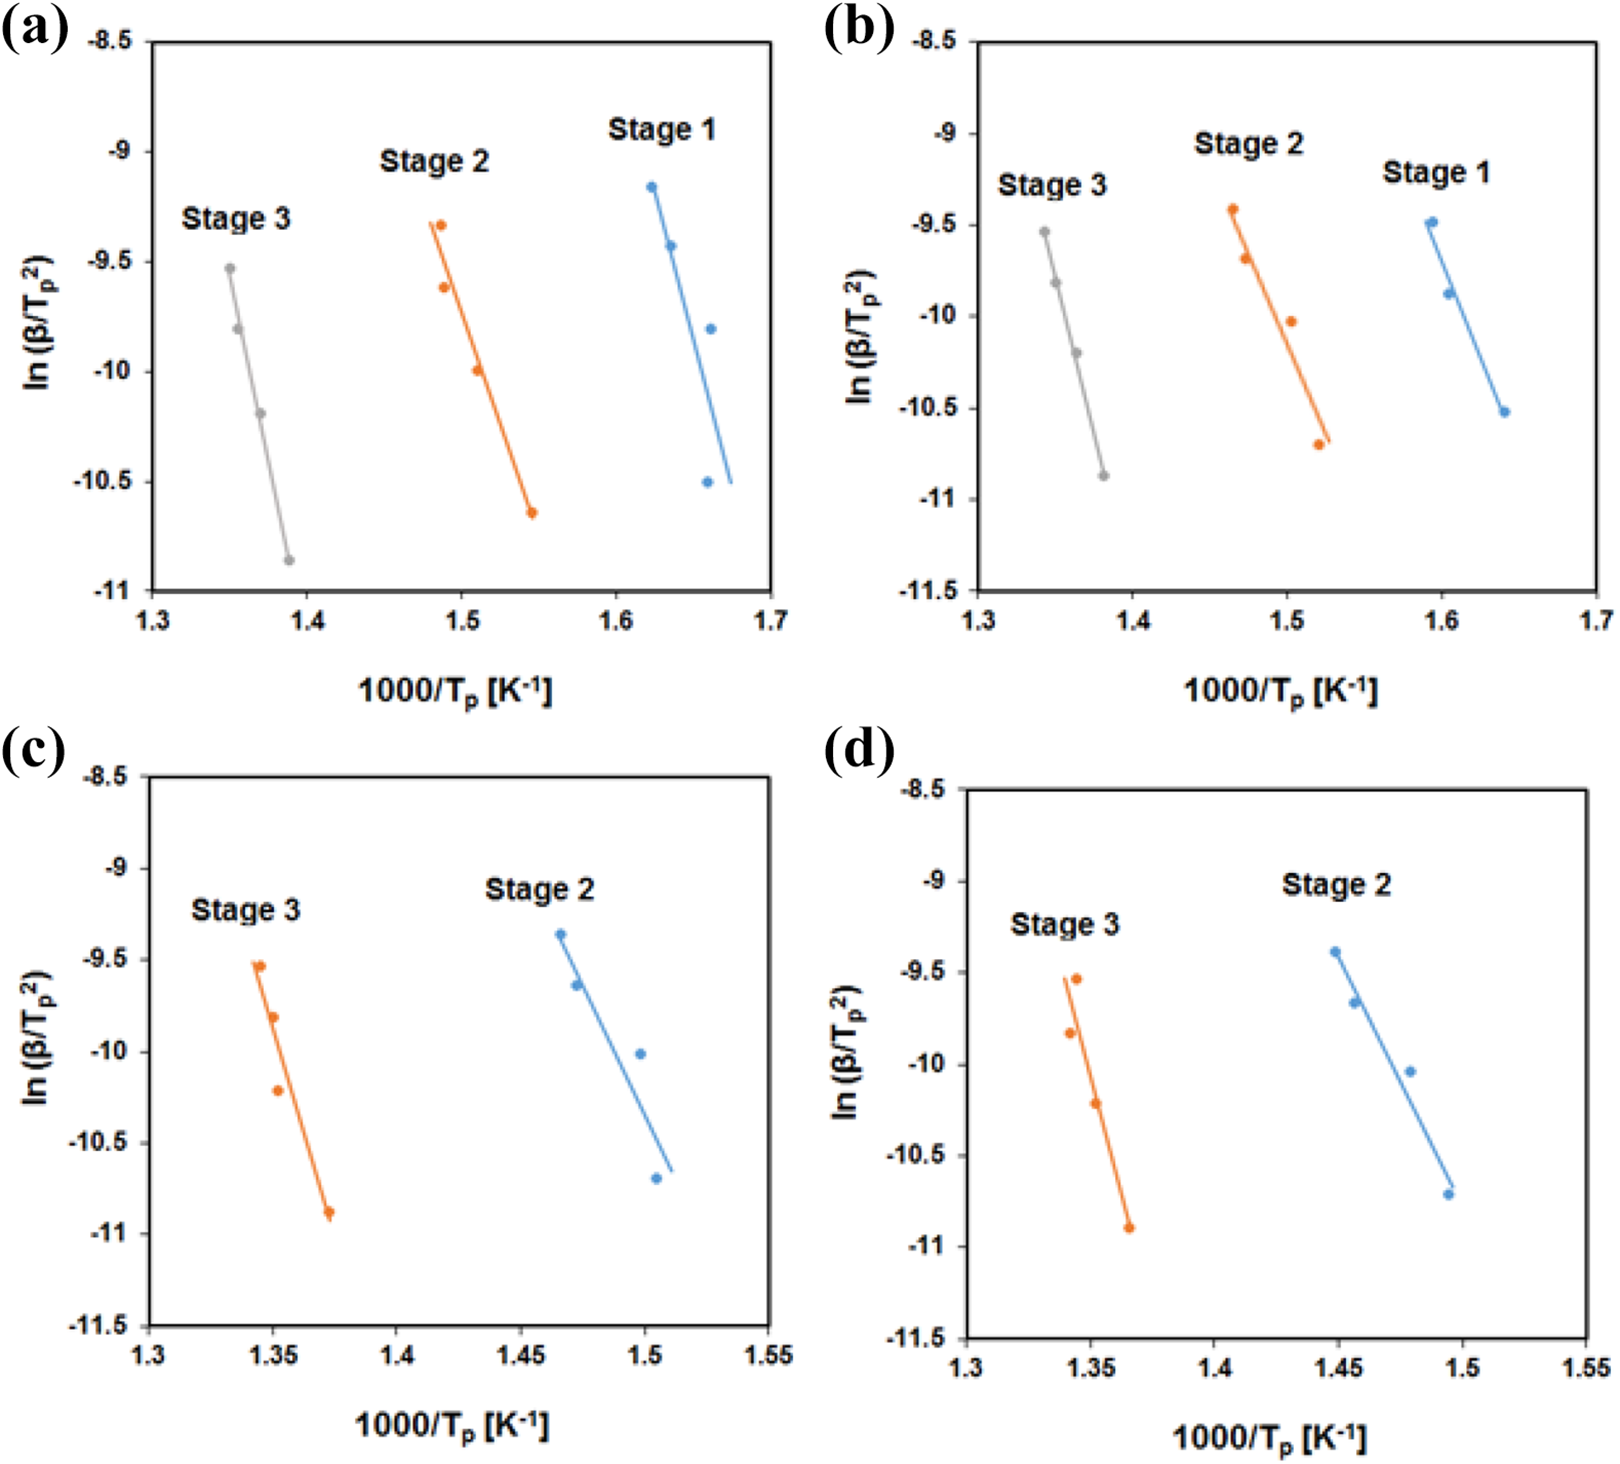
Plots of ln(β/Tp2) versus 1000/Tp at different heating rates based on Kissinger method for the (a) Neat PB (b) BZ-0.5% tGNS (c) BZ-1% tGNS and (d) BZ-3% tGNS.
Activation energies obtained by Kissinger method for PB and its nanocomposites.

One of the disadvantages of using Kissinger method is that it fails to predict the changes of Ea within different conversions and is incapable of presenting the phenomena in case of multistep degradation kinetics. 48 Consequently, the role of isoconversional methods become momentous to figure out the detail variations of Ea in terms of conversion to have a clear approach in order to demonstrate the mechanism of decomposition for each sample. Therefore, the FWO and Friedman models as an integral and differential isoconversional methods were adopted to analyze the dependence of activation energy on the reaction rate. For this purpose, all DTG curves were deconvoluted using OriginLab® software to investigate each peak contribution in the decomposition kinetic as exemplified in Figure 8 for the neat PB at the rate of 40°C min−1. Then, the activation energies for a fixed degree of conversion were calculated from the slope of graph of ln[β(dα/dT)] against 1/T for Friedman method (equation (5)) and graph of log(β) against 1/T for FWO method (equation (6)). The resulted Ea from both methods were depicted in Figure 9(a–d). The Ea was obtained for the neat PB resin and its nanocomposites in the degree of conversion interval from 0.1 to 0.8, with Δα = 0.1. Due the non-reliability of the Ea values obtained in the interval of 0.8 to 1.0, this range was not analyzed.
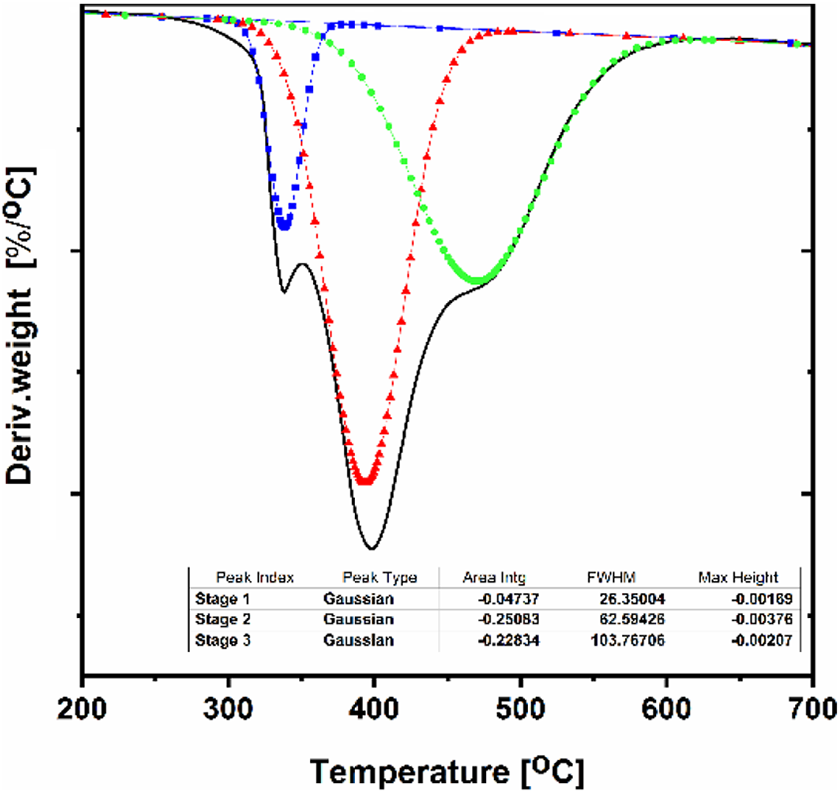
A schematic DTG curve of deconvoluted peaks for neat PB at the rate of 40°C min−1.
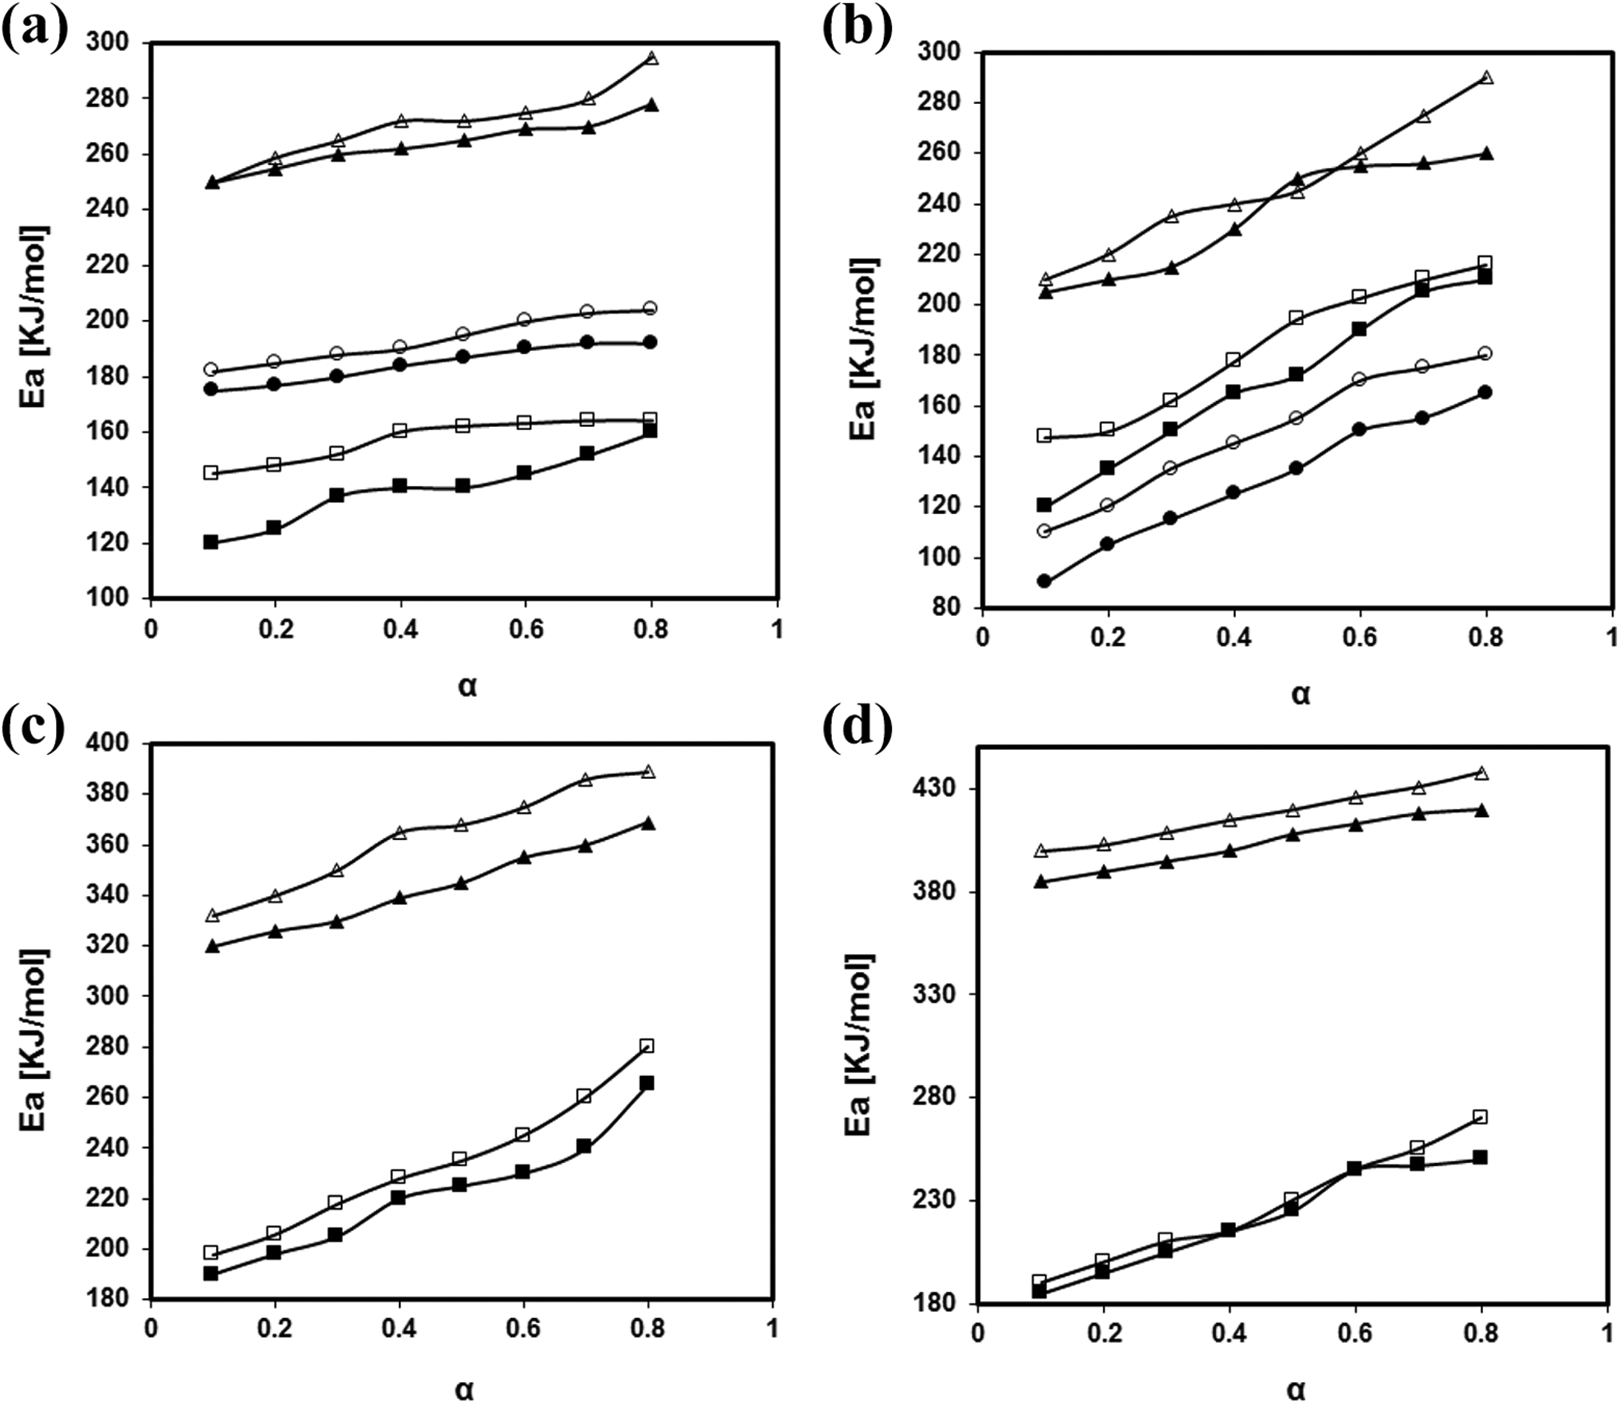
Friedman (solid symbols) and FWO (open symbols) plots at different conversions of (a) neat PB, (b) BZ-0.5%tGNS, (c) BZ-1%tGNS, (d) BZ-3%tGNS for stage one (circle symbol), stage two (square symbol) and stage three (triangle symbol) of decomposition.
Comparing the Ea versus α curves for two methods used, it can be seen that the values obtained from differential method of Friedman deviates from the integral method of FWO. This results were reported 34 and approved, since the integral methods are based on some mathematical approximations whereas the differential methods are based on the instantaneous rate of conversion.49,50 Figure 9 shows that the activation energy of each stage of degradation is dependent of the degree of conversion α, with an overall increase over the degree of conversion for both methods. Although each stage of degradation was separated, no specific trend was observed for the changes of Ea which implies that within each stage, there are other sub stages of degradation that affect the overall decomposition 51
The activation energy of the material is increased as tGNS is added and its effect is more prominent at the third stage indicating that the thermal stability of nanocomposites is much approved at higher temperatures and more energy is necessary to initiate the thermal degradation. Another interpretation to achieve a proper decomposition kinetics is to monitor the steep rise of Ea. It was shown that the presence of functional moieties on the surface of the tGNS had negative effect on the Ea. However, the possible chemical grafting between the epoxide groups of tGNS and the phenolic hydroxyl groups of benzoxazine resin 30 influences the thermal stability by increasing the steep rise of Ea.
Coats–Redfern (CR) integral method have been proposed by many authors52,53 to estimate the degradation kinetic parameters for polymer materials. Here, the method was employed to determine the most probable theoretical kinetic models for each stage of degradation by comparing the calculated Ea values from CR with FWO method. The activation energies and pre-exponential factors (lnA) values for various models were determined from CR method at the rate of 20°C min−1 and presented in Table 6. The results showed that for the neat PB the first and third stage of degradation follows F2 and D3 model respectively, and it changed to F1 for the second stage with the Ea of approximately 123 kJ mol−1. Also, when 0.5% of tGNS added, the kinetic model could be as F1, F2 and D3 for the first stage and F2 and D3 for the second stage. The D2 model can be dedicated as a probable integral function for the third stage with Ea of 217 kJ mol−1. At higher amount of tGNS, it is hardly to consider f D2 and D3 for the second stage of degradation due wide range of calculated Ea from FWO and no specific model for the second and third ones. Other researchers also reported the that the most probable kinetic model to delineate the mechanistic approach of benzoxazine nanocomposites is D3 and F1. 47
Values of activation energy and pre-exponential factor based on CR method for neat PB and its corresponding nanocomposites at heating rate of 20°C min−1.

Conclusion
We reported the effect of plasma treated graphene nanosheets on the thermal stability of PB. Nanocomposites were prepared via solution mixing and the XRD and SEM approved the dispersion of nanoparticles within resin matrix. The state of complete curing was endorsed by DSC technique. TGA results revealed that the addition of only 1% of tGNS enhanced the char formation of PB by about 7%. DTG thermograms showed that first stage of PB degradation was disappeared when loading 1% and higher of tGNSs. Also, the IPDT value of neat PB raised from 1009 to 1143°C using 3% of tGNS. To kinetically trace the thermal decomposition of PB and its nanocomposites, the differential method of Freidman along with integral methods of Kissinger and FWO were used. Using 1 and 3% of tGNS the obtained activation energy was enhanced from 168 to 224 kJ mol−1 and 275 to 420 kJ mol−1 for the second and third stage of degradation, respectively. Finally, the CR method was employed with the aim of probable model determination for each stage. While at higher amount of tGNS no specific model can be dedicated, at 0.5% of tGNS, the kinetic model could be as F1, F2 and D3 for the first stage and F2 and D3 for the second stage.
Footnotes
Declaration of conflicting interests
The author(s) declared no potential conflicts of interest with respect to the research, authorship, and/or publication of this article.
Funding
The author(s) received no financial support for the research, authorship, and/or publication of this article.