
Abstract
Polytetrafluoroethylene (PTFE) polymer has a wide range of applications in various industries. Therefore, for designers it is essential to know the strength properties of the material under dynamic loads. In this study, pure-PTFE, bronze and carbon filled-PTFE are tested under dynamic load. In addition, pure and carbon filled specimens were used to determine the temperature effect of PTFE. All tests were carried out in the Charpy impact device according to impact essential work of fracture method. At 23°C, pure-PTFE showed the highest impact strengths, bronze filled-PTFE and carbon filled-PTFE showed lower respectively and it has been found that the carbon filler increases the fracture toughness approximately two times at high temperature (150°C). On fracture surfaces phase transitions effects of PTFE and behavior of fillers used were investigated with Scanning Electron Microscope.
Keywords
Introduction
Polytetrafluoroethylene polymer was discovered in 1941 by Plunkett. 1 PTFE polymer is a material with superior physical, chemical and electrical properties 2 and it has the most common use among fluoropolymers. This material is used in various applications such as automotive, petrochemical-power, aerospace, food processing and chemical industries, and biomedical-pharmaceutical, electrical, defense, water-air treatment applications. 3 Various reinforcing elements such as carbon, graphite, MoS2, glass fiber and bronze are used to improve the physical, thermal and electrical properties of PTFE. 4
PTFE indicates complex crystalline phase behavior, and it shows four different phases depending on pressure and temperature. Eby et al. 5 investigated the crystal structure at high pressure of PTFE and they showed temperature-pressure-CF3 concentration phase diagram. At two phases, Clark 6 investigated the molecular structure and with this study, the temperature-pressure phase diagram was simplified. Brown and Dattelbaum 7 examined the effect of the crystalline phase on fracture and microstructural change of PTFE. In Figure 1, the pressure-temperature diagram is shown at Celsius unit. At atmospheric pressure, there is phase II below 19 degrees and the molecular structure approaches the helix 54/25. Phase II exhibits a triclinic unit cell consisting of two molecules of the opposite hand and aligns as three dimensional. Between temperatures 19°C and 30°C, the phase IV is observed and its molecular structure is a 15/7 helix. In the phase IV, the unit cell is hexagonal as metric and it consists of only one molecule. Also, the structure develops some defects. Above 30°C, phase I is observed. In this phase, hexagonal cell sizes increase and ultimately, a misleading hexagonal unit cell and a deterioration at the sensitivity of the 15/7 helix occur. Thus, this causes to further irregularity in crystalline structure. The phase transitions affect dielectric constant, heat capacity, modulus of longitudinal ultrasonic waves and spectroscopic properties of the polymer. 8

Pressure-temperature diagram of PTFE. 7
Under the dynamic loads incoming on the materials, it is important to determine the damage mechanism of the materials. By knowing of the fracture behavior of PTFE, it can be commented on whether it complies with stress and environmental conditions. Thus, possible problems that may arise in the designed structure can be prevented. J-Integral, crack tip opening displacement (CTOD), essential work of fracture (EWF) methods are mostly used in determination of fracture behavior (fracture toughness) of ductile materials. Nowadays, the EWF approach is accepted for the determination of toughness values of polymers with high ductility. In the determination of the EWF approach, it is handled as the sum of two different regions which are the inner region where the fracture occurs and the outer region where the plastic deformation occurs. In other words, the first is called essential work of fracture and the other is called plastic or non-essential work of fracture. 9
In this study, fracture behavior of PTFE under dynamic loads was investigated by EWF method. For the experiments, the PTFE material was procured as pure, with carbon and bronze fillers. The choice of carbon and bronze filler ratios in PTFE was decided by looking at the product range of various manufacturers. The filler ratios of 25% and 40% were preferred for carbon and bronze ratios in PTFE, respectively.
PTFE polymer has a wide usage temperature range 10 and superior chemical resistance. 2 Due to these properties, it is preferred in industrial applications. Thus, it was aimed to determine the dynamic damage behavior at room temperature and high (at a temperature above the boiling point of water) temperature. In addition, the phase diagram which was seen from Figure 1 helped temperature selection so the change effect in two phases was determined. While pure and carbon filled-PTFE have good chemical resistance, bronze filled-PTFE is not suitable (less chemical resistance compared to carbon filled Efalon®).2,11 Therefore, the effect of two different temperatures has been studied for pure and carbon filled-PTFE. Consequently, impact test specimens were broken at room temperature and a higher temperature. The test results were converted to EWF method parameters and it was shown graphically.
Experimental
EWF method
In the EWF approach, the total work of fracture (


where L is the ligament length, B is the specimen thickness, wf is the specific total work of fracture and β is the shape factor related to the form of the outer plastic deformation zone. we refers to specific essential work of fracture and related to surface. And other, βwp is specific plastic deformation work and related to volume. For EWF concept, impact or tensile tests are applied to the specimens by notching at different lengths. According to each specimen, total work of fracture is found from the area under the load-time or displacement curve. By substituting these values in the Equation (3), specific total work of fracture values are calculated. According to values, the A wf -L points are superposed in graphic and linear regression analysis is applied. As a result of this analysis, the point where the linear regression line intersects the y-axis is we and the slope of the line is βwp.9,14,15

Materials
In this study, test materials (Efalon® PTFE) were procured from the manufacturer (Polikim A.S.) in plate form. PTFE plates with 6 mm thickness were used and these plates contain pure-PTFE, 25% carbon filled-PTFE and 40% bronze filled-PTFE. Experiments were performed at 23°C for all materials but only pure and 25% carbon filled-PTFE specimens were performed at 150°C to examine the temperature effect. Various properties of the materials (pure-PTFE, bronze filled-PTFE and carbon filled-PTFE) used in the study were determined by the manufacturer. In order to interpret the experiments, some of the mechanical and thermal properties of PTFE are given in Table 1.
Some of the mechanical and thermal properties of Efalon® PTFE. 10

Test methods
Single edge notched impact test (SENT) specimens (ISO 179-1) were used as test specimen in order to find the fracture toughness under dynamic load of PTFE. The specimens used in the experiments were cut according to the dimensions determined in ISO 179-1, the first notch of 2 mm length was opened in the milling machine and the sharp notch was made with fresh razor blade in desired L lengths. The main dimensions of the sample are shown in Figure 3.
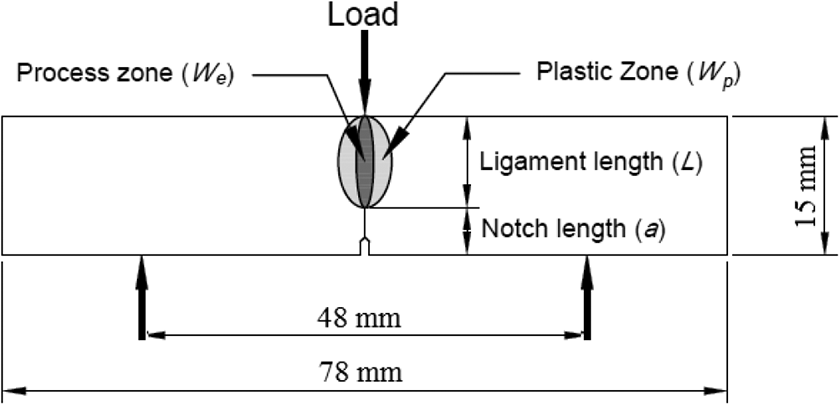
Dimensions of Charpy impact specimens used in experiments.
Charpy impact tests were performed by instrumented CEAST 6545 device. The impact test was carried out in a controlled atmosphere and the ambient temperature was maintained at 23 ± 1°. According to ISO 179-2 test standard in the instrumented impact device, the drop angle of the hammer was set at 150°, the energy was set at 7.26 J, 3.5 m s−1 impact speed and 16 milliseconds test time was determined. High temperature specimens were kept in the furnace at 150°C for 45 minutes, then the specimens were taken out one by one from the furnace and tested without waiting. The determination of the force-time curve was provided by combining 2000 pieces of data. All the area under the curves were calculated and EWF parameters of the material were calculated by using these values.
Microscopic investigation
In order to figure out the L values of the specimens, fracture surfaces were examined and this values were measured under optical microscope. The fracture surfaces of the samples damaged by impact test were examined in detail by Scanning Electron Microscope (SEM). For this purpose, the fracture surfaces of the specimens were coated with gold and this surfaces were photographed at different magnifications using JEOL JSM-6060 type SEM device.
Results and discussion
EWF properties
Typical force-time curves for PTFE specimens were shown in Figure 4(a–e). As shown in the figure, the force-time graphs were geometrically similar.

Typical force-time curves for (a) 23°C pure-PTFE, (b) 150°C pure-PTFE, (c) 23°C carbon filled-PTFE, (d) 150°C carbon filled-PTFE, (e) 23°C bronze filled-PTFE.
The area under the force-time curve is the energy that the material absorbs until it breaks. According to Eq. (3), computer-calculated wf and measured L values were shown in Figure 5(a–e) for all PTFE specimens. In addition, linear regression analysis was performed according to these values and we values were shown in aforementioned figure.

Linear regression analysis of (a) 23°C pure-PTFE, (b) 150°C pure-PTFE, (c) 23°C carbon filled-PTFE, (d) 150°C carbon filled-PTFE, (e) 23°C bronze filled-PTFE for EWF concept.
In Figure 5(a–e), the slope of the line generated by the regression analysis, was given with βwp values (and other EWF values) in Table 2. These values represent the energy consumed for plastic deformations at the notch end. This phenomenon is defined as a measure of ductility in fracture. If ductility of material is increased βwp will increase and thus, material ductility with βwp are directly proportional (in brittle material approaches zero).
EWF parameters.

According to EWF method, under the various conditions (specimen geometry, impact speed, temperature, etc.), we value is characteristic property. In samples tested at 23°C, maximum we value was found in pure-PTFE. This result is similar to manufacturer’s values given at Table 1. According to the manufacturer’s data, the order of the experiment values from highest to lowest is pure-PTFE, bronze filled-PTFE and carbon filled-PTFE, respectively. This behavior trend was parallel to the results of our study. In addition, βwp value was higher for bronze filled-PTFE specimens than the others. This means that the fracture energy is more consumed in the outer plastic deformation zone, and it can be said that the fracture is relatively closer to the ductility.
PTFE is a semi-crystalline material and it shows four different crystalline phase structure at different pressure and different temperatures (Figure 1). Under atmospheric pressure, the crystal phase structure changes at 19°C and 30°C. In this study, the fracture behavior of the material in the crystalline phase ΙV structure at 23°C with the crystalline phase Ι structure at 150°C were investigated. In the transition to phase I from phase IV, the hexagonal helical structure of the PTFE atoms dissolves and these atoms turn into a misleading hexagonal crystal structure. Irregularity occurs in dynamic adaptation and it consists of long-range positional and orientation order. Thus, an unstable brittle fracture is observed under dynamic load. 7 In other studies, the fracture toughness of pure-PTFE by the J-Integral method was awhile continued upward tendency with increase of temperature after 30°C, thereafter this value was outstretched to tendency decrease with increasing temperature (after of 100°C).7,16 23°C fracture toughness value was found to be higher (according to 150°) in our study. This situation was shown up by the change of the crystal phase structure. In addition, specific plastic deformation work of 150°C pure-PTFE was found to be approximately zero. It was concluded that all of the fracture energy coming to material was spent in the inner fracture process zone. This behavior was similar to Cho and Paul, 17 Laura et al, 18 Tjong et al. 19 studies.
we value of carbon filled-PTFE at 23°C and 150°C was found to be 4.7007 kJ m−2 and 8.3139 kJ m−2, respectively. As it can be seen, we value was increased about two times with the effect of carbon filler at high temperature. Thus, fracture toughness of carbon filled-PTFE at high temperature was improved by the effect of carbon filler. In addition, the specific plastic deformation work value has decreased with the increase of the temperature (from 23°C to 150°C) and this result was caused by the changing phase structure (from phase IV to phase I) of PTFE.
SEM observations
At 23°C (under atmospheric conditions), the structure of pure-PTFE is at phase ΙV 7 and fracture surfaces were shown in Figure 6(a). As shown in Figure 6(b), the composition of microspheres and effect of smearing were observed under the influence of local deformation at the beginning of fracture. The fracture surface differences between front and back sides of the ligament length were observed (Figures 6(b) and 6(c)). This behavior was expressed as the difference in resistance to crack propagation, thereby providing reformative effect on fracture toughness.

(a) General fracture surface (23°C), (b) beginning of fracture (23°C), (c) continued region of fracture (23°C), (d) general fracture surface (150°C), (e) beginning of fracture (150°C), (f) continued region of fracture (150°C) SEM images for pure-PTFE.
At 150°C (under atmospheric conditions), the structure of pure-PTFE is at phase Ι 7 and fracture surfaces were shown in Figures 6(d), 6(e) and 6(f). Relatively brittle fracture was observed with the change of structure and smearing effect was observed in all fracture surfaces.
Fracture surfaces of bronze filled-PTFE were shown in Figures 7(a), 7(b) and 7(c). In Figure 7(a), orientation effect with impact load was consisted. At the beginning of fracture, large masses were separated from surface by local deformations. However, this was not seen in onward fracture surface of specimen. Smearing effect was observed in all fracture surface images (Figures 7(b) and 7(c)). In addition, bronze particles were poorly clung in matrix phase. Thus, fracture toughness was affected in decreasing direction.

(a) General fracture surface (23°C), (b) beginning of fracture (23°C), (c) continued region of fracture (23°C) SEM images for bronze filled-PTFE.
At 23°C, fracture surfaces of carbon filled-PTFE were shown in Figures 8(a), 8(b) and 8(c). In Figure 8(a) orientation effect with impact load was consisted and generally large masses were separated from surface by local deformations. Carbon particles were broken on (Figures 8(b) and 8(c)) the fracture surface. This caused to brittle fracture. At 150°C, fracture surface of carbon filled-PTFE was shown in Figures 8(d), 8(e) and 8(f). According to figures, fracture behavior was similar but more large masses were separated from 150°C test specimen surface (Figure 8(d)). Carbon particles were generally torn off from the fracture surface (Figures 8(e) and 8(f)). Definitely, carbon particles were forced to displace, and so this behavior resulted in increased fracture toughness. As a result, the behavior of carbon particles on the fracture surface affected the amount of large masses that broke off, so this behavior determined ductile-brittle transition. The effect of carbon additives on fracture toughness at different temperatures was determined by the changing phase structure of PTFE and the behavior of carbon particles at high temperatures.

(a) General fracture surface (23°C), (b) beginning of fracture (23°C), (c) continued region of fracture (23°C), (d) general fracture surface (150°C), (e) beginning of fracture (150°C), (f) continued region of fracture (150°C) SEM images for carbon filled-PTFE.
Conclusions
Under dynamic loads, fracture behavior of PTFE with different additives and different temperature effects was investigated successfully by EWF method and the following results were obtained.
At 23°C, the highest impact strengths were found to be pure-PTFE, bronze filled-PTFE and carbon filled-PTFE, respectively and bronze filled-PTFE specimens were found to be relatively closer to the ductility.
For pure-PTFE specimens, at 23°C specific essential work of fracture value was higher than 150°C. Thus, it was shown that fracture toughness decreases with change in crystal phase structure at two different temperatures. In addition, this situation was successfully interpreted with SEM observations.
For carbon filled-PTFE, at 150°C specific essential work of fracture value was higher than 23°C. Despite the change in crystalline phase structure of PTFE with temperature, fracture toughness value (nearly doubled) has been developed at high temperature with carbon filler.
Footnotes
Declaration of conflicting interests
The author(s) declared no potential conflicts of interest with respect to the research, authorship, and/or publication of this article.
Funding
The author(s) received no financial support for the research, authorship, and/or publication of this article.