
Abstract
In the present article, acoustic emission signals were utilized to predict the damage in polymer matrix composites, reinforced by carbon fibers, in the low-cycle fatigue regime. Displacement-controlled fatigue tests were performed on open-hole samples, under different conditions, at various displacement amplitudes of 5.5, 6.0, 6.5 and 7.0 mm and also under various displacement rates of 25, 50, 100 and 200 mm/min. After acquiring acoustic emission signals during cycles, two characteristic parameters were used, including the energy and the cumulative energy. Obtained results implied that the energy parameter of acoustic emission signals could be used only for the macroscopic damage, occurring at more than 65% of normalized fatigue cycles under different test conditions. However, the cumulative energy could properly predict both microscopic and macroscopic defects, at least two failure types, including matrix cracking at first cycles and the fiber breakage at last cycles. Besides, scanning electron microscopy images proved initially such claims under all loading conditions.
Keywords
Introduction
Composites, due to high strength and low weight, have been widely used in structures, especially in aerospace and automotive applications. These structures are usually working under cyclic loadings, which can be categorized in two regimes, including high-cycle and low-cycle fatigue loadings. The high-cycle fatigue occurs when the loading amplitude is low under cyclic conditions and the low-cycle fatigue is experienced by the material under high loading amplitudes. Thus, understanding of the fatigue behavior is important for designers. For this objective, different researches have been performed to obtain the fatigue behavior. More details of such works could be found in the following literature review.
The fatigue behavior of fiber reinforced composites was studied by Ma et al., 1 Shen et al., 2 Korkiakoski et al., 3 Pupurs et al., 4 Yudhanto et al., 5 De Baere et al., 6 Cole et al., 7 Fujimoto et al., 8 Dai et al., 9 Brunbauer et al., 10 Broughton et al., 11 Feng et al., 12 Llobet et al., 13 De Baere et al., 14 Garcea et al., 15 and Horrmann et al. 16 Some other researchers have published articles on the relation of the fatigue behavior of composites and acoustic emission signals.
For example, Roundi et al. 17 investigated static and fatigue behavior of glass fibers reinforced composites. They used acoustic emission signals to find the degradation and the damage in the material, during testing. Nixon-Pearson et al. 18 carried out fatigue testing on open-hole quasi-isotropic carbon fibers reinforced composites and found the damage development throughout the fatigue lifetime. They indicated that the delamination, matrix cracking at the surface ply and in subsequent plies occurred in the material, which propagated through the thickness at −45/0 interfaces. Loutas et al. 19 estimated the fatigue lifetime of composites, by acoustic emission signals plus the sophisticated multi-state degradation non-homogeneous hidden semi Markov model. Haggui et al. 20 studied the mechanical behavior on thermoplastic composites, using experiments, in addition to the acoustic emission approach. They illustrated that unidirectional composites dissipated higher amounts of the energy than that of cross-ply ones. Al-Jumaili et al. 21 found different cyclic damage mechanisms in carbon fibers reinforced samples. They identified the delamination and also matrix cracking properly by the parameter correction technique, predicted in an accurate damage location.
Maleki et al. 22 studied fatigue failures of cracked aluminum plates, which were repaired by one-side composites, using the acoustic emission approach and fractography images. They found that acoustic emission signals were powerful enough to characterize the failure process. Morscher and Maxwell 23 used electrical resistance, acoustic emission, and surface optical techniques to identify the fiber breakage and matrix cracking, during fatigue testing of SiC-based composites. Shahkhosravi et al. 24 obtained the effect of drilling parameters on the delamination during monotonic and cyclic testing of glass fibers reinforced composites. By acoustic emission and image processing techniques, they showed that drilling parameters had no significant effects on the material strength. Sikdar et al. 25 performed semi-analytical, finite element, and experimental works on the damage in honeycomb sandwich composites, by the acoustic emission technique. Their results demonstrated that the semi-analytical model plus the finite element simulation were both effective to find the arrival time of dominant acoustic emission wave modes.
Although above researches have been represented for the investigation of the fatigue behavior in carbon fibers reinforced composites; however, this topic still requires study. A conclusion could be made on the literature review, as follows, The number of researches on glass fibers reinforced composites2,3,11,17 is generally higher than that of carbon fibers reinforced composites. In addition, the number of articles on the high-cycle fatigue behavior (under stress-controlled conditions) of composites2,5,6,11,18 is more than that under displacement-controlled low-cycle fatigue loadings.
Therefore, it could be claimed that the novelty of this research could be listed as follows, Studying effects of the displacement amplitude and the displacement rate on the low-cycle fatigue lifetime in carbon fibers reinforced composites; the crack detection by the acoustic emission technique in carbon fibers reinforced composites, under low-cycle cyclic loading; and consequently, the damage prediction in carbon fibers reinforced composites for open-hole specimens, subjected to various displacement amplitudes and rates.
Materials and experiments
The fatigue behavior of the carbon fibers reinforced polymer matrix composite was studied in this article. Unidirectional Sika-Wrap-230C carbon fibers and the CR-80 epoxy were used to fabricate the composite. The CH-80-2 hardener was also added to the mentioned epoxy with the weight percent of 30%. Then, a laminated composite plate was made with 14 (or 7 symmetric) layers. The plate dimension was 250 mm × 350 mm, where the thickness of each laminate was 3.2 mm. The hand lay-up technique was utilized for manufacturing of such a plate, considering the layer condition of [03/902/02]s. Then, open-hole samples were cut by the water-jetting method from the mentioned composite plate, according to the ASTM-D5766 standard. 26 It should be mentioned that more details of selecting this material with such a layout could be followed in the literature.27,28 Besides, the open-hole sample was selected based on the literature11,18 and also to have a guided initiation of failures. This hole was made in the specimen to determine the crack initiation location and therefore, to prevent the complexity of different parameters, which affected the problem. The geometry of the composite standard sample can be seen in Figure 1.

The geometry and the layer configuration in the sample.
For fatigue testing, a universal tension-compression device (SANTAM STM-150) was used. Figure 2 shows such equipment for testing standard composite specimens under cyclic loadings. In this machine, the capacity of loading was 150 kN, with the speed control of 0.001 to 500 mm/min by a servo electromechanical operation system. Different loading conditions could be done by such a device as tensile, compressive, bending, creep, cyclic and relaxation tests.
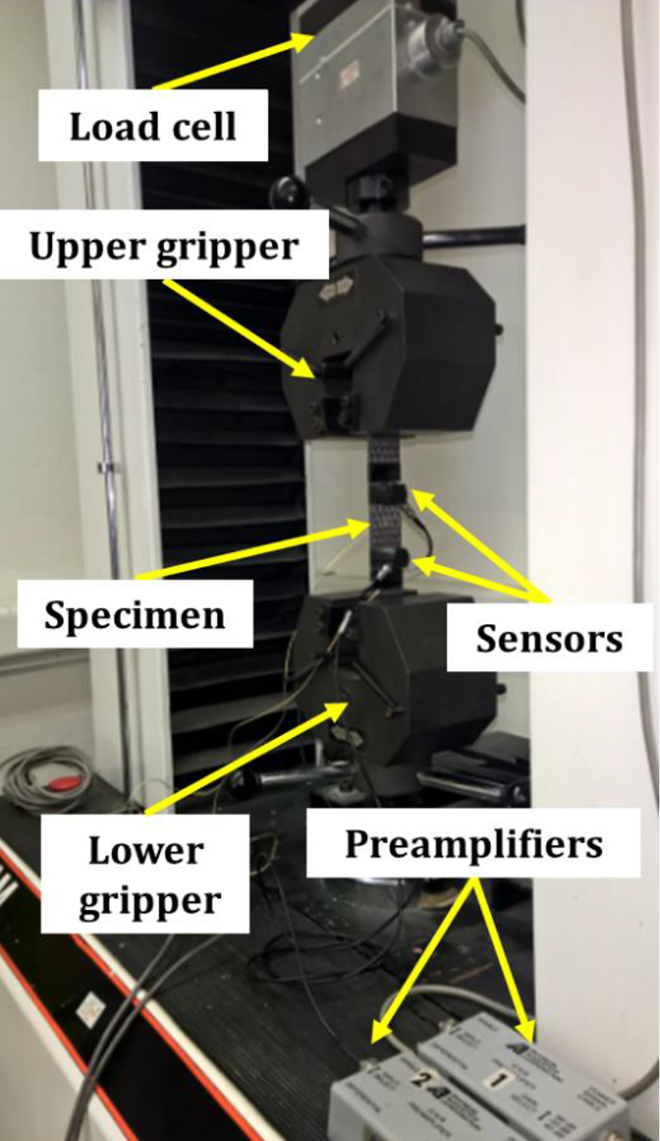
The equipment for cyclic loadings on samples.
Displacement-controlled cyclic loadings in the low-cycle fatigue regime were applied on composite standard samples under the tension-tension condition. The displacement ratio (Rd = dmin/dmax) was considered as zero or in other words, the minimum displacement was determined to zero. Two loading variables were changed in fatigue tests, including various displacement rates and amplitudes. When the displacement rate was 200 mm/min, the displacement amplitude was considered as 5.5, 6.0, 6.5 and 7.0 mm. In addition, when the displacement amplitude was 7.0 mm, the displacement rate (as the loading frequency of fatigue testing) was considered as 25, 50, 100 and 200 mm/min.
It should be noted that a fatigue test was repeated on samples and their results were reported. Due to having approximate similar experimental data, design tests could cover the repeatability of fatigue testing. The temperature on samples was also not measured quantitatively during fatigue testing, since the loading frequency was low enough to have no high temperatures on the specimen surface. 11 Therefore, the temperature effect could be neglected on material properties and failures. As another note, the changing level of the displacement rate (25 to 200 mm/min) was not in a logarithmic scale, again to prevent the complexity of various variables, which affected the problem and made it difficult to have a conclusion.
After fatigue tests, the XL30 scanning electron microscopy was utilized to study the fracture surface of composite standard specimens. The objective was to find the damage mechanism in composites, under cyclic loadings. This damage included the fiber pull-out, the fiber breakage, matrix cracking, debonding of fibers from the matrix, and the delamination.27-29 It should be noted that since the composite was not a conductive material, before each investigation, silver coating was applied on each sample in a vacuum environment.
During fatigue testing, acoustic emission signals were also acquired, as shown in Figure 2, besides measuring the force by the load cell. For such an objective, two wide-band sensors, with 100-1000 kHz of the frequency range, were installed on standard composite specimens, in order to record acoustic emission signals. In addition, two 2/4/6 preamplifiers were utilized to amplify signals, by the addition of 40 dB. The sample rate for acoustic emission signals acquisition was 1 MHz. Experimental data including acoustic emission signals were also saved using the PCI-2 analog to digital board plus the AE-win software. It should be noted that the threshold of acoustic emission signals was obtained to be 37 dB. The mentioned threshold value was obtained by a trial and error approach and performing tensile tests for three times, based on the literature.27-29 To have a comparison for such a value, Kharrat et al. 30 reported 40 dB for the threshold of the biaxial carbon fibers reinforced epoxy resin composite. As another important note, the ASTM-E976 standard 31 was utilized to calibrate sensors. To find cracks during fatigue testing, the energy and the cumulative energy of acoustic emission signals were considered.
To characterize acoustic emission data, some parameters could be extracted and calculated from initial signals. These parameters are depicted in Figure 3 and could be mentioned as “hit,” “count,” “amplitude,” “duration,” “rise-time,” and “energy.” More information could be found in the literature32-34 for the definition and the formulation of these parameters.
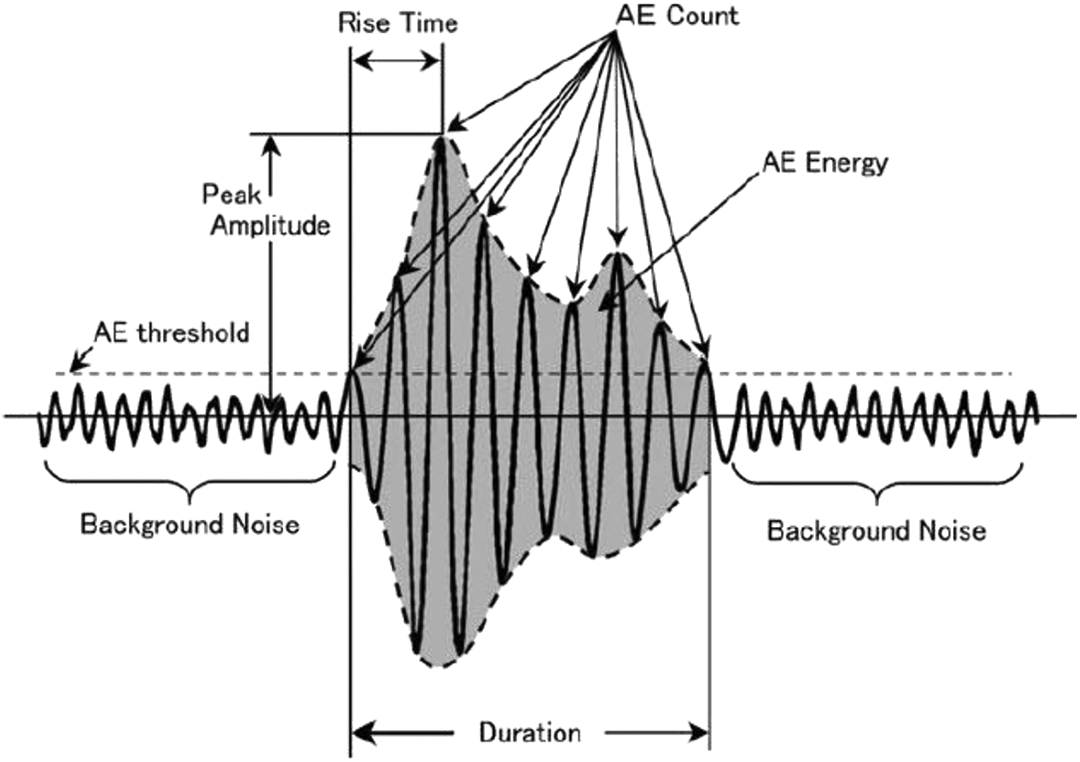
Parameters of acoustic emission signals. 34
More details about the used set-up for the acoustic emission approach could be seen in the literature.27-29,35-37 It should be noted that the sample rate was 1 MHz, compared to the displacement rate of testing as 25 to 200 mm/min. Considering the displacement amplitude of 5.5 to 7.0 mm, the largest time of one cycle in testing was about 33.6 s (according to the displacement of 25 mm/min and the displacement amplitude of 7.0 mm). The smallest time of one cycle in testing was also 3.3 s based on the displacement of 200 mm/min and the displacement amplitude of 5.5 mm. For the second case, which was the fastest experiment for one cycle, about 850 data were recorded by acoustic emission sensors, in one cycle for about 3 s. As another note, some data were eliminated due to the considered threshold of acoustic emission signals (mentioned as 37 dB).
Results and discussions
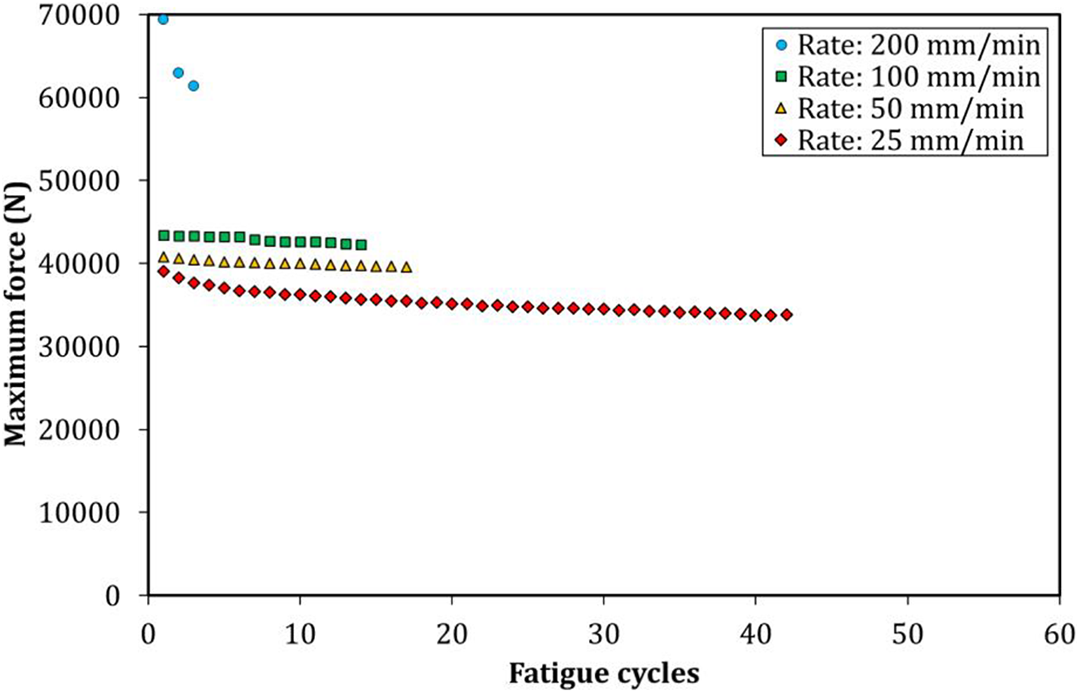
The maximum force versus fatigue cycles during cyclic loadings can be seen in Figures 4 and 5, as first obtained results. As an obtained result, when the displacement rate enhanced, the maximum force increased and the fatigue lifetime decreased, under a constant value of the displacement amplitude. In addition, decreasing the displacement amplitude led to decrease in the maximum force and therefore, the fatigue lifetime enhanced as expected, under a constant value of the displacement rate. It should be noted that the minimum force was approximately zero and thus, the mean force and the force amplitude had almost the same values. As another result, the maximum force decreased during cycles for all loading conditions. In other words, the degradation of material properties occurred and the strength of the composite decreased during cycles, under different displacement amplitudes and rates. Besides, the change in the maximum force for different displacement rates was lower than that for various displacement amplitudes. It means that the effect of the displacement amplitude was more significant than the influence of the displacement rate on the maximum force.
The maximum force versus fatigue cycles, under 7.0 mm of the displacement amplitude.

The maximum force versus fatigue cycles, under 200 mm/min of the displacement rate.
The dependency of the loading frequency on the high-cycle fatigue lifetime of carbon fibers reinforced silicon carbide composites was also represented by Staehler et al. 38 The range of the loading frequency was between 40 and 375 Hz for such a significant effect. They demonstrated that for 4-40 Hz of the loading frequency, the fatigue lifetime of materials had no changes. Failure mechanisms were also investigated to show that the decrease in the fatigue lifetime at high loading frequencies was due to macroscopic and microscopic characteristics and also temperature effects. The temperature enhancement occurred on the sample surface according to the internal heat generation. This heat generated, since there was the sliding friction between layers of the composite, under fatigue cycles. The temperature increased, when the loading frequency and also the applied force increased. 38
As mentioned before, in this research, the temperature was not measured during cycles, due to having low displacement rates. However, the overall behavior of studied materials under different displacement rates had an agreement with reported results by Staehler et al. 38 in composites. On the same material, Mall and Engesser 39 evaluated the high-temperature (550°C) high-cycle fatigue behavior of carbon fibers reinforced silicon carbide composites, under frequencies of 0.1, 10 and 375 Hz. They illustrated that the fatigue lifetime increased by enhancing the loading frequency, from 0.1 to 375 Hz. The reason was matrix cracks due to the mismatch between values of thermal expansion coefficients in carbon fibers and the silicon carbide matrix. 39
Figure 6 demonstrates the maximum force and also the acoustic emission energy versus cycles. In general, the energy of acquired acoustic emission signals had a peak value at last cycles, near the fatigue lifetime of specimens. As another observation, such a peak did not continue until the end of cycles. This high value could be evidence for the macroscopic damage in the material. In other words, in the first cycles, the microscopic damage occurred in the material and they would change to the macroscopic damage in the last cycles. This phenomenon could be observed by the peak in the energy of acoustic emission signals. The peak showed the initiation of a large failure. Then, since signals for the energy did not continue, the propagation of the failure could not be seen. Therefore, it could be claimed that the energy of acoustic emission signals was only applicable to predict the initiation of the macroscopic damage in carbon epoxy composites. Besides, Figure 7 depicts the energy of acquired acoustic emission signals versus normalized fatigue cycles. Based on this figure, high values for the energy of acoustic emission signals occurred at about 65-100% of normalized fatigue cycles. In other words, most macroscopic failures happened in the portion of 65-100% of the fatigue lifetime in composites. This point was also reported by previous researchers.40,41 From Figure 7, as another result, it could be concluded that no significant effect of the displacement rate and the displacement amplitude was observed on the mentioned portion of the fatigue lifetime for the macroscopic failure and also on the amount of the acoustic emission energy.
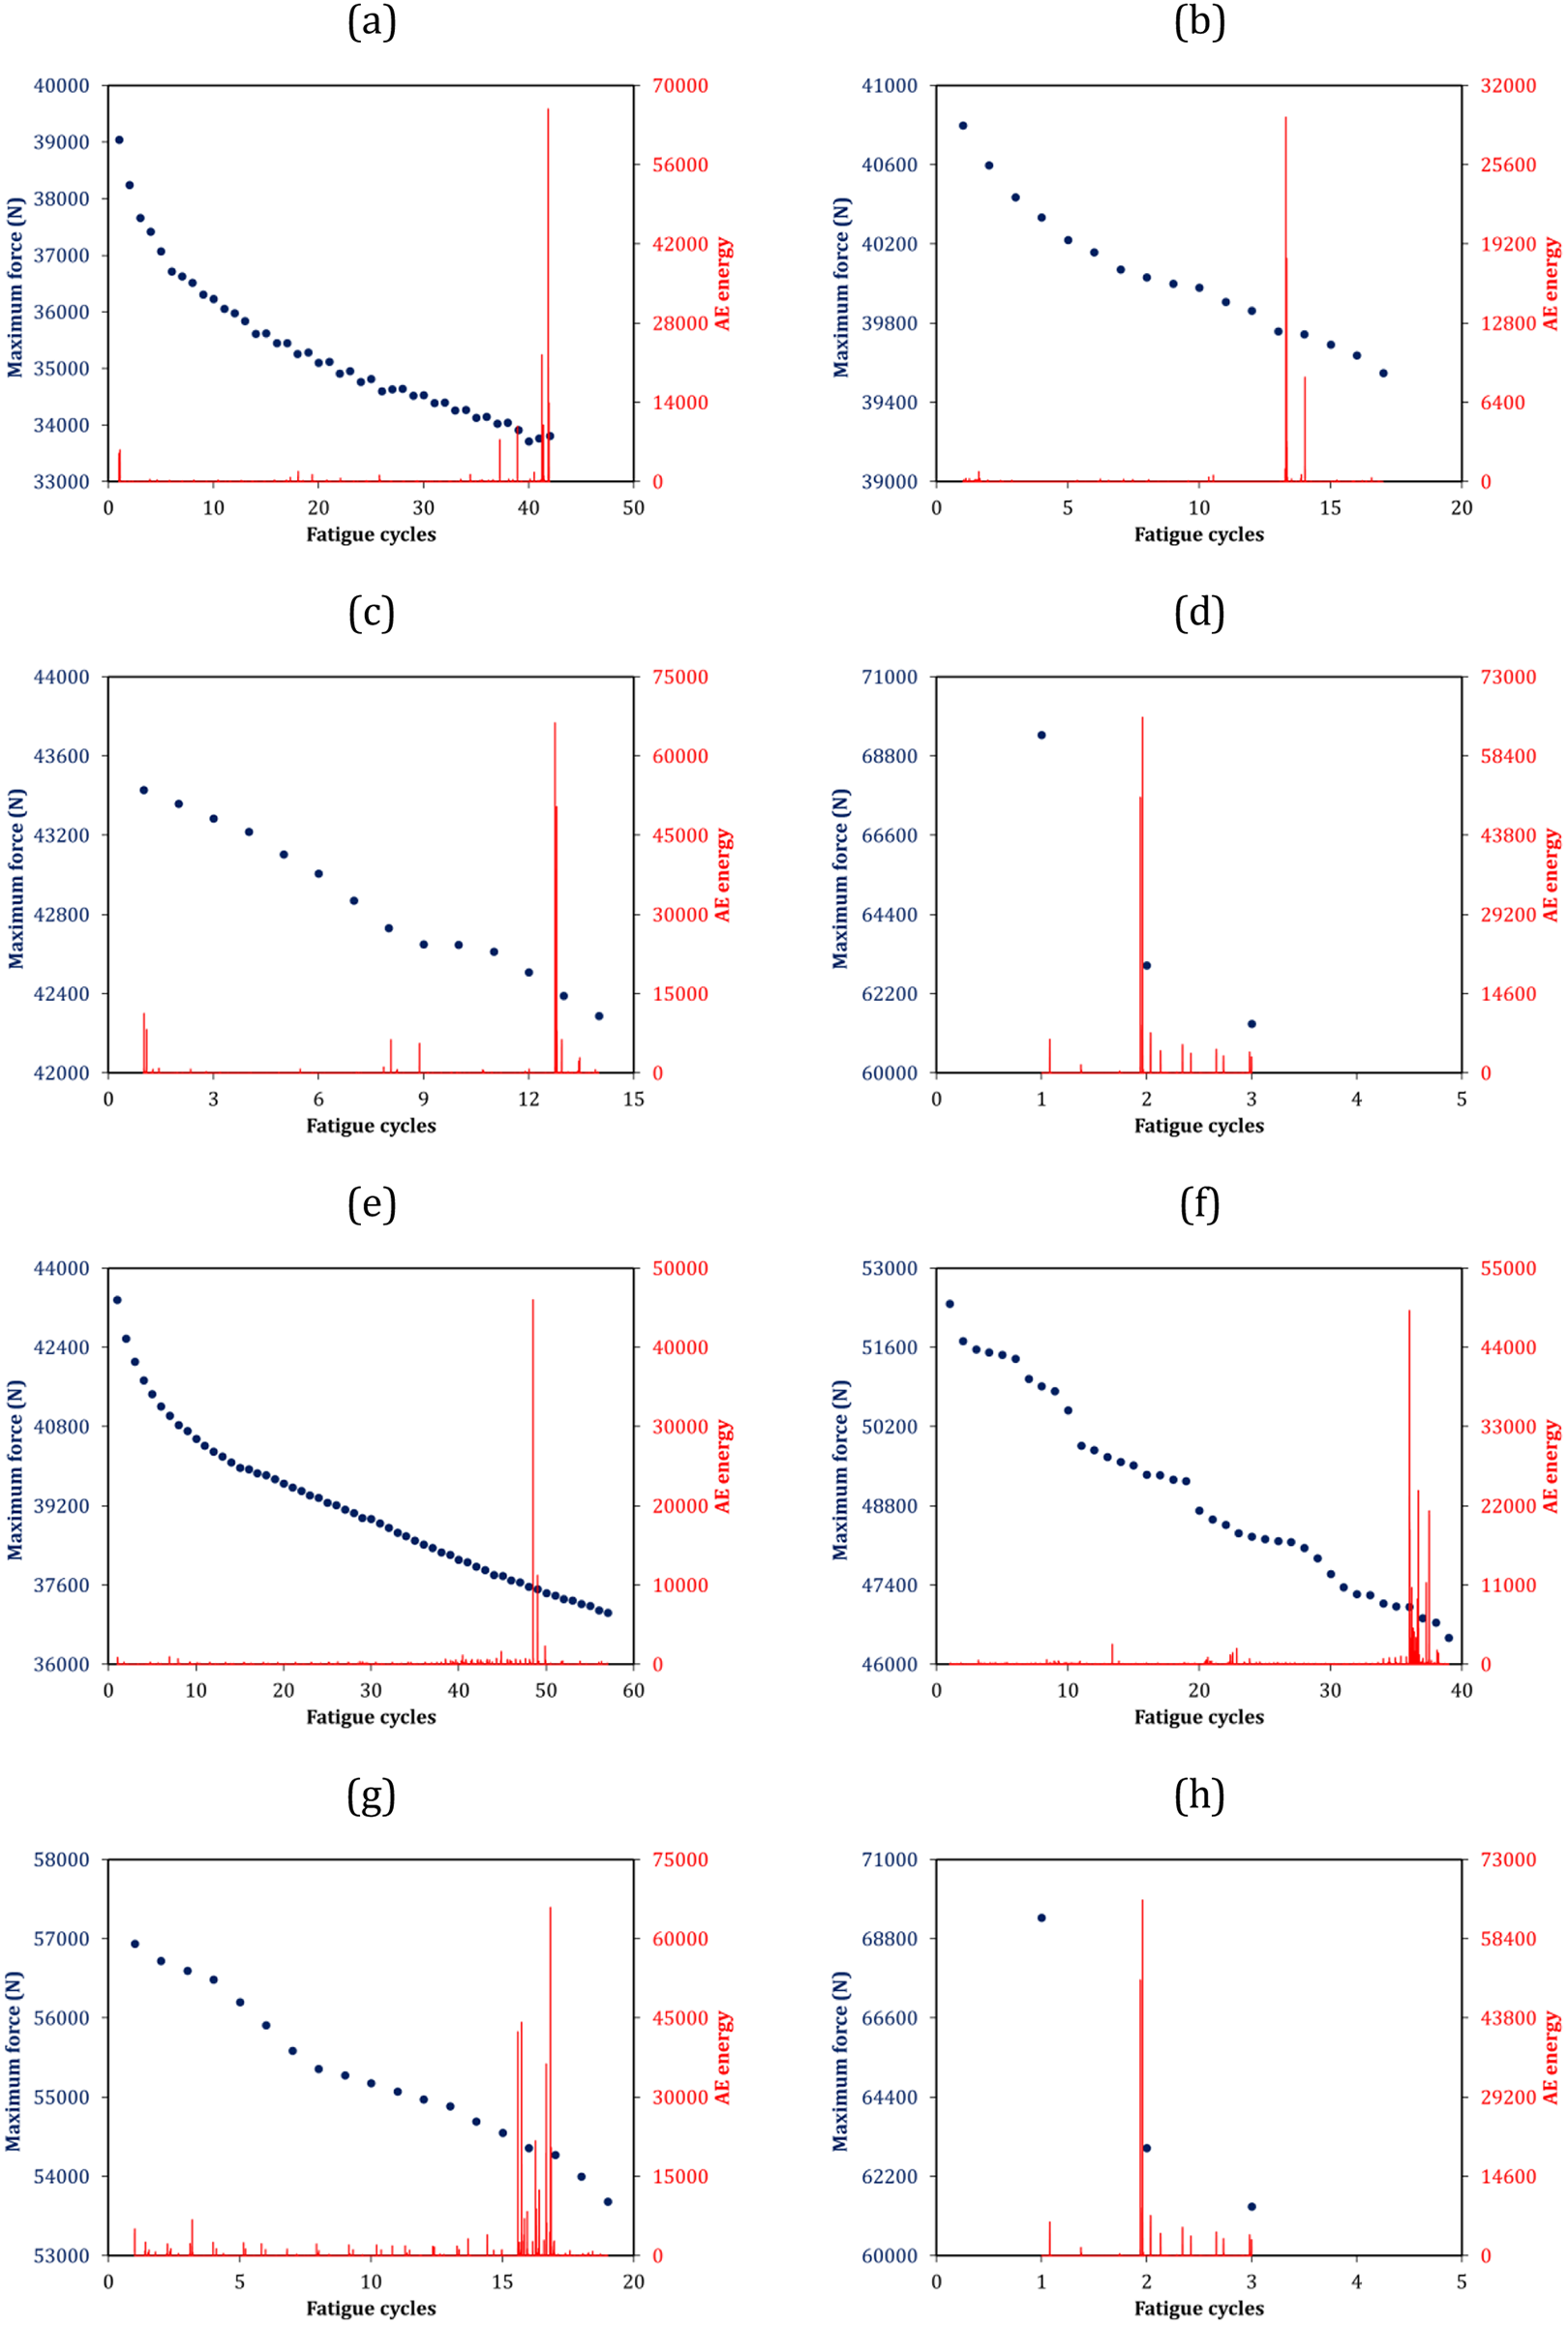
The maximum force plus the energy of acoustic emission signals versus fatigue cycles under 7.0 mm of the displacement amplitude: at (a) 25, (b) 50, (c) 100, (d) 200 mm/min of the displacement rate and also under 200 mm/min of the displacement rate: at (e) 5.5, (f) 6, (g) 6.5, (h) 7.0 mm of the displacement amplitude.

The comparison of energy values of acoustic emission signals versus normalized fatigue cycles (a) under 7.0 mm of the displacement amplitude and (b) under 200 mm/min of the displacement rate.
Figure 8 illustrates the maximum force and the cumulative acoustic emission energy, both versus fatigue cycles. In Figure 8, it could be observed that there were more than two sudden increases in the cumulative energy, during fatigue cycles. Such peak values in the cumulative energy could identify one fatigue failure, including one type or a combination of failure types, in carbon epoxy composites. It should be mentioned that the acoustic emission energy is strongly dependent on the amplitude and it is subjected to phenomena, such as the attenuation and the dispersion of elastic waves in materials. This could be a source of the error in obtained results. However, when the energy parameter was used under different fatigue test conditions, the value could be comparable.

The maximum force plus the cumulative energy of acoustic emission signals versus fatigue cycles under 7.0 mm of the displacement amplitude: at (a) 25, (b) 50, (c) 100, (d) 200 mm/min of the displacement rate and also under 200 mm/min of the displacement rate: at (e) 5.5, (f) 6, (g) 6.5, (h) 7.0 mm of the displacement amplitude.
Several researchers in the literature35,41-44 considered the relationship between acoustic emission parameters (including the hit amplitude and the energy level) and damage mechanisms. For instance, Wevers et al. 41 implied that the low energy level was corresponded to matrix cracks, the medium energy level was related to the delamination and finally, the high energy level confirmed fiber breaks. Despite these results, Ono 42 claimed that the low amplitude (<50 dB) of the energy was caused by fiber fractures. Besides, the medium amplitude (50-70 dB) of the energy was due to the delamination (both the initiation and the growth). Then also, Ono 42 found that rapid advances in the delamination caused the high amplitude (>70 dB) of the acoustic emission energy. Besides, some other researchers35,36,43,44 reported the frequency domain of damage mechanisms in carbon epoxy composites. They claimed that the lower frequency domain confirmed matrix cracking.35,36,43,44 Moreover, the medium frequency domain was based on debonding of fibers from the matrix and lastly, the higher frequency domain confirmed fiber breakages.35,36,43,44 It should be noted that these frequencies were reported for composites under tensile monotonic loading and high-cycle fatigue loading. As a contribution of this article, these values were compared to obtained results for composites under low-cycle fatigue loading.
In general, five types of damage mechanisms in carbon fibers reinforced composites could be categorized, including the fiber breakage, the fiber pull-out, matrix cracking, debonding of fibers from the matrix, and the delamination.35,36 For the simplicity, they could be recategorized in three groups. The first group is matrix cracking with the low energy. The third one is the fiber breakage with the high energy. Other defects including the delamination, the fiber pull-out and debonding could be in the second group with the medium energy.35,36
Two sudden increases could be seen in Figure 8 for the cumulative energy of acoustic emission signals. First peaks of the cumulative energy, in Figure 8 under all loading conditions, would demonstrate matrix cracking. Since the resin is brittle and would be cracked at first loading cycles. Besides, the amount of the cumulative energy was not so much, since the material had no high strength. In other words, the increase of the first peak was lower than that of the last peak. Thus, at last fatigue cycles, the peak of the cumulative energy was higher than that at first fatigue cycles. These peaks would be caused by the fiber breakage. Since carbon fibers had higher strength in comparison to that of the resin. Therefore, peaks occurred later with a higher amount. 45 Consequently, the cumulative energy could predict effective fatigue failures in composites, considering typical thresholds.
Oz et al. 46 reported that matrix cracking had high amplitudes and durations, where the delamination had low amplitudes and mid-durations. Moreover, the fiber breakage had high average frequency characteristics in polymer matrix composites. As an interesting result during testing, the delamination caused discontinuities between plies. 46 Their first observation in the damage mode was matrix cracking with fiber/matrix debonding at boundaries of plies and the resin pocket, which indicated an agreement with obtained results in this research. This failure mechanism was then followed by the delamination, initiated from corners of the resin pocket. Finally, the fiber breakage was detected by acoustic emission signals, which again confirmed the obtained results of this article. In another similar work, Oz et al. 47 used digital image correlation monitoring for measuring surface strains in carbon fibers reinforced polymer composites, besides the acoustic emission approach. They found that the cluster analysis for characteristic parameters of acoustic emission signals (including the signal amplitude and the frequency) was not enough to identify the damage type. A literature review was done in this study that implied 35-85 dB and 30-105 dB for the amplitude of matrix cracking and the fiber breakage, respectively. 47 The peak frequency was reported as 50-600 kHz and 150-1500 kHz for matrix cracking and the fiber breakage, respectively. 47
Figure 9 shows the cumulative energy of acquired acoustic emission signals versus normalized fatigue cycles. Based on the highest peaks or sudden increasements in this figure, a threshold could be considered for severe fatigue failures in the composite, after 65% of normalized fatigue cycles. It should be noted that this criterion is dependent on the acquisition threshold, the emissivity of the material, and the way that data were scaled on figures. Besides, as a confirmation for obtained results, Godin et al. 48 indicated that for ceramic matrix composites under fatigue testing, the acoustic emission energy was mainly located near the failure zone only after 60% of the total test duration, which was certainly caused by the fiber breakage. Moreover, in this research, composites reinforced by carbon fibers had severe damage due to the fiber breakage after 65% of cycles, under low-cycle fatigue regimes. In addition, this value was not affected significantly by the displacement amplitude and the displacement rate in fatigue experiments.

The comparison of cumulative energy values of acoustic emission signals versus normalized fatigue cycles (a) under 7.0 mm of the displacement amplitude and (b) under 200 mm/min of the displacement rate.
In addition, Ameur et al. 45 reported that matrix cracking was the first damage mechanism under tensile loading in carbon fibers reinforced composites. It started from the beginning stage of the test and would be continued until the final failure of the sample. The amount of this damage mechanism was more than 40% of the cumulative damage at the failure. Then, fiber-matrix debonding would appear in the second stage, after matrix cracking. Finally, the delamination, the fiber pull-out and the fiber breakage occurred near 40% of tensile loading at the failure. Such an investigation 45 under cyclic loadings indicated that matrix cracking had the greatest activity and fiber-matrix debonding had less activity. The delamination appeared from the first stage of fatigue tests and it was less than those of matrix cracking and fiber-matrix debonding. Lastly, the fiber pull-out and the fiber breakage occurred at the last stage of cyclic loading. They may be seen at the intermediate stage of testing. However, they increased sharply before the final fracture of the sample.
It should be mentioned that the first peak in the cumulative acoustic emission energy could not be predicted by the energy, shown in Figure 7. However, the second effective fatigue failure was the same as the one, depicted in Figure 7. As another result, the displacement rate and the displacement amplitude had no significant effect on these thresholds and also on the amount of the cumulative energy.
As another note, three different phases in normalized fatigue cycles (shown in Figure 9) could be recognized, which were also presented by Nor et al. 49 for acoustic emission signals on reinforced concrete beams. At the beginning stage of fatigue loading, cumulative acoustic emission signals increased sharply. Then, cumulative signals enhanced slowly in the second stage and at the last stage, cumulative signals increased rapidly due to the final failure. Nor et al. 49 reported that the first stage of the fatigue damage process occurred less than about 5% of the fatigue lifetime in reinforced concrete beams. For the third stage, it occurred about 80% of the fatigue lifetime in materials. The remaining fatigue lifetime percentage was related to the second stage. Kharrat et al. 30 also suggested that the damage index curve could be described through three stages. The first stage was characterized by a rapid stiffness degradation, then followed by a gradual decrease in the stiffness, and finally, the damage accumulation, which caused a significant decrease in the stiffness of the composite, prior to the failure. In this study, for a comparison to the literature, the first stage occurred below 35% of the fatigue lifetime in the carbon fibers reinforced composite. The related damage for this stage was matrix cracking. As mentioned before, the last stage was more than 65% of the fatigue lifetime due to the fiber breakage. For 35% and 65% of cycles, other damage would occur in the composite, including the fiber pull-out, debonding of fibers from the matrix and the delamination.
It should be noted that such a difference between obtained results (for categorizing three stages of the damage process) and other results in the literature 49 could be due to the selection of the threshold and also the material type. In this study, the threshold value (37 dB, near to 40 dB in the literature 30 ) was constant in all fatigue tests under different conditions. Therefore, the cumulative energy could be comparable under such various test conditions.
For investigating failure mechanisms, Figure 10 depicts images by the scanning electron microscopy (SEM). These images were taken near the surface of the hole in composite standard samples. In addition, they were reported for three test conditions. These cases included the first case: the lowest displacement rate (under 7.0 mm of the displacement amplitude and 25 mm/min of the displacement rate), the second case: the common point (under 7.0 mm of the displacement amplitude and 200 mm/min of the displacement rate), and the third case: the lowest displacement amplitude (under 5.5 mm of the displacement amplitude and 200 mm/min of the displacement rate). It should be mentioned that SEM images for all test conditions were almost the same. In other words, the displacement rate and the displacement amplitude had no significant effects on the type of failure mechanisms.

SEM images near the surface of the specimen hole, (a) under 7.0 mm of the displacement amplitude and 25 mm/min of the displacement rate, (b) under 7.0 mm of the displacement amplitude and 200 mm/min of the displacement rate, and (c) under 5.5 mm of the displacement amplitude and 200 mm/min of the displacement rate.
As it could be observed in Figure 10, failure mechanisms contained the fiber breakage, matrix cracking and debonding of fibers from the matrix, in open-hole samples of composites. The debonding defect was reported in the literature,35,50 as the main failure mechanism in composite samples, under tensile loading.
Consequently, SEM images illustrated that the acoustic emission technique could be introduced as a proper technique for identifying failure mechanisms in carbon fibers reinforced composites, as also represented in the literature. 36 Besides, the defect type was similar in this material, under all test conditions of the displacement rate and the displacement amplitude. In addition, by varying displacement rates and amplitudes, the main failure mechanism did not change. Such results had a good agreement with respect to results, presented by Naresh et al. 50 They claimed that the adhesion between fibers and the matrix induced a brittle failure in composites. The loading rate and also the fiber-matrix interfacial bond strength had effects on the matrix damage. By enhancing the loading rate, the tensile modulus of the composite and also the fiber tensile strength increased. This led to an increase in the value of the fiber-matrix interfacial bond strength. In addition, at higher loading rates, the quantity of the matrix damage enhanced. 50 It should be noted that in this study, the displacement rate changed gradually and not sharply on a logarithmic scale. Therefore, the enhancement of the fiber tensile strength and the tensile modulus was not significant. Consequently, types of failure mechanisms did not change effectively, under various test conditions.
The amount of failures could change in the composite, which would be investigated in the future based on signal processing of acoustic emission data to find the amount of each failure. Moreover, a precise investigation is required for the complete confirmation of acoustic emission results, compared to microscopic images. Oz et al. 47 reported that multi-instruments could be used for damage monitoring in carbon fibers reinforced composites, such as the combination of the digital image correlation technique and the acoustic emission approach. Therefore, SEM images could be used for the verification of obtained results and could not be utilized for the exact validation. In this study, SEM images are only reported to demonstrate failure mechanisms under various displacement rates, in order to have an initial confirmation for the results obtained by the acoustic emission method.
Conclusions
In this article, the acoustic emission energy and the cumulative energy were evaluated in carbon fibers reinforced polymer matrix composites through the low-cycle fatigue regime. For such an objective, displacement-controlled fatigue tests were done at various displacement amplitudes and rates. Based on experimental data, following results could be listed, When the displacement rate enhanced, the maximum force increased and consequently, the fatigue lifetime decreased. The displacement amplitude was more effective than that of the displacement rate on the maximum force. During low-cycle fatigue testing, the macroscopic damage was observed at about 65-100% of normalized fatigue lifetime, under all loading conditions. The cumulative energy of acoustic emission signals could predict the macroscopic damage, such as the fiber breakage. At less than 35% of fatigue cycles, one other failure in composites, including matrix cracking, was found as a peak in the cumulative energy history. No significant influence of the displacement rate and the displacement amplitude in low-cycle fatigue testing of carbon fibers reinforced composites was seen in the predicted region of microscopic and macroscopic damage. According to SEM images, the capability of the acoustic emission approach to predict failures in composites was approved. In addition, no changes in failure mechanisms were observed under different displacement amplitudes and rates.
Footnotes
Acknowledgements
Authors tend to thank for the financial support to perform this research, by Irankhodro Powertrain Company (IPCo.), located in Tehran, Iran.
Declaration of conflicting interests
The author(s) declared no potential conflicts of interest with respect to the research, authorship, and/or publication of this article.
Funding
The author(s) disclosed receipt of the following financial support for the research, authorship and/or publication of this article: This study received financial support from Irankhodro Powertrain Company (IPCo.), Tehran, Iran.