
Abstract
The aim of this work is to identify the best strategy for cluster analysis of acoustic emission (AE) events for cross-ply PE/PE graded composites under tensile loading. Six cluster algorithms are made comparison. Peak amplitude and frequency centroid represent adequately AE events clustering to five groups for PE/PE graded composites. A link between five representative damage modes with corresponding five groups of AE event is established. The results can be used to distinguish damage mechanisms and to investigate damage evaluation of PE/PE graded composites, and damage initiation and propagation of a PE/PE graded sample under tensile loading are discussed. This study provides guides for the establishment of AE interpretation and identification of damage modes for ultra-high molecular polyethylene–reinforced composites in future studies.
Introduction
Fiber-reinforced thermoplastic (FRT) composites are potentially and widely used in many demanding applications, including astronautic industries and civil constructions, because of good toughness, corrosion resistance, fatigue resistance, simple molding process, and high material utilization. Ultra-high molecular polyethylene (UHMWPE) fibers possess outstanding mechanical property and low density, promising in above applications. Due to unsatisfactory molecular polarity of the PE family, it is not easy for them to compatible with other matrix, thereby UHMWPE fibers are usually fabricated to self-reinforced (SR) composites, with reinforcement and resin belonging to the same polymer family, to obtain better interfaces. 1,2 During the processes of use, damages and even rupture can occur, such as fiber breakage, matrix cracking, and delamination, and thus it is important and essential to investigate damage mechanisms of FRT composites for their security use in practical processes.
Acoustic emission (AE) has been established as an accurate non-destructive technique for composite materials to monitor incipient failure mechanisms and discriminate different damage modes and the damage sources. 3 –7 AE signals, originating from sudden release of strain energy where damage happens, contain useful information on damages, with each AE event as an acoustic signature of certain damage mechanism. 8 Determining connections between AE signal parameters and corresponding damage mode is an important issue. AE registration has been applied to identify damage mechanisms for FRT composites in several reports (summarized in Table 1). 9 –15 For glass/polypropylene and glass/polyester composites, some researchers gave peak amplitude (PA) 9,10 and peak frequency (PF) ranges 11 for different damage modes. For UHMWPE/HDPE composites, our group concluded corresponding PA range as follows: 30–45 dB relates to interfacial debonding, 30–60 dB is matrix cracking, 60–80 dB corresponds to plastic deformation and matrix cracking, 60–80 dB is fiber pullout, 80–97 dB correlates to fiber breakage, and 60–85 dB is delamination. 12 Wang and coauthors utilized frequency spectrum analysis and assumed that PF of 40 kHz is matrix cracking, 40 kHz and 240 kHz relate to debonding, and 200 kHz is fiber rupture. 13 However, one AE parameter only describe one AE characteristic, while multi-descriptors provide rich information about AE event, which will better represent acoustic signature for each damage mode.
Summary of cluster results in the literature.
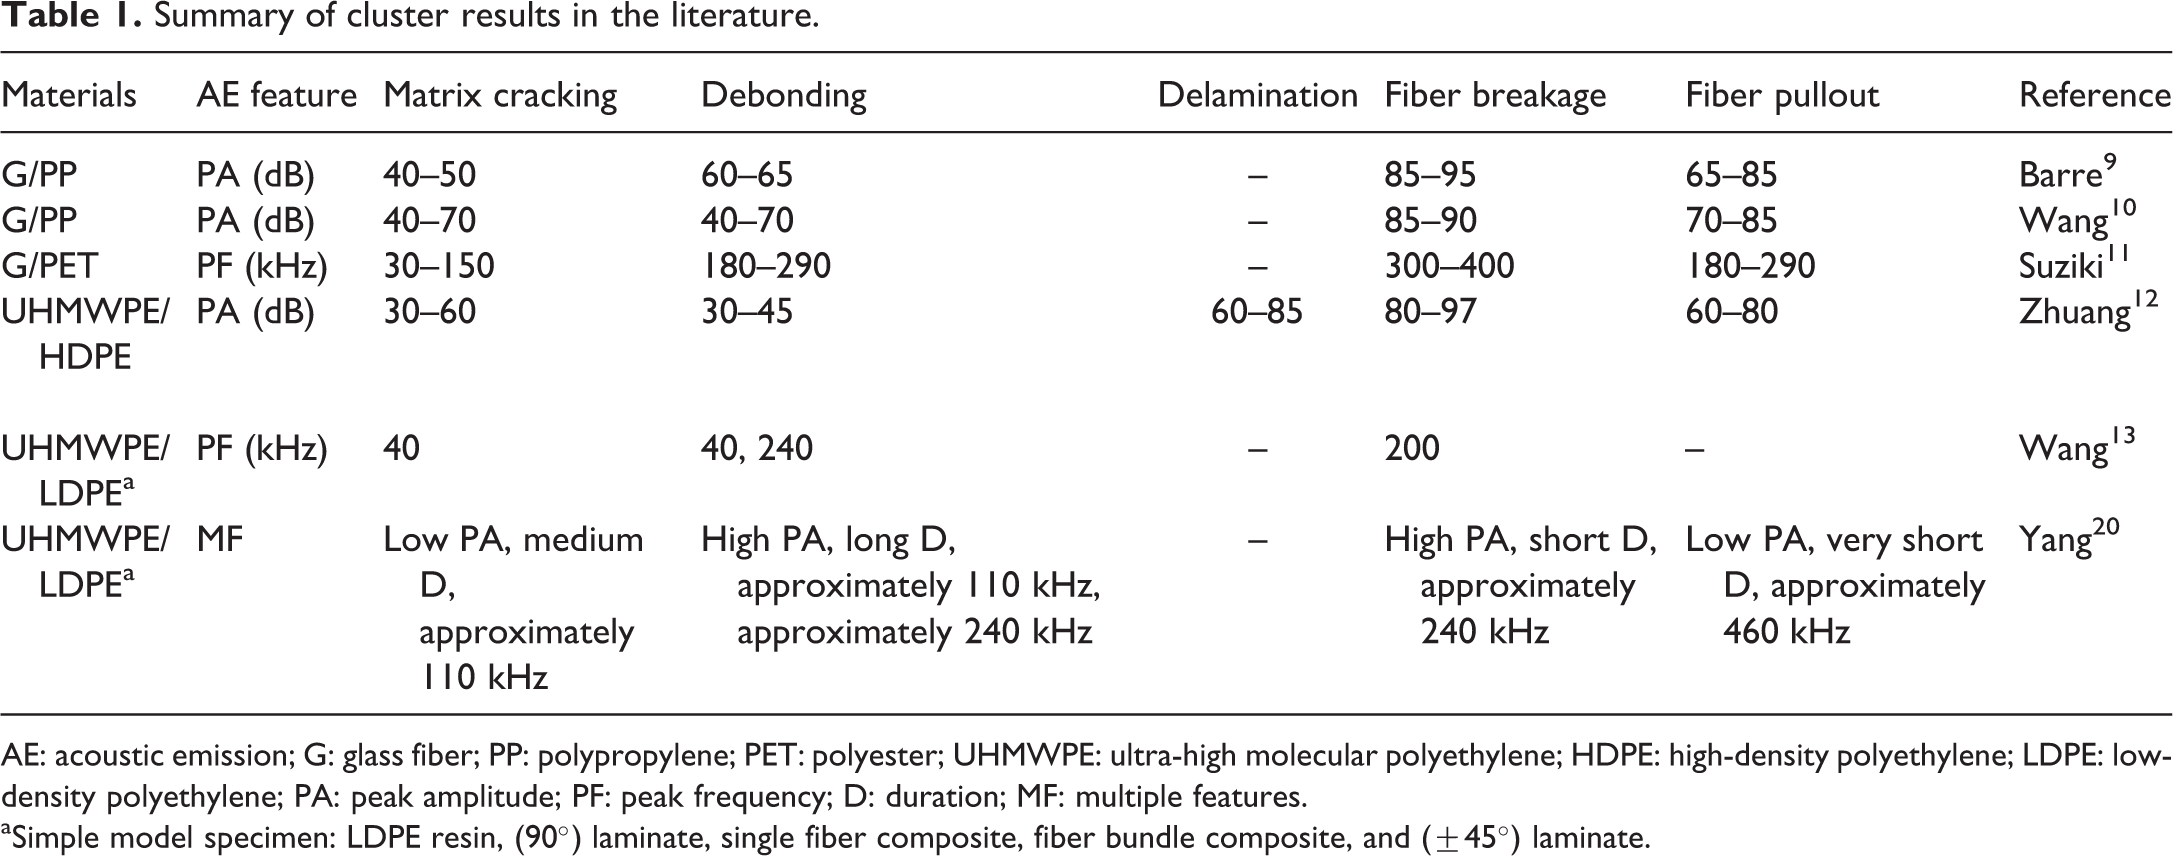
AE: acoustic emission; G: glass fiber; PP: polypropylene; PET: polyester; UHMWPE: ultra-high molecular polyethylene; HDPE: high-density polyethylene; LDPE: low-density polyethylene; PA: peak amplitude; PF: peak frequency; D: duration; MF: multiple features.
aSimple model specimen: LDPE resin, (90°) laminate, single fiber composite, fiber bundle composite, and (±45°) laminate.
Cluster analysis is one of the generally accepted ways to discriminate multi-parametrical AE signals, which is a synonym for unsupervised pattern recognition (UPR) technique. 14 In cluster analysis, selection of cluster algorithm is crucial, besides feature selection and cluster evaluation. 15 Most frequently used cluster algorithms in literatures are k-means, 16 self-organized map (SOM) combined with k-means. For glass fiber–reinforced composites, some researches employed and compared these algorithms to cluster AE signals. 4,8,16 –19 For example, Gutkin and coworkers compared three algorithms: k-means, SOM combined with k-means, and competitive neural network, finding that SOM combined with k-means was the most effective one. 15 For UHMWPE fiber-reinforced composites, Yang and coworkers remarked that UPR approach was reliable for quasi-isotropic UHMWPE/ low-density polyethylene (LDPE) laminates and showed that weak events (low amplitude, medium duration, low frequency) result from matrix cracks, strong ones (high amplitude, long duration, low and medium frequency) relate to interface debonding, stronger ones (high amplitude, short duration, medium frequency) stem from fiber breakage, and weaker ones (low amplitude, vary short duration, high frequency) originate from fiber pullout. 20 Wang and coworkers further employed supervised pattern recognition (SPR)—artificial neural network to identify AE signals by investigating different damage mechanisms in model specimens. 21 However, these reports focus on simple model specimens for UHMWPE-reinforced composites, and the employed SPR and UPR algorithms are cumbersome. Therefore, selection of effective cluster algorithm is crucial to identify damage mechanisms of self-reinforced polyethylene; laminates.
Herein, we investigated damage mechanisms of cross-ply PE/PE graded thermoplastic composites by cluster analysis of AE data under tensile loading. Six cluster algorithms were made comparison, including k-means, k-means++, fuzzy c-means (FCM), SOM + k-means, SOM + FCM, and adaptive affinity propagation (AAP) algorithm. Five generalized AE cluster bounds were given and correlated with five damage types. Moreover, we further discussed damage initiation and propagation according to cluster results and damage thresholds from cumulative energy curve.
Materials and methods
Materials and sample preparation
The materials used in this study are UHMWPE fibers and LDPE films, which served as reinforcements and matrix, respectively. The mechanical properties of UHMWPE yarn and LDPE resin are the same materials as used in literature. 22 Cross-ply SR graded composites were prepared by the method of film stacking and hot compaction method. Three lamina types with different fiber volume fractions 19%, 25%, and 31% were labeled as lamina “1#,” “2#,” and “3#,” respectively. The preparation parameters are pressure of 1.0 MPa, temperature of 120°C, and 5 min. The prepared specimens are cross-ply graded composite specimen “FC” with stacking sequence [03#/903#/02#/902#/01#/901#]2 s.
Tensile tests
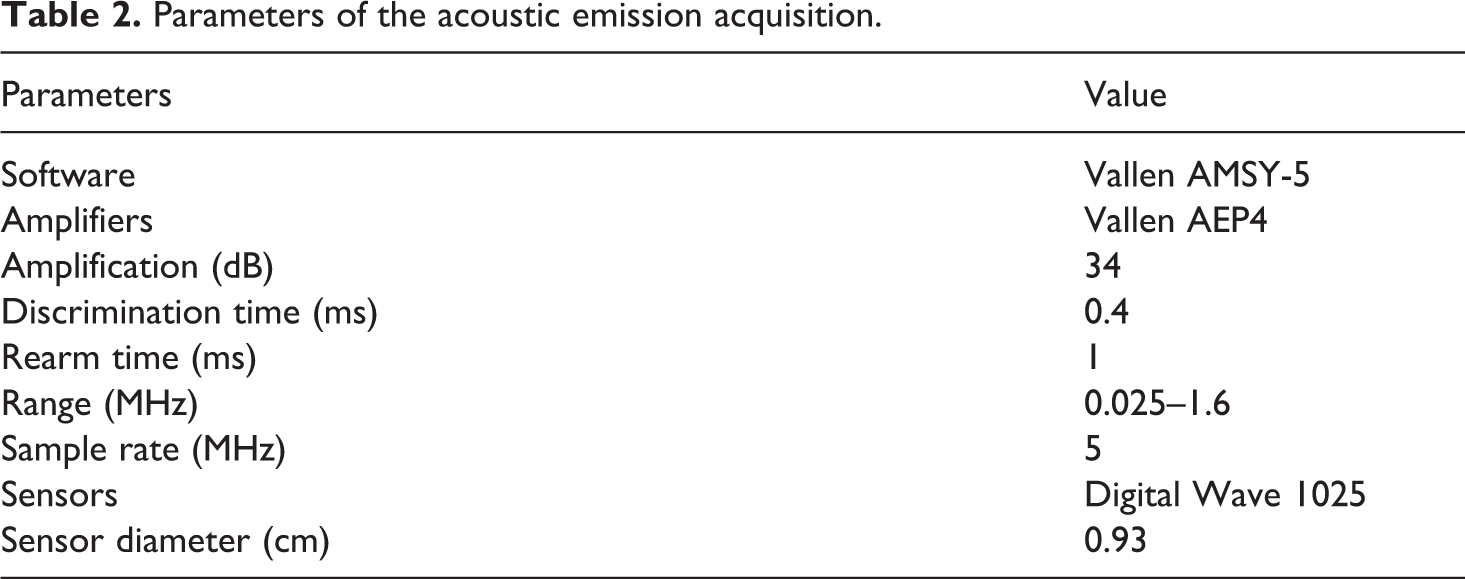
Tensile tests were performed on the cross-ply graded PE/PE samples according to ASTM D3039 standard. The length of tensile samples was 180 mm with gage length (l) of 100 mm, and the width (w) and thickness (t) are 10 mm and 2.35 mm, respectively (Figure 1). Surface strain was measured using a digital image correlation system. Cross-ply PE/PE tensile specimens were tensiled along fiber direction of 0-ply. The tensile process was monitored by Vallen AMSY-5 AE system. The acquisition parameters are summarized in Table 2. The distance between two sensors is about 8 cm.
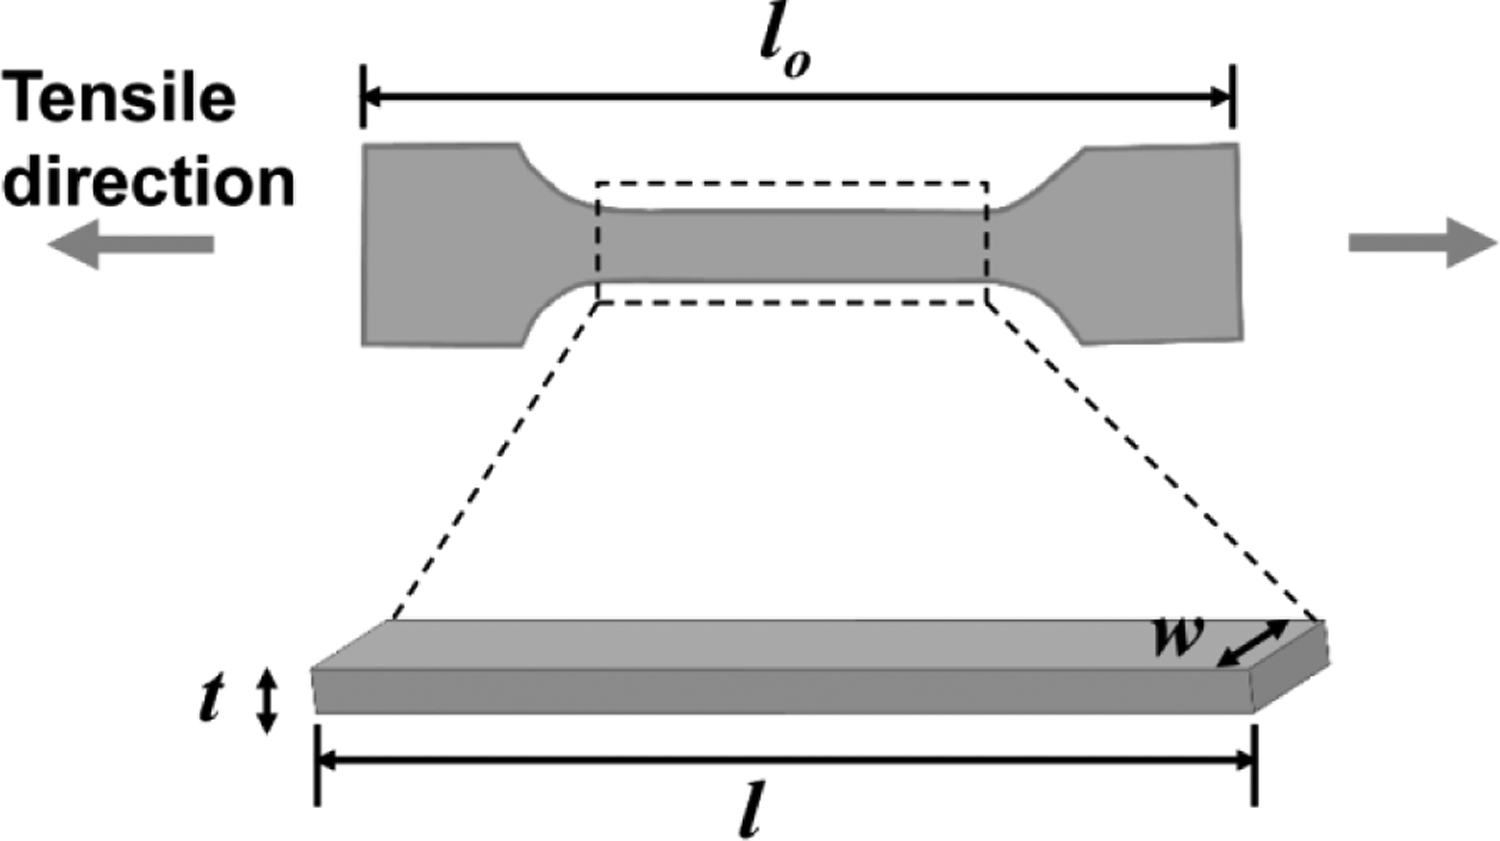
Schematic diagram of cross-ply graded PE/PE tensile test specimen.
Parameters of the acoustic emission acquisition.
Three tests for the studied specimen were chosen for cluster analysis of AE events in this study, which referred to as “FC0-n,” where “FC0” indicates the type of preform, and n = 1,2,3 is specimen number.
Cluster analysis methods
In this study, nine originally recorded AE signal features were used for cluster analysis: (1) PA, (2) duration (D), (3) rise time, (4) PF, (5) counts, (6) energy (E), (7) frequency centroid (FCoG, frequency where the areas of the frequency spectrum below and above FCoG are the same), (8) RA (rise time divided by peak amplitude value); value (rise time divided by PA), and (9) weighted frequency. 4 Cluster analysis procedure consists of feature selection, cluster algorithm, and cluster evaluation as illustrated in Figure 2, which is performed on Matlab platform. Four-ordered Butterworth high-pass filter was used to eliminate noises from AE signals, and all AE features were normalized ranging from 0 to 1 before data analysis. Through feature selection by Laplacian score 23,24 and correlation coefficient analysis, four AE features which have most cluster ability could be selected, and this procedure can eliminate irrelevant and redundant features so as to improve cluster efficiency and quality. 25 Then, the selected AE features were employed as feature set for principal component analysis and cluster algorithm for cluster analysis. Silhouette coefficient (SC) and Davies–Bouldin (DB) index were employed to evaluate cluster validity. SC combines both cohesion and separation between clusters and measures how distinct or well separated for a cluster apart from other clusters. DB is a ratio of within-cluster distance and between-cluster distance. A higher SC and lower DB indicate better cluster quality. Six algorithms were investigated and compared for cluster analysis of AE signals of composites and were introduced in the following.
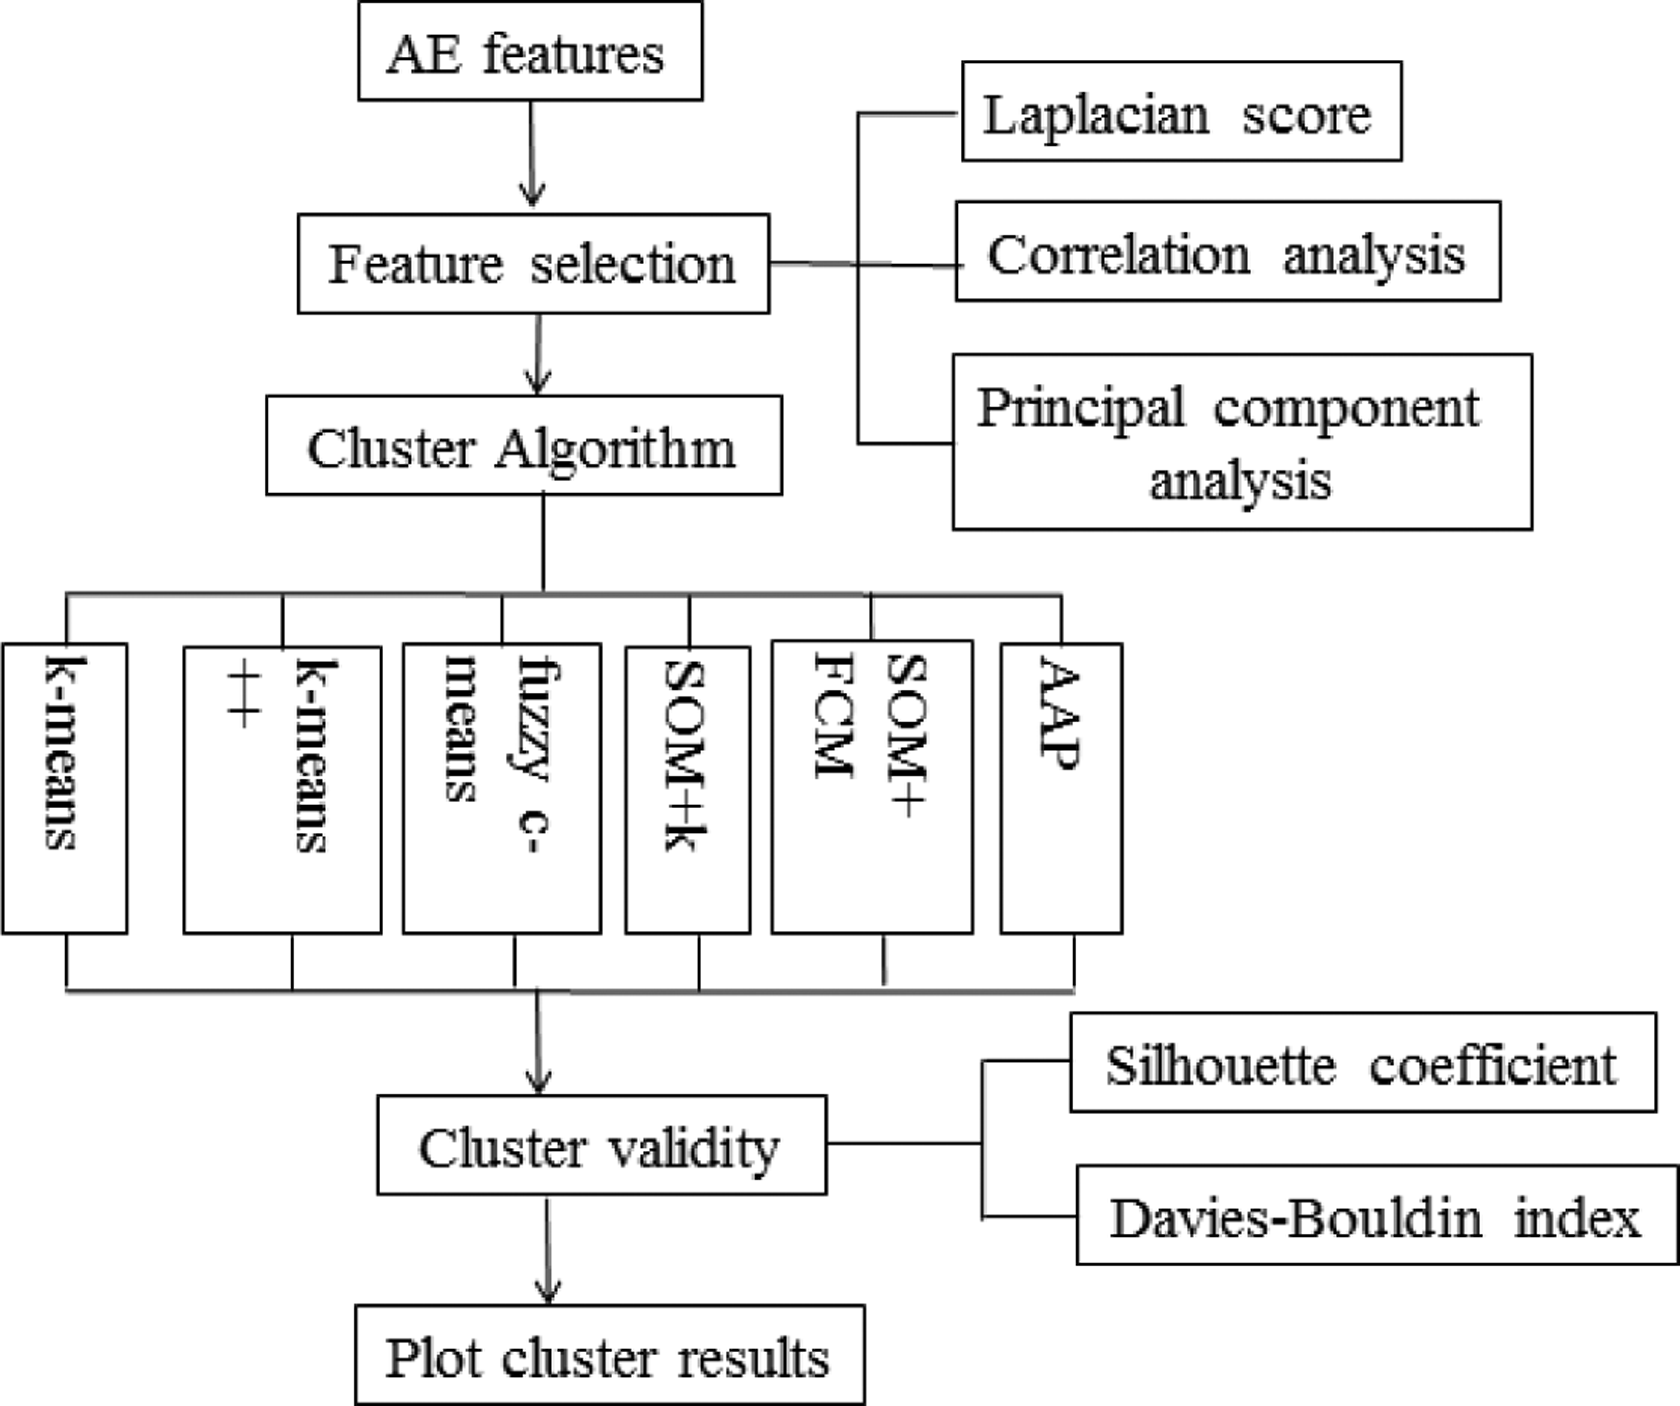
Flow chart of the cluster analysis procedure in this study.
k-means
k-means algorithm is the simplest and most widely used cluster algorithm, and its purpose is to classify n input vectors to k clusters according to the rules that patterns in the same cluster has higher similarity and patterns in different cluster has lower similarity. In order to classify n input vectors to k clusters, the procedures are as follows:
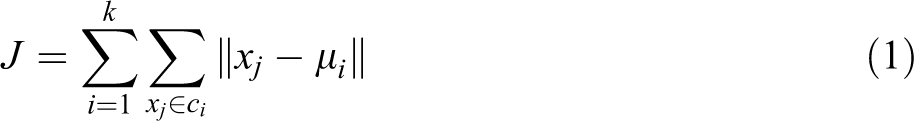
Firstly, choose k initial cluster centers μi randomly. Secondly, compute the Euclidean distance between each vector to the cluster center and assign each vector to the nearest cluster center, and then recompute the position of cluster center to assure the objective function (equation (1)) is minimized, and repeat the above two steps until the position of cluster centers does not change.
k-means algorithm is an effective algorithm in data cluster analysis, but its veracity and stabilization depends on the initial cluster centers, and it easily falls into local minimum, thus global k-means algorithm built in Matlab will be performed to assure its stabilization.
k-means++
k-means++ is a modified centroid-based iterative algorithm of k-means algorithm.
26
It follows a simple and easy way to classify a given data vector set through a certain k number of clusters, in which k centroids spread throughout the data space and the data vectors are allocated to the closest centroid. Let I represent input data vector set, i is one data vector, and D(i) denotes the shortest distance from a data point to the closest center which has been already chosen. Then, k-means++ algorithm is defined as follows. Firstly, choose k centers randomly by uniform distribution among the data vectors. Then, compute D(i) for each data point i. Choose one new data point at random as a new center by weighted probability distribution
Fuzzy c-means
The objective function of FCM algorithm is defined in equation (2):
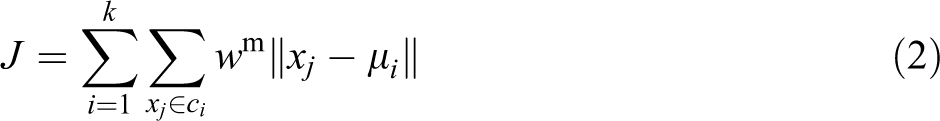
The key difference of FCM and k-means is the introduction of fuzzy concept into FCM, which makes each input vector no longer assign to one certain cluster, but represent the similarity one vector shares with each cluster with a function (termed membership function), whose values (called membership parameter m) are between 0 and 1. 27 FCM is a soft cluster algorithm, whereas k-means and k-means++ algorithms are hard cluster method, which strictly assigns each data vector to certain cluster. The shortcomings of FCM are its high computational cost, and it is sensitive to the initial cluster centers and easily falls into local minimum as well.
Self-organized map
SOM is one of the most frequently used artificial neural network in unsupervised learning.
28,29
SOM can be regarded as a competitive neural network and it presents the characteristics of cooperative learning.
15
It can be used to process the multidimensional and nonlinear data, and it is one of the most realistic models of cerebral neurons. In SOM, through the competition among the neighboring neurons, the data distribution pattern can be analyzed. The neurons form into a map in the low dimensional grids, as shown in Figure 3. The procedure of training m-dimensional map for n input vectors
determine the number of neurons according to input vectors, and the size of map l × p;
assign m-dimensional weighted vectors wj for each neuron j, and the definition and initiation of weighted vectors please refer to the literature by Godin et al. 17 in detail;
choose one input vector x, and compute the Euclidean distance from it to each neuron, and the neuron which is nearest to the input vector is considered as winning neuron c;
update the weighted vectors of the winning neuron and its neighbor neurons according to Kohonen learning rule, as in equation (3):

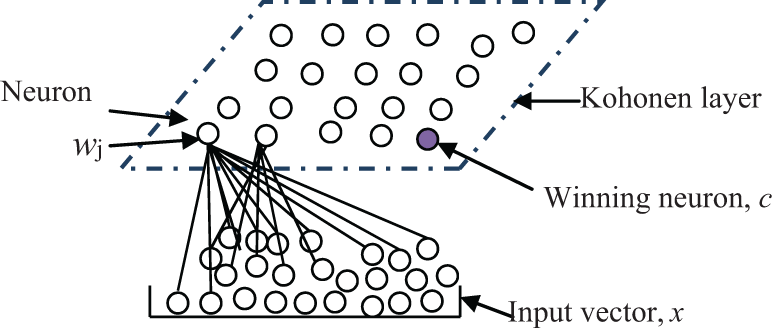
Self-organizing map architecture.
where k is the iteration times; α(k) is learning efficiency, whose initial value is 0.5 and decreasing at a rate of factor 0.01; hcj(k) is neighborhood function, which is a Gaussian distribution function by winning neuron c as center in this study.
repeat steps c and d for all input vectors.
In this study, SOM combined with k-means and FCM is considered as cluster algorithm, respectively, that is the input data vectors are trained by SOM at first, and then the winning neurons are clustered by k-means and FCM algorithm, respectively.
Adaptive affinity propagation
AAP algorithm 30,31 is an improved affinity propagation (AP) algorithm reported in Science. 31 AP algorithm considers all data vectors as potential cluster centroids, and by the rule of incredible similarity and appealing law, similarities between pairs of data points are computed. AP algorithm is based on evidence accumulation and searches for data groups through an iterative process until a high-quality set of exemplars and corresponding clusters emerges. 30 AAP algorithm is the improvement of AP algorithm, by introducing adaptive damping and escape methods to eliminate oscillations. It employs adaptive scanning of preferences to search space of the cluster numbers to find optimal cluster solution, adaptive adjustment of damping factors to eliminate oscillations, and adaptive escaping from oscillations when damping adjustment technique fails. 30
Results
AE registration
Figure 4 illustrates the relationship between nine AE features and applied strain of a cross-ply PE/PE specimen. It can be seen that PA and energy have similar distribution. For time-domain AE features, AE events distributed evenly in the amplitude range of 30–100 dB. At low strain, there are mostly AE events with low-medium, short duration and short rise time, fewer counts, and low RA value. When the strain is up to failure strain, a small number of AE events with high PA, long duration and long rise time, few counts, and low RA value generate. For frequency-domain features, low frequency AE events generated at low strain 1–2%, higher frequency AE events come into being at medium strain from 2% to 3.5%, and AE events with highest frequency mainly start to happen at high strain more than 3.5%.
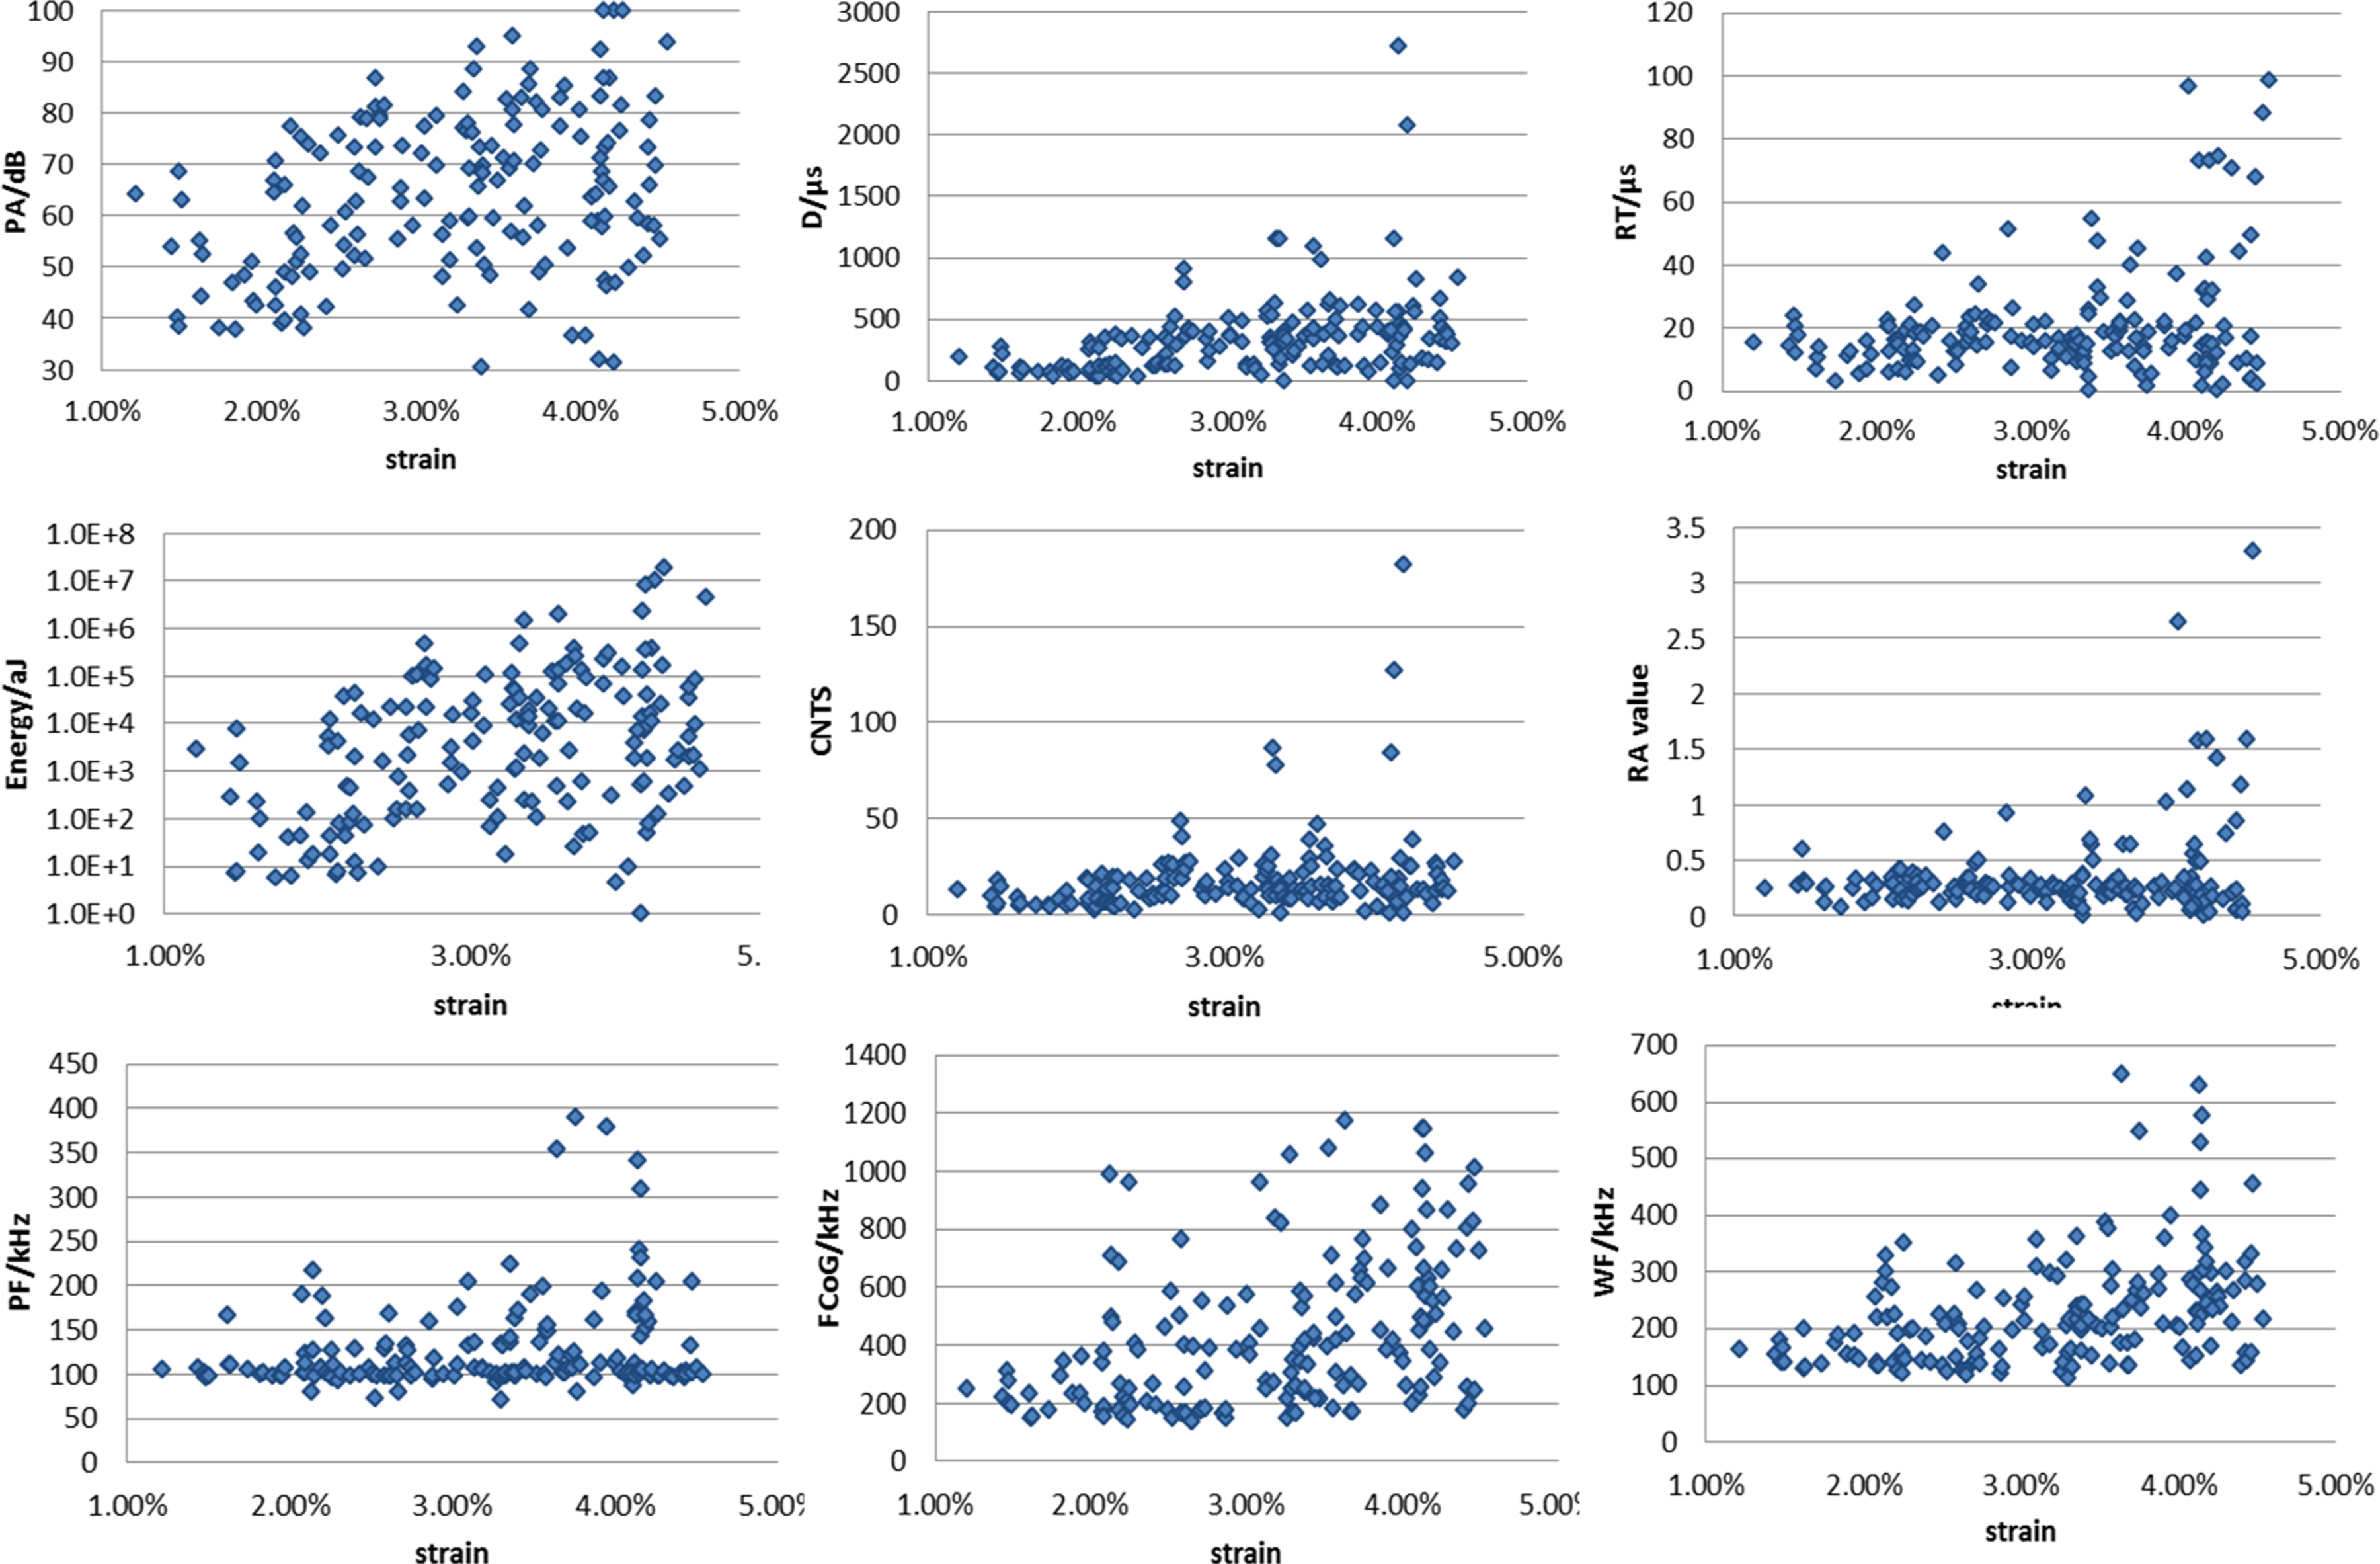
Nine AE features: PA, duration, rise time, energy, counts, RA value, PF, FCoG of gravity, and WF versus strain for a cross-ply graded PE/PE specimen. AE: acoustic emission; PA: peak amplitude; PF: peak frequency; FCoG: frequency centroid; WF: weighted frequency.
Repeatability of AE parameters
Figure 5 shows AE energy as a function of applied strain for three individual tests of cross-ply graded specimens: FC-01, FC-02, and FC-03. For all three cross-ply graded specimens, the energy of most AE events is less than 106 aJ, when strain increases to 4%, AE events with higher energy (>106 aJ) appear, and AE events with moderate energy (103–105 aJ) more likely happen at low and high strain. Figure 6 represents PA and PF histogram for all three specimens. It can be seen that PA and PF distributions follow similar pattern. There are more AE events in the amplitude range between 40 dB and 70 dB, fewer AE events in amplitude range less than 40 dB and over 80 dB, and it is obvious that there are fewest AE events with PA in the range of 70–80 dB, with the number of AE events less than 10. For frequency histogram, it is clear that most AE events concentrate in frequency band of 100–150 kHz, about 41.7–65.1% of all events. In frequency band of 50–100 kHz, the number of AE events is >30 (approximately 16.8–38.4%), whereas for frequency over 150 kHz, there are fewest AE events, less than 20 (approximately 17.7–27.4%). The repeatability of AE events for three specimens can also be obtained from Figures 5 and 6. Given the statistical scatter, AE energy, amplitude and frequency pattern are qualitatively stable for cross-ply graded PE/PE specimens in fiber direction of 0-ply.
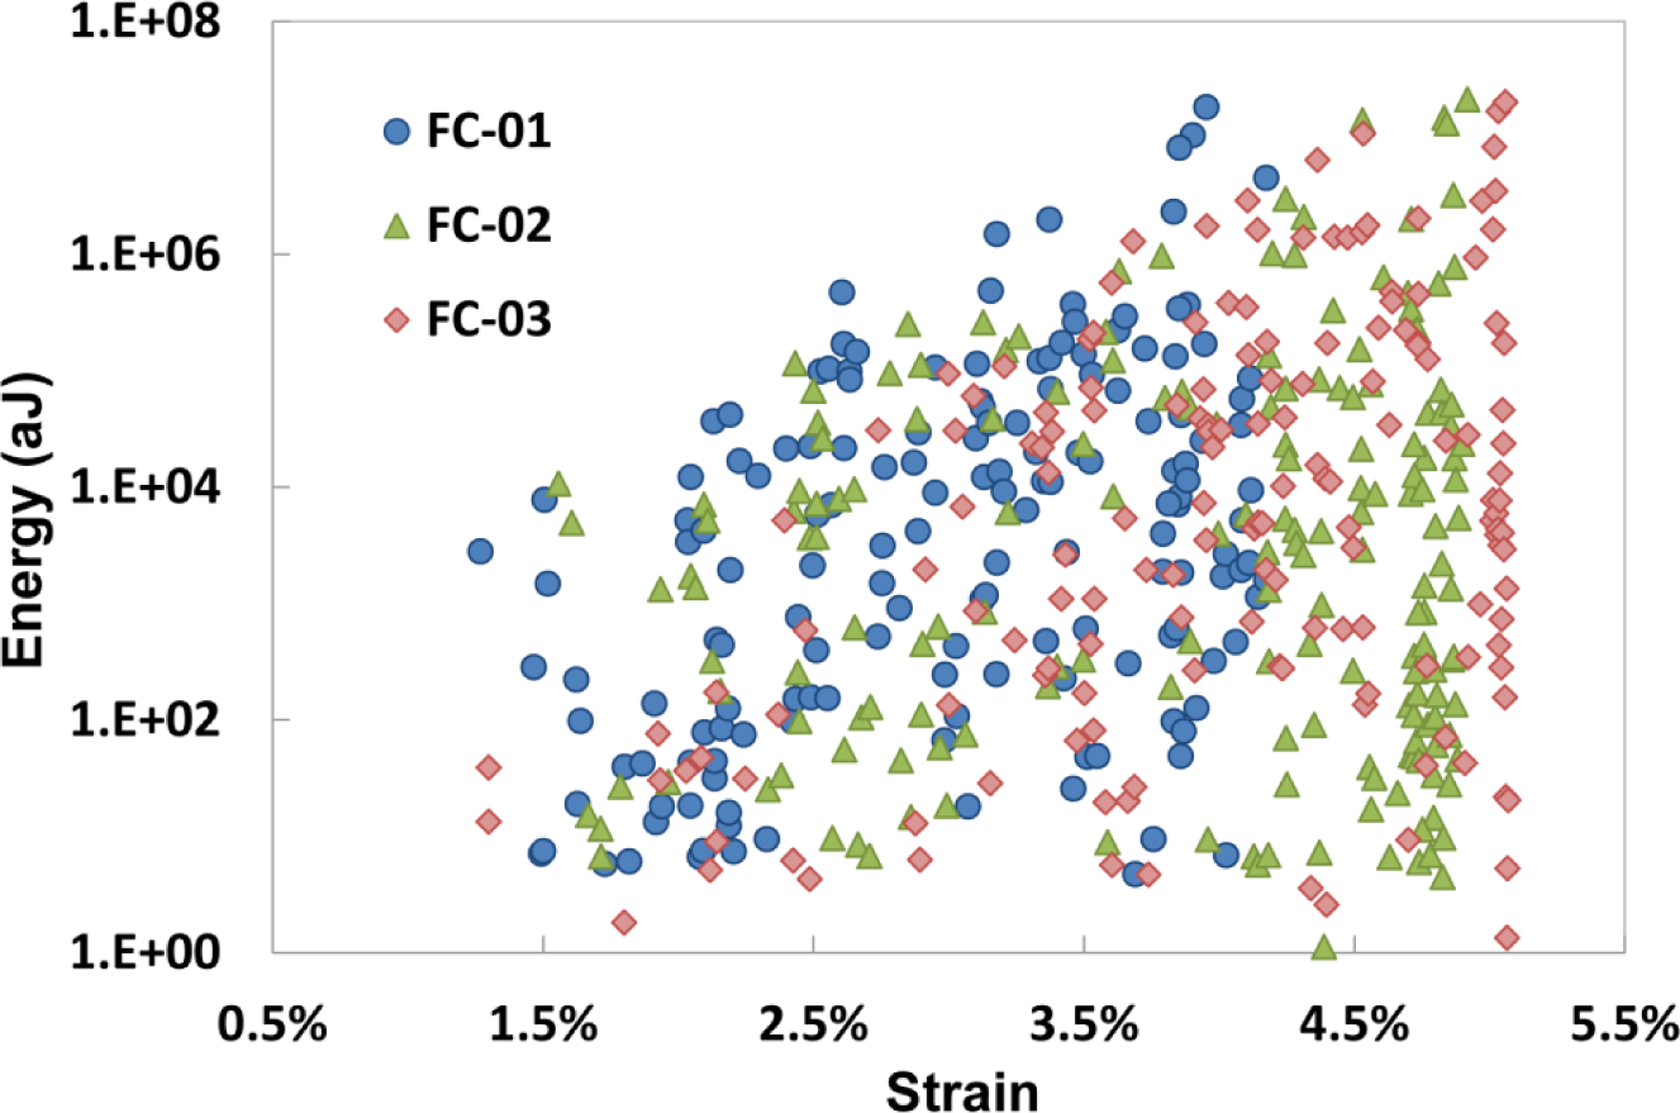
AE registration data of energy versus strain for three cross-ply graded PE/PE specimens: FC-01, FC-02, and FC-03. AE: acoustic emission.
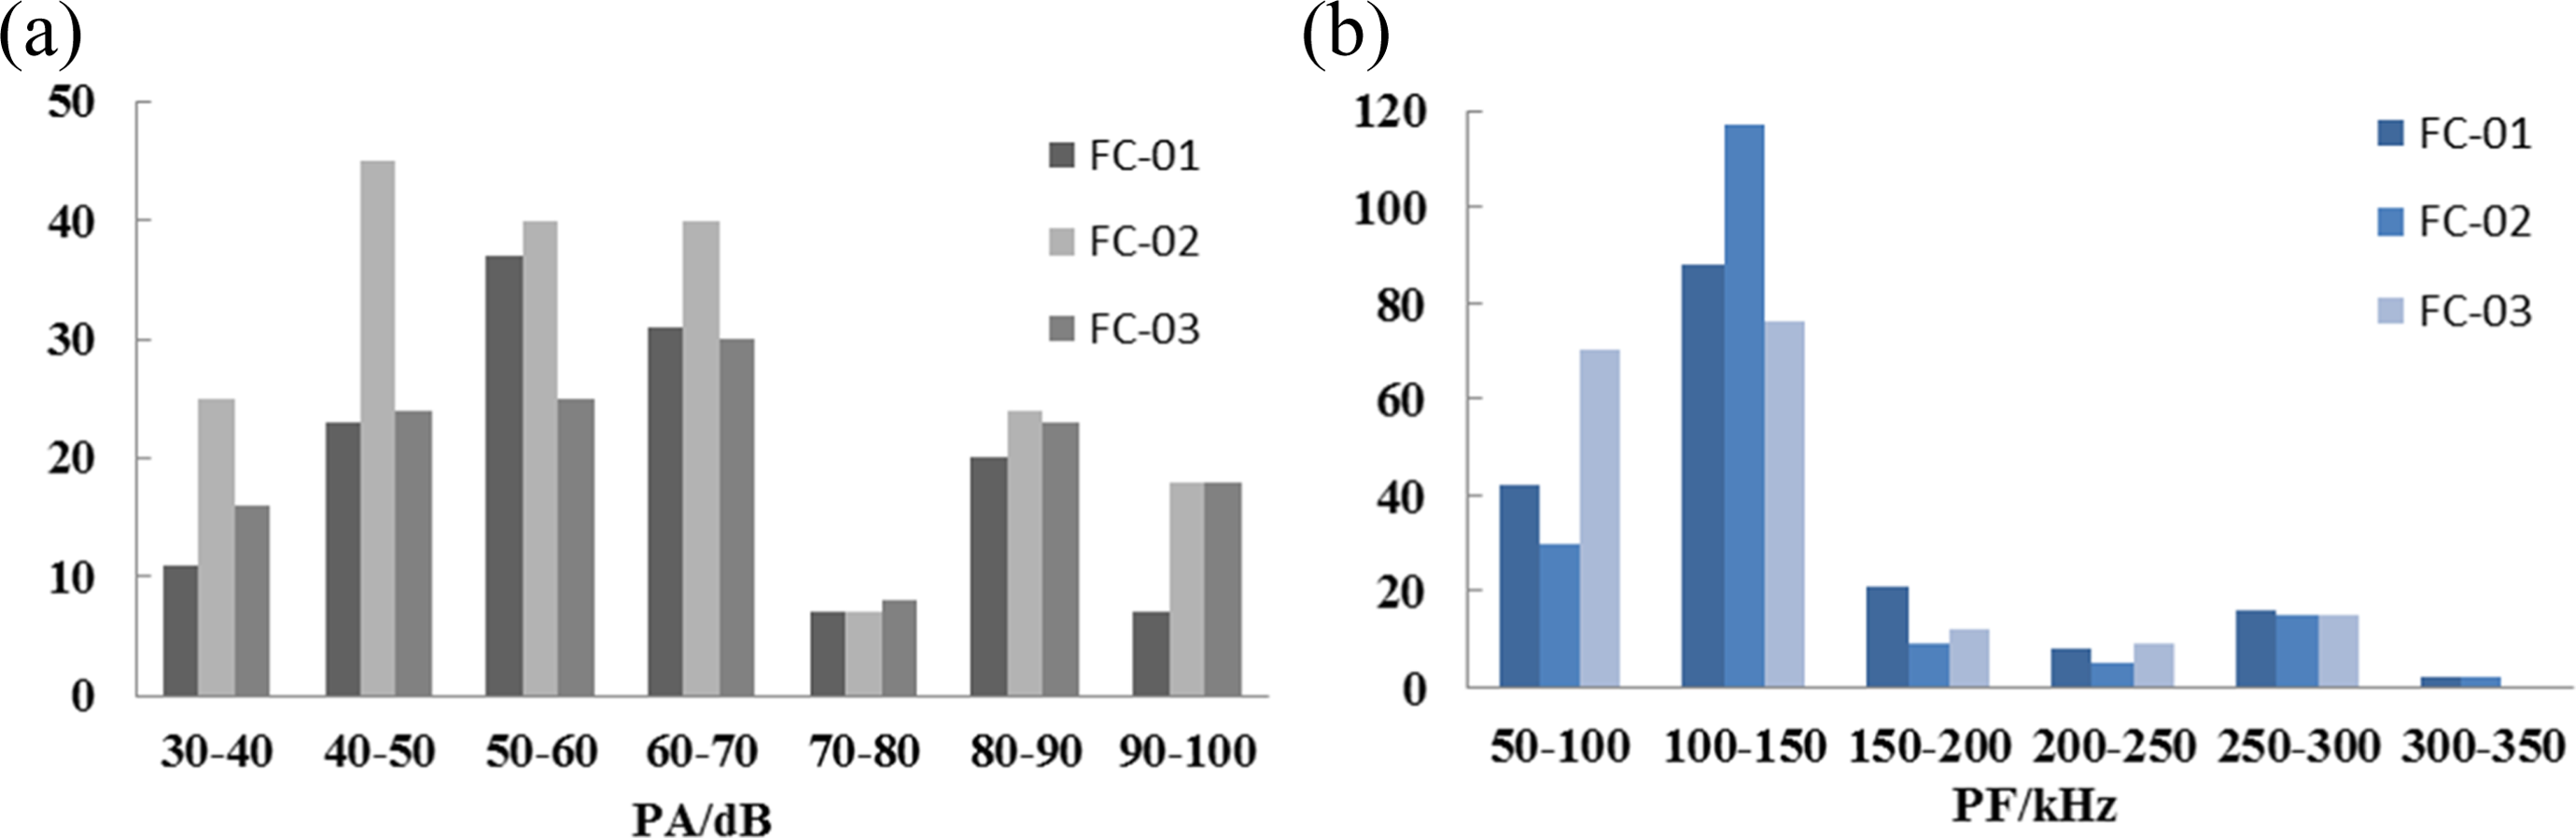
(a) PA distribution and (b) PF distribution of three cross-ply graded PE/PE specimens. PA: peak amplitude; PF: peak frequency.
Cluster results
Optimal cluster number
Figure 7 presents cluster validity indexes of different cluster number for all three cross-ply graded composite (FC); specimens. Optimal cluster number is chosen between 2 and 11 when SC is maximized and DB is minimized. It can be seen that for FC-02 and FC-03 specimens, when cluster number is 5, SC is maximum and DB is minimum, which ensures the best cluster quality; for FC-01, the optimum is weak; however, choosing 5 as cluster number for this case also brings low DB value and high SC value. Table 3 summarizes the cluster validity estimations of AE events grouped to 5 clusters for all three FC samples, which reveals that SC is good and acceptable, 0.6 < SC < 0.7 for FC-02 and FC-03, and low SC < 0.6 for FC-01. For all tests, DB index is less than 1, indicating intra-cluster distance is less than inter-cluster distance for clusters, and proves good cluster quality for all tests.
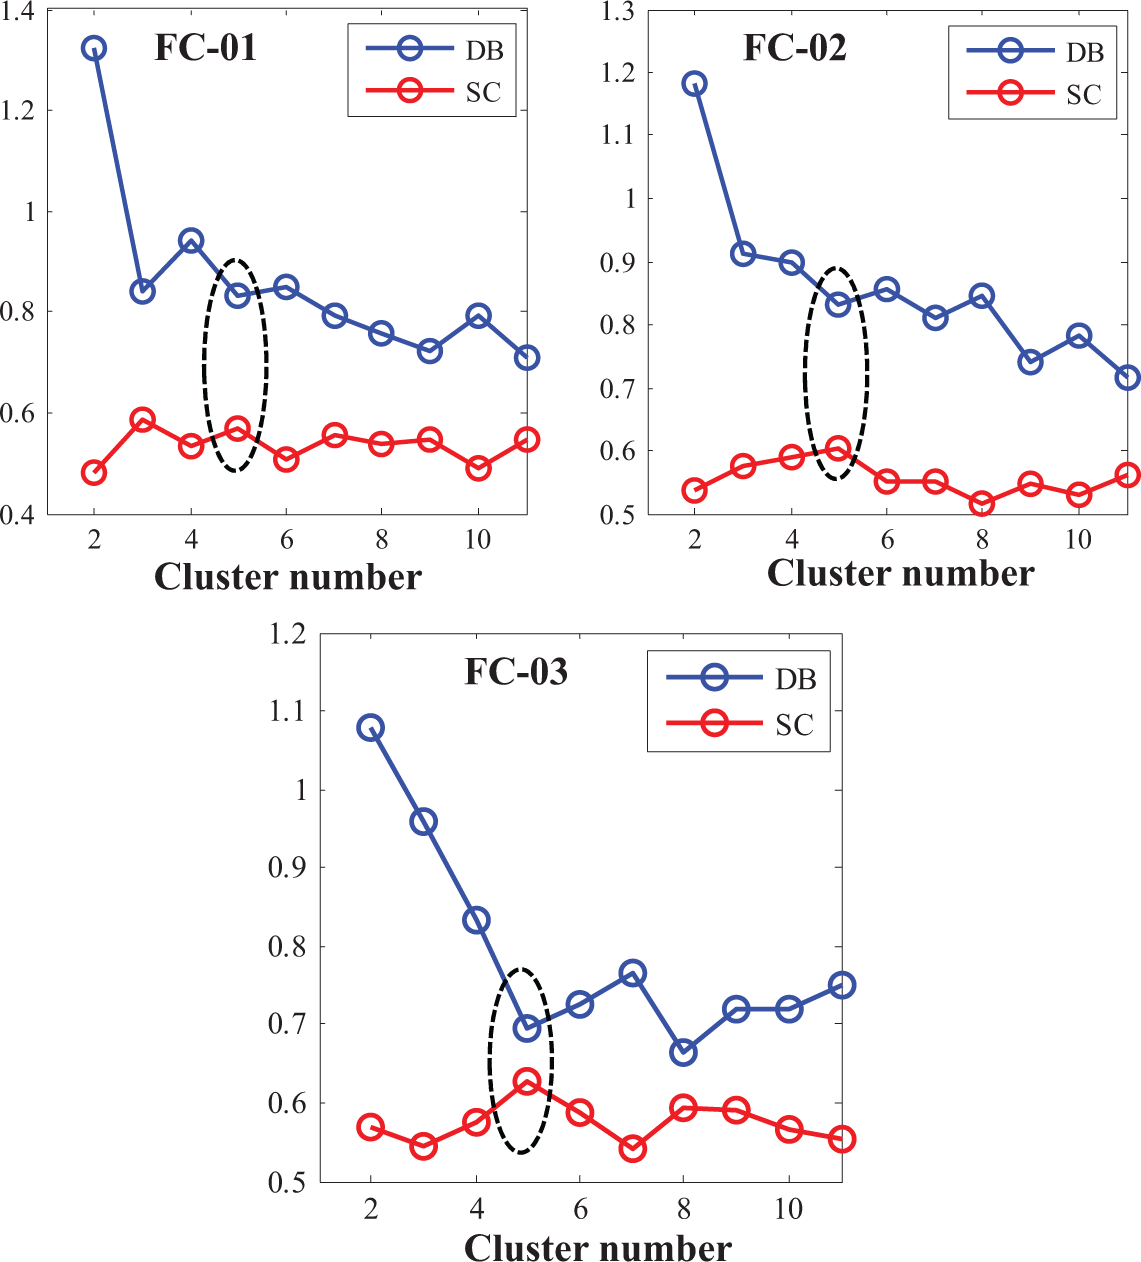
Select optimal cluster numbers by SC and DB index for FC specimens. When cluster number is 5, SC is maximum, and DB index is minimum. SC: Silhouette coefficient; DB: Davies-Bouldin.
Cluster validity index and percentage of AE events for all three cross-ply graded PE/PE specimens.
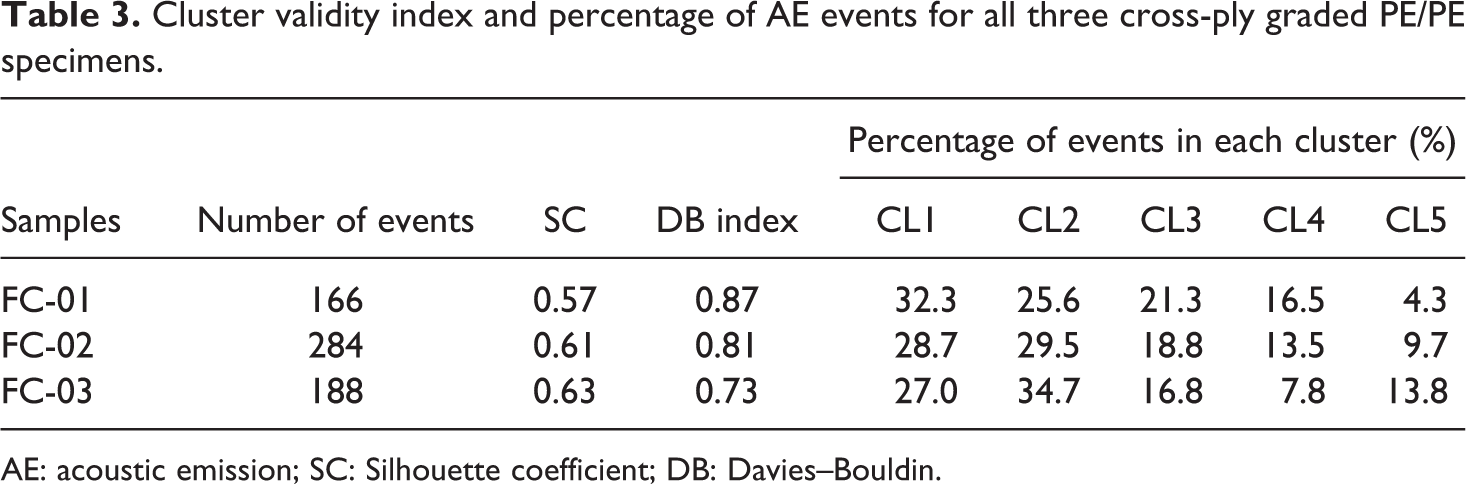
AE: acoustic emission; SC: Silhouette coefficient; DB: Davies–Bouldin.
Choice of cluster algorithm
The compared six cluster algorithms are all unsupervised, and the aim is to estimate cluster quality of each cluster algorithm for AE data of cross-ply graded PE/PE specimens. Figure 8 shows SC and DB index for a cross-ply PE/PE graded specimen by six cluster algorithms when cluster number is 5. In Figure 9, the cluster validity of AE events in each cluster by SC was investigated for six algorithms, respectively, for DB is relevant to the center of cluster. Larger SC means that the intra-cluster distance is larger than the inter-cluster distance for one AE point attributing to corresponding cluster, and this means this data point is allocated to a correct group. It is obvious that for SOM + k-means and SOM + FCM algorithm, SC value for each data is less than 0, which indicates that cluster quality of most AE data points in the present cluster is not satisfied. So the cluster quality of k-means, k-means++, and FCM is better than SOM + k-means and SOM + FCM. k-means++ and AAP are relatively better among the six cluster algorithms, k-means and FCM can also obtain good cluster quality sometimes, the cluster stability of SOM + k-means and SOM + FCM is good, but the cluster quality for all AE data points is not satisfied; choosing initial cluster center of k-means++ is simple, sometimes can be in local minimum; AAP is more stable and repeatable, but the computation time and computation cost will increase when the data set does not have clear separation.
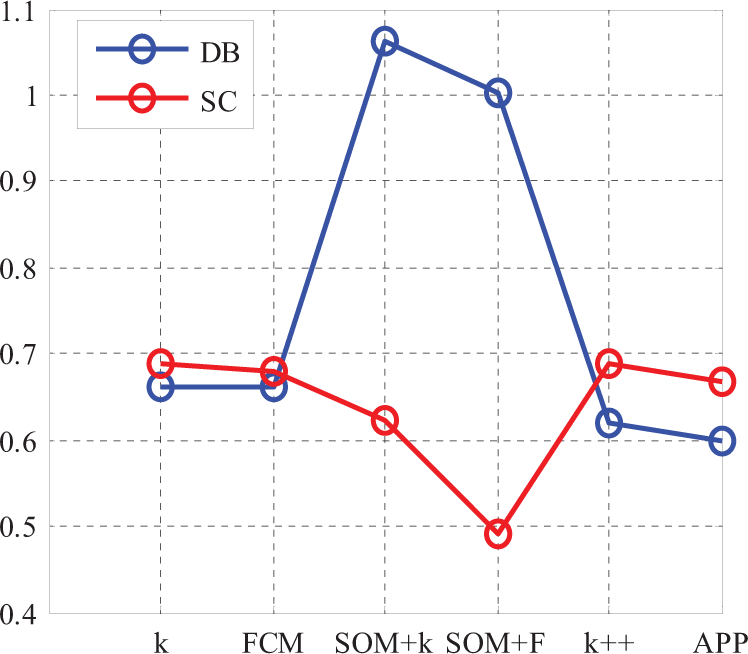
Comparison of six cluster algorithms by SC and DB index. SC: Silhouette coefficient; DB: Davies–Bouldin.
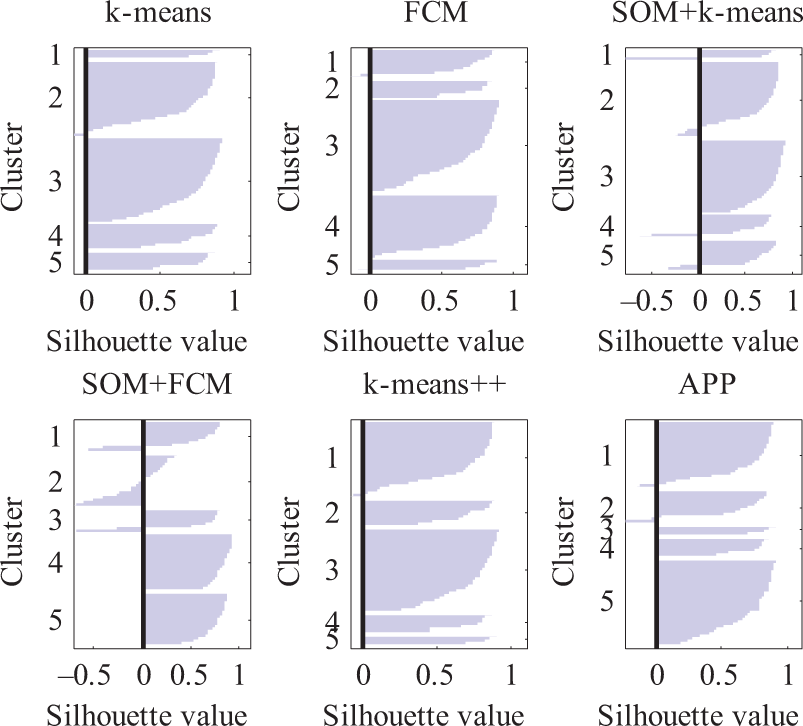
Cluster quality of SC of each cluster to compare six cluster algorithms. SC: Silhouette coefficient.
In the literature by Gutkin, 15 cluster quality of SOM + k-means shows better performance than k-means, because for SOM + k-means, k-means is clustered on the neurons of SOM rather than on each AE point, and the coordinates of these neurons are irrelevant, which assures cluster results not influenced by cluster centroids. However, in this study, the results show that cluster validity indexes of SOM + k-means and SOM + FCM are not so good as k-means and FCM, because the main reason is that SC computed in literature 15 was based on each neuron in SOM, whereas here cluster quality is evaluated by each AE data point in clusters to make comparison of different cluster algorithms. Therefore, the cluster stability of SOM + k-means and SOM + FCM is better, but the cluster quality is not satisfied for all data points. For FCM algorithm, the result is similar to k-means. Because the initial cluster center of k-means++ is not random, it is easier to find the optimal cluster center and obtain good clusters than k-means and FCM. For AAP algorithm, because it gives the comparison results for 2 to 10 cluster numbers automatically and does not need to assign the cluster number, it is more stable and repeatable. Although FCM is based on the fuzzy theory, it is mainly dependent on the membership function. 28 In this study, a simple similarity principal was used and thus further improving cluster quality of FCM needs more effective membership function. k-means++ and AAP are better cluster algorithms among the six cluster algorithms, but the shortcomings of them as follows: choosing initial cluster center of k-means++ is simple and it will be into local minimum sometimes; AAP needs more computation time and cost, especially when the data pattern has no obvious separation, it will get into infinite iterative process, so the selection of features with good cluster ability is crucial, so as to obtain better separation of data pattern.
Cluster results
Figure 10 presents the percent variance and cumulative variance of each principal component by principal component analysis. It is obvious that the cumulative variances of the first two principal components (Pd1 and Pd2) explain roughly two-thirds of the total variability for all data information, so it is reasonable to limit the presentation of AE data to these two components to better visualize the AE data.

Variance and cumulative variance of the important principal components.
Figure 11 shows the projection of five clusters to 2-D plot by the first two principal components for cross-ply graded specimens FC-01, FC-02, and FC-03, respectively. And the five clusters were designated as CL1, CL2, CL3, CL4, and CL5 for brevity. It can be seen that AE signals are well separated by two components Pd1 and Pd2, which indicate that the inner cluster compactness and intra-cluster separation is satisfied. Moreover, it is necessary to further narrow the representative set of AE parameters for better study. Table 4 lists the eigenvalues of each AE feature for principal components Pd1 and Pd2, and it can be seen that the eigenvalue of PA and FCoG is higher, which demonstrate that PA and frequency contribute most for Pd1 and Pd2, respectively, according to the definition of principal component. And thus it can be concluded that PA and PF are the most important AE parameters in the chosen cluster number of 5, and this can be evidenced by good separation of five clusters in the space of these two parameters in Figure 12.
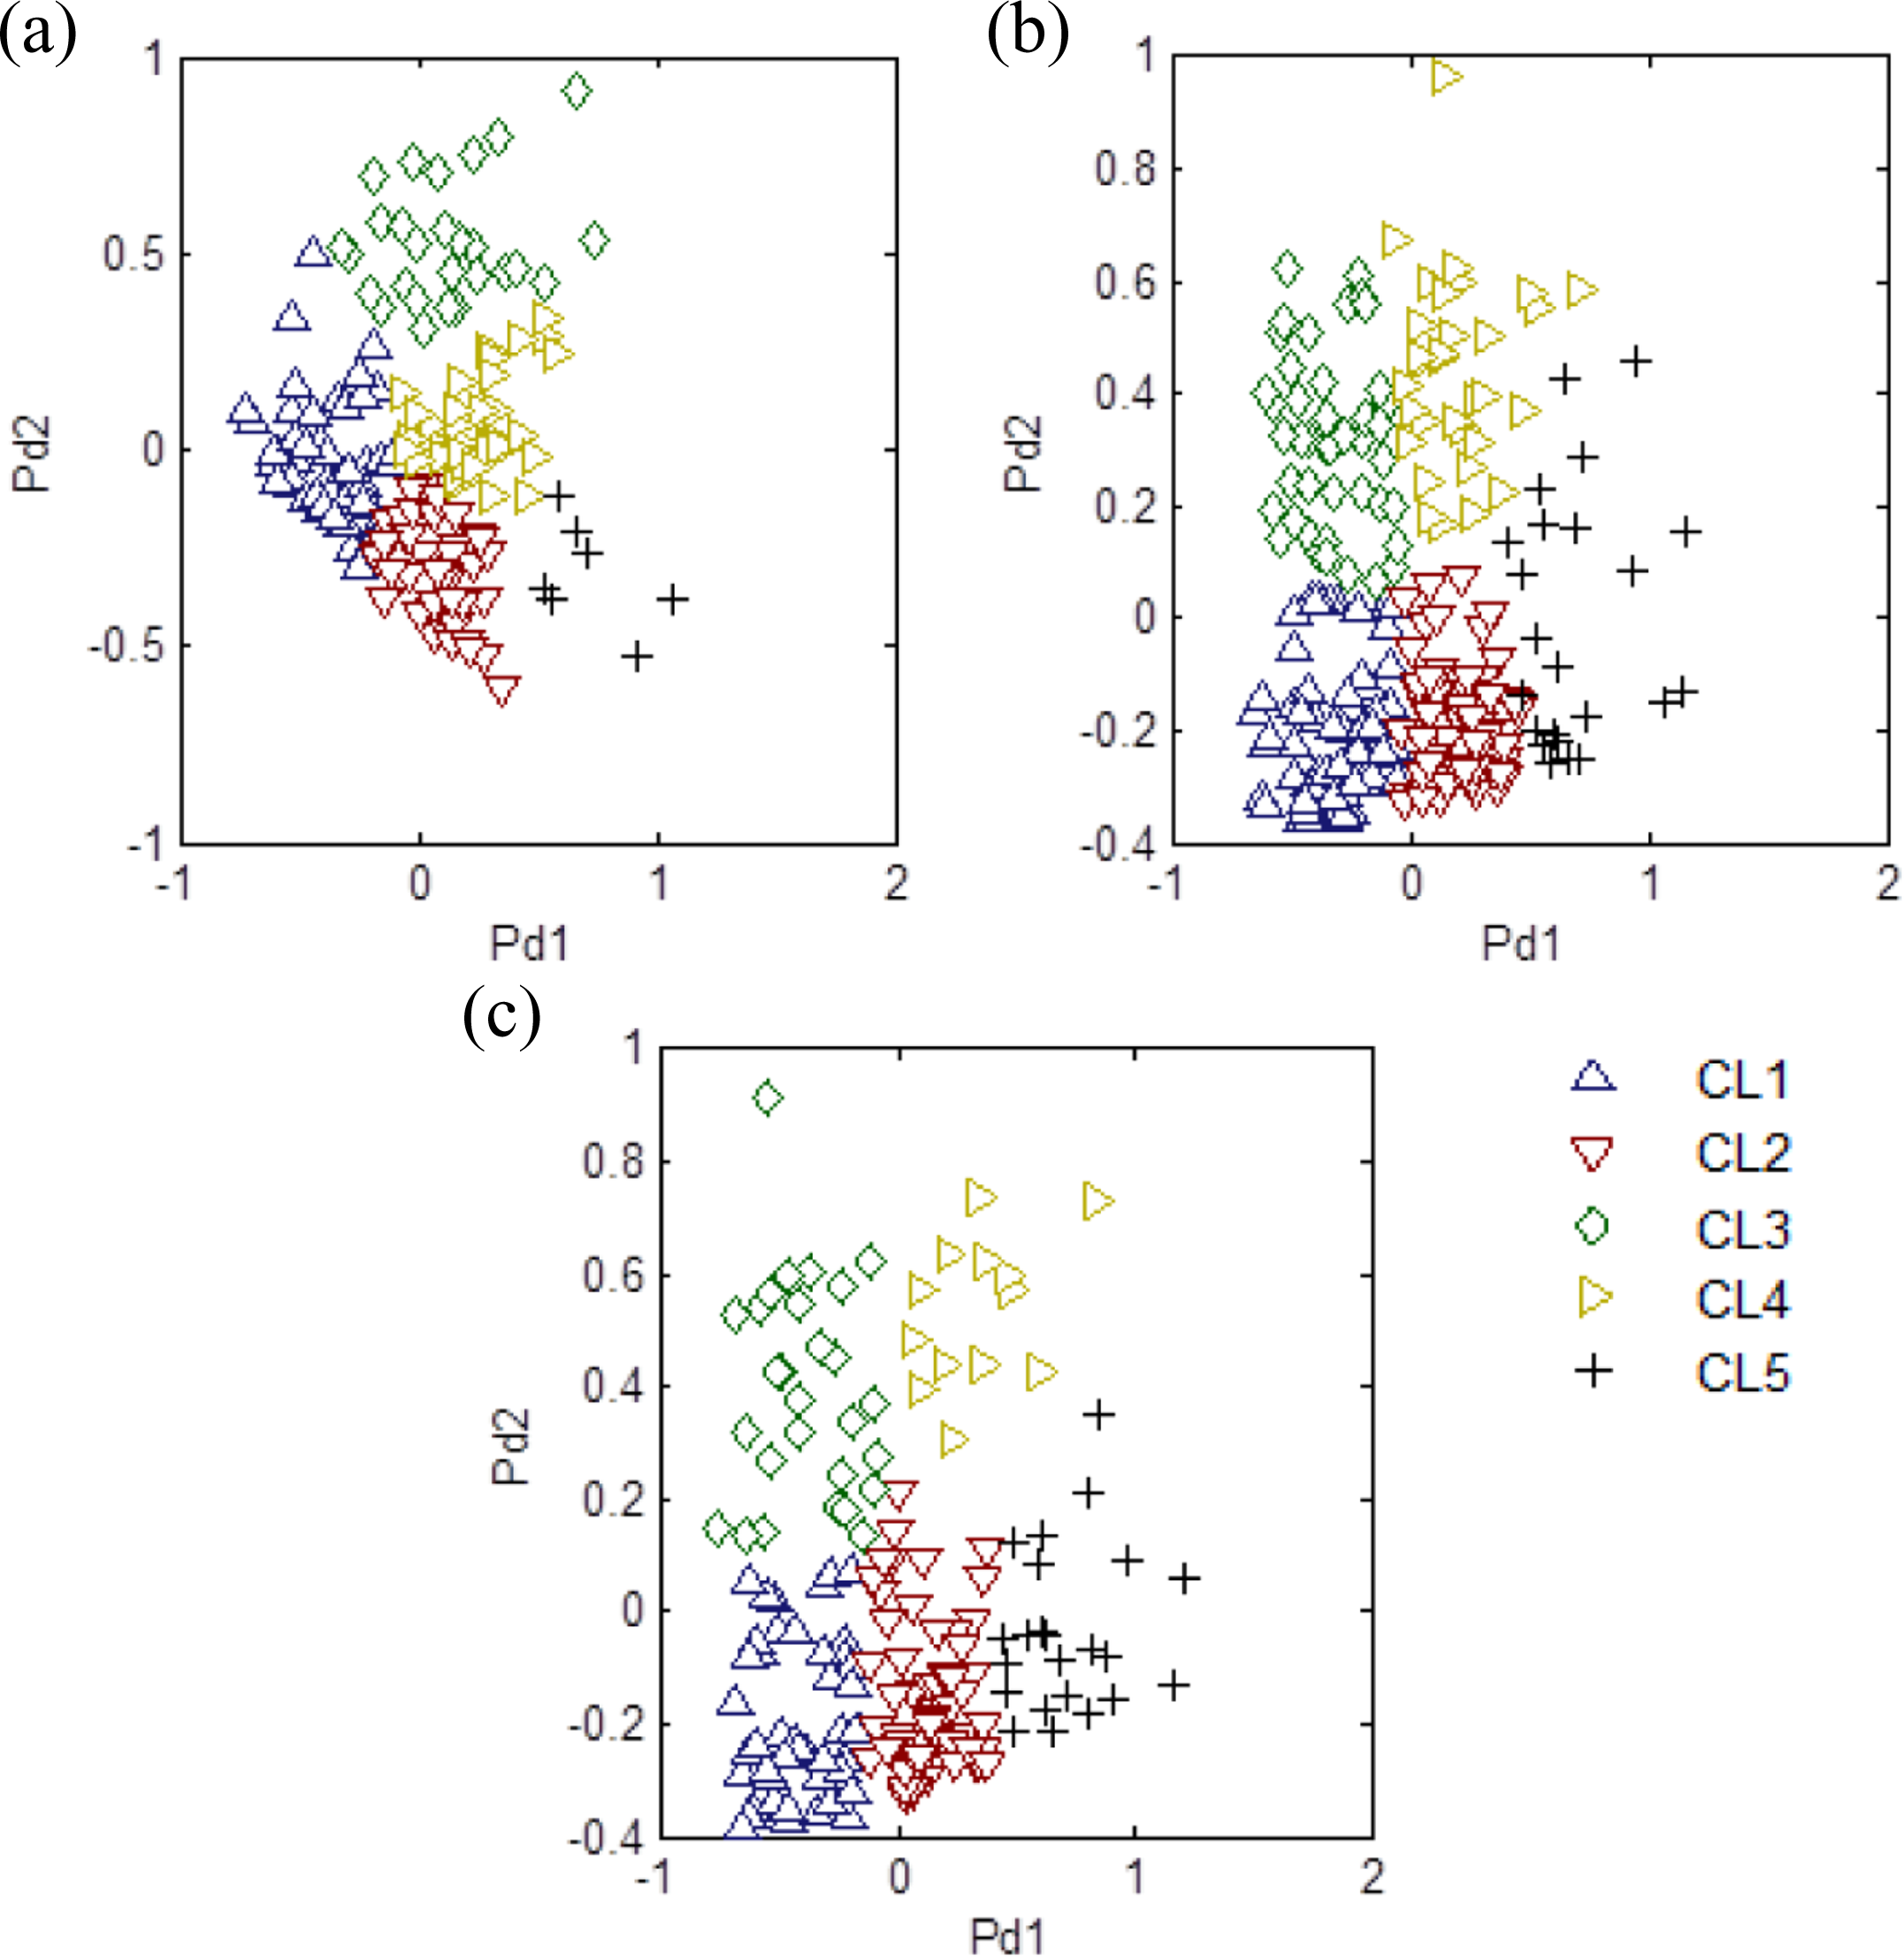
Cluster results in the first two principal components coordinates for all three FC specimens.
Eigenvalues of four selected AE features for the first two principal components.;
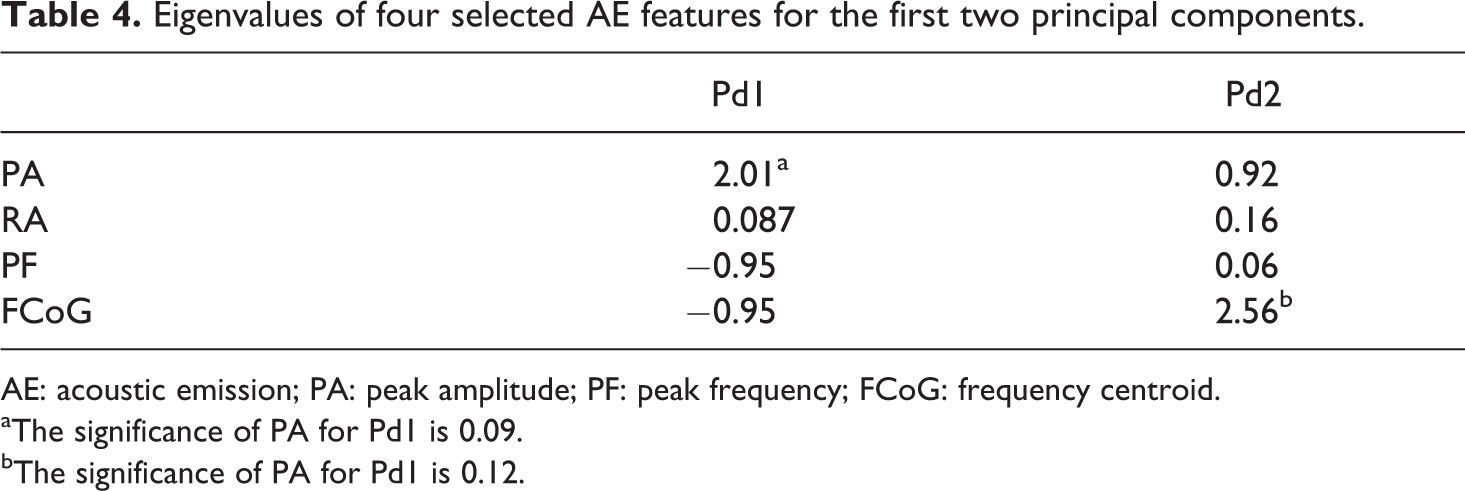
AE: acoustic emission; PA: peak amplitude; PF: peak frequency; FCoG: frequency centroid.
aThe significance of PA for Pd1 is 0.09.
bThe significance of PA for Pd1 is 0.12.
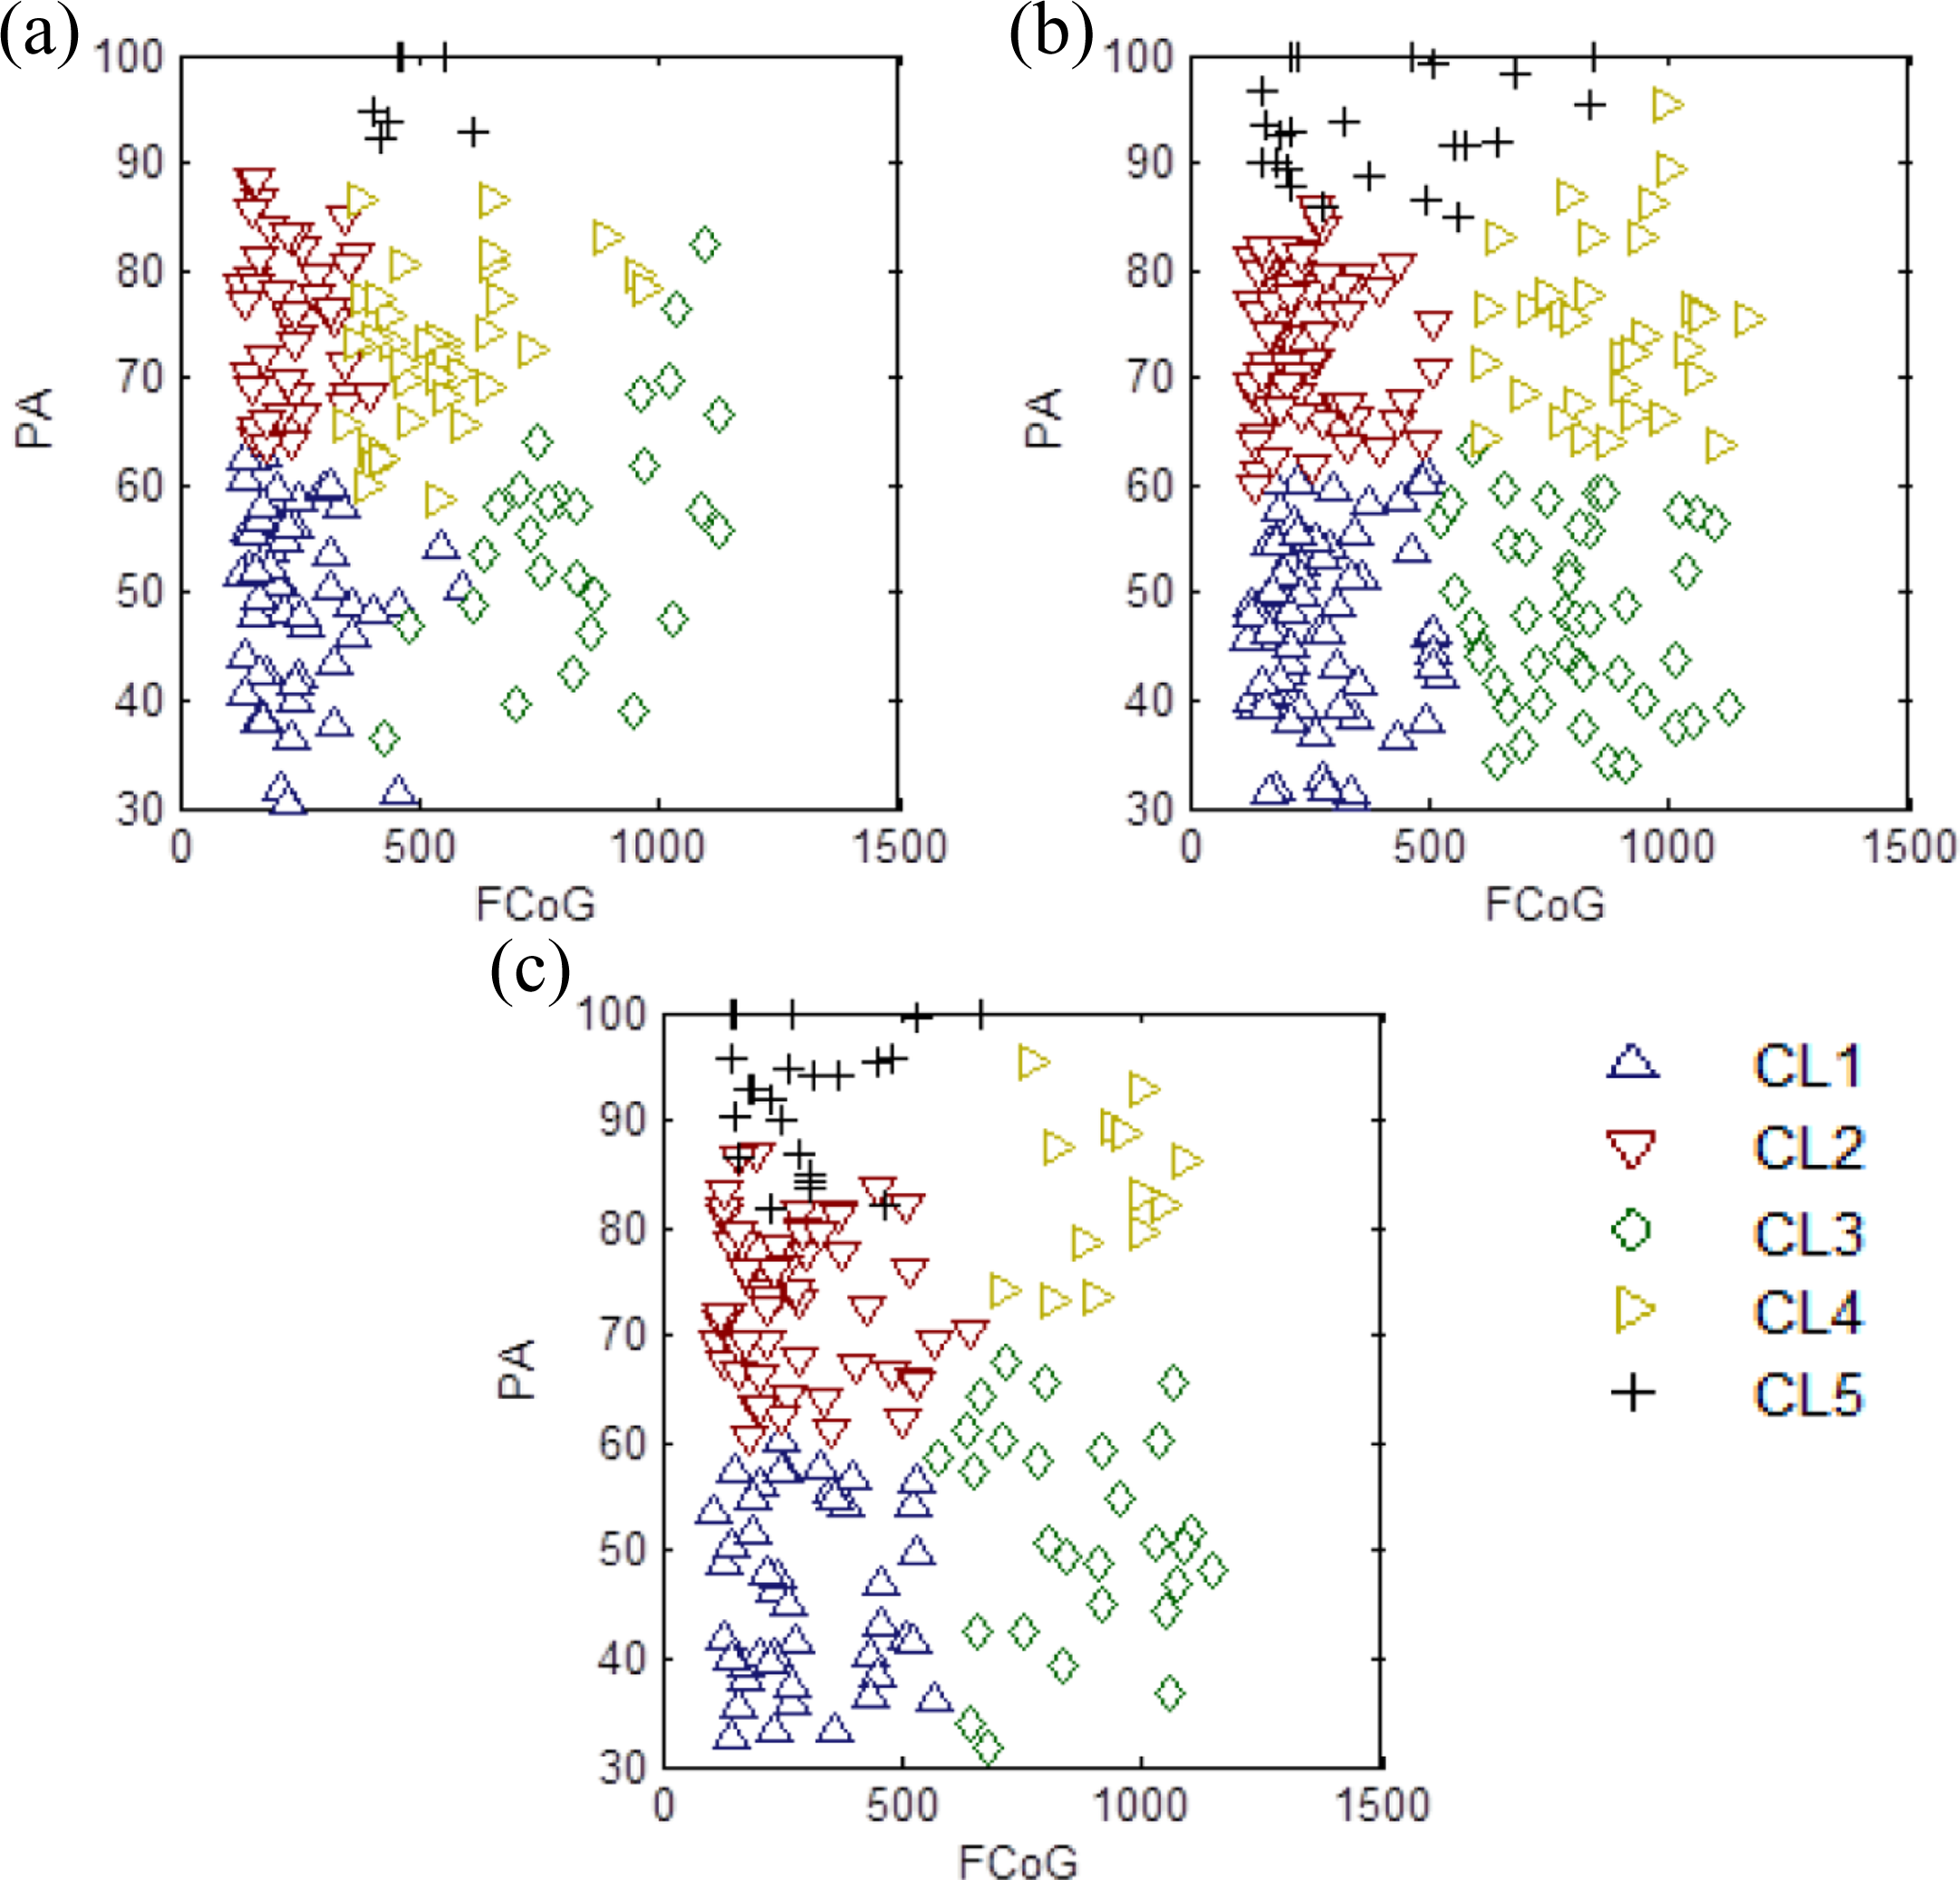
Cluster results in PA and FCoG coordinates for cross-ply graded PE/PE specimens. PA: peak amplitude; FCoG: frequency centroid.
Figure 12 shows AE events in five clusters distributed in PA and FCoG coordinates for all three tests, and it can be seen that the shapes of five clusters for all tests are similar. CL1 has lower PA and lower frequency, CL2 has medium PA and lower frequency like CL1, CL3 has similar PA as CL1 and slightly higher frequency, CL4 has higher PA and frequency, and CL5 has the highest PA and frequency. From Figure 12, it can be seen that CL2 and CL4 are slightly overlapped for FC-01 specimen and CL1, CL3, and CL5 are better separated with each other and the other two clusters. The percentage of AE events number in each cluster and cluster validity index are summarized in Table 3.
Cluster boundaries
The cluster bounds for three specimens are summarized in Table 5. PA range of CL1 is less than 60 dB, and FCoG is less than 500 kHz. CL2 has higher PA than CL1 from 60 dB to 80 dB, but similar FCoG range. PA and frequency band of CL3 are about <70 dB and 500–1000 kHz. AE events in CL4 have similar amplitude range with CL2 and higher frequency of >500 kHz for most AE events. PA of AE events in CL5 is highest, >80 dB, and FCoG of most AE signals is less than 1000 kHz.
Cluster boundaries and corresponding damage modes for cross-ply graded PE/PE composites.
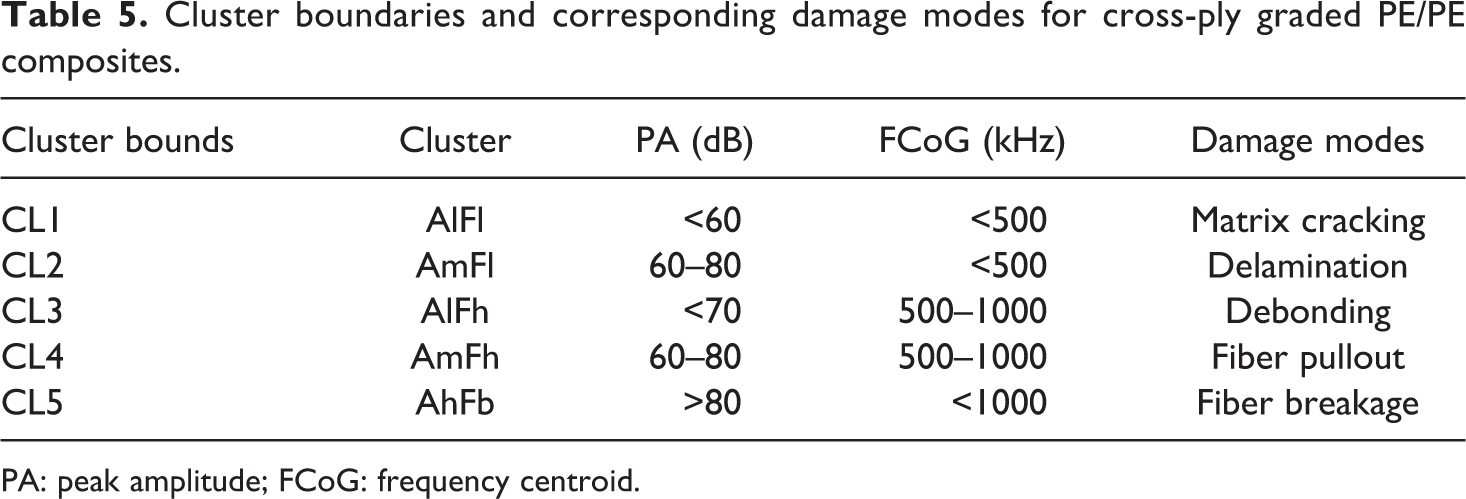
PA: peak amplitude; FCoG: frequency centroid.
For further analysis, five clusters are denoted by AlFl, AmFl, AlFh, AmFh, and AhFb in the following sections, where “l,” “m,” “h,” and “b” are the abbreviations of “low,” “medium,” “high,” and “broad.” “A” refers to PA and “F” is FCoG. Therefore, AlFl represents low amplitude and low frequency cluster, AmFl is medium amplitude and low frequency cluster, AlFh represents cluster with low amplitude and high frequency, AmFh refers to medium amplitude and high frequency cluster, and AhFb denotes cluster with high amplitude and broad frequency.
Discussions
The connections between clusters and damage modes
The cross-ply PE/PE graded FC specimen was loaded in fiber direction of 0-ply. UHMWPE fibers mainly stand load, so LDPE matrix does not present plastic deformation during tensile process. Five damage mechanisms can be concluded and observed for PE/PE graded laminates under tensile loading: matrix cracking, fiber-matrix debonding, delamination, fiber pullout, and fiber breakage, 9 –11,32 shown in scanning electron microscopy (SEM) images (Figure 13). In order to investigate the connections between resulted clusters and different damage modes, five clusters were established according to the results for PE/PE composites in literatures (Table 1). 9,11 In cluster AlFl and AlFh, PA of AE events is less than 60 dB, which should be assumed to relate with matrix cracking or interface debonding. PA of AE events in AmFl and AmFh is 60–80 dB, which can be regarded as correlation with fiber pullout or delamination. PF is not the most representative feature for the clusters, whereas FCoG has good classification ability. It can be seen from the typical frequency spectrum of fiber pullout AE signal in the literature by Wang 10 that FCoG of fiber pullout is more than 500 kHz, so it can be assumed that AmFh corresponds to fiber pullout. AE events in AhFb have highest PA and broad frequency range, possibly generated by delamination. Though frequency range for fiber breakage varies in different studies corresponding, 16,33,34 from approximately 100 kHz to 400 kHz, high-frequency AE events were usually regarded as being generated by fiber breakages. Therefore, the correlations between resulted clusters and different damage modes can be preliminarily concluded and summarized in Table 5 as follows: AlFl—matrix cracking, AmFl—delamination, AlFh—interface debonding, AmFh—fiber pullout, and AhFb—fiber breakage.
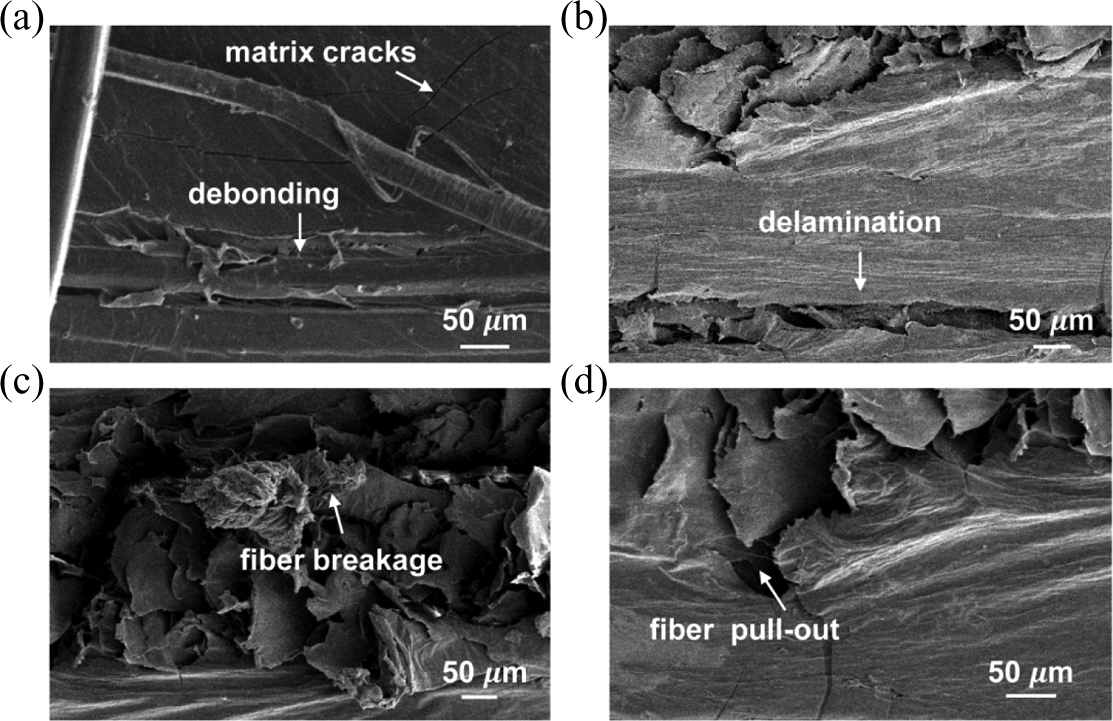
SEM micrographs of cross-ply graded composite specimen “FC” after tensile loading. There are five damage modes, including matrix cracking, debonding, delamination, fiber breakage, and fiber pullout. SEM: scanning electron microscope.
Damage initiation and propagation process
Figure 14 shows cumulative AE events and location plots for FC-03 sample. XLoc refers to relative distance between generated AE events in tensile specimen to one attached sensor, with the position near the upper sensor as 0 cm along x direction (Figure 14(c)). It can be seen that AE events in AlFl and AlFh initiate at strain of about 1.3%, then AE events in AlFl increase slowly and concentrated in 2–4 cm. When strain is up to 2.5%, AE events multiply and distribute evenly all over the specimen. AE events in AmFl start to appear at strain 2.5%, and then increase and multiply rapidly, most AE events generated in the position of 2–6 cm. AE events in AmFh and AhFb happen at higher strain, with AmFh a little earlier, and events in AmFh increase slowly at first and accumulate rapidly when close to ultimate failure, and mainly concentrate in the position of 4–6 cm.
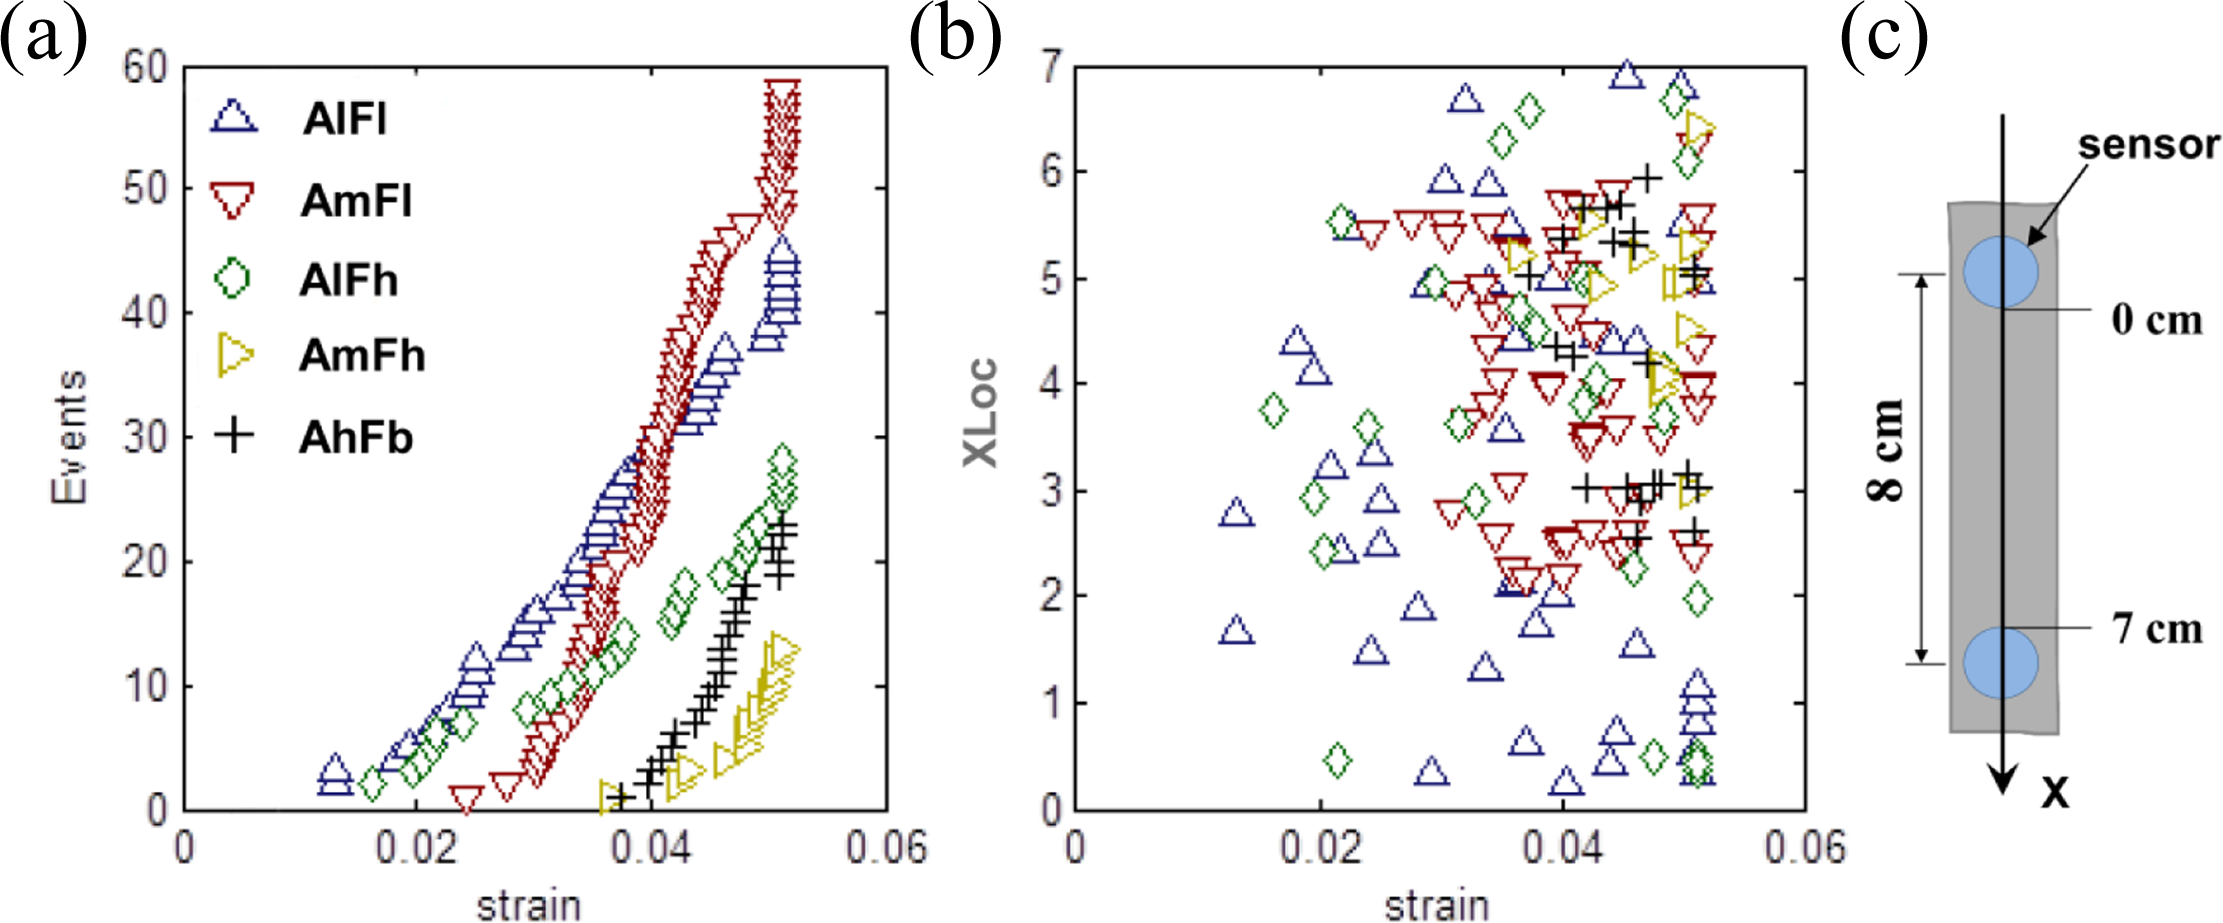
(a) AE events in each cluster increasing with strain; (b) AE events x position versus strain for specimen FC-03; (c) the distance between two sensors is about 8 cm, and the position near the upper sensor is assumed as zero along x direction. AE: acoustic emission.
The sharp slope of cumulative AE energy curve was defined as damage threshold in literatures. 35 –37 At the beginning of tensile, there are no acoustic events registered. In further, starting from certain strain emin (AE initiation strain), acoustic events start to occur, with a few AE events. Then, the occurrence rate of AE events with higher energy starts increasing sharply, and soon the energy content reaches higher levels. We assumed that e min is lowest damage threshold, e 1 is safety threshold and e 2 is danger threshold. Therefore, combined with damage thresholds, the damage initiation and the propagation process of specimen FC-03 can be discussed and predicted. Figure 15 illustrates AE energy and cumulative energy registration pattern and stress–strain relationship of FC-03. When strain is up to the lowest damage threshold e min, matrix cracking (AlFl) and interface debonding (AlFh) initiate earliest, and then as the strain increasing, there are more matrix cracking happens and they distributed in the position of 4–5 cm, at the same time only several debonding damages generate and concentrated on 0–1 cm and 2–4 cm of the tensile specimen. When strain increased to safety threshold 2.5%, local delaminations start to appear and multiply in the position of 5–6 cm, accompanying with a large amount of matrix cracking over the specimen. There are a few interface debonding happens at first, and after safety threshold 2.5%, there are more debonding existing and located in 6–7 cm. When strain is applied to danger threshold 4%, fiber pullout and fiber breakage start to happen, with fiber pullout starting a little earlier, and they increase slowly and mainly generate in the position of 5–6 cm. While strain is up to failure strain e max of 5%, fiber breakage and fiber pullout happen a lot in 3–6 cm, accompanying with many delaminations and matrix cracking, until final failure. During the tensile process, matrix cracking occupies 27.0%, interface debondings are about 16.8%, and they evenly distributed on the specimen. Delaminations are the most, occupying 34.7%, and in the position of 3–6 cm. Although the number of fiber pullout and fiber breakage is not so much, 7.8% and 13.8%, respectively, they are crucial for the safety of this specimen, and they mainly distribute in 2–6 cm where delaminations concentrated.
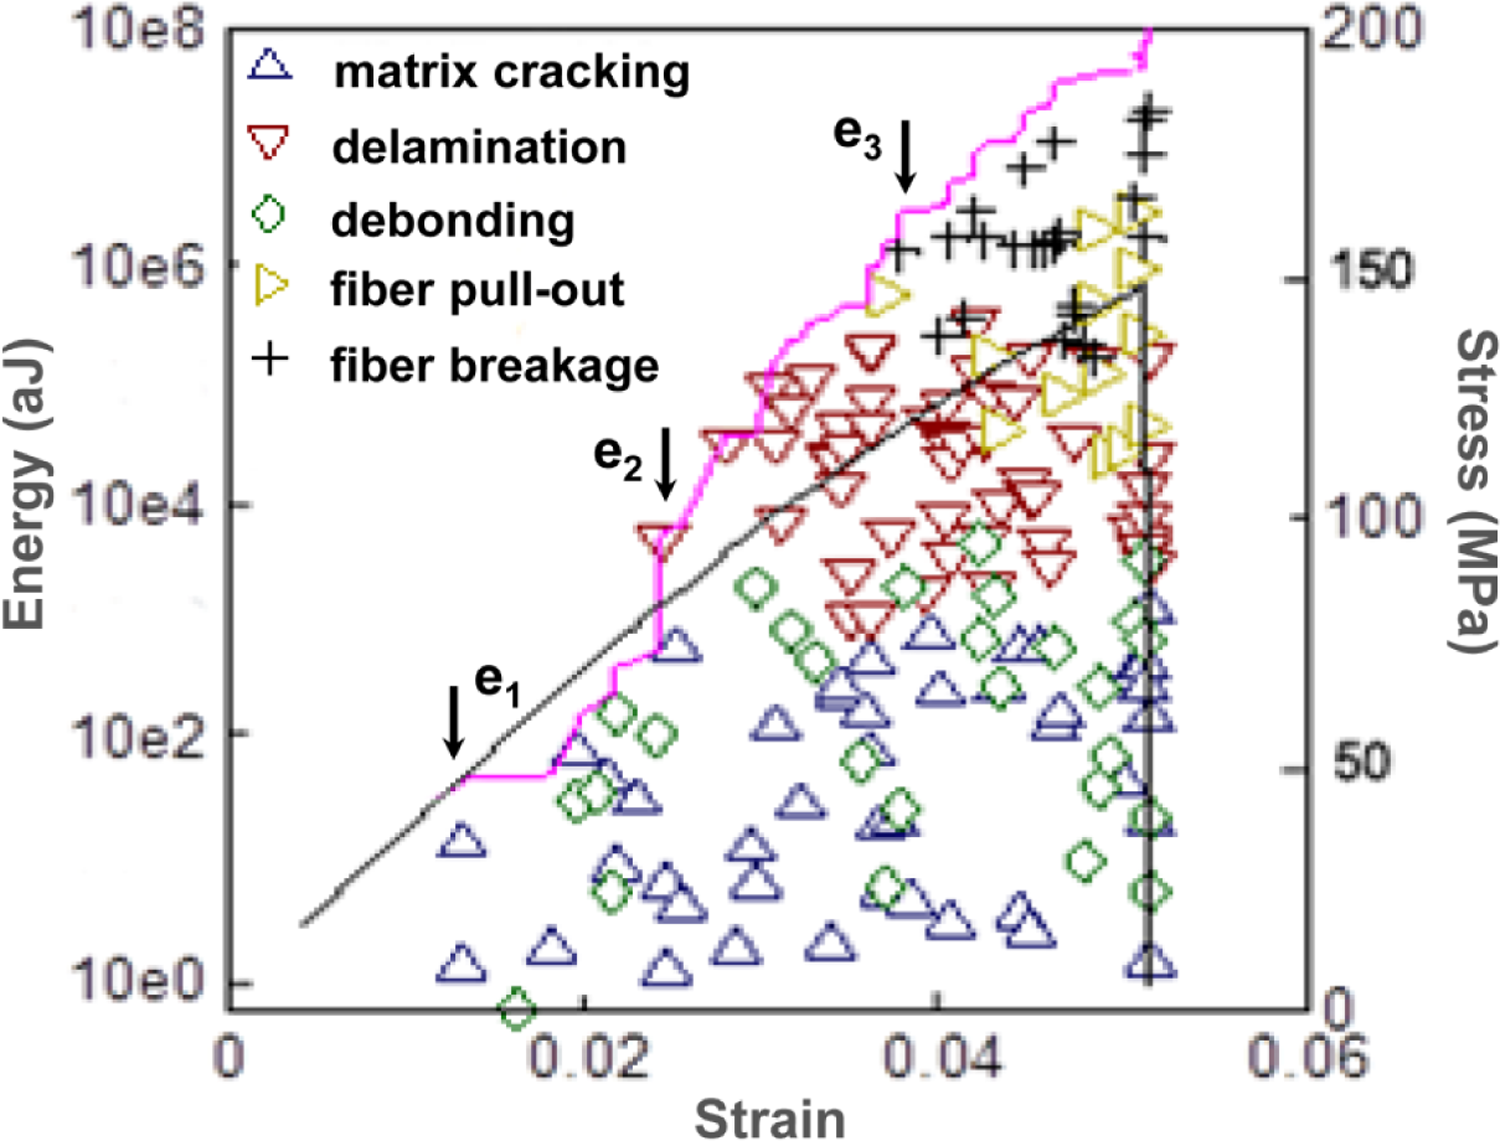
AE registration energy and cumulative energy with events in each cluster and stress–strain curve for FC-03 specimen. AE: acoustic emission.
Above all, the damage process of the specimen can be predicted and investigated by combining cluster results and damage thresholds. Before lowest damage threshold e min, there is no damage happens. Between emin and safety threshold e 1, there are only a small amount of matrix cracking and interface debonding appear. In this case, the sample can be assumed to be slightly damaged. From safety threshold e 1 to danger threshold e 2, there are more matrix cracking, local delaminations, and debonding occurring, and the specimen can be still in use. After danger threshold e 2, the existence of fiber pullout and fiber breakage and delaminations leads to ultimate failure of this tensile specimen FC-03. The positions where delaminations accumulate are weak section of the sample, which will accompany with fiber breakage and fiber pullout, and thus lead to final failure of specimen.
Conclusions
In this study, AE registration and corresponding damage modes of cross-ply PE/PE graded composites during tension loading were investigated, and the AE events were studied by unsupervised cluster analysis. Six cluster algorithms were made comparison in order to find the appropriate algorithm for AE data pattern for PE/PE graded composites. PA and FCoG were found to be the most relevant features for the obtained five clusters. The correlations with five clusters and five damage mechanisms were established, and damage initiation and propagation process of a PE/PE graded specimen were discussed. The conclusions can be made as follows:
k-means++ and AAP are relatively better among the six cluster algorithms. Sometimes k-means and FCM can also obtain good cluster quality. The cluster stability of SOM + k-means and SOM + FCM is good, but the cluster quality for all AE data points is not satisfied. Choosing initial cluster center of k-means++ is simple, sometimes can fall into local minimum, AAP is more stable and repeatable, but computation time and cost will increase when the data set without clear separation;
AE events can be discriminated in five clusters based on nine AE features by feature selection and clustering. PA and FCoG are two crucial parameters in this discrimination: AlFl corresponds to low amplitude and low-frequency events; AmFl relates to moderate amplitude and low-frequency events; AlFh correlates with low amplitude and high-frequency events; AmFh refers to moderate amplitude and high-frequency events; and events in AhFb are high amplitude and broad frequency;
The correlations between clusters and damage modes can be established as follows: AlFl—matrix cracking, AmFl—delamination, AlFh—interface debonding, AmFh—fiber breakage, and AhFb—fiber pullout; the sequence of AE events initiation in the clusters is AlFl = AlFh > AmFl > AmFh > AhFb, and the order of the events number during the whole test is AmFl > AlFl > AlFh > AhFb > AmFh.
Footnotes
Acknowledgements
The authors are grateful to Prof. Stepan Lomov for all the help. The help of Vallen AE system of Johan Vanhulst and SEM equipment of Rudy De Vos in KU Leuven is acknowledged with gratitude.
Declaration of Conflicting Interests
The author(s) declared no potential conflicts of interest with respect to the research, authorship, and/or publication of this article.
Funding
The author(s) received no financial support for the research, authorship, and/or publication of this article.