
Abstract
In this study low-density polyethylene (LDPE)/thermoplastic starch (TPS)/nanoclay (O-Mt) nanocomposites were prepared by a melt blending process using a Brabender mixer. Dicumyl peroxide (DCP) and nanoclay (O-Mt) were studied to improve interfacial adhesion and to obtain the various desired properties of the nanocomposites. The structure and properties of the materials were studied by X-Ray Diffraction (XRD), Differential Scanning Calorimetry (DSC), Thermogravimetric Analysis (TGA), Scanning Electron Microscopy (SEM), Atomic Force Microscopy (AFM) and by tensile and Izod impact tests. X-ray diffraction analysis of the nanocomposites showed that the characteristic peaks of the clay were shifted to the lower angles, indicating an intercalated structure in the presence of dicumyl peroxide (DCP). The TGA curve indicated an improvement in the thermal stability of the materials with the amount of silicate and DCP. The mechanical properties of the materials were improved as a consequence of the increase in phase adhesion which gave an improvement in crystallinity confirmed by DSC. In addition, the impact strength of the modified materials was improved compared to the original materials. A modification of morphology as well as roughness was demonstrated by SEM and AFM.
Introduction
Polyolefins have gained an important place in the packaging industry because of their low cost, light weight, required properties and low energy consumption during processing.1,2 Among these polymers, LDPE, which degrades in the environment, is one of the fastest growing commercial thermoplastic materials. However, the continued use of polyethylene (PE) plastics in various applications is leading to a growing problem of environmental pollution. Therefore, to overcome this challenge, the production of degradable and biodegradable polyolefins is necessary. This can be achieved by mixing the polymer with a biodegradable material, which can effectively reduce the volume of plastic waste by partial degradation, such as plant starch.3,4
Starch is a natural, renewable, inexpensive and widely available polymer found in many types of plants such as corn, wheat, rice and potato, which can be decomposed by bacteria in the environment. 5 For starch processing, it is necessary to destroy starch granules by adding plasticizers such as glycerol. The result of the destruction of starch granules is a material like gel, called thermoplastic starch (TPS). 6 However, this thermoplastic material is sensitive to water and has poor mechanical properties, mixing with other polymers is inevitable. The polymer studied for blending with TPS is polyethylene (PE). The first report on the blending of LDPE and LLDPE with TPS is that of St-Pierre et al.. 7 Their results show a decrease in the modulus of LDPE with increasing TPS content. Numerous other studies have also been performed on PE/TPS.8–15
Due to the high interfacial tension between starch and polyethylene, it is necessary to use a compatibilizing agent to increase interfacial adhesion and improve the mechanical properties of the blend.16–18 A series of compatibilizers, including polyethylene-co-vinyl alcohol (EVOH), 19 polyethylene-co-acrylic acid (EAA), 20 polyethylene-co-glycidyl methacrylate (PEGMA) 21 and polyethylene-g-maleic anhydride (PE-g-MA) 22 were used to improve the properties of the mixture. PE-g-MA is the most common compatibilizer and has shown good efficacy in PE/TPS blends. This improvement has been attributed to the reaction esterification between the maleic anhydride groups of PE-g-MA and the hydroxyl groups of the starch, and the good interaction of its non-polar chain with the PE matrix. 23
Nevertheless, reactive blends can be obtained by cross-linking agents such as peroxide as a source of radicals. 24 Peroxide induces radical reactions in three steps: a) cleavage of peroxide; b) formation of macroradicals; and c) combination of different macroradicals with chain termination. The resulting polymer blend will be either a graft, block or random copolymer or an interpenetrating network structure. In all cases, the structure and morphology of the blend components are modified, which affects the mechanical properties of the resulting materials.25–27
The reinforcement of the polymer with the inorganic nanofillers has attracted the attention of many researchers and industrialists.28–30 In particular, the contribution of natural nanofillers on different polymers has been also studied.31–33 The high performance of polymeric nanocomposites is based on the high mechanical parameters and the high aspect ratio of nanofiller at low content. The best compatibilizer and miscibility of the blends can be obtained by combining them with nanofillers, due to the decrease of the total free energy of the mixing.34,35 The dispersion and localization of nanofillers has an impact on the improvement of polymer properties. Other studies on the relationship between nanofillers and matrix polymers have indicated that nanofillers should be dispersed in the matrix,36,37 or in the interface region.36,38
In addition, the best mechanical properties, thermal stability and compatibilization are obtained for an optimized dispersion of nanofiller in the matrix and a good interface between these two phases. 39 So far, few papers have reported on nanocomposite materials based on PE/TPS reinforced with organic clay modified. Organoclays influence on PE/TPS blends were studied by Chiu et al. 40 and Sharif et al. 41 Their results show that the clay improves thermal stability and reduces the average size of the TPS phase due to the semi-exfoliated structure obtained in these nanocomposite materials.
This study investigates the properties of the ternary phase of LDPE containing TPS and nanoclays. A dicumyl peroxide (DCP) was used to improve the interfacial adhesion and facilitate the dispersion of the nanoclays. All composites were prepared by a melt mixing process using a Brabender mixer. The mechanical properties (tensile strength and impact resistance) of the prepared materials were studied. Thermal properties were characterized using Differential Scanning Calorimetry (DSC) and Thermogravimetric Analysis (TGA). Structural properties were examined by X-ray diffraction and FTIR spectroscopy. The microstructures of the samples were analyzed by Scanning Electron Microscopy (SEM) and Atomic Force Microscopy (AFM).
Experimental
Materials
Several materials were used during this investigation. The polymer matrix used was low-density polyethylene, LDPE Sabic HP0823, supplied by Oriental Petro Chemicals from Saudi Arabia. Dicumyl Peroxide (DCP), 96 wt.% was supplied by NORAX from Germany. Peroxide is the “compatibilizing agent.” Subsequently, an organically modified layered silicate (O-Mt) in powder form was used as nanofiller for the preparation of the nanocomposite. It is an Na+ type montmorillonite nanoclay subjected to surface treatment with 25–35 wt.% of methyl dihydroxy-ethyl-hydrogenated ammonium tallow with a cationic exchange capacity of 95meq/100 g, density of 1870kg/m3 and a particle size of 20 µm used as organically modified clay which was supplied by Sigma-Aldrich from France. Regular corn starch, initially consisting of 23 wt.% amylose and 77 wt.% amylopectin, was used as the degradable component purchased from Sigma-Aldrich, France. Finally, the non-volatile plasticizer was analytical reagent grade glycerol; the compound was purchased from Sigma-Aldrich (France) and used as is, without further purification.
Sample preparation
Preparation of thermoplastic starch (TPS)
The TPS was prepared according to the following procedure. First, the starch was premixed with glycerol and water, and the formulation used contained 54 wt.% native corn starch, plus 23 wt.% glycerol and 23 wt.% water. 42 The starch powder was introduced into a turbo-mixer. Then water was added slowly with stirring. Then glycerol was added slowly while stirring. After the glycerol was completely added, the mixture was mixed at high speed to obtain a homogeneous dispersion, then kept for 48 hours to be suspended. The resulting dry blend was melted by mixing it in the Haake Rheomix 600 internal mixer (PLASTI-CORDER) at 130°C to add thermoplasticity and obtain the thermoplastic starch (TPS). The rotor speed was 50 rpm and the mixing time was 8 min.
Preparation of the nanocomposites
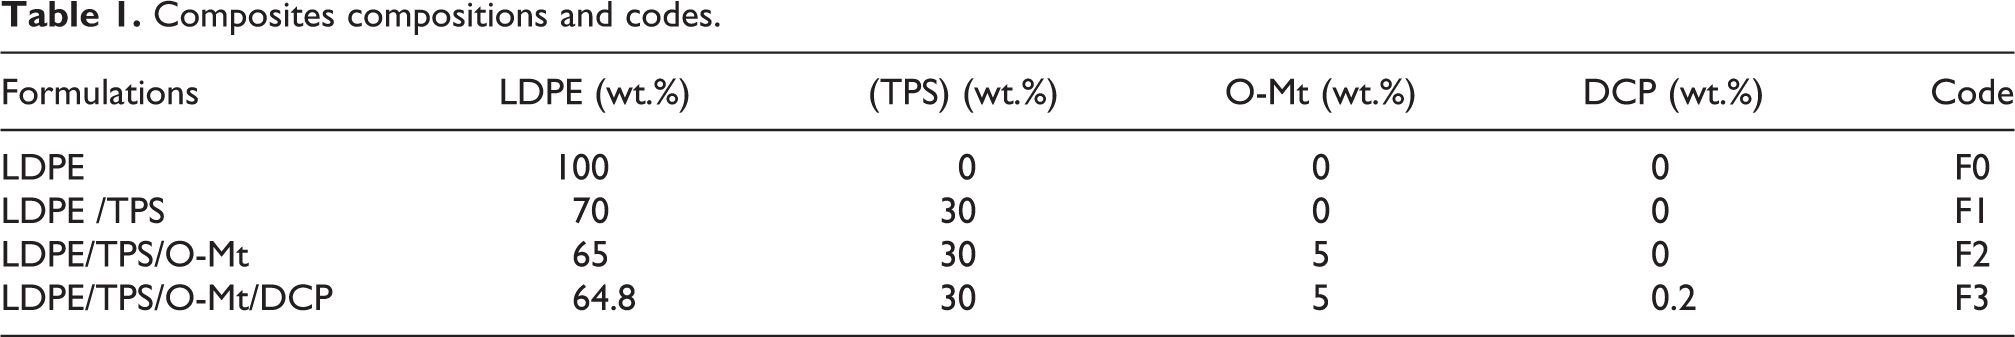
The various components (LDPE, TPS, O-Mt and DCP) were mixed in a solid state as a dry blend. Subsequently, the blends were melted using an internal mixer, the Haake Rheomix 600 (PLASTI-CORDER). The operating conditions were: rotor speed of 50 rpm, mixing temperature of 140°C and a residence time of 10 min. Based on the study by Bouhelal et al., 43 the DCP content was fixed at 0.2 wt.%. The TPS and O-Mt contents were fixed at 30 wt.% and 5 wt.% respectively for all formulations. Thin films of dried samples were prepared by compression using a hydraulic press heated to 140°C for 5 min. Table 1 provides the composition of the samples examined in this study.
Composites compositions and codes.
Characterization
The samples were characterized by means of X-Ray Diffraction (XRD), Differential Scanning Calorimetry (DSC), Thermogravimetric Analysis (TGA), tensile stress-strain experiments, impact strength tests and morphological properties (SEM and AFM). The XRD study was performed using a Brucker D8 diffractometer. The working conditions were the following: voltage 40 kV, intensity 40 mA and angular range 2–40 (2θ). The wavelength used was kα, copper radiation (λ = 0.154 nm). The dhkl were determined by substituting the 2θ scattering peak into Bragg’s law

All FTIR spectra of the samples were recorded in the range 4000–400 cm−1 using a FTIR PERKIN ELMER. Representative samples were analyzed using a EVO 131 SETERAM analyzer Differential Scanning Calorimeter (DSC). The samples were heated from 30°C to 200°C at 10°C/min. The melting temperatures (Tm) were taken as the temperature corresponding to the peak values of the melting endotherm. The melting heat can be correlated with the crystallinity degree (χc) of the polymer. It can be calculated by using the Formula (2) as follows

where, χc is the crystallinity degree of the polymer; ▵Hm is the melting enthalpy determined by the integration of the surface under the DSC curve in the melting process domain; and ▵Ho is the melting enthalpy of the 100% crystallized. 44 A value of ▵H°f = 290 J/g for 100% crystalline LDPE homopolymer was used for calculating the χc.
Several thermogravimetric experiments were performed with a Perkin Elmer TGA 4000 to study the thermal behavior of materials. The samples were heated from room temperature to 600°C at a 10°C/min heating rate. The tensile properties of the materials under investigation were determined at room temperature in accordance with ASTM D638-14 (165 × 12 × 2 mm) using an Instron MTS LTS 504 instrument at a 50 mm/min rate and a fixed gauge length of 50 mm (1/min strain rate). Tensile strength, percent elongation at break, and tensile modulus values were recorded. The average values of Young’s modulus, tension and elongation were calculated from at least three measurements.
The Izod impact strength of the materials, whose dimensions (63 × 12 × 2 mm) were measured in accordance with ASTM 256-73 using an Izod impact machine, namely the Resil Impactor. The microstructure of the samples was examined by Scanning Electron Microscope (SEM) using a VEGA3 SBH TESCAN at an accelerating voltage of 20.00Kv. Atomic Force Microscopy (AFM) was also used to explore the surface state of the resulting samples by imaging describing their morphologies. This characterization was performed using a Pacific Nanotechnology type atomic force microscope in non-contact mode.
Results and discussion
X-ray diffraction (XRD)
Figure 1 shows the pattern of the neat nanoclay (O-Mt) in XRD. The X-ray diagram of the neat nanoclay shows a characteristic peak at 2θ = 4.95°, which indicates an interlayer spacing d001 of 17.85 Å according to Bragg’s law. The interlayer d-spacing is the distance between the basal layers of the montmorillonite clay.

XRD diagrams of neat nanoclay (O-Mt).
Figure 2 shows the X-ray pattern of the LDPE, LDPE/TPS, LDPE/TPS/O-Mt and LDPE/TPS/O-Mt/DCP nanocomposites. The XRD patterns of the LDPE reveal a crystal lattice with characteristic diffraction peaks at the following 2θ values: 21.56°, 23.87° and 38.33°. It should be noted that the diffractograms (Figure 2(b)), corresponding to the LDPE/TPS show no change in the structure of the LDPE due to the incompatibility between these two phases, LDPE and TPS. However, the peak relative to clay is observed for the LDPE/TPS/(O-Mt) samples (diffractogram c) at about 2θ = 4.95° which corresponds to a d001 of clay that is equal to 17.85 Å. These results indicate that the organoclay (O-Mt) is just present on the surface in the LDPE/TPS blend.
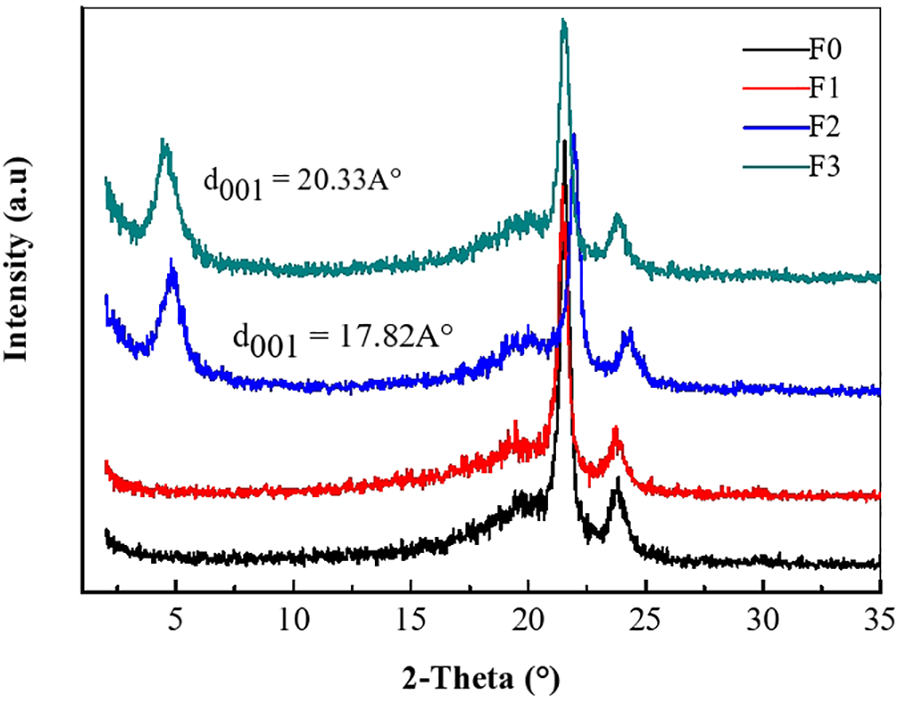
XRD diagrams of: (F0) LDPE, (F1) LDPE/TPS, (F2) LDPE/TPS/O-Mt and (F3) LDPE/TPS/O-Mt/DCP.
In the case of the dicumyl peroxide-containing nanocomposite (DCP) (d-diffractograms), the reflection of d001 shifted to lower angles, showing an increase in interplanar distance (from 17.85 Å to 20.33 Å). This indicates an intercalation of the nanolayers due to the insertion of the LDPE polymer chains in the spacing between the organoclay layers and has disorganized the structure of the clay layers since the height of the gallery increased. The addition of DCP can ensure the compatibility between the two phases of the LDPE/TPS blend and the dispersion of the clay.
FTIR spectroscopy
Figure 3 shows the FTIR spectra of neat LDPE, LDPE/TPS, LDPE/TPS/O-Mt and LDPE/TPS/O-Mt/DCP. The LDPE spectra illustrated in Figure 3(a) show characteristic bands at 2830 and 2980 cm−1 which correspond respectively to asymmetrical and symmetrical C-H stretching vibrations. The sharp peak at 1458 cm−1 and the peak at 715 cm−1 indicate the C-H bending and C-C rocking deformation vibrations. 45 The LDPE/TPS spectra presented in Figure 3(b), in addition to starch and LDPE absorptions, show characteristic bands of saccharides located at 921 and 1160 cm−1. These peaks are characterized by stretching vibrations of the C-C and C-O bands present in amylose and amylopectin. 46 One peak localized at 1640 cm−1 was attributed to stretching vibrations of the O-H band of adsorbed water. A wide band was localized between 3100 and 3600 cm−1 corresponding to the vibration of the O-H groups. All the characteristic peaks of LDPE were observed (Figure 3(b)).

FTIR spectra of: (a) LDPE, (b) LDPE/TPS, (c) LDPE/TPS/O-Mt and (d) LDPE/TPS/O-Mt/DCP.
In the FTIR spectra of the LDPE/TPS/O-Mt nanocomposites illustrated in Figure 3(c), the band detected around 1031 cm−1 is related to the stretching vibration of the Si-O groups of the tetrahedral components of the clay, while the SI-O-Al stretching and Si-O-Si bending vibrations are observed at 519 and 466 cm−1.47,48 The characteristic wide band centered at 3370 cm−1 is due to the physisorbed hydroxyl water molecules and silanol (Si-OH) groups. In the FTIR spectra of the LDPE/TPS/O-Mt/DCP nanocomposites, in addition to starch, LDPE and nanoclay absorptions, the characteristic DCP peaks (1700–1740 cm−1) do not appear in the spectra of the nanocomposites as shown in Figure 3(d). This may be due to the low concentration of DCP (0.2 wt.%).
The FTIR spectra of LDPE/TPS, LDPE/TPS/O-Mt and LDPE/TPS/O-Mt/DCP show an apparent intensification of the hydroxyl group characteristic band due to the presence of the plasticizer glycerol, whose incorporation into the starch induces a significant increase in the concentration of hydroxyl groups in the material. This increase results from the possible interactions of OH groups in TPS and glycerol, thus increasing the intermolecular H-bond. 49 Thus, the hydroxyl groups in glycerol are bound to each other or to those carried by the starch structure via hydrogen bridges. Moreover, for all nanocomposites, no peak shift was observed.
Differential scanning calorimetry (DSC)
Figure 4 shows the melting endotherm of unmodified LDPE, the LDPE/TPS blend and its composites with and without DCP in the temperature range of 25 to 250°C. Table 2 summarizes the values for melting temperature (Tm), crystallinity (χc) and heat of fusion (▵H) for all samples. Based on Figure 4 and the results presented in Table 2, the thermograms show that all materials had a single melting endotherm. It can be observed that the peak Tm of the LDPE was observed at 121°C, it changed with the addition of TPS and it remained unchanged with the incorporation of clay and DCP in the presence of TPS. On the other hand, the surface area of the melting endotherm was calculated and indicated as the heat of fusion, ▵H. The latter is an important parameter because its magnitude is directly proportional to the overall level of χc that the polymer possesses. 50

DSC thermograms of: (F0) LDPE, (F1) LDPE/TPS, (F2) LDPE/TPS/O-Mt and (F3) LDPE/TPS/O-Mt/DCP.
DSC analysis data for neat LDPE, LDPE/TPS, LDPE/TPS/O-Mt and compatibilized composites.

Based on the results summarized in Table 2, the blend of LDPE with TPS resulted in a corresponding decrease in the crystallinity of the LDPE. Moreover, it can be noted that χc of LDPE decreased from 43% to 36% in the presence of TPS. The addition of nanoclay to the LDPE/TPS system improved the χc. The addition of nanoclay (O-Mt) to the LDPE/TPS blend seems to improve the crystallinity of the LDPE matrix. This result is consistent with previous results obtained by Chiu et al. 40 and Sharif et al. 41 Some studies have reported that the nanoclay increases the crystallinity of the polymer in nanocomposite samples, because the organic clay intercalates into the polymer chains and acts as a nucleating agent.51,40 For other researchers, the nanoclay reduces the crystallinity of polyethylene in nanocomposite samples, because the organoclay intercalates in the polymer matrix and limits the movements of the polymer chains.41,52
According to our results, the degree of crystallinity (χc) of LDPE in a nanocomposite sample increases with the addition of nanoclay. In this case, the nanoclay acts as a nucleating agent for the crystallization of the LDPE matrix and increases the crystallinity of the LDPE matrix. This phenomenon indicates that clay platelets are better nucleating agents when they are well dispersed in the polymer matrix. In addition, in the presence of dicumyl peroxide (DCP), an increase in the degree of crystallinity of the LDPE matrix is observed. It is interesting to note that the presence of DCP in the nanocomposite strongly affects the χc of the LDPE. Results show that the χc increased from 43% for the non-compatible composite to 56% for the LDPE/TPS/O-Mt/DCP system (Table 2). Good compatibility and miscibility of the LDPE/TPS blends was achieved by combining the matrix with DCP and nanoclay.
Thermal stability properties
Figure 5 and Table 3 show the result of the thermogravimetric analysis of neat LDPE and its composites. Based on the TGA curves, three characteristic temperatures were extracted. The first is the temperature at the beginning of decomposition (Tonset) which takes place at 240°C. The second is the temperature corresponding to 50% of the decomposition which takes place at 365°C. The third is the constant weight reached which corresponds to the maximum decomposition temperature (Tmax) around 497°C.
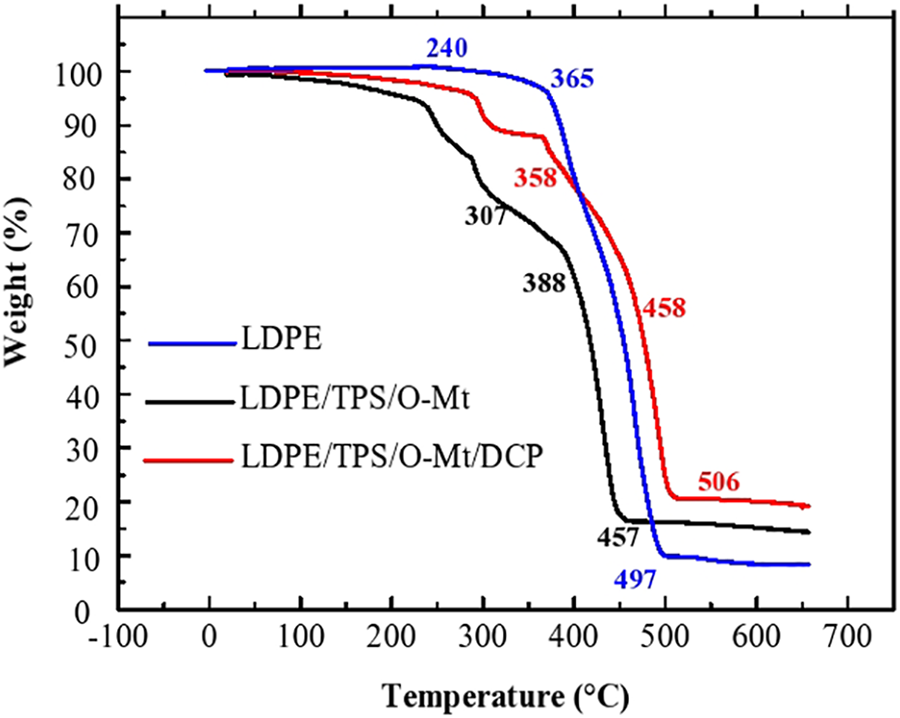
TGA thermograms of LDPE, LDPE/TPS/O-Mt and LDPE/TPS/O-Mt/DCP.
Thermal degradation kinetic parameters of LDPE and its composites.
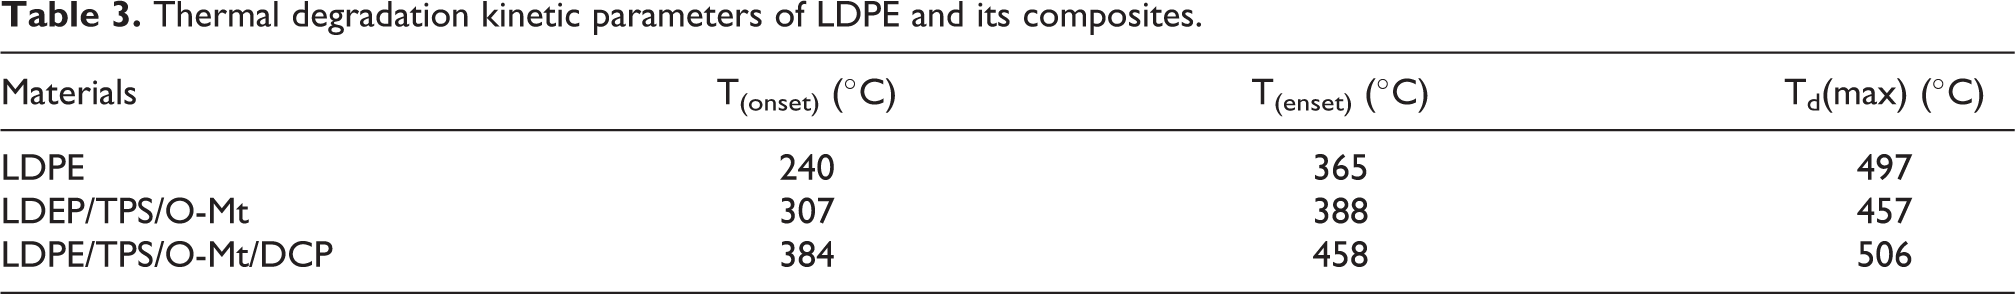
In the case of LDPE/TPS/O-Mt and according to the results in Table 3, the Tonset, Tenset and Tmax were increased to 307, 388 and 457°C, respectively. Hence, the barrier properties of the nanoscale loads improved the thermal stability of these materials. The addition of nanoclay to the LDPE matrix improved its thermal stability. LDPE composites increased the initial temperature (Tonset) compared to neat LDPE because the organoclays were able to migrate to the surface forming a protective barrier and blocking the release of gases during decomposition, resulting in an increase in the decomposition temperature of LDPE.
Furthermore, this improvement in thermal stability can be attributed to the fact that the nanofillers could induce carbonization and form a thermally stable charcoal, thus reducing the rate of release of volatile degradation substances.53,54 In the case of LDPE/TPS/O-Mt/DCP, the Tonset, Tenset and Tmax temperatures increased to 384, 458, and 506°C, respectively, compared to neat LDPE. The reason for the improved thermal stability can be attributed to the better adhesion between the polymer matrix, TPS and nanofiller due to the compatibilizer effect.
Mechanical properties
The mechanical properties of composite materials depend on the characteristics of the matrix and the filler, as well as the adhesion of the matrix and the filler in the interfacial region. In this study, the effect of the addition of nanofillers, thermoplastic starch and DCP on the tensile properties of LDPE was investigated. Figure 6 shows the mechanical properties of the nanocomposite samples such as Young’s modulus, tensile strength, elongation at break. The Young’s modulus of nanocomposites is improved compared to LDPE, while tensile strength and elongation at break tend to decrease. This behavior is commonly observed for polymer materials reinforced with silicate fillers.36,38,55

Tensile properties of LDPE and its composites: (a) Young’s modulus, (b) tensile strength and (c) elongation at break.
The Young’s modulus for the LDPE was approximately 243 MPa. It should be noted that the incorporation of TPS into LDPE reduced Young’s modulus, tensile strength and elongation at break. This result is attributed to the softening or dilution action of the second phase. As shown in Figure 6, the incorporation of nanofillers improved Young’s modulus, decreased tensile strength and elongation at break. However, the increase in Young’s modulus is at the expense of tensile strength and elongation at break. The addition of 5 wt.% of nanoclay tends to increase Young’s modulus to 316 MPa due to the better intercalation structure of the clay. A better dispersion of the clay platelets can act as a nucleating agent for the crystalline phase and thus lead to an increase in rigidity and Young’s modulus.
This paper also studied the effect of DCP on mechanical properties. It was found that the addition of DCP increases Young’s modulus, decreases tensile strength and significantly reduces elongation at break. Young’s modulus is higher when dicumyl peroxide (DCP) is added. This improvement is attributed to the increased interfacial adhesion between the LDPE and TPS phases and the reduced particle size of the TPS dispersed phase. Furthermore, the addition of DCP significantly strengthened the interfacial adhesion of TPS and LDPE blends, which would be attributed to the chemical reaction of the DCP groups with the hydroxyl groups on the starch at the interface (Figure 7). Therefore, the modulus of the final product will be improved.
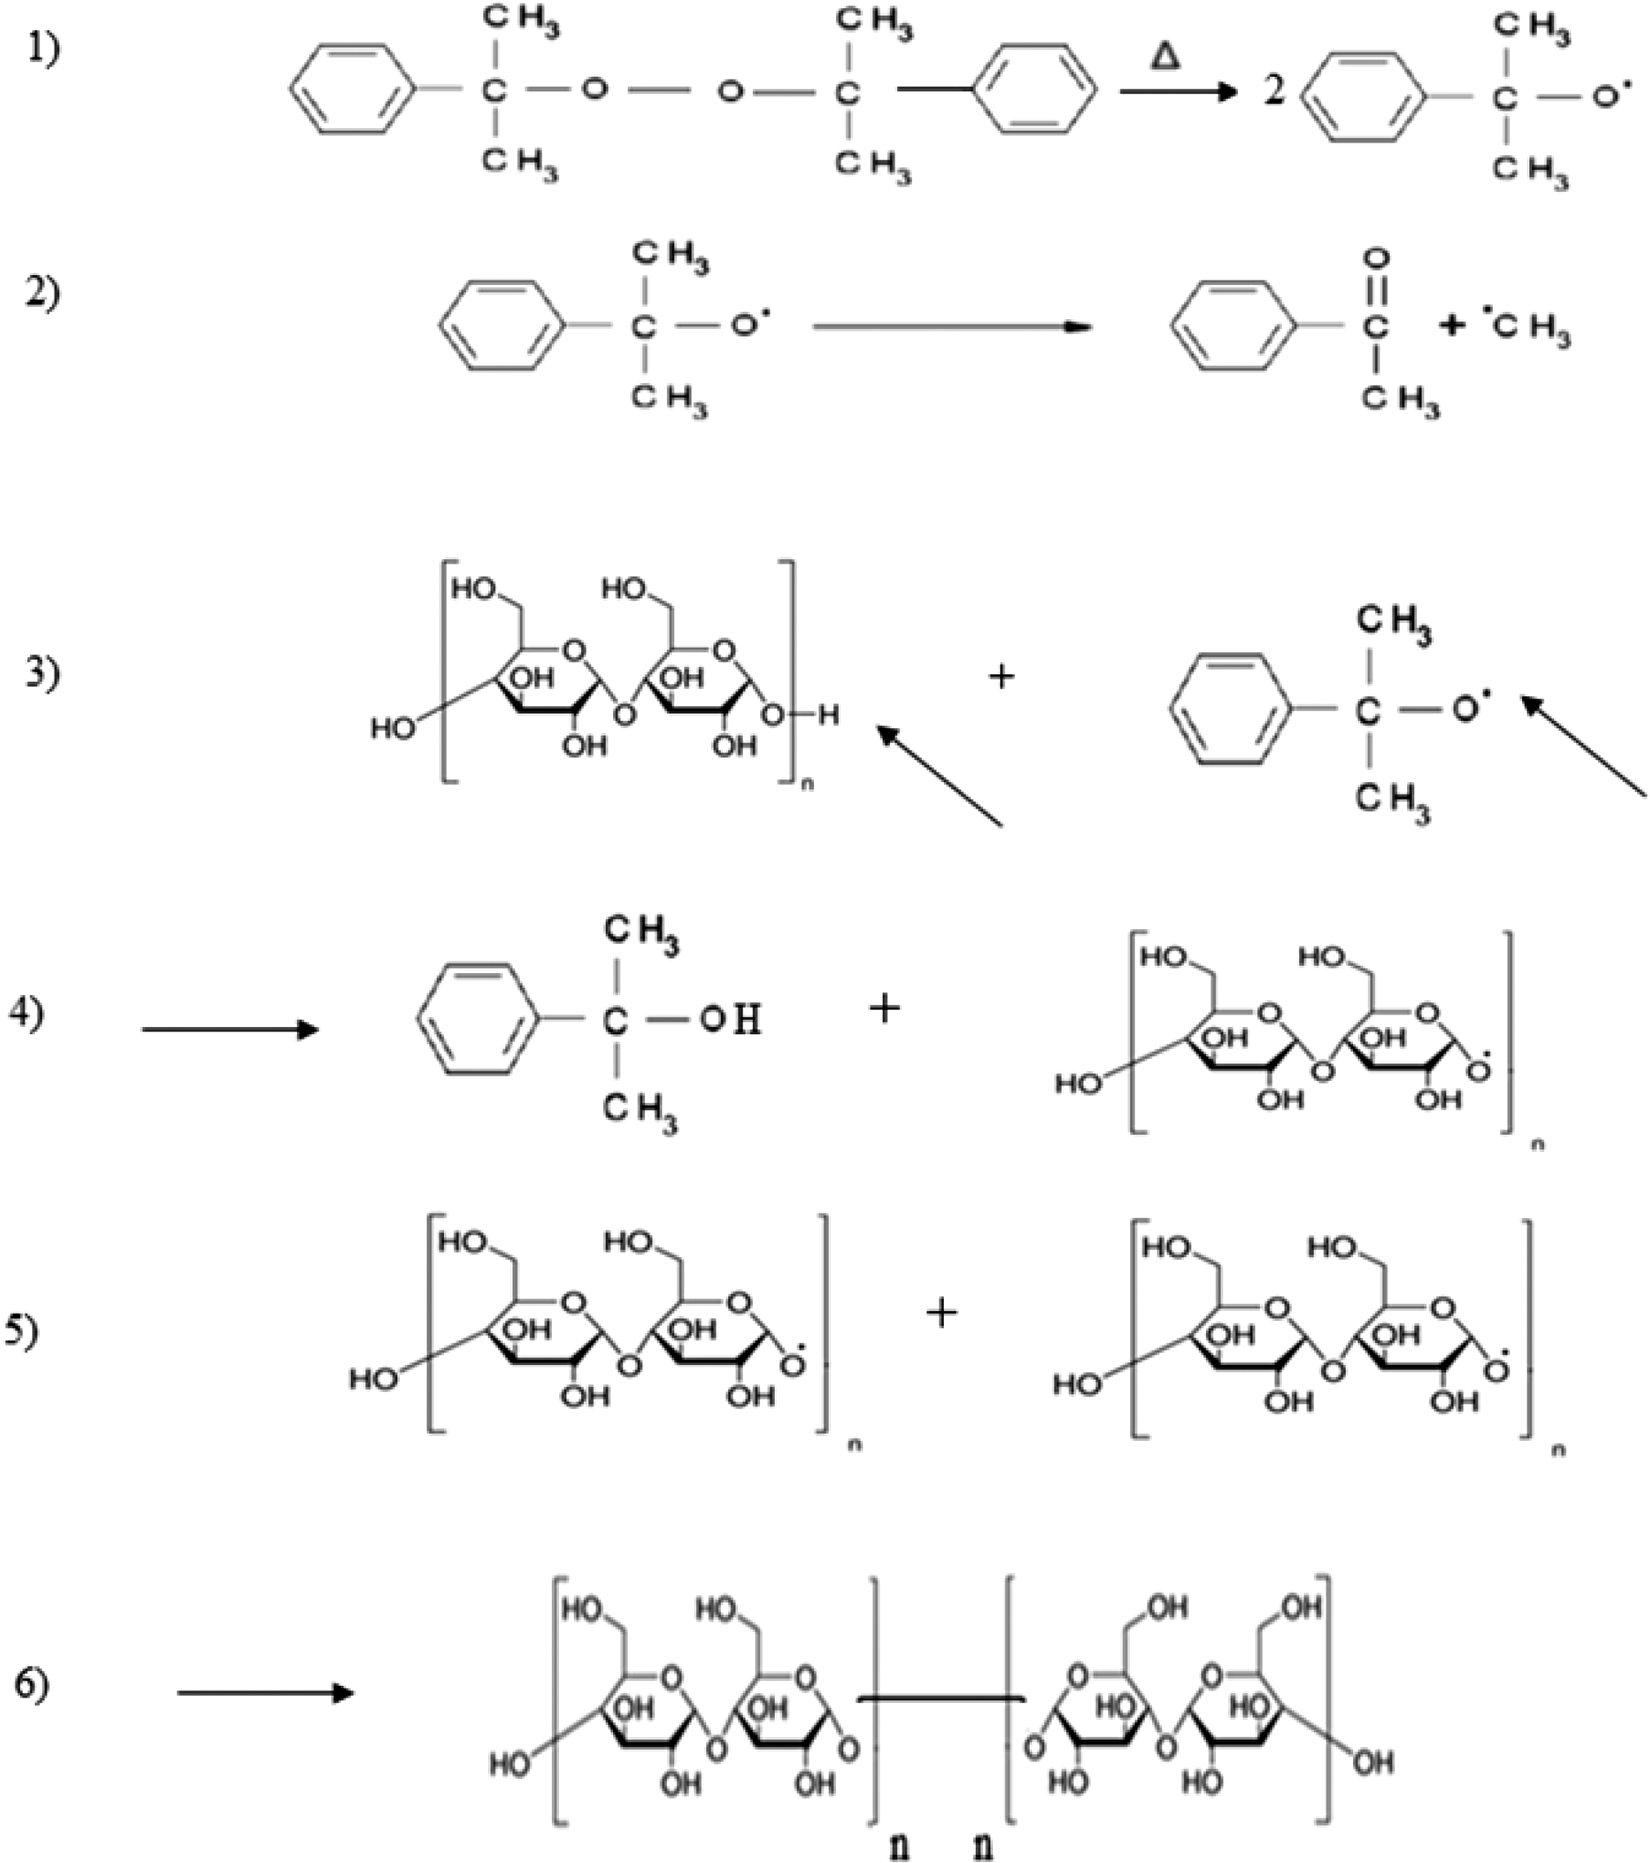
Chemical reaction between DCP and TPS at the interface.
This variation depends mainly on the morphology of the interface and the microstructure of the composites. Several studies have attributed the reinforcement obtained in polymer-nanofiller composites to the efficiency of tension transfer between the matrix and the filler. For well-bonded nanoparticles, the applied tension can be efficiently transferred to the nanoparticles in the matrix, which significantly improves tensile strength and Young’s modulus. On the other hand, for poorly bonded nanoparticles, the strength decreases when nanoparticles are added because the adhesion is very weak in the interfacial region.
Figure 8 illustrates the variations in resilience of the prepared composites. The impact resistance of neat LDPE is estimated at 25.99 kJ/m2. The LDPE specimens show very ductile behavior and did not show fracture. After the incorporation of TPS, the impact resistance of LDPE decreased to 13.5 kJ/m2, indicating the transition to a relatively more brittle behavior. The reduced impact resistance of the LDPE/TPS blend is due to the incompatibility of the system (difference in their hydrophobic and hydrophilic character respectively). As shown in Figure 8, the incorporation of the nanofiller reduces the impact resistance. The addition of DCP to the composites resulted in a significant improvement in impact resistance compared to the uncompatibilized composites (LDPE/TPS/O-Mt). The free radicals in DCP generate interactions between the components of the blend, resulting in the creation of particle/filler interactions rather than particle/particle interactions. The polymer/filler interaction is capable of resisting crack propagation much more than the polymer matrix.

Impact strength of LDPE, LDPE/TPS, LDPE/TPS/O-Mt and compatibilized composites LDPE/TPS/O-Mt/DCP.
Morphology analysis (SEM)
In polymer blends, it is necessary to study the morphology of the final product because most of its properties, especially its mechanical properties, depend on it. In most cases, the major components of the blends form the continuous phase, while the minor components form the dispersed phase. Figure 9 shows the SEM LDPE/TPS micrographs and the composites filled with 5 wt.% clay and 0.2 wt.% DCP. Micrograph in Figure 9(a) shows an immiscible system where the LDPE phase has a smooth continuous matrix in which the dispersed TPS phase forms irregular domains. The addition of thermoplastic starch tends to cover the LDPE matrix. In this case, poor adhesion between the two phases due to their immiscibility. However, when the clay is added, the distribution of the LDPE domains in the TPS phase is more homogeneous than in the unfilled blend. In Figure 9(c), the addition of DCP induces a visible change in the morphology of the LDPE/TPS/O-Mt/DCP nanocomposite due to the improved interfacial adhesion between the phases.

SEM micrographs of (a) LDPE/TPS, (b) LDPE/TPS/O-Mt and (c) LDPE/TPS/O-Mt/DCP.
Atomic force microscopic studies
Atomic force microscopy (AFM) has been widely used to study surface morphologies. In addition, thanks to the depth of field of AFM, micrographs retain a two- and three-dimensional aspect of the samples. AFM has been used to study surface morphological changes after the addition of organic clay and dicumyl peroxide (DCP). Figure 10 shows the images obtained in contact mode from the LDPE (Figure 10(a)), the unfilled LDPE/TPS blend (Figure 10(b)), the filled blend (Figure 10(c)) and the LDPE/TPS/O-Mt/DCP nanomaterial (Figure 10(d)). From these 2D and 3D images, a roughness is observed for the surface morphology of the LDPE matrix (Figure 10(a)).
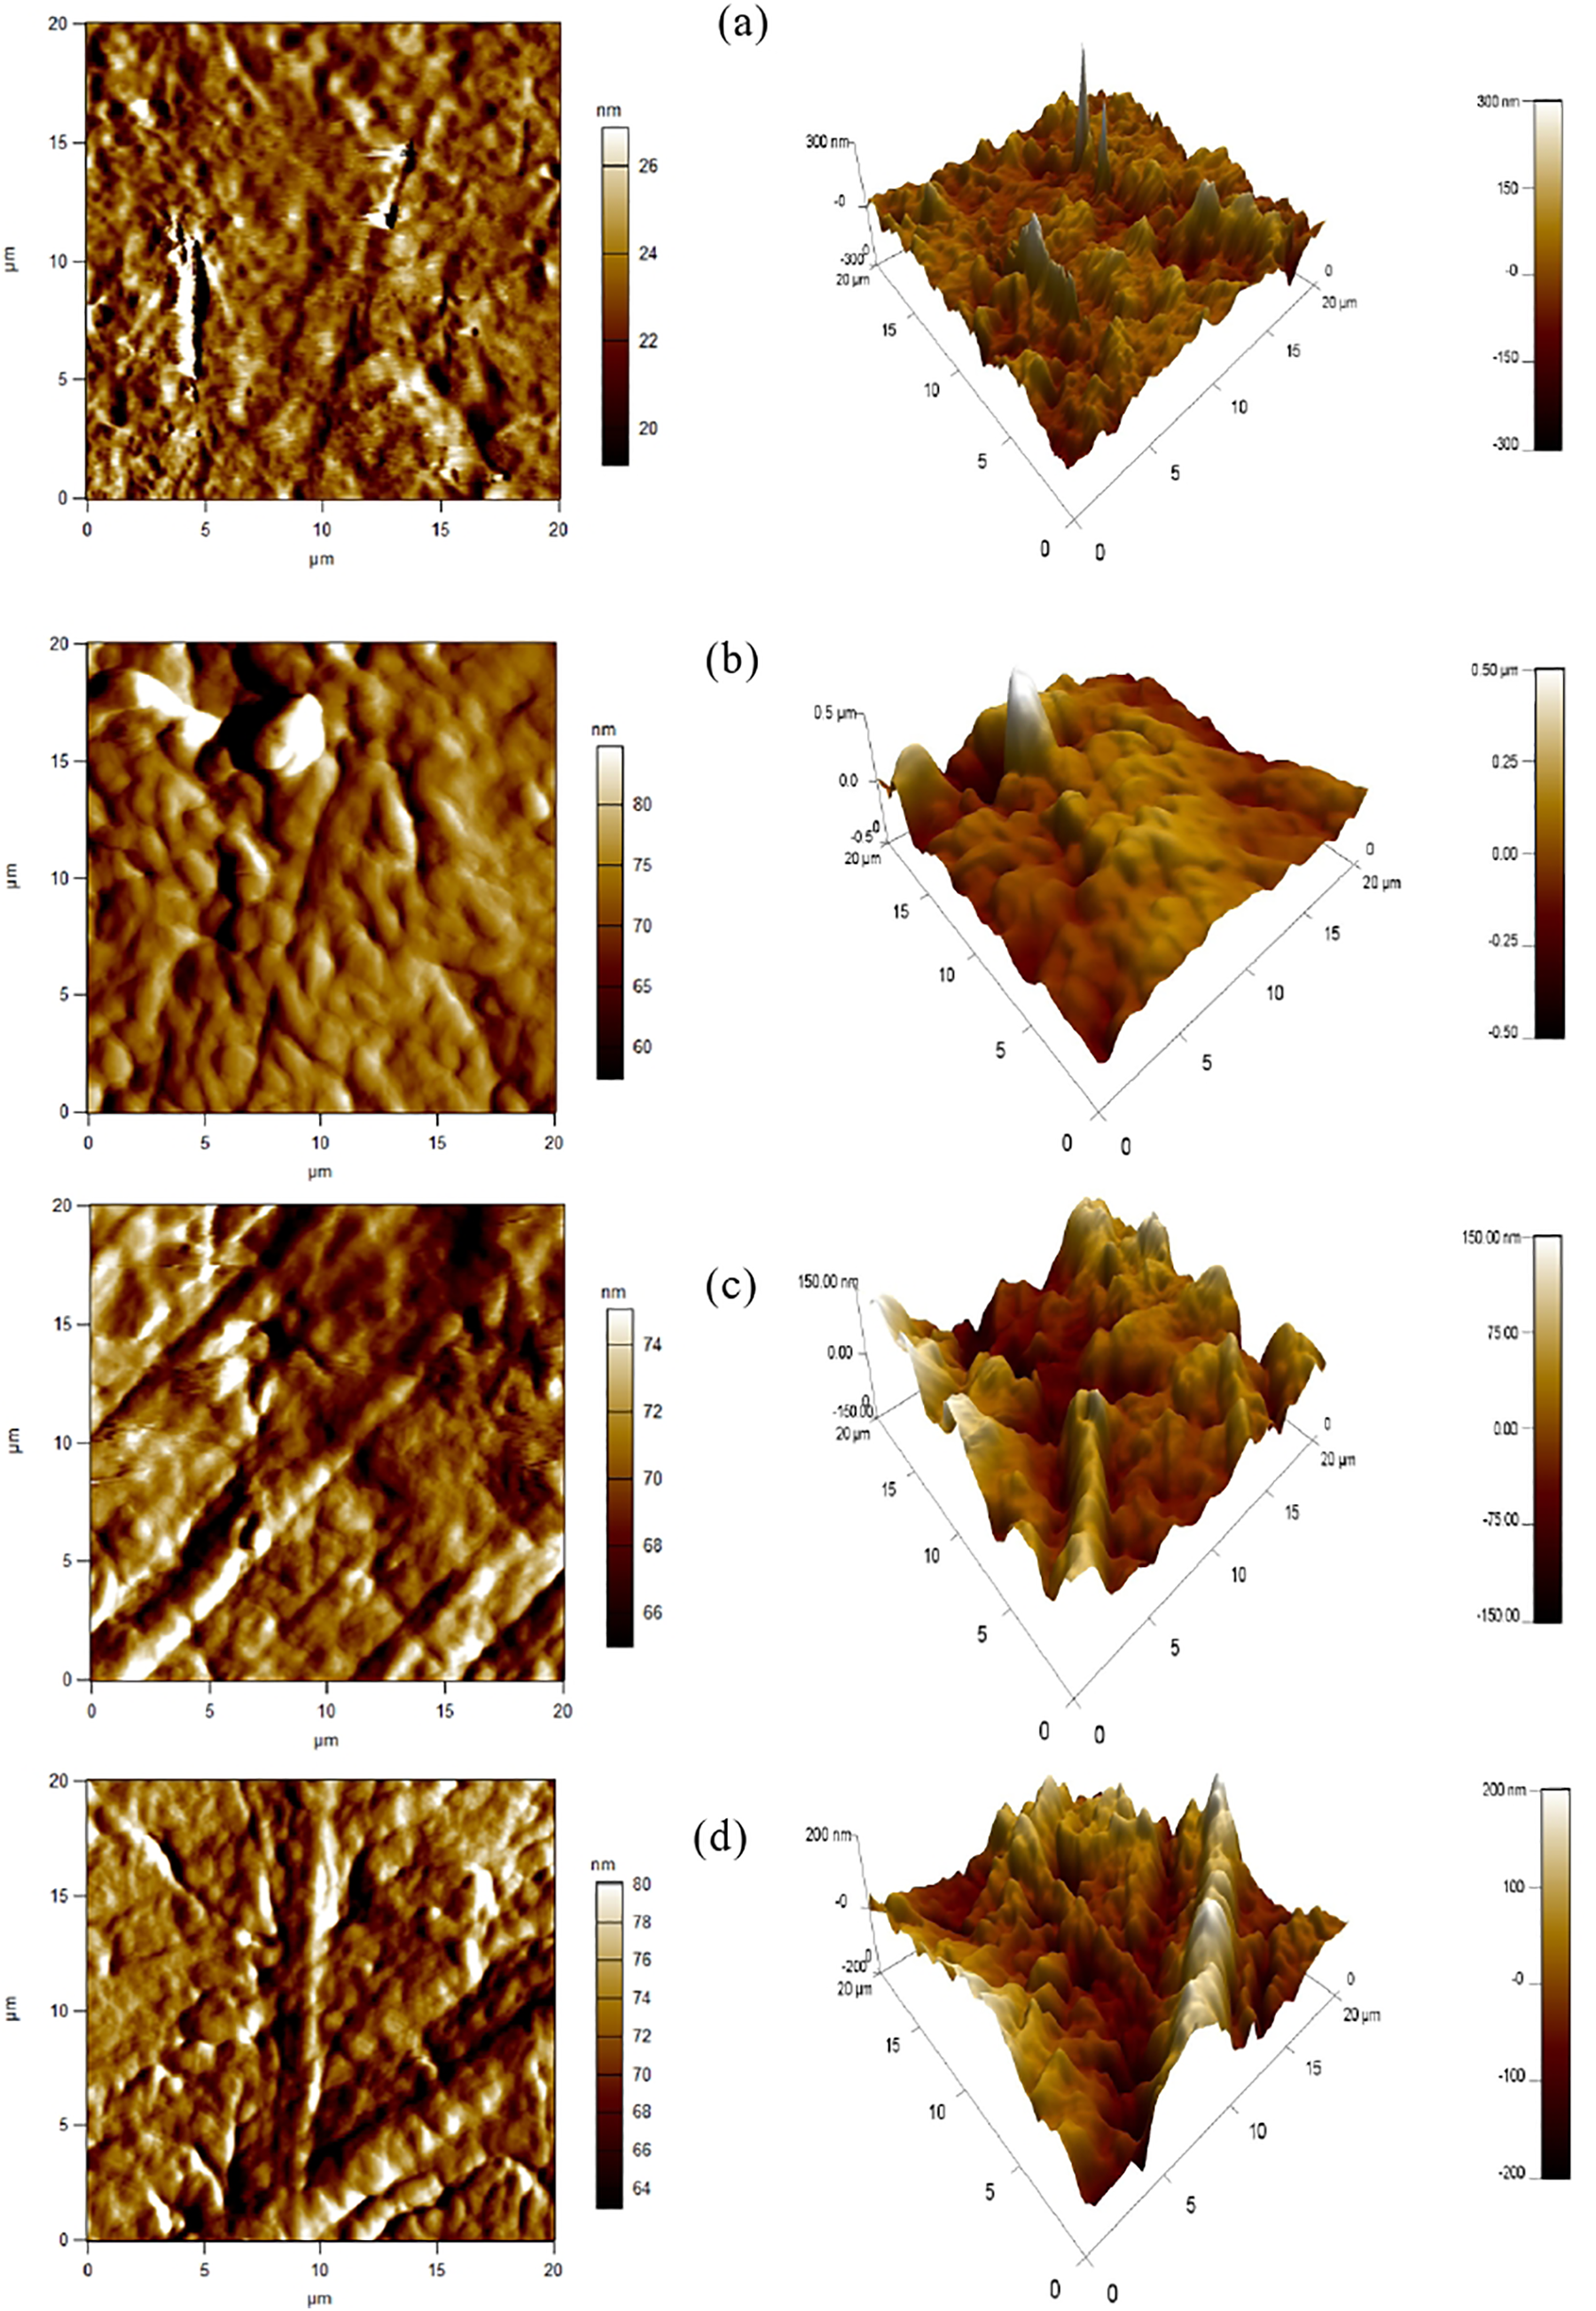
AFM Images of (a) LDPE, (b) LDPE/TPS, (c) LDPE/TPS/O-Mt and (d) LDPE/TPS/O-Mt/DCP.
Furthermore, the surface of the LDPE matrix appears rigorous and dense. Thus, it is worth noting that the presence of TPS in the LDPE caused a modification of the roughness. A refinement of the surface morphology can be observed in Figure 10(b). The addition of clay caused a decrease in coalescence between the two phases which can be located at the interface (Figure 10(c)). In Figure 10(d) and in the presence of DCP, the size of the domains decreases. The surface roughness data for all formulations are 405.8, 404.6, 401.7 and 400.7µm 2 for LDPE, LDPE/TPS, LDPE/TPS/O-Mt and LDPE/TPS/O-Mt/DCP respectively.
Conclusions
In this study, low-density polyethylene/thermoplastic starch (LDPE/TPS) composites containing nanoclay (O-Mt) were prepared by a melt blend process using a Brabender mixer. Dicumyl peroxide was used as a compatibilizer to balance the polarity between the surface of the nanofiller and the LDPE/TPS matrix to obtain a better dispersion of the nanofiller and improve its interaction with the polymer matrix. The various results allow to conclude that the content of nanoclay, TPS and DCP has a remarkable effect on the structural, mechanical and morphological properties of the prepared nanocomposites. The observation by XRD analysis shows partially intercalated and well dispersed nanoclays in the blend. Due to the improved interfacial adhesion, the crystallinity of the materials was improved, as demonstrated by DSC analysis. The thermal stability of the materials was improved by the addition of dicumyl peroxide (DCP) to the blend. The mechanical properties of the materials revealed an improvement in Young’s modulus and impact strength, reflecting the increased adhesion between the two phases of the blend. In the AFM, SEM studies, a change in morphology as well as surface roughness was noted. Thus, the use of starch, clay and DCP in the LDPE matrix can reduce costs and have an impact on the environment.
Footnotes
Declaration of conflicting interests
The author(s) declared no potential conflicts of interest with respect to the research, authorship, and/or publication of this article.
Funding
The author(s) received no financial support for the research, authorship, and/or publication of this article.