
Abstract
The objective of performing transmission electron microscopy (TEM) tomography (TEMT) on poly (lactic acid) (PLA)/clay samples is to characterize their 3D microstructure by obtaining the dispersion distribution and orientation of the dimensions of the clays. This information cannot be elucidated from a qualitative TEM analysis or from conventional characterization techniques such as X-ray diffraction. The nanocomposites are obtained by mixing PLA with Cloisite 20A and 30B at different extrusion shear rates which have been analyzed in 3D. Quantitative TEMT is performed to all the nanocomposites and the resulting 3D quantitative characterization (geometry of clay particles misalignment degree and distribution) is used for a more realistic comprehension of the mechanical behavior of the nanocomposites.
Keywords
Introduction
Poly (lactic acid) (PLA) is one of the most used biodegradable and biocompatible polymers, 1,2 but its range of application is still somewhat limited by several factors notably due to its low thermal stability and limited mechanical properties. To improve the properties, montmorillonite (organomodified) clays have been blended with the polymer. Mixing the polymer with clays at the nanoscale results in improved mechanical and functional properties with respect to the neat polymers or conventional composites 3 in those systems where there is an efficient interfacial interaction between matrices and organically modified layered silicates. 4 -13 These interactions are susceptible to the processing conditions.
The extent of clay platelet separation after integration with the (polymer) matrix (i.e. the degree of exfoliation) is a key parameter of the microstructure of laminar nanocomposites that has a significant effect on the final properties of the material. 12 Several techniques have been used to evaluate the clay disaggregation: transmission electron microscopy (TEM), X-ray diffraction (XRD), solid-state nuclear magnetic resonance, and atomic force microscopy. 14 -17 TEM is the only one of all these techniques that can provide a direct observation of the degree of exfoliation in the matrix. However, due to the projection nature of conventional (2D) bright-field (BF) TEM images, the orientation and dimensions of the clay objects cannot be directly and reliably measured (Figure 1). This limitation can be overcome by means of electron tomography (ET) which has the capability to render microstructural features in 3D at the nanometer scale. 18,19
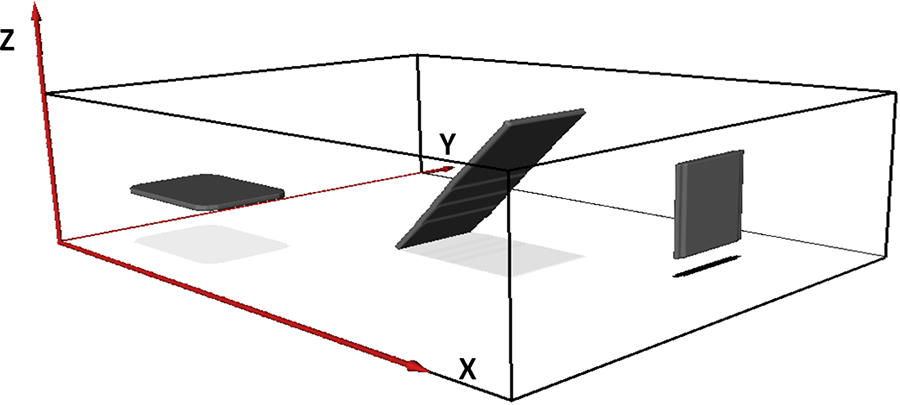
Changes in projected shape and contrast (gray level intensity) of laminar objects with different orientations.
The objective of performing quantitative TEM tomography (TEMT) on PLA/clay samples is to characterize their 3D microstructure. The dimensions, distribution, and orientation of the clays will be obtained. Such a quantitative 3D characterization will offer a better understanding of the mechanical behavior of PLA/clay nanocomposites.
The accuracy of quantitative ET depends among other factors on the segmentation of the objects. 20 -23 The most popular options are based on the threshold and watershed methods, but there are also other approaches based on advanced computation. 10 Despite the existence of all these possibilities, to date none of them stands out as a generally applied segmentation method. Actually manual segmentation still remains as the prevalent method of choice. In this regard, a simple efficient and objective methodology to perform the segmentation that was previously reported 24,25 will be applied herein. An objective procedure is of great importance when the aim of the 3D quantification is to compare microstructures of different materials.
To date several ET studies of clay-based nanocomposites have been published based on epoxy/clay latex/clay PBSA/clay, or EVA/clay 26 -29 . However, only Nawani et al. 29 showed an EVA/clay segmented 3D volume and none of them have used a quantitative characterization for the explanation of the properties of the material. The aim and novelty of the current work is to perform and show in detail a 3D TEMT quantitative analysis of PLA/Cloisite 30B and PLA/Cloisite 20A nanocomposites and to use the microstructural parameters to understand the relationship between the processing conditions and the final elastic modulus.
Experimental section
Materials
NatureWorks® LLC polymer grade 3051D PLA—provided by Cargill Dow (Barcelona, Spain)—was used for the samples. The material was received in pellets having a melt flow index of 9 g/10 min (190°C and 2.16 kg). Organically treated montmorillonite Cloisite 30B and Cloisite 20A from Southern Clay Products (Gonzales, Texas, USA) was used as reinforcement.
The PLA/5wt% clay samples were prepared in a Brabender Plasticorder DSE 20/40D corotating twin-screw extruder at 190°C and three different extrusion speeds: 120, 300 and 650 r min−1. Before processing, PLA was dried for 4 h at 80°C and the clay for 12 h at 80°C. The samples were also predried for an injection molding for 4 h at 80°C and A-type specimens were injection molded according to ISO 527 in a Sandretto OTTO 150 Tn injection molding machine. 30 Neat PLA was also processed at the same conditions as reference. The optimization of the processing was carried out in previous research work performed by the author. 30 The clay 5 wt% was selected according to the optimum reinforcing effect regarding the elastic modulus and the thermal stability of the composites. Besides the wt% optimizing the exfoliation degree also plays a key role in the optimization of the final properties. For this purpose, the effect of extrusion speed (shear forces) is studied from low to medium and up to high.
3D characterization: Quantitative tomography
A Leica (SGiker, University of the Basque Country) Ultracut UCT cryo-ultramicrotome stage was used to cut 130-nm-thick slices from the middle and inner area of the A-type injection-molded samples (Figure 2) of each nanocomposite. 25

Graphical view of the TEM sample preparation.25TEM: transmission electron microscopy.
The experimental tilt series was acquired in BF-TEM mode using a Zeiss (SGiker, University of the Basque Country) EM 912 Omega microscope operated at 120 kV. BF-TEM images were acquired at every 2° in the angular range of ±70°. In this work, all the tomographic reconstructions were performed using the simultaneous iterative reconstruction technique available in commercial and free software packages. A threshold-based segmentation was carried out following the methodology previously reported in the literature. 25 The quantified microstructural parameters are described in Table 1 and Figure 3 and were calculated using Fiji free software. 31
Parameters measured from ET.
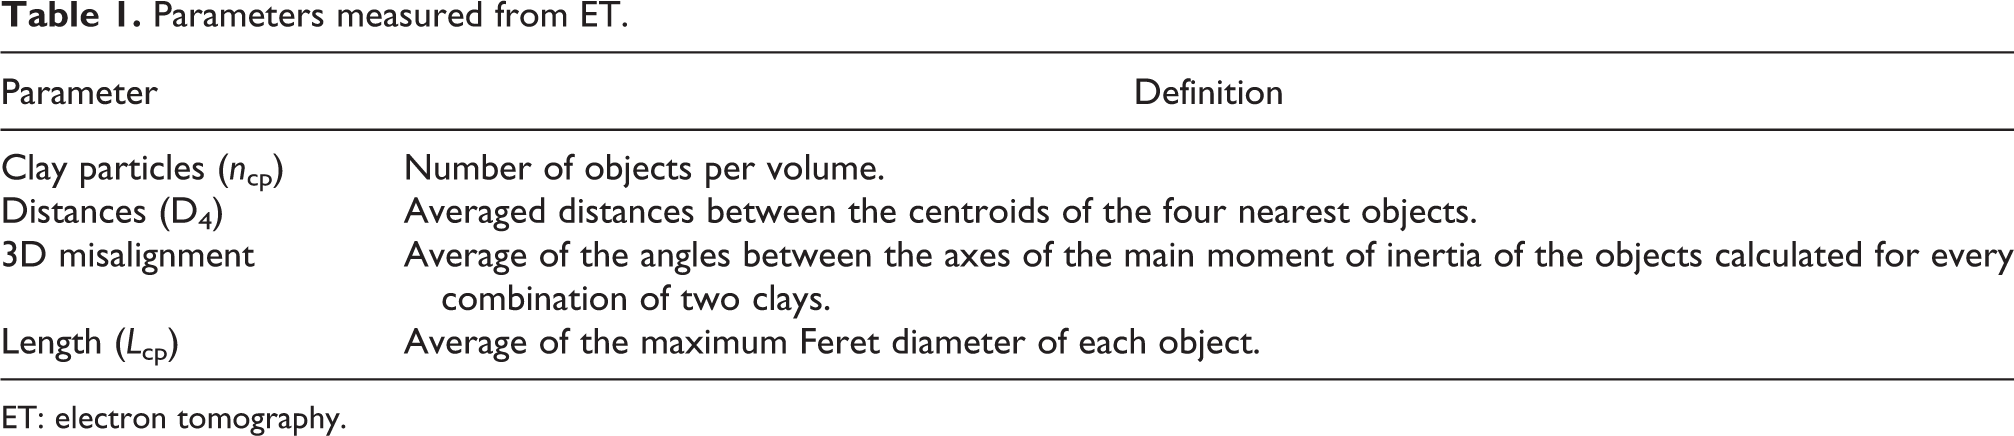
ET: electron tomography.
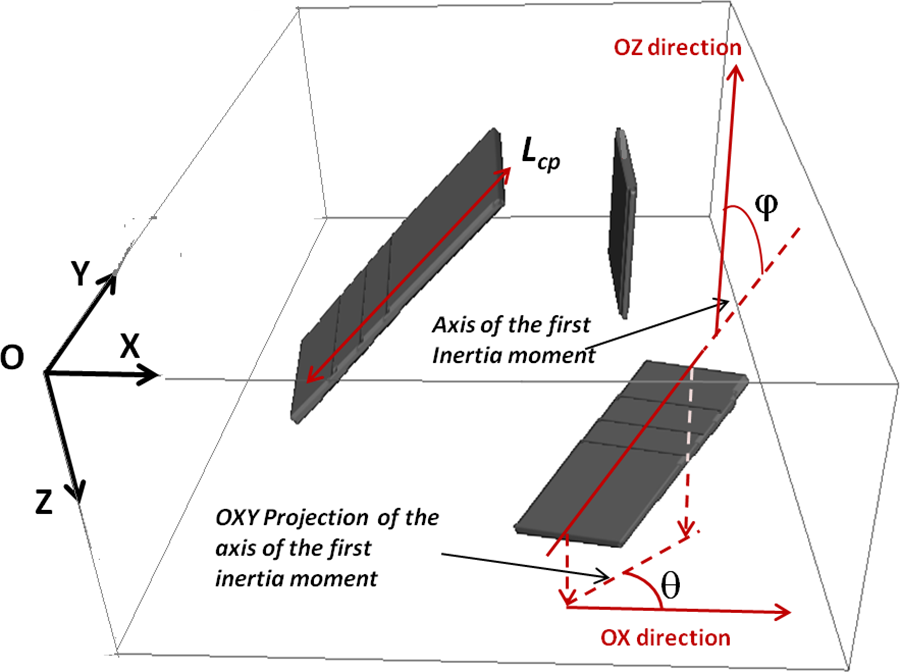
Graphical view of the quantification of the microstructure.
Mechanical properties
The elastic modulus (E) was measured in a conventional mechanical testing machine Hounsfield H25K5 using clip-on strain gages with initial distance of 1 cm. The measurement was performed at a speed of 10 mm min−1. Ten specimens were tested for each material.
X-Ray diffraction
The X-ray spectra were acquired in a Bruker (SGiker, University of the Basque Country) D8 Advance Vårio system using copper Kα radiation. The data were collected between 1° and 10° 2θ angles using a SoIX detector. Using Bragg’s law, the basal spacing of the layer stacks—d001—was determined from the position of the main reflection and from its full width at half maximum, the coherent domain size—D001—was derived using Scherrer’s equation. The shape factor used for Scherrer’s equation was 0.9, and the instrument-induced broadening of the reflections was estimated to be 0.1°. 30
Results and discussion
Tomography of PLA/clay nanocomposites
The 3D TEM-reconstructed volumes for the PLA/Cloisite 30B nanocomposites processed at different conditions are shown in Figure 4. In the reconstructed volumes, the darker pixels belong to the clay particles and the brighter ones to the background of the polymer.

3D reconstructed volumes (left) and their corresponding segmented volumes (right) for the nanocomposites containing Cloisite 30B.
Prior to the quantification of the microstructural parameters described in Table 1, a segmentation where the clay particles are separated from the background is required. 25 A summary of the methodology used is the following:
Methodology for the optimization of the segmentation
The segmentation of the reconstructions was carried out using Amira and an in-house developed methodology. This methodology is based on the threshold segmentation and on a criterion derived from the variation of the dimensions of the segmented objects.
In short, the segmentation methodology consists of:
Selection of the range of gray levels that will be used as thresholds. Definition of a given number of evenly distributed grey level values within the dynamic range selected in the previous step. Segmentation for each threshold selected in the previous step. Projection of the segmented volumes onto the OXY plane. Measurement of the variation in the dimensions of the objects as a function of the threshold value by means of the cross-correlation factor (R) computed for the 0° tilt projections of the objects resulting from consecutive thresholds. Selection of the best segmentation threshold for which the correlation between the corresponding 0° tilt projection and the adjacent ones is the highest.
The methodology was initially developed using a fictitious volume containing three laminar objects in different positions and with different orientations as shown in Figure 1. The validation of the methodology was done simply by comparing the volume of the original objects to the segmented ones.
Here we present an extra degree of validation for the segmentation of the fictitious objects by using morphological parameters other than the volume and thus less affected by the elongation effect inherent to the ET technique. Thus, several morphological parameters were measured for the original objects as well as for the optimally segmented ones and then compared. The selected parameters were the following: length (Lcp) and thickness (dcp) of the objects (measured as the minimum and maximum Feret diameters) and their orientation. The orientation was defined by the θ (angle between the projection of the first inertia axis on the OXY plane and the OX axis) and ϕ (angle between the direction of the first inertia axis and the OZ axis) angles described in Table 2. The three platelets are identified as “v” for the one vertically oriented, “h” for the horizontally oriented one, and “d” for the diagonally oriented one. dcp: thickness, Lcp: length, θ: angle between the projection of the first inertia axis on the OXY plane and the OX axis, and φ: angle between the direction of the first inertia axis and the OZ axis.
Parameters quantified for each of the original fictitious objects and the reconstructed and segmented ones.
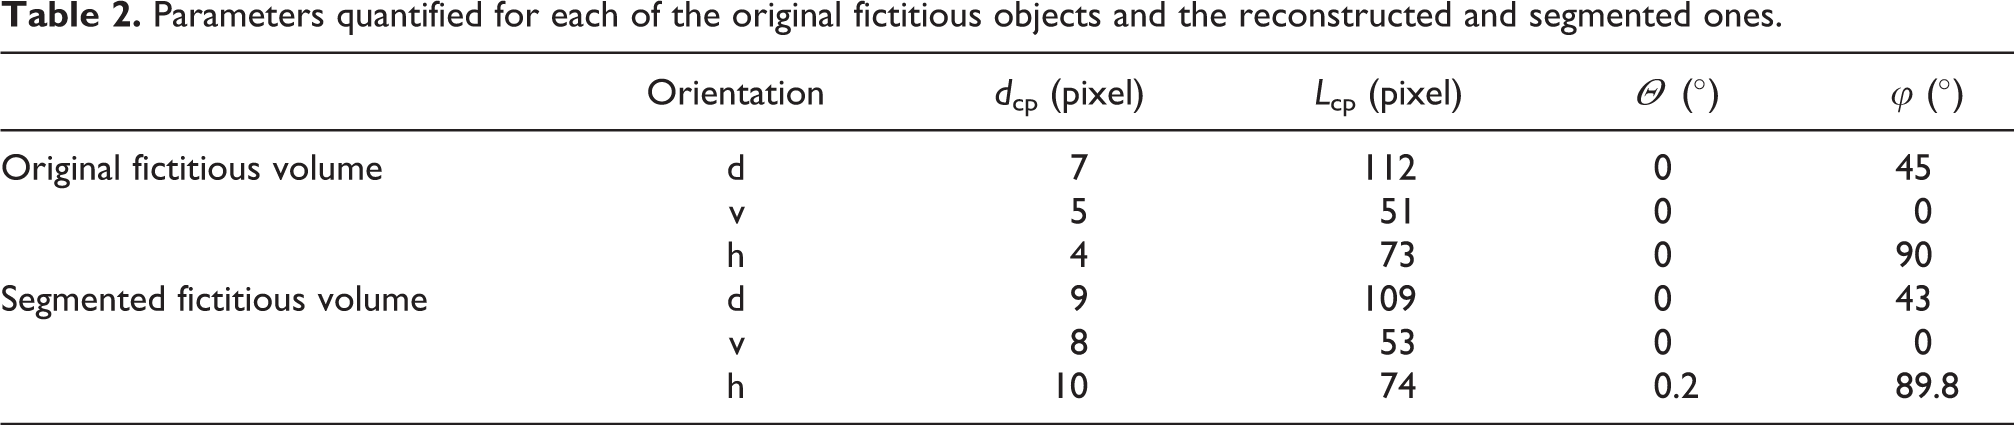
Overall, the agreement between the measurements for the original objects and the reconstructed and segmented ones was high as confirmed by the measurements (Table 2) and the corresponding low error values in Table 3. The main discrepancies arose for those magnitudes that are influenced by the elongation along the OZ axis due to the missing wedge effect. As expected, the thickness values have the largest discrepancy which is of fortune because there is a complementary technique X-ray diffraction for the quantification of this parameter.
Error (%) in the quantified parameters for the segmented objects.

XRD should be used for the quantification of the thickness for instance to calculate shape factors, however for the quantification of the rest of microstructural parameters XRD is not suitable. For this purpose, ET has been proved to be successful.
The results obtained for nanocomposites containing Cloisite 30B from this process are shown above in Figure 3. The microstructures of the nanocomposites containing Cloisite 20A can be observed in Figure 5.

3D reconstructed and segmented volumes for the nanocomposites containing Cloisite 20A.
The comparison between both types of nanocomposites is shown in Figure 6.
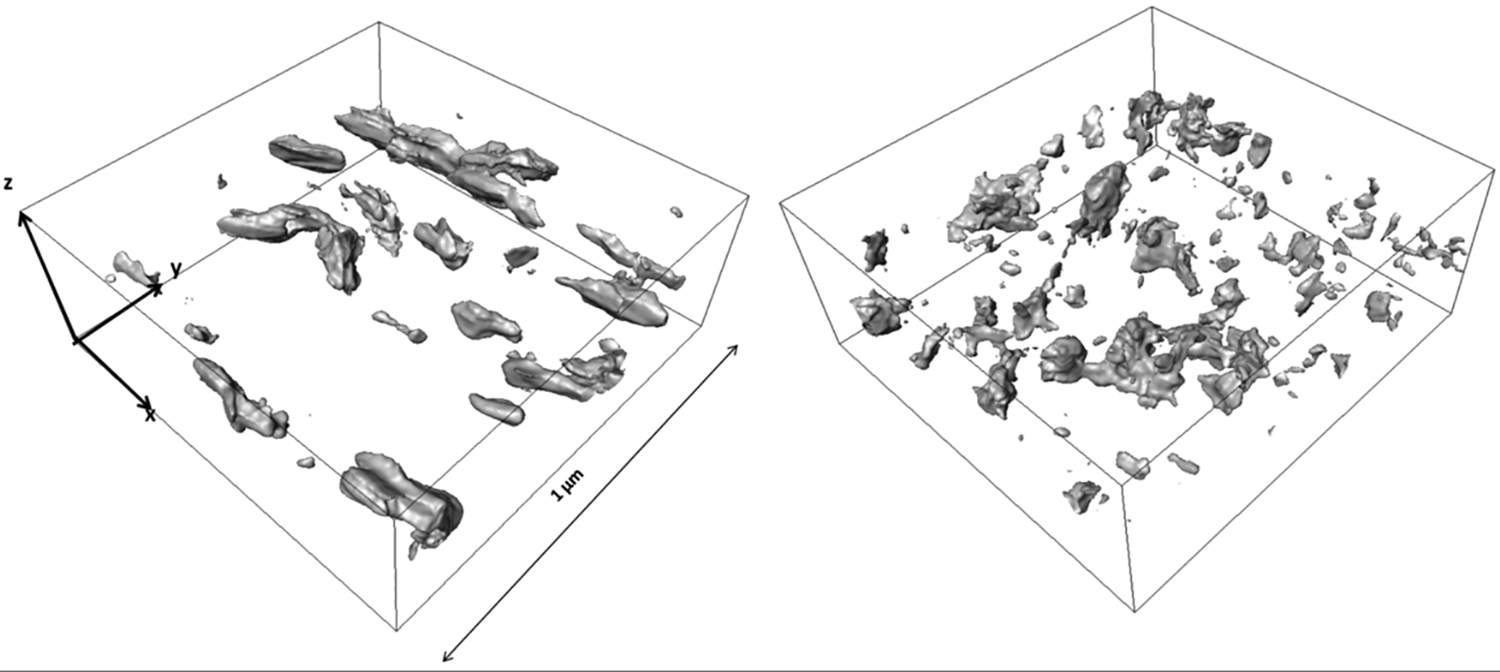
3D reconstructed segmented volumes for the PLA/20A nanocomposite (left) and PLA/30B nanocomposite (right) processed at 300 r min−1. PLA: poly (lactic acid).
Qualitatively both type of nanocomposites are different. Cloisite 20A clay particles are larger than Cloisite 30B, and the particle density is higher for the nanocomposites containing Cloisite 30B clay particles. As a consequence, their behavior should also be different. For a better and quantitative comprehension of the mechanical behavior, a quantitative microstructural analysis is carried out.
Quantification of the microstructure
For a more detailed analysis, microstructural parameters are quantified and the results are summarized in the following Tables 4 and 5. An extreme dispersion of the Lcp value is noted. This parameter is measured as the maximum Ferets of each clay particle, respectively. Taking into account the nanoflake morphology of the particles, it is clear that the measurements cannot be 100% precise. Indeed, the Feret values will vary as a function of the dimensions and the morphology of the particle. This dependence on the shape explains at least partially the high dispersion of the quantified parameters.
Results obtained from the quantification of nanocomposites containing Cloisite 30B.

PLA: poly (lactic acid).
Results obtained from the quantification of nanocomposites containing Cloisite 20A.
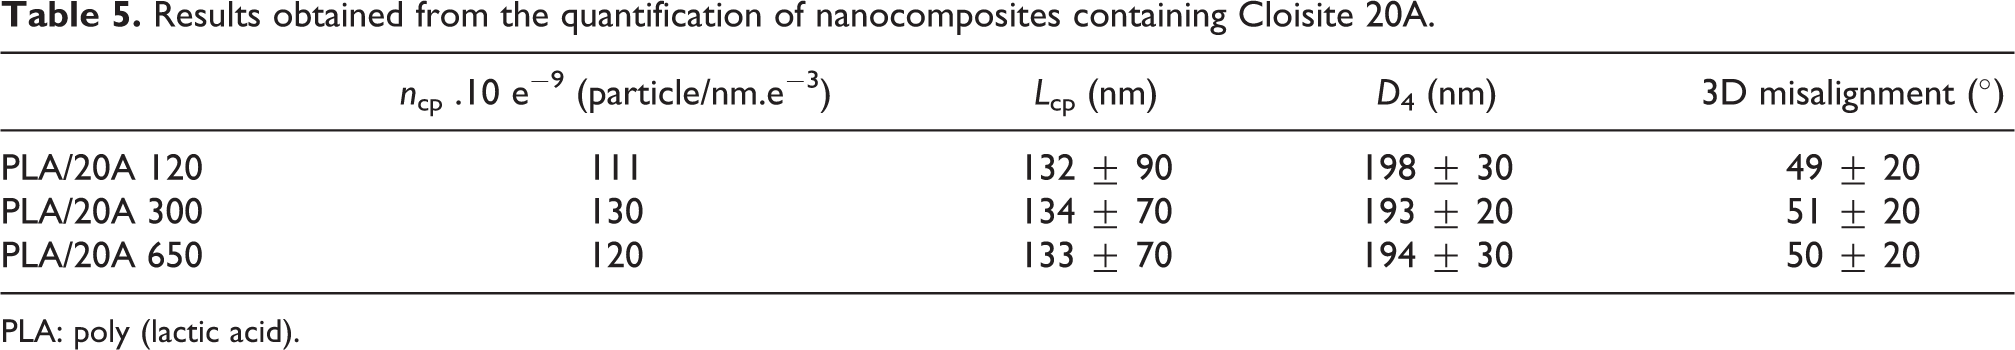
PLA: poly (lactic acid).
The 3D analysis made for the nanocomposites containing Cloisite 30B shows that the number of clay particles tends to increase with increasing extrusion speed. This increase in the number of particles can be attributed to the disaggregation of the clay sheets or to the fracture of the silicate layers.
The evolution of the length and the thicknesses from XRD results (Table 6) for the nanocomposites follow the inverse of trend described for the ncp. The trend of the distances is inverse to that of the number of clay particles. Since the amount of clays is the same in all the samples the D4 value is an indicator of the dispersion. Therefore, an optimum in the dispersion is detected for the nanocomposite processed at 300 r min−1. The misalignment degree increases when the extrusion speed is increased from 120 r min−1 to 300 r min−1; however, for a further increase in the extrusion speed it remains almost constant.
Results obtained from X-ray data.

PLA: poly (lactic acid).
The characterization made for the nanocomposites containing Cloisite 20A indicates that there is no significant variation in the measured microstructural parameters length thickness distances and misalignment degree. However, the number of clay particles slightly varies with the extrusion speed. This parameters reach a maximum at 300 r min−1 and then decreases again. For the nanocomposites containing Cloisite 20A, an extrusion speed of 650 r min−1 is not as dramatic as it is for the nanocomposites containing Cloisite 30B. This fact could be attributed to a lubricant effect caused by the Cloisite 20A clay particles. 30
The disaggregation/exfoliation degree cannot be assessed by TEMT, therefore besides XRD results are shown above conventional TEM micrographs in Figure 7.

TEM micrographs acquired at low (×66 k) and high (×230 k) magnifications for the PLA/30B and PLA/20A nanocomposites. PLA: poly (lactic acid).
Despite having very similar original dimensions, the TEM images confirm that the Cloisite 30B clays are dispersed better than the Cloisite 20A ones. The higher affinity of the organomodification of the Cloisite 30B clays with the PLA is the cause for that difference. Moreover, by analyzing the TEM micrographs acquired at high magnifications, it is clear that the PLA/30B nanocomposites have less platelets per stack (with most of the stacks containing around 2–3 silicate layers), whereas PLA/20A nanocomposites are formed by thicker stacks (containing around four silicate layers) forming a predominant intercalated microstructure. In addition, in the case of the PLA/30B nanocomposites exfoliated clay platelets are also visible as pointed out with arrows in Figure 7.
Processing-microstructure–elastic modulus
The results obtained for the elastic modulus are summarized in Table 7.
Results obtained from the characterization of the elastic modulus.
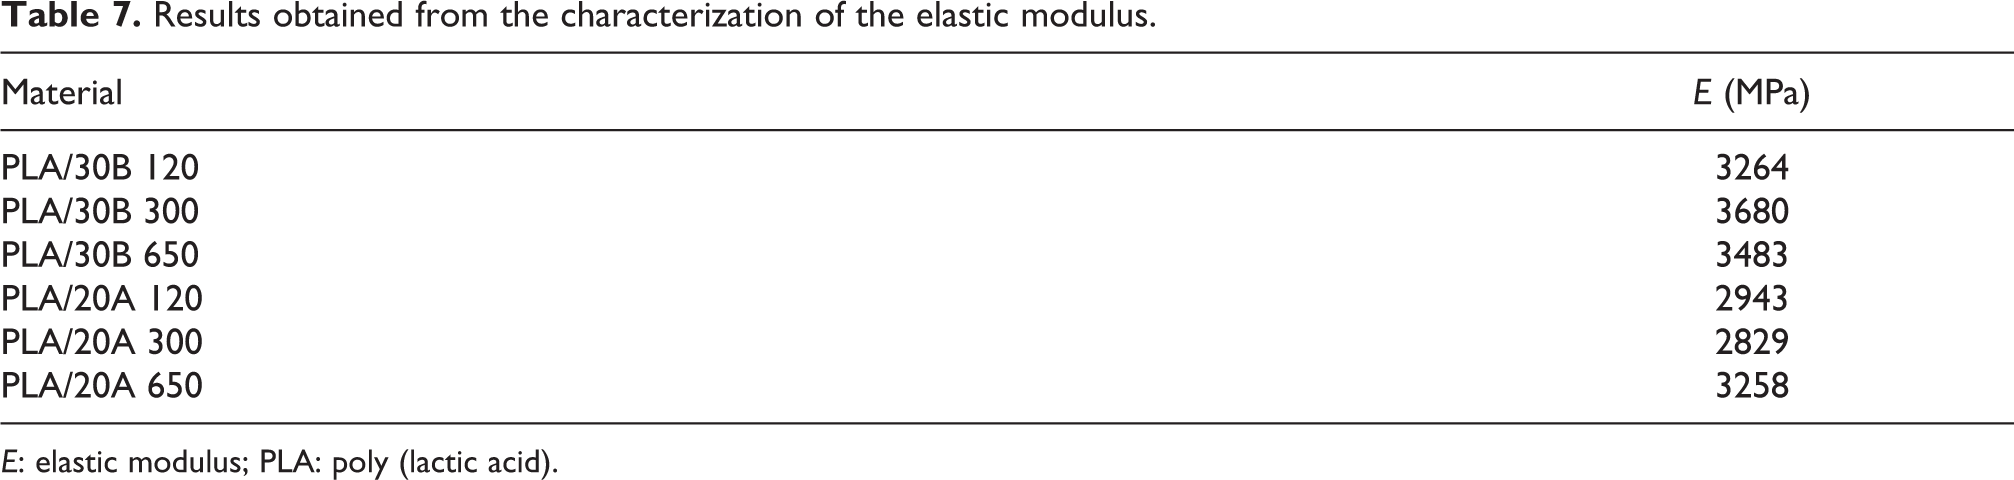
E: elastic modulus; PLA: poly (lactic acid).
The modulus of the PLA 2700 MPa does not vary with the processing conditions. By extruding PLA with Cloisite 30B clay particles at 120 r min−1, an increment of the modulus of 24% is achieved. By increasing the extrusion speed up to 300 r min−1, the modulus is improved in at 40%. Conversely another additional increment in the extrusion speed (650 r min−1) only induces an increment of 24%. Comparing the modulus of the nanocomposites containing Cloisite 20A to that of the neat PLA, it is noticed that although the modulus is enhanced, the enhancement is small: 12% when processed at 120 r min−1, 8% at 300 r min−1, and up to a 22% processing at 650 r min−1.
To understand the relationship between the processing conditions and the elastic modulus, the microstructural parameters are used. Comparing the PLA/20A and PLA/30B nanocomposites it can be stated that larger amount of clay particles is found for PLA/30B nanocomposites. However, length and thickness values are larger for PLA/20A nanocomposites, whereas the distribution and misalignment degree could be considered similar. Therefore, a better disaggregation of Cloisite 30B clay particles is achieved compared to Cloisite 20A. As a consequence, the elastic modulus of PLA/30B nanocomposites is higher than those of PLA/20A.
In the following, the behavior of the nanocomposites containing Cloisite 30B will be explained. The ncp parameter indicates a larger amount of present clay particles as the extrusion speed increases. This fact can be attributed on the one hand to a better exfoliation degree or on the other hand to a breakage of the clay particles. dcp and Lcp parameters are helpful to uncover the relationship. The larger the Lcp and lower the dcp, the higher the exfoliation degree and thus the more effective reinforcing effect is expected and therefore an optimum improvement of the elastic modulus. In this regard, the nanocomposite extruded at 120 r min−1 has the highest Lcp and thickness values which indicates a low exfoliation degree. As the extrusion speed increases, the dcp decreases and so does the Lcp. This fact indicates a partial breakage of the clay particles as well as a higher exfoliation degree. However, by increasing the extrusion speed up to 650 r min−1, the dcp remains constant while the Lcp keeps on decreasing which points toward an additional breakage of the clay particles instead of an improvement in the exfoliation degree which turns into an ineffective reinforcing effect of the clay particles.
Overall, the microstructure explains the successful enhancement of the modulus obtained using Cloisite 30B clays compared to that of Cloisite 20A.
Conclusions
TEMT has been successfully applied to bio-based polymer nanocomposites and has been proved to be an effective tool for the 3D characterization of the microstructure. From the 3D characterization, relevant microstructure describers (ncp, Lcp, D4, and misalignment) have been computed and used to clarify the behavior of the reinforcing clay particles during the transformation process. Finally, from the characterization and the posterior analysis of the data it has been concluded that the best compromise between the processing condition—exfoliation degree and breakage of the particles must be found to obtain an optimum nanocomposite with the best final properties. For this purpose, microstructural describers such as the Lcp, D4, and ncp have proved to be helpful.
Footnotes
Acknowledgements
Maider Iturrondobeitia would like to thank the Basque Government for the scholarship Ikertzaileak prestatzeko eta hobetzeko languntzak. The research leading to these results has received funding from the European Union Seventh Framework Programme under Grant Agreement 312483–ESTEEM2 (Integrated Infrastructure Initiative–I3) also from the Basque Government (GV-IT-303-10 and S-PE11UN047) and Biscay Regional Government (DFV 6-12-TK-2010-25) Leartiker for their support in the preparation of the samples and the thermal characterization experiments.
Declaration of conflicting interests
The author(s) declared no potential conflicts of interest with respect to the research, authorship, and/or publication of this article.
Funding
The author(s) received no financial support for the research, authorship, and/or publication of this article.