
Abstract
The aim of this study was to (1) fabricate polymethyl methacrylate (PMMA) nanocomposites having better mechanical strength, (2) investigate the effects of nanobarium titanate (NBT) loadings (1–9 wt%) on tensile and flexural properties, and (3) evaluate surface roughness and hardness of the PMMA nanocomposites. The NBT was treated using a titanate coupling agent. Density, polymerization shrinkage (PS), surface roughness, and hardness were investigated. Tensile and flexural properties of PMMA nanocomposites were also evaluated. The roughness values of PMMA nanocomposites were significantly lower than those values proposed as a reference for clinical use (<200 nm). Moreover, the flexural modulus of the NBT/PMMA nanocomposites increased with increasing filler loadings. A remarkable increase in the tensile modulus values of filled PMMA was also observed (p < 0.001). In the case of higher filler content, tensile modulus remains unaffected by filler incorporation. The tensile and flexural strength improved with increasing concentration of NBT up to 5 wt% and then decreased by an additional amount of NBT introduced into the nanocomposite resin. However, the tensile and flexural strength values of NBT/PMMA nanocomposites were higher than the PMMA matrix (p < 0.001). Such enhancements obtained with titanate-treated NBT could lead to the promotion of the dental composites’ longevity.
Keywords
Introduction
Polymethyl methacrylate (PMMA) resins are the most frequently used material in denture fabrication because of their desirable characteristics such as ease of processing and repair, chemical stability, durability, moderate cost, lightweight, color matching, and biocompatibility. 1 Nevertheless, this material cannot meet the mechanical requirements of prostheses and exhibits low flexural strength, insufficient surface hardness, and poor wear resistance. Additionally, PMMA does not have optimum physical properties of polymerization shrinkage (PS) and water absorption. 2 Numerous studies 1,3 -5 have been conducted to impregnate different fillers into the PMMA matrix; nevertheless, the required balance of biomechanics, mechanical properties, and aesthetics has not been attained, 4,6,7 which leaves opportunities for further improvement. 8
Fracture of the denture base materials constitutes a challenge and remains an unresolved problem. Most denture breakages occur inside the mouth during function, primarily because of flexural failure. 9 The denture base resin is subjected to various stresses during function; these include compressive, tensile, and shear stresses. Some of the factors responsible for denture fracture include stress intensification, increased ridge resorption leading to an unsupported denture base, deep incisal notching at the labial frena, sharp changes at the contours of the denture base, deep scratches, and induced processing stresses. Three-point bend test more closely simulated the type of stress that is applied to the prosthesis during mastication. 10 Therefore, the flexural strength of denture base materials is widely evaluated by this test. Surface hardness is another crucial property of restorative materials. This property enables the use of these materials in manufacturing denture bases that resist forces, such as those arising from occlusion and mechanical denture cleansing, thereby increasing the longevity of dental prostheses. Material hardness correlates well to compressive strength, abrasion resistance, and degree of conversion. Low hardness values are usually linked to poor wear resistance and susceptibility to scratching, which can compromise fatigue strength and lead to restoration failures. 2
The introduction of nanomaterials offers a new promise for augmenting the mechanical properties of dental composites because the high surface area-to-volume ratio of these materials enhances their interfacial interaction with the resin matrix. The properties of polymer nanocomposites depend on the type of incorporated nanoparticles; their size, shape, and distribution; as well as the concentration and interaction with the polymer matrix. 11 When inorganic nanoparticles function as fillers in polymer materials, the superior characteristics of both polymer materials and nanomaterials integrate to enhance rigidity, hardness, fracture toughness, and other functional properties of the composites. 9 However, nanoparticle loading also may result in decreased mechanical properties. 12 Sodagar et at. 4 investigated the effect of silver nanoparticles (AgNps) on the flexural strength of PMMA. They inferred that the degree of nanoparticles’ dispersion in the PMMA matrix is affected by the chemical composition of acrylic resin. At low concentration, particle dispersion and chemical interactions between PMMA and AgNps are low, which result in flexural strength reduction. In addition, AgNps could act as impurities, which usually decrease the mechanical strength. Along with the increase in nanofiller loadings, the more chemical interaction between the C=O groups and the silver overcomes the negative effects, leading to the flexural strength improvement.
Nanofillers such as silicon dioxide, zirconium dioxide (ZrO2), titanium dioxide (TiO2), and aluminum oxide have been commonly used in dental composites 1,5,12,13 and interfacial silane reformulation. 11 Other attempts have been carried out to introduce new fillers for enhancing the properties of the dental polymer composites. Qian et al. 9 evaluated the effect of nanocalcium silicate (CaSiO3) on the flexural strength of PMMA. They concluded that the flexural strength of CaSiO3/PMMA nanocomposites increased when the amount of CaSiO3 nanoparticles was increased from 0.5% to 1.5%. Another work 14 was performed to investigate the mechanical properties of PMMA/graphene nanocomposites. The results showed that the addition of 2.7 vol% graphene nanoparticles improved fracture toughness of PMMA by 79.2%. Incorporation of organoclay into PMMA denture base resins was also examined, and increment flexural strength, flexural modulus, and fracture toughness in comparison to the neat matrix were found. 8
Nanobarium titanate (NBT), as a class of ceramic systems, displays interesting features for biological applications because of its favorable mechanical properties. 15 In the current study, NBT is introduced as a new dental filler. NBT was treated by titanate coupling agent (TCA) to improve the dispersion stability of nanoparticles. Surface chemical modification of nanoparticles plays a very important role to reduce the agglomeration. 3 The biocompatibility of TCAs and NBT has been reported; 16,17 however, the applications of such materials in dentistry are still limited. This topic, particularly in relation to denture base composites, has yet to be included in the dental literature. Therefore, this study aimed to (1) fabricate NBT/PMMA nanocomposites having better mechanical strength, (2) investigate the effects of NBT loadings on tensile and flexural properties, and (3) evaluate surface roughness and hardness of the PMMA nanocomposites.
Materials and methods
Materials
The solid components consisted of PMMA (molecular weight: 996,000 GPC) and 0.5 wt% benzoyl peroxide (BPO). The liquid component comprised methyl methacrylate (MMA) stabilized with 0.0025% hydroquinone plus the crosslinking agent 10 wt% ethylene glycol dimethacrylate (EGDMA). NBT supplied in powder form constituted the filler. These materials were purchased from Sigma–Aldrich (Missouri, USA). The TCA or isopropyl tri[di(octyl) phosphato] titanate (KR12) (Figure 1) was supplied by Kenrich Petrochemicals (Bayonne, New Jersey, USA).
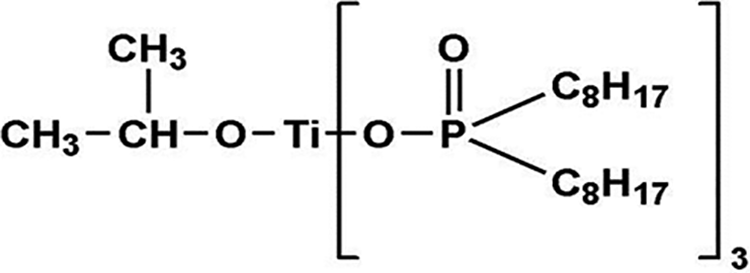
Chemical formula of TCA or isopropyl tri[di(octyl) phosphato] titanate.
Titanate treatment of NBT
Five grams of NBT were added to 100 mL of acetone, followed by TCA under stirring for 15 min. The mixture was maintained under sonication for 20 min at room temperature for deagglomeration. The slurry was stirred for 30 min and then the temperature of the mixture was increased up to 80°C to remove the solvent. Finally, the modified NBT was dried for 24 h in a vacuum oven at 120°C. NBT was characterized before and after treating as detailed elsewhere. 3
Sample preparation
Table 1 lists the different formulations used to prepare the samples (n = 6, for each group). Various ratios (1, 3, 5, 7, and 9 wt%) of the treated filler were used. Control samples comprised of pure PMMA. Modified NBT was added to the liquid part (MMA monomer and 10% EGDMA) under continuous stirring to realize complete wetting of the filler surface and then sonicated for 20 min. The mixture was transferred to a stirrer before the solid components (PMMA and 0.5% BPO) were added and mixed by hand. The powder/liquid solution in a 2.5:1 ratio (by weight) was mixed until the dough stage was reached. The mixture was kneaded and packed into the prepared molds. Trial closure was performed at low pressure, and excess materials were removed. The molds were clamped and pressed under 14 MPa at room temperature for 25 min to allow proper penetration of the monomer into the polymer, even flow of the material, and outward flow of the excess material. The molds were immersed in a thermostatically controlled water bath at room temperature. The temperature was slowly raised to 75 ± 1°C for 90 min and then elevated to boiling point for 30 min. The molds were allowed to bench cool before opening. The cured samples were carefully removed from the molds, the excess flush was eliminated, and the specimens were polished with fine sandpaper. The adopted procedures are consistent with the prescribed standard method for preparing a conventional denture base in the dental laboratory. 6
Nanocomposite formulations used in this study.

PMMA: polymethyl methacrylate; NBT: nanobarium titanate; EGDMA: ethylene glycol dimethacrylate; MMA: methyl methacrylate; BPO: benzoyl peroxide.
Weight and volume fraction determination
As some filler might be lost during processing, a polymer burn-off test or “ashing” was done to determine the final weight fraction of the filler in the composite. Dumbbells were randomly selected, and burnt-off in the furnace at a temperature of 600°C. The filler residue was weighed and the corresponding weight fraction of the filler, W f, was converted to the volume fraction of the filler, V f. The following equation was used in the procedure:

whereby ρ c and ρ f are the density of the composite and the filler, respectively.
Determination of composites density
The density of the test specimens was determined by water displacement method (method A) as described in our previous work. 18 A densitometer (model MS204S/01) was used to measure the weight of the samples in air and distilled water. The density of the specimens was calculated using the subsequent equation: 19

where W 1 and W 2 are sample weights in air and water, respectively. The density of NBT as quoted by manufacturers is 6080 kg/m3.
Polymerization shrinkage
PS was calculated from the densities measured in accordance with Archimedes’s principle. 18 Uncured specimens were removed from the mold and weighed in air and distilled water with an electronic balance accurate to ±0.0001 g. Afterward, the same procedures were repeated with heat-cured specimens in a water bath, and the density of each specimen before and after curing was calculated using equation (2). Finally, the PS of each specimen was calculated using the following formula: 20

where ρ uncured is the density of the uncured specimen (kg/m3), and ρ cured is the density of the cured specimen (kg/m3).
Surface roughness
All roughness measurements were obtained by atomic force microscopy (AFM) in contact mode (Nanosurf EasyScan2, AFM, Liestal, Switzerland) calibrated to 10 µm2 sample surface with a V-shaped silicon nitride probe with a tip height of 14 µm and a tip radius <10 nm at force constant of 0.2 N/m and the resonant frequency of 13 kHz. AFM has a probe attached to a flexible cantilever that allows the sample to be scanned with sub-nanometer precision. The tip scans over the sample surface and records interactions between the probe and the atoms of the sample surface. Measured topography data were processed by SPM Control Software V. 3.0.
Three surface roughness measurements were performed for each specimen before and after polishing using progressively finer grit grades (1200, 2400, and 4000) of silicon carbide paper, generating six measurements for each specimen. Following parameters were compared among specimens: average roughness (Ra) and maximum peak-to-valley distance (Rz). The roughness (Ra) is recorded in nanometers and can be visualized on the computers in real time.
Surface hardness test (VHN)
The hardness test was applied according to the International Standards Organization (ISO) Specification No.1567 and other earlier published studies. 18,21 A calibrated Vickers hardness Tester FV (Shimadzu DUH-W201S) was used to force a diamond indenter of 3 N for 15 s into the polished surface of the sample and to measure the diagonal length optically. The hardness test was performed on several samples for all formulations of composites, and the average of five readings at different points was obtained for each formulation of the composite’s samples.
Grinding started with the coarse paper capable of flattening the specimen and removing the effects of prior operations, such as sectioning. The next paper removed the effects of the prior paper within a short time. At the end of the grinding, the surface of the specimen should be flat with one set of unidirectional grinding scratches. The specimens were held by hand against an abrasive-charged rotating wheel and moved in an elliptical path around the wheel against the direction of rotation. Sequences of papers (800, 1200, 2400, and 4000) were used for grinding. The Vickers hardness number (VHN) was computed based on the following equation:

where P 1 is the load, N, and d 1 is the mean diagonal of indentation, µm.
The prediction of hardness was theoretically calculated via the rule of mixture (ROM) in equation (5), and the hardness improvements were computed by equation (6), as described by Abouelmagd, 22 via:

where subscripts c, m, and f refer to the composite, matrix, and filler, respectively; H stands for hardness, and V denotes volume fraction.

Tensile properties
Dumbbell-shaped tensile test specimen (Figure 2(a)) was obtained from mold plate with dimension as specified in ISO 1567. The tensile test was carried out using an INSTRON 5567 (Norwood, MA, USA) 10 kN electromechanical universal testing machine. The gauge length was set at 50 mm and a crosshead speed of 5 mm/min. At least five samples were tested for each formulation. Tensile strength, Young’s modulus, energy at the break, and tensile strain were recorded.

The types of the prepared samples used in the study: (a) tensile and (b) flexural samples.
Flexural properties
Three-point flexural tests were performed in accordance with the ISO 1567 standard. The support span is set at 50 mm, while the diameter of the loading nose and supports are 20 mm and 10 mm, respectively. Tests were conducted at a crosshead speed of 5 mm/min on the INSTRON 5567 10 k


where L denotes span length, P denotes maximum load, b is the specimen width, d is the specimen thickness, m is the tangent gradient of the initial straight line of load versus deflection curve.
Statistical analysis
Data of surface hardness, tensile, and flexural properties were statistically analyzed using analysis of variance at p < 0.05 significance level with SPSS (version 22, Statistical Package for Social Science, SPSS Inc., Chicago, Illinois, USA) to determine the differences between the groups.
Results and discussion
Determination of filler content by ashing
The exact filler content in the various formulations was determined by the weight of the leftover filler subsequent to the burning of the polymer component. The temperature was raised to reach 600°C for burning out the polymer phase. This temperature was maintained for 2 h before subsequent cooling to room temperature.
To determine the exact content, the filler was first cooled before weighing was done. Weight fraction (W f) and composite density (ρ c) were used to facilitate the calculation of volume fraction (V f) using equation (1). The results of these calculations are listed in Table 2. It can be noted the values of calculated V f were equal to the incorporated filler percentages into the PMMA matrix during the sample preparation, which means that there were no waste materials and the samples contained the exact amount of NBT. However, the dissimilarity between calculated data and used percentages of the incorporated filler would lead to misunderstanding of the results of the further investigations.
Filler content of various formulations.

PMMA: polymethyl methacrylate; NBT: nanobarium titanate.
Density of denture base nanocomposites
Density is an important physical property of dental composites. Table 3 presents the densities of pure PMMA and reinforced PMMA nanocomposites. The table summarizes that the density of the NBT/PMMA nanocomposites slightly increased after the filler was incorporated. The slight increase in density may be attributed to the small filler amount in the composites. Furthermore, an increase in density is expected because the density of NBT is higher than that of PMMA (i.e., 6080 kg/m3). When they were blended, the density of the NBT/PMMA nanocomposites was between both components and increased with increasing NBT content. This result is consistent with the previous findings that the composition density of composites is linearly related to the increase in filler ratio. 19,23
Effect of NBT content on the density of the PMMA nanocomposites compared with the PMMA matrix.

PMMA: polymethyl methacrylate; NBT: nanobarium titanate.
It can also be noted that the density of NBT/PMMA nanocomposites is raised by 5% when the highest filler loading is impregnated. Such increment should be achieved without causing any adverse effect on the stability of removable prosthodontics during mastication; 13% increase in density of denture base was acceptable in a previous study with the incorporation of 20% of micro-sized barium titanate. 19 It is important to point out that composites with nano-sized inclusions exhibit lower density than microcomposites. 24 In general, the material used to produce a denture base should have a low specific gravity value because the denture base should be as light as possible. Therefore, an increased denture density is considered undesirable especially for the upper denture base because a heavy denture base would be wobbly in the patient’s mouth and would drop down during use.
Polymerization shrinkage
The PS of dental resins during polymerization is triggered by two phenomena. One is when the van der Waals distance between the monomer molecules is replaced by a covalent bond during polymerization. The other is when the intermolecular distance between polymer chains becomes smaller than that between monomers. 20,25,26 Such shrinkage causes the buildup of residual tensile stress around particles, interfacial bond failure, and microleakage, 25 which negatively affect the toughness of the material. Factors, such as monomer structure and content, as well as filler loading, type, and composition, influence shrinkage. 20 Although the positive effect of filler impregnation on shrinkage reduction is reported, 20,27,28 others found that increasing the filler content is insufficient to reduce the overall shrinkage of composites. 29
The curing shrinkage of the NBT/PMMA nanocomposites was evaluated by weighing each specimen in air and water using an analytical scale balance. Figure 3 depicts the PS in the NBT/PMMA nanocomposites and pure PMMA. The shrinkage values of the NBT/PMMA nanocomposites were lower than those of the PMMA matrix (10.5%). This result may be ascribed to the total organic matrix content of the composites. The shrinkage in the NBT-reinforced composites decreased from 9.6% (NBT 1%) to 6% (NBT 9%). An inverse linear relationship was noted between NBT content and PS. PS considerably reduced with increasing NBT content in the PMMA matrix because of the decrease in the number of reactive methacrylate groups in the NBT/PMMA nanocomposites with high filler levels. 27 As the amount of NBT was increased, the interstices existing in PMMA could be assumed to be gradually embedded with these small fillers. Hence, the movement of the formed polymer chains might be further hindered during polymerization, and the shrinkage may decrease to the minimum under the highest filler loading. These outcomes agreed with the generally accepted conclusion that high inorganic contents are associated with low polymerization stress values, which are directly related to shrinkage reduction. 20,28 Others inferred that epoxy resin-based nanocomposites demonstrated low shrinkage and high strength because of the strong interfacial interactions between resin and nanoparticles. 30

Polymerization shrinkage of pure PMMA and PMMA nanocomposites filled by different ratios of NBT. PMMA: polymethyl methacrylate; NBT: nanobarium titanate.
During denture fabrication, the shrinkage that occurs when a liquid monomer is converted to a solid polymer can be accompanied by a dimensional change which leads to impairing the denture adaptation to the patient’s mouth, which results in the formation of rocking. Moreover, shrinkage leads to tensile forces within the material at the filler–matrix interface, which consequently creates microvoids or microcracks that impair the mechanical properties of composites. The reduction in PS is claimed to be due to the introduction of pre-polymerized resin. 29
Surface roughness
The surface quality of a resin-based composite is a very important characteristic of the final restoration. The surfaces of dental prostheses should be as smooth as possible to maintain the health of oral tissues and reduce retention of microorganisms and plaque accumulation because roughness may facilitate microorganism adhesion even if the patient follows appropriate dental prosthesis hygiene. 31 Moreover, roughness affects aesthetic appearance because of the discoloration of restorations and gingival irritation. 32 In addition to interfering with the optical properties of the dental composites, surface roughness affects the mechanical properties by decreasing the resistance and accelerating the abrasion of materials. 33 The surface roughness of the composites is influenced by several material factors, such as the type, shape, size, and distribution of the inorganic fillers. 34
The effect of NBT content on the Ra of NBT/PMMA nanocomposites before and after polishing is depicted in Table 4. Ra and Rz parameters are also displayed. No notable changes were observed among the examined samples before polishing. However, the roughness of denture base materials evaluated in this study was much lower than those reported ideal values. 35,36 The basal roughness of pure PMMA (11 nm) was significantly lower than those values proposed as a reference for clinical use (<200 nm) and lower than that reported in a previous study (93 nm). 32 A significant difference was found despite being of the same polymer, probably because the materials were from different manufacturers. Therefore, the handling process and sample preparation procedures vary, although the compositions of the PMMA are quite similar. In addition, NBT/PMMA nanocomposites exhibited lower Ra. Such behavior could be attributed to the uniformly distributed and highly compacted NBT particles, thereby enhancing surface smoothness. These findings were consistent with those from studies which deduced that the strong chemical interaction between organic and inorganic phases and homogeneous dispersion of nanofiller results in uniform distribution and could minimize particle failure, leading to a significant decrease in surface damage of the resulting nanocomposites. 37,38 Another possible explanation for the smoothness of the surfaces achieved with nanofilled composites could be the spherical shape of the NBT. Say et al. 34 stated that composites filled with spherical nanofiller have resulted in lower roughness and higher gloss values than nanohybrid composites filled with irregularly shaped fillers.
The effect of NBT content on the surface roughness of PMMA nanocomposites.
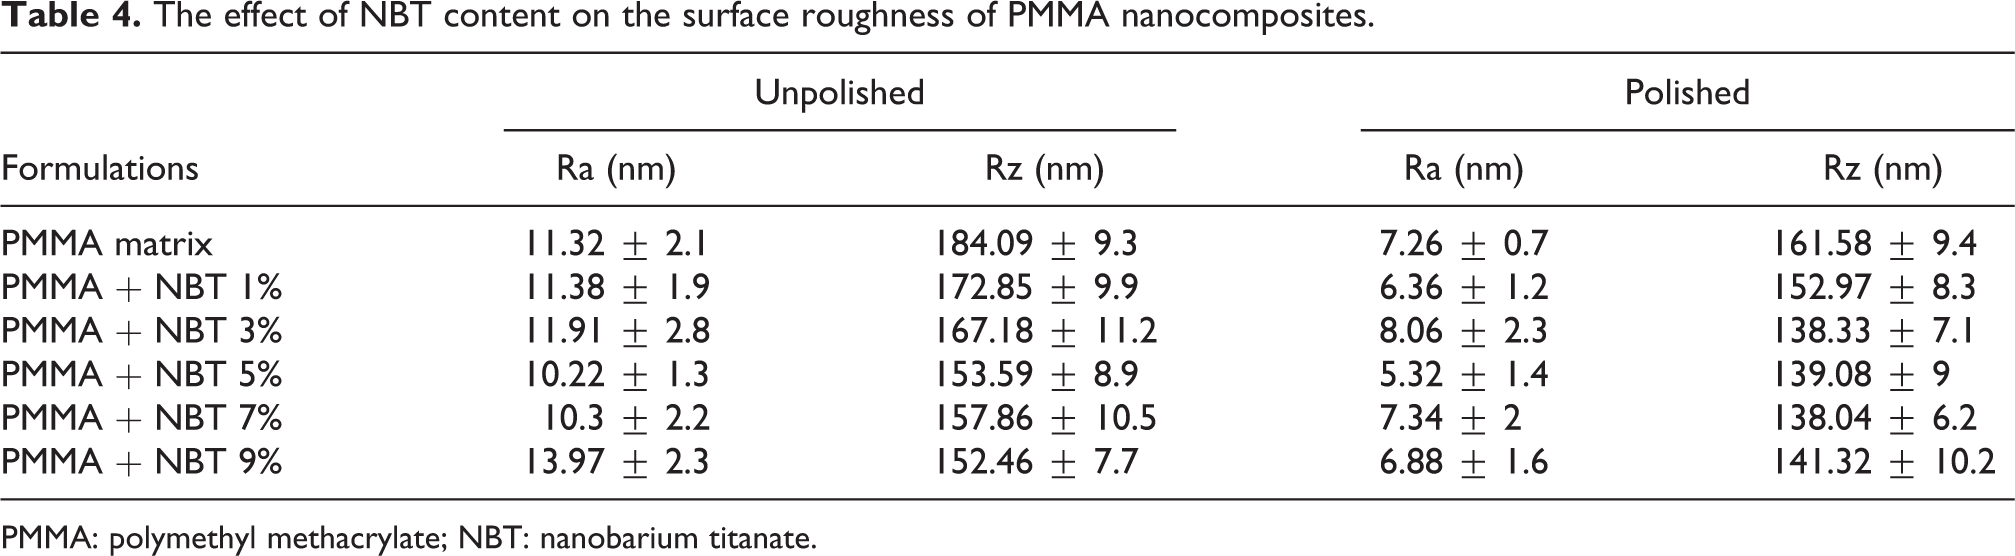
PMMA: polymethyl methacrylate; NBT: nanobarium titanate.
AFM has become an important tool for imaging surfaces and analysis. AFM allows a 3-D imaging at the nanometric resolution and is emerging as reliable in the evaluation of surface roughness features of composites (Figure 4). The AFM offers quantitative data on surface morphology. 34 After polishing, all experimented samples had relatively similar average Ra values. This characteristic indicates that the used abrasive papers successfully reduced the average roughness of the materials on relatively equal values. Rz is a relative indicator of Ra, and it does not show absolute values of height or depth of channels in the material. A similar observation was reported by others who concluded that the acrylic denture base presented the lowest roughness value before and after a polishing technique and apparently did not show any visual surface topography change. 32 The superior polishability of NBT/PMMA nanocomposites may be attributed to the use of nanofillers in such resin composites, that is, the smaller the filler size, the lower the degree of filler pluck out, and hence the better the polishability. Lainović et al. 39 found that nanofiller-containing composites allow more uniform surface topography after polishing. This type of fillers has improved bonding properties, and almost any particle in this field does not pluck out during polishing. Hence, the composite surfaces evaluated in this study can be assumed to possess highly smooth surfaces. Ra was far from the mentioned limit as ideals (<200 nm) even without polishing, which present no risk of plaque accumulation.

AFM 3-D images of (a) PMMA matrix, (b) PMMA + NBT 1%, (c) PMMA + NBT 3%, (d) PMMA + NBT 5%, (e) PMMA + NBT 7%, (f) PMMA + NBT 9%. PMMA: polymethyl methacrylate; NBT: nanobarium titanate; AFM: atomic force microscopy.
Surface hardness (VHN)
Table 5 presents the VHN values of the filled samples compared to that of the PMMA matrix and hardness improvements values of nanocomposites. There were significant statistical differences between the neat PMMA and PMMA nanocomposites (p = 0.001). The filled samples exhibited higher surface hardness than the PMMA matrix. Nevertheless, the NBT/PMMA nanocomposites exhibited increased hardness with filler content. This result indicates a strong correlation between VHN and the filler volume fraction in the NBT/PMMA nanocomposites. The amount of filler particles can influence and improve VHN. This finding may be attributed to the high hardness value of the dispersed phase and the imposed restriction on matrix deformation caused by the uniform distribution of the dispersed phase. The increase in hardness could also have been caused by the fact that the durable bond of NBT to the resin matrix makes the polymerized acrylic resin become more rigid and present lower deformation. This result is consistent with previous studies which indicated that dental composites have high hardness values because of their high filler contents. 13,40 In addition, Mathew et al. 41 found that coupling agent aid in protecting fiber surface and prevent inhibition of polymerization. Increasing the treated filler content in a polymer matrix improves composite hardness. Furthermore, the white color of ceramic fillers is not expected to adversely affect the aesthetic appearance of denture base resin. 13
Vickers hardness of NBT filler-filled PMMA matrix compared to that of the PMMA matrix.

PMMA: polymethyl methacrylate; NBT: nanobarium titanate; VHN: Vickers hardness number.
Predicting the overall properties of composites is important for material design and applications. The ROM is the simplest and intuitive method to estimate the effective mechanical properties of materials in terms of their composition. The theoretical hardness values of the PMMA composites were calculated and plotted using ROM as shown in Figure 5. The theoretical and experimental VHN values showed no clear differences. This consistency supported the homogeneous dispersion of the NBT, which improved the VHN by 23% at the highest filler content. The hardness of the composites approached that of the soft matrix especially at a low volume fraction of the hard particle.
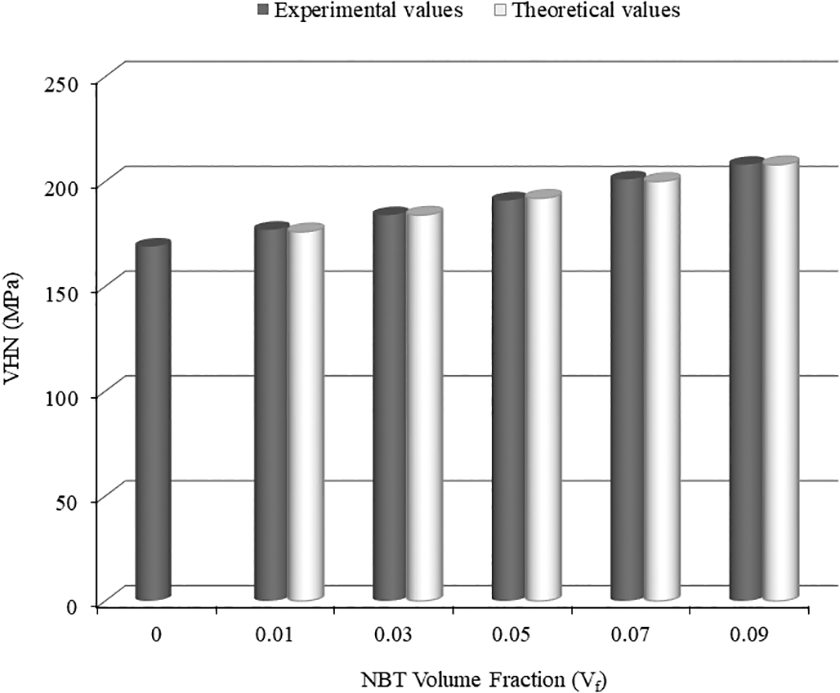
Experimental and theoretical VHN values of NBT/PMMA nanocomposites. PMMA: polymethyl methacrylate; NBT: nanobarium titanate; VHN: Vickers hardness number.
Correlation between VHN and PS
Hardness is important in characterizing and ranking dental restorative materials because of the relationship between hardness and other physical properties. Figure 6 presents the correlation between the hardness and PS of NBT/PMMA nanocomposites and pristine PMMA. An inverse relationship can be evidently observed. The specimens showed significantly different microhardness values at distinct levels of PS. This behavior could be attributed to constraining the molecular mobility at the filler–matrix interface during polymerization which decreases PS, resulting in improved VHN values. Although the reverse correlation between polymerization contraction and mechanical properties, such as strength and modulus, has been reported, 20,30 direct correlation of these properties with hardness has been also documented. 13 Moreover, the use of bifunctional monomers, such as EGDMA, to form crosslinked chains improved the hardness values. Regarding the inorganic filler, the hardness values obtained are also dependent on the volume added to the material. When the quantity of particles increases, the surface hardness of the material also increases. Therefore, the quality of polymerization of the resin composite with respect to the polymer density may be superior to that of the acrylic resins tested. This outcome is consistent with those in previous studies in which the composites with the highest microhardness values exhibited the lowest percentages of PS. 42 In general, higher hardness values indicate more extensive polymerization. Accordingly, enhancement in hardness accompanied with a decline in PS was expected. Fugolin et al. 43 found that increasing the amount of filler particles could lead to a reduction in the volumetric shrinkage of the matrix because of their solidity and unshrinkability. At high filler loading, the volume occupied by the organic matrix decreased, resulting in a lower number of reactive methacrylate groups and diminished availability of the monomer for the treatment, thus producing lower total shrinkage. Therefore, increasing the amount of filler particles decreases the amount of matrix, minimizing PS, and enhancing VHN.

Correlation between surface hardness and polymerization shrinkage.
Tensile properties
Table 6 presents the effects of the filler loading on the tensile properties of the NBT filler-filled PMMA matrix. A remarkable increase in the tensile modulus values of filled PMMA was observed compared to that of the neat PMMA matrix (p < 0.001). The continuous increase of elastic modulus from 1 wt% to 5 wt% filler loading is because of the good bonding at the interface leading to the mobility restriction of PMMA nanocomposites molecular chains by the NBT particles. This observation highlights the fact that the incorporation of NBT into polymer matrix improves the stiffness of the resultant nanocomposites. In the case of higher filler content, tensile modulus remains unaffected by filler incorporation. The modulus was measured before plastic deformation occurred, which resulted in the behavior cited. These measurements implied that interactions between the fillers and the polymer matrices were not considered. Shirkavand and Moslehifard 44 found that the increase in the elastic modulus was the highest for 1 wt% nano-TiO2, while it was the lowest when a high value was added to the polymer matrix.
Effect of filler loading on the tensile properties of NBT/PMMA nanocomposites compared to PMMA matrix.

PMMA: polymethyl methacrylate; NBT: nanobarium titanate.
The tensile strength provides an indication of a restorative’s resistance to the lateral forces generated during function. 45 The results revealed statistically significant differences in tensile strength among the investigated samples (p < 0.001). The filled PMMA samples exhibited higher tensile strength compared to PMMA matrix. The tensile strength increased with increasing concentration of NBT up to 5 wt% and then decreased by an additional amount of NBT introduced into the nanocomposite resin. This behavior was attributed to homogeneously dispersed filler particles because well-dispersed particles enhanced the crack propagation path and plastic deformation while absorbing a portion of the energy. Surface energy increased as a function of filler content and this, in turn, increased composite strength. The shape of the NBT may also explain this result. As stated by Moraes et al., 46 composites with round particles may present increased mechanical strength. However, additional NBT particles caused their improper dispersion in PMMA matrix, which unfavorably affected the strength of the NBT/PMMA nanocomposites. The filler particles aggregated, thereby causing inefficient stress distribution and mechanical strength decrease because of the agglomerates’ low strength. Similar results were reported in previous studies, wherein an increase in filler loading caused weak adhesion between the filler particles and the resin matrix. 44,45 Filler particle agglomeration increased when the filler loading was increased. Thus, applied stress was not uniformly distributed in the composites, thereby causing local stress concentrations. This behavior led to crack formation, particularly near defective, stressed areas of the filler–matrix and the filler–filler interfaces.
The filled samples exhibited higher tensile strain and energy at break values compared with unfilled samples. The high tensile strain and energy at break values of the filled samples were attributed to better dispersion and good filler–matrix interaction. Enhancing the compatibility among the composites’ phases led to the effective transfer of applied stress to the NBT from PMMA matrix, which resulted in greater energy absorption. Lower tensile strain and energy at break values in samples with higher filler content may be attributed to filler agglomeration. This phenomenon leads to insufficient homogeneity of local stress distribution and subsequently initiates deformations at particular locations in the composites. Adding ceramic fillers limited the mobility of the amorphous phase in the polymer; thus, the damping of the composite was reduced. This occurrence was expected because increasing the filler content decreased the polymer matrix and the overall damping of the composite. 40
Flexural properties
Figure 7 shows the results of the flexural properties of the NBT-filled PMMA matrix. The flexural modulus of the NBT/PMMA nanocomposite increased with increasing filler loadings (p < 0.001). The enhancement in flexural modulus of NBT/PMMA was attributed to the ability of NBT to withstand the stress and restrict the movement of molecular chain in PMMA system during load applied to that sample. Flexural modulus depends on the stress transmission between the filler and the matrix in the composite. The stress transfer ability between the filler and matrix depends on the interface, which is typically derived from TCA. The filler was able to withstand most of the stresses received without experiencing deformation because its modulus was extremely high. 40 This finding is consistent with others who reported that the increasing modulus of composites is due to sufficient stress transfer across the HA/polymer interface. Hydroxyapatite (HA) powder in the matrix restricts the movement of the matrix phase in the vicinity of each particle, contributing to an overall increase in the modulus. 47
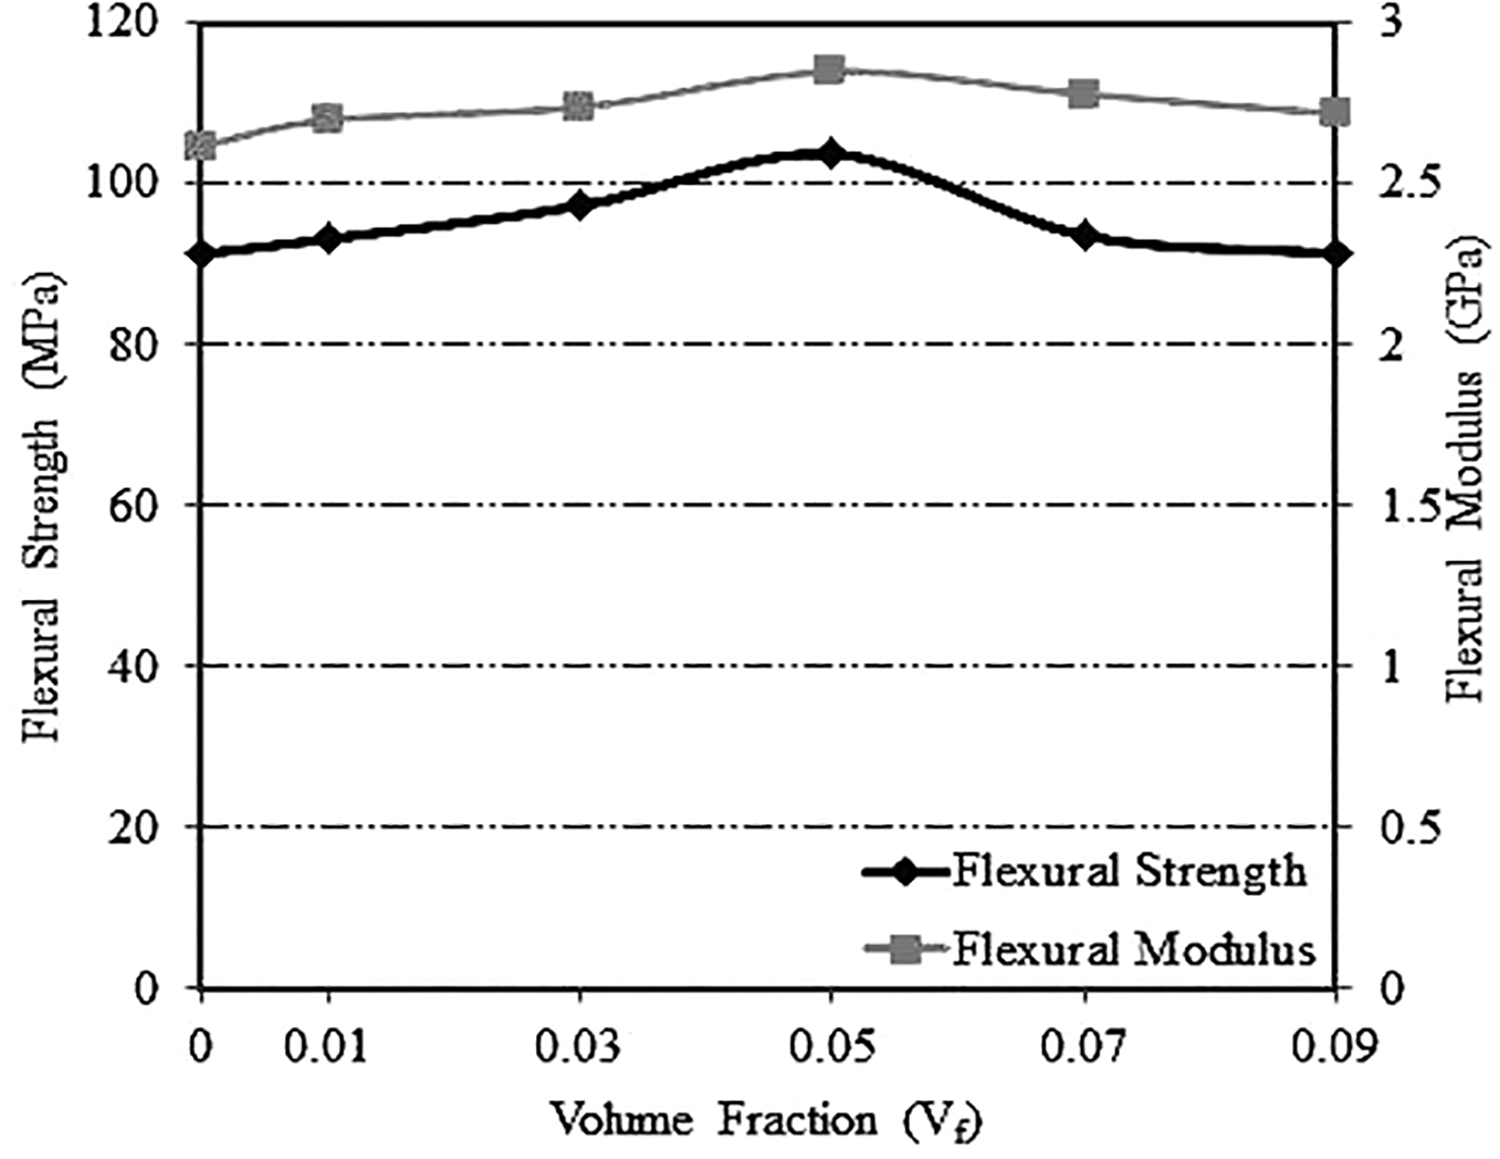
Comparison of the effects of filler content on the flexural properties of the PMMA matrix containing NBT and unfilled PMMA matrix. PMMA: polymethyl methacrylate; NBT: nanobarium titanate.
Flexural strength of the material is an acceptable parameter to determine the fracture resistance since it reflects the load arrangement in the clinical situation and it also gives an indication of the rigidity which is useful in comparing the denture base materials. Significant differences have been found in flexural strength among the experimented samples in the six groups (p < 0.001). In comparison with the unfilled samples, the filled composite’s flexural strength increased until the maximum filler loading (V f = 0.05) was attained, after which a slight decrease in the flexural strength was observed. However, the flexural strength values of NBT/PMMA nanocomposites were higher than the PMMA matrix. This behavior was referred to good dispersion and the homogeneous compatible combination of NBT and PMMA. To improve bonding between NBT and the PMMA matrix, the NBT particles were surface-treated with a TCA, which acted as a molecular bridge to establish chemical bonding between the NBT and the PMMA matrix. Consequently, the flexural strength of NBT/PMMA nanocomposites was enhanced because more energy was needed to break the strong chemical bonds between both materials. These results agree with those of previous studies; these studies showed that composites containing nanoparticles exhibited remarkably higher flexural strength. When nanoparticles were evenly well-dispersed in the resin matrix, the large interfacial area between nano-ZrO2 and PMMA matrix rendered nano-ZrO2 a higher capacity to absorb and dissipate energy, thereby improving the strength of modified nano-ZrO2/PMMA composites. 5 In general, the strength of the composite depended on the interfacial adhesion between the filler and the polymer matrix and the particle size. As the filler particles size decreases, their surface area increases relative to their volume and therefore higher surface energy at the interphase was observed. Thus, the stress concentration at the filler/matrix interphase decreases with decreasing particles size of the filler, having as a result higher values of the flexural strength of the corresponding composites. 48
The flexural strength of a material is a combination of its compressive tensile and shear strengths. When the tensile and compressive strengths are increased, the force required to fracture the material also increases. Although a reduction in the flexural strength of NBT/PMMA nanocomposites was observed at high filler loadings, the flexural strength was higher than the pure PMMA and the standard minimum limit established. According to ISO 1567, the flexural strength and modulus of heat polymerized materials should not be <65 and 2000 MPa, respectively. Thus, the NBT-reinforced PMMA matrix is a reliable material because it exhibited high specific modulus and strength.
Conclusions
Based on the results obtained in the present study, the following conclusions could be drawn: NBT/PMMA nanocomposites are successfully fabricated with enhanced mechanical and physical and properties. The inclusion of titanate-treated NBT in neat PMMA produced a denture base material with improved tensile and flexural properties. The mechanical performance of NBT/PMMA nanocomposites was higher than that of neat PMMA due to a significant improvement in the filler–matrix interaction. NBT/PMMA nanocomposites exhibited higher surface hardness and lower surface roughness due to the uniformly distributed and highly compacted NBT particles, thereby enhancing surface smoothness. Such enhancements obtained with titanate-treated NBT could lead to the promotion of the dental composites’ longevity.
Footnotes
Acknowledgements
The authors gratefully acknowledge the Center for Research and Instrumentation Management (CRIM), UKM for their support and excellent testing equipment.
Declaration of conflicting interests
The author(s) declared no potential conflicts of interest with respect to the research, authorship, and/or publication of this article.
Funding
The author(s) disclosed receipt of the following financial support for the research, authorship, and/or publication of this article: This work was financially supported by Universiti Kebangsaan Malaysia (UKM) and the Ministry of Education, Malaysia via the research sponsorship of DIP-2016-001.