
Abstract
From the last few decades, vibratory welding techniques have been used for improving the mechanical properties of weldments. Previous results showed that welded test specimens under vibratory conditions exhibited improvements in mechanical properties than the conventional arc welding. In this present work, vibratory set-up has been developed for inducing mechanical vibrations during welding operation. The designed vibratory set-up produces the required frequency with amplitude and acceleration in terms of voltages. In the current investigation, weld specimens were prepared while varying the two input parameters: voltage and time of vibration. And the remaining process parameters such as travel speed, current, and other electrode parameters were kept constant. Metallurgical properties showed that refined microstructure has been achieved for the vibratory welded specimens. The refined grain structure is responsible for the improvement in flexural strength, ultimate tensile strength, impact strength, and hardness of the vibratory weld pieces.
Introduction
Welding is a fabrication process used to join materials, usually metals or thermoplastics, together. During welding, the pieces to be joined are melted at the joining interface and usually a filler material is added to form a pool of molten material (the weld pool) that solidifies to become a strong joint. During the welding process, the residual stresses are more, and due to this, the weld strength is reduced and some defects may be induced. Therefore, in order to minimize the residual stresses, vibratory welding techniques have been introduced. The properties of the vibratory welded specimen depend on the process parameters like amplitude, frequency, and time of vibration. The experimental set-up involves the use of a vibratory table. The vibratory condition leads to minimize the residual stresses.
Lu et al. 1 investigated the application of vibratory weld conditioning (VWC) on full welded valve. They found that the vibration applied during welding generally reduces the residual deformation and stress. Jijin et al. 2 compared VWC and normal submerged arc welding of multi-pass girth-butt welded pipes. They found that VWC could reduce the residual hoop stresses at the outer surface and the radial distortion significantly. Munsi et al. 3 performed investigations on the effect of amplitude of vibration, time of vibration, and frequency of vibration. The work finds an optimum applied stress that will maximize the reduction in both longitudinal and transverse residual stresses. Liu et al. 4 addressed vibration responses of railway steel bridge considering welding residual stress based on a reasonable heat source model. Aurimas et al. 5 investigated the effects of vibration energy input on stress concentration in weld and heat-affected zone (HAZ) of S355J2 steel and observed that redistributing the internal residual stress of welded structures reduces stress concentration effectively. The vibratory relief with respect to torsional stress was observed in three types of welded shafts: 6 (1) homogeneous shaft, (2) shaft welded on a circumferential line, and (3) a spot-welded shaft. They noted that the first two types of shafts showed some redistribution in the residual stresses under applied torsional loads. On the spot-welded shafts, the residual stresses were found to decrease significantly at a very low level of vibration-induced stress. Spooner et al. 7 described the effect of vibratory stress relief during welding of thick stainless steel plate and identified the largest residual stress at the HAZ, along the base metal fusion joint longitudinally and at the boundary between the weld zone and the HAZ. Residual stresses were relieved by applying VWC, 8 which could refine the grain structure effectively.
Lu et al. 9 applied the mechanical vibrations during submerged arc multi-pass welding of full welded valve. They observed enhancement in impact property of the weld metal, but not at the HAZ. In another study, Lu et al. 1 improved quality of full welded valve by the application of VWC resulting in reduction in the residual deformation and stress while the yield strength and the tensile strength remain unchanged. Hussein et al. 10 observed improved weldment mechanical properties and the quality of the fusion metal besides bend property along welding line and tensile strength. The morphology study also showed better distribution of the fusion fillet metal. Munsi et al. 6 investigated the influence of vibratory treatment on the fatigue life of welds by comparing with thermal stress relief. Boonstra et al. 11 studied the vibratory welding of heat-heated wood and obtained superior strength.
Welding operation performed with transverse and torsional complex vibrations for ultrasonic seam welding 12 where a 27& kHz complex vibration disc welding tip was used. They found that the disc welding tip vibrates in an elliptical or circular locus and the complex vibration system can continuously weld multiple parts of metal plate specimens such as heat sinks with a large number of fins. Kim et al. 13 investigated the meltability of Al-Mg and Al-Mg-Si alloys using a pulsed ultrasonic vibration aided laser welding and found that ultrasonic vibration had suppressed the number of welding defects and improved the melt characteristics due to cavitation effects and dispersion of particles in the molten pool during laser welding. Bruce 14 investigated the method for spot welding of sheet metal members by the use of high-frequency vibratory energy. Kim et al. 13 investigated the effects of vibrational energy on the microstructure of welds and toughness and found that vibration during welding provides positive effects on the microstructure constituent formation. Balasubramanian and Balusamy 15 investigated the effect of vibratory treatment on hot cracking resistance in AA6061 alloy. In that work, frequency in the range of 250–900& Hz was applied during experimentation, and hot cracking was found to be largely controlled. Denslow 16 investigated the welding of metallic workpiece at commutator slot using high-frequency vibratory energy.
Most of the past research work was concentrated on vibratory welding process at the constant welding parameters and reported the mechanical and metallurgical properties of the weldments. In the current investigation, a new type of vibratory welding equipment is used to perform the arc welding process. Test specimens were prepared at various voltages (varying from 70 to 230& V) and maintained the vibration periods at 60, 80, and 100& s. Later, metallurgical and mechanical properties were analyzed for the specimens prepared. They inferred that there was an improvement in the mechanical properties like hardness, ultimate tensile strength, flexural strength, and impact strength due to refinement in grain structure.
This article is organized as follows: Section ‘Equipmental set-up’ deals with weld specimen preparation using the developed vibratory equipment. Section ‘Metallurgical study of specimens’ addresses the metallurgical behaviour of the specimen. Section ‘Study of mechanical properties’ illustrates the mechanical properties of the weld specimen achieved. Section ‘Results and discussion’ discusses the experimental results and section ‘Conclusion’ concludes the work of the developed methodology.
Equipmental set-up
A platform to place the specimen was equipped with four springs along each the corner. The vibration platform was prepared by attaching a vibromotor to the vibration table set. A dimmer stat, voltmeter, and ammeter were attached to the vibromotor to generate the vibrations. Figure 1 shows the experimental set-up and Figure 2 exhibits the vibration platform surface plate.
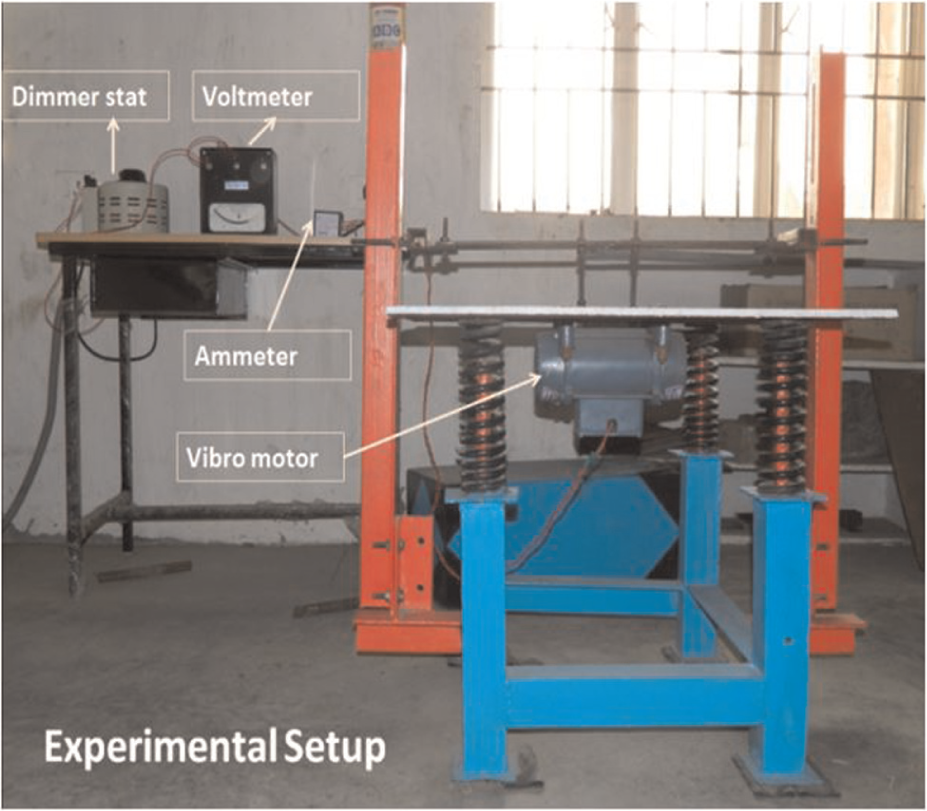
Experimental set-up.
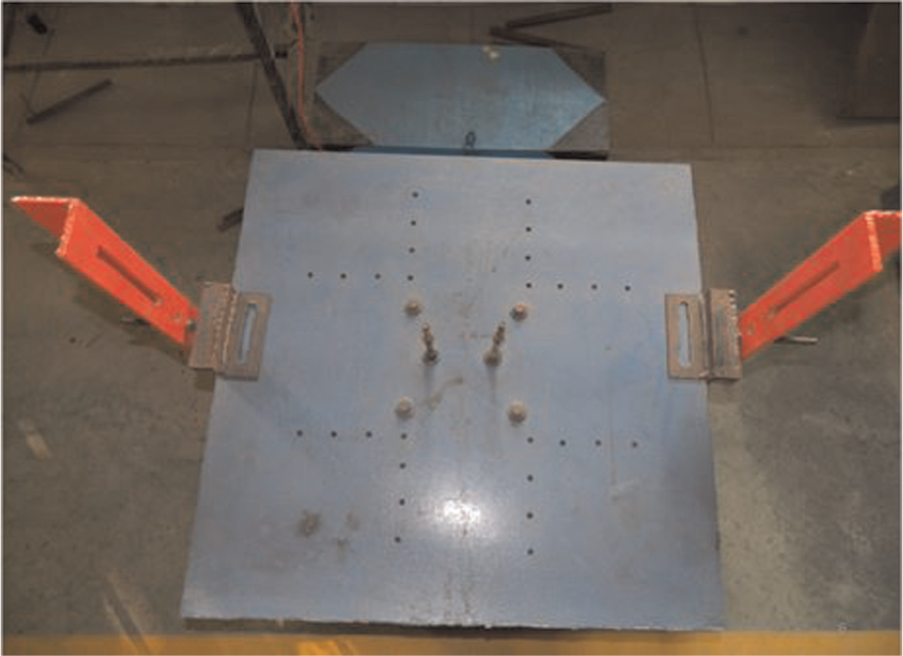
Vibration platform.
With an aim of improving the mechanical properties of weld joints by inducing favourable changes in the weld microstructures, an auxiliary vibratory set-up capable of inducing mechanical vibrations into the weld pool during manual metal arc welding was designed. Different frequencies at different amplitudes were applied along the weld length, just trailing behind the welding arc so that weld pool could be mechanically stirred in order to induce favourable microstructural effects. This set-up produces the required frequency with the amplitude in terms of voltages. Table 1 lists the acceleration and amplitude variations at voltages of 70, 150, and 230& V. Figures 3 and 4 show the acceleration and amplitude variation with respect to input voltage. The prepared butt welded joints were under the low heat input (90–110 A). There are two passes to fill the gap, first pass is main pass and second one is root pass. During the root pass, there is no role of vibratory set-up. During main pass, vibratory set-up comes into action and creates vibrations during the solidification of weld bead.
Acceleration and amplitude variation with respect to voltage input.
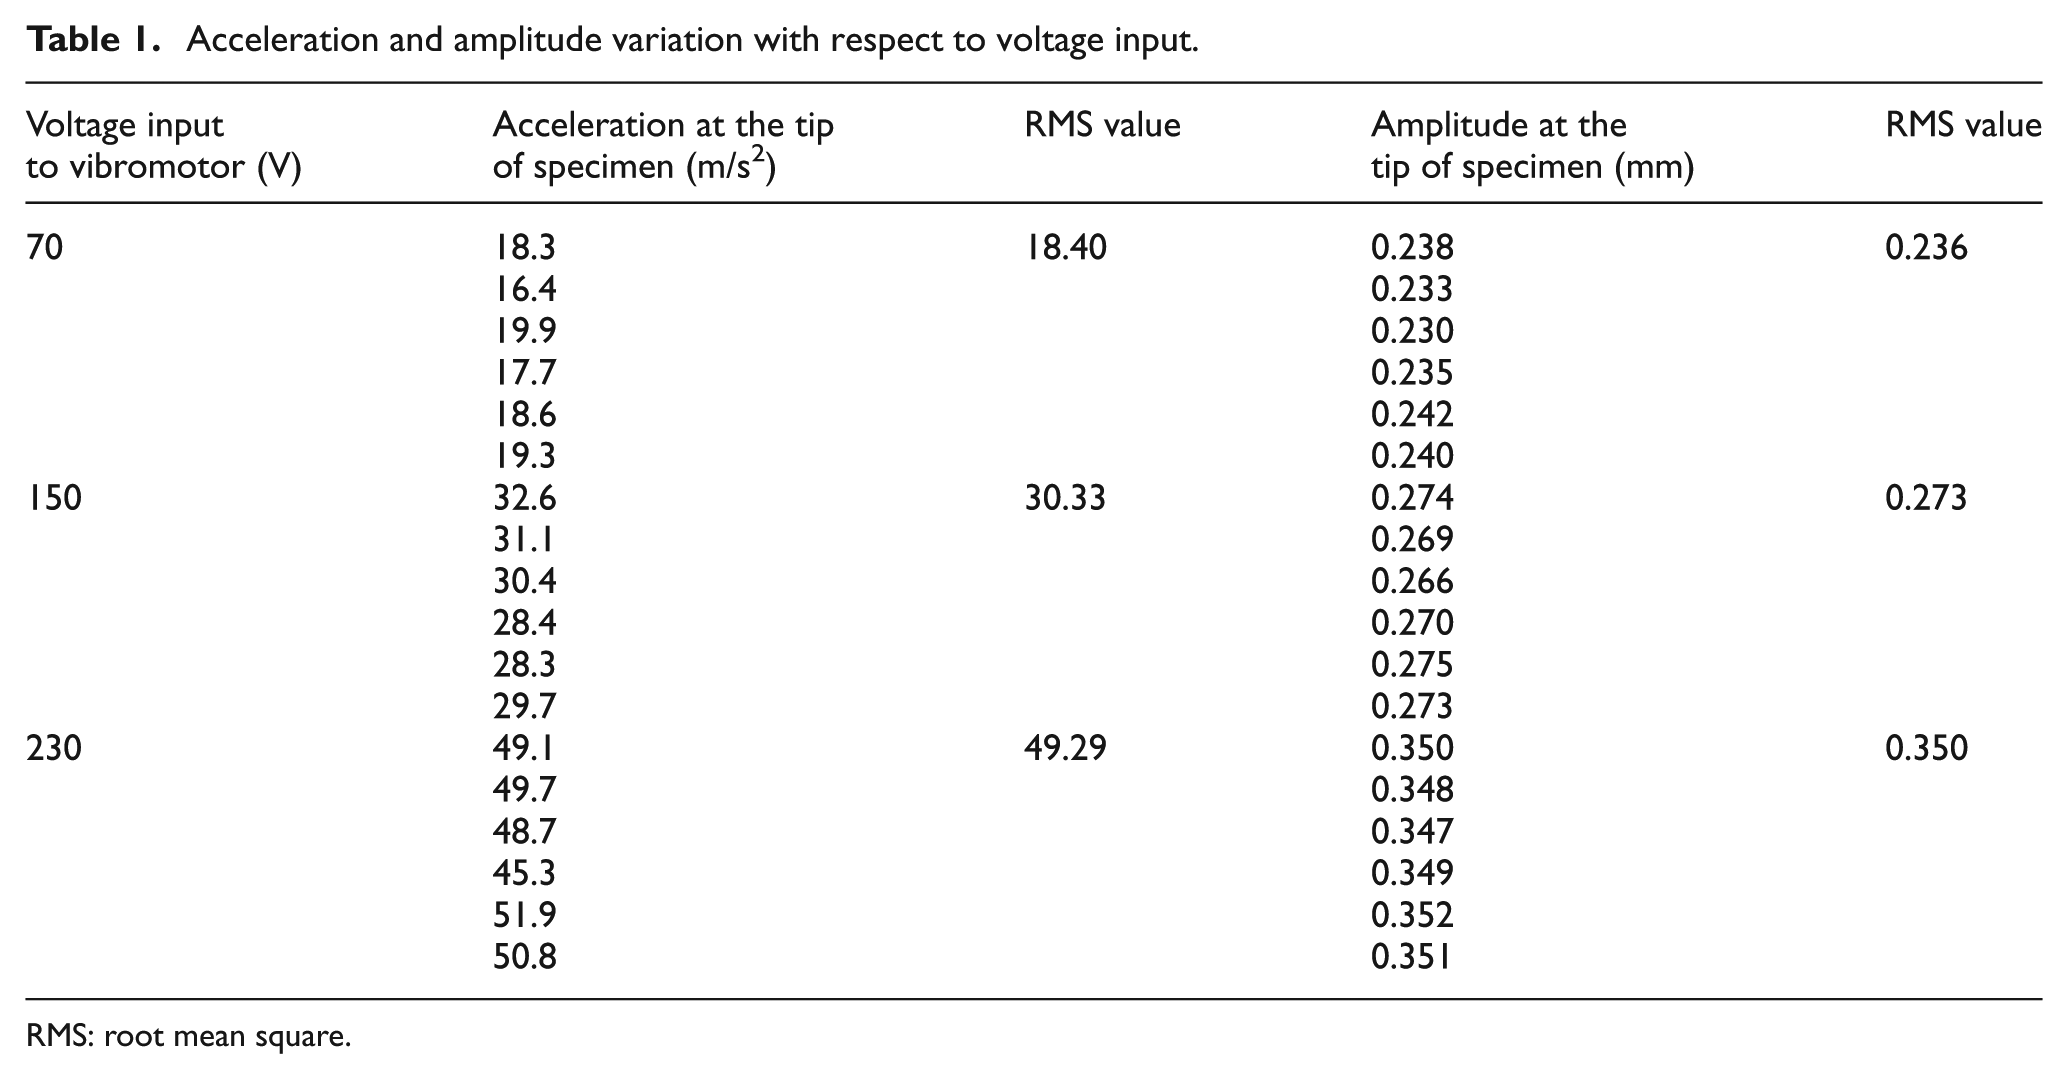
RMS: root mean square.
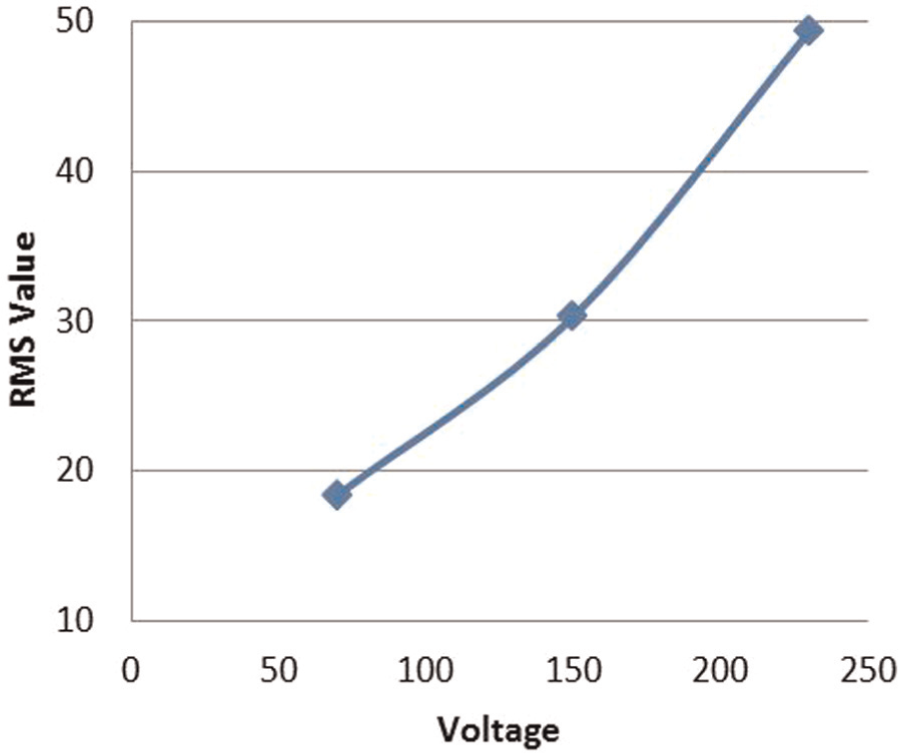
Acceleration variation with respect to voltage.
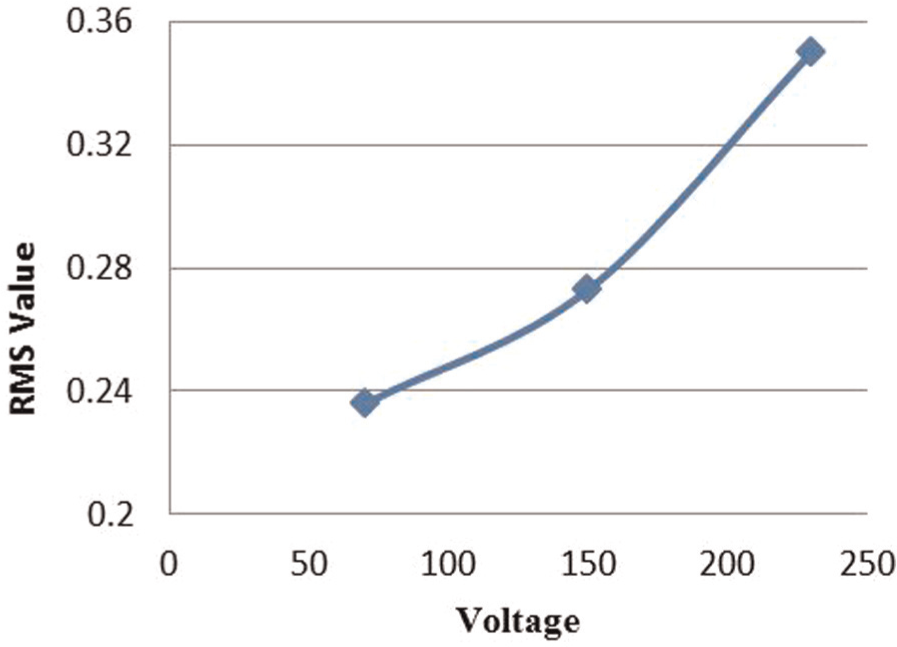
Amplitude variation with respect to voltage.
Preparation of specimens
Mild steel of 5& mm thickness was used in the current investigation. It is composed of 0.9% carbon (C), 7.5%−10.0% manganese (Mn), 1.00% silicon (Si), 17.0%−19.0% chromium (Cr), 4.0%−6.0% nickel (Ni), 0.06% phosphorus (P), 0.03% sulphur (S), and the base metal iron (Fe) (wt%).
Steel plates were placed on the vibration platform and power was supplied to the vibration equipment. Specimen preparation during vibratory welding is shown in Figure 5, and Figure 6 exhibits the final butt welded joint obtained.
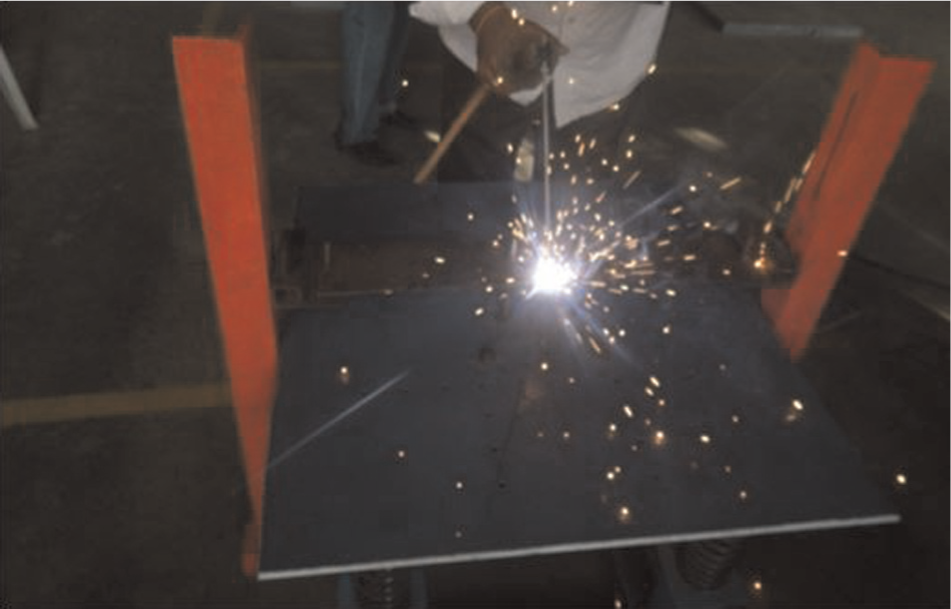
Welding the specimen in the presence of vibrations.
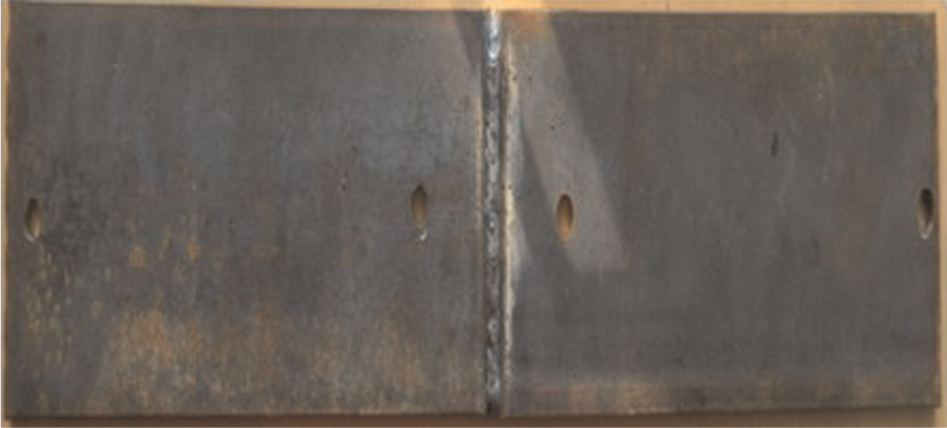
Prepared butt welded joint.
Metallurgical study of specimens
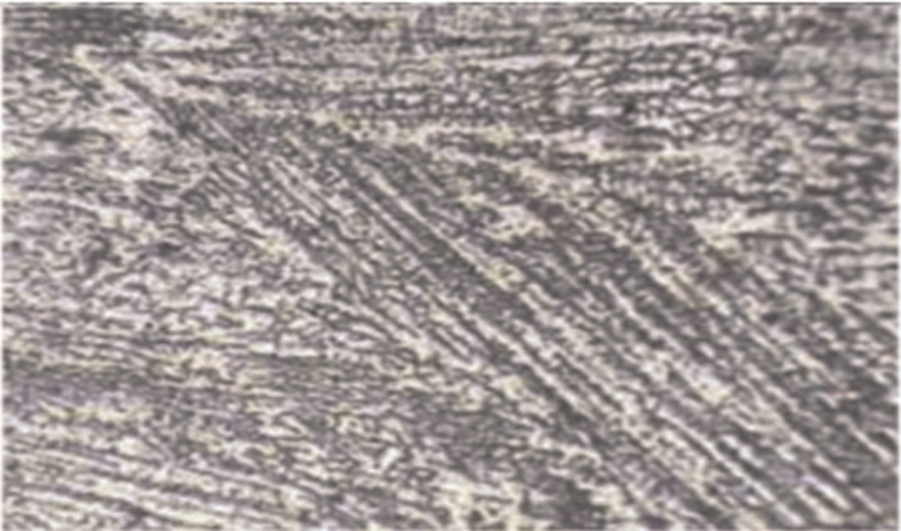
Figure 7 shows the microstructure of the specimen in the absence of vibrations in which long dendrites were formed. Under vibratory conditions, the microstructure of vibratory butt-weld joints is shown in Figure 8. Long dendrites got fragmented and broken into small dendrites and creating subsequently new nucleation sites. This leads to the formation of refined grain structure, which is responsible for the improved mechanical properties of welded joints, as discussed in the succeeding sections.
Welded specimen microstructure in the absence of vibrations.
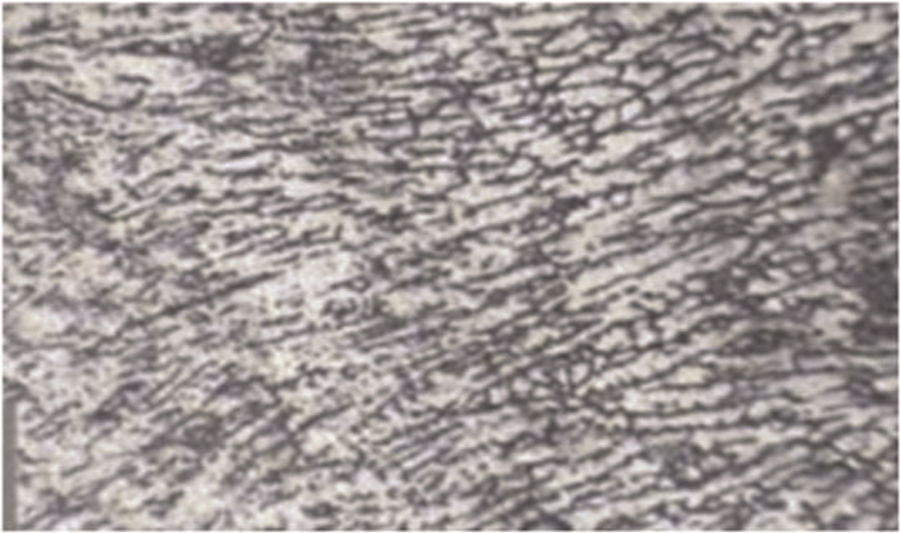
Welded specimen microstructure in the presence of vibrations.
Study of mechanical properties
Hardness
Hardness is the resistance of a material to indentation, or penetration by means of abrasion, drilling, scratching, and/or wears. The relative toughness of the mild steel or base metal is affected by many variables including the chemical analysis, microstructural constituents, and strength.
Micro-hardness measurement can be done by Lecco Vickers hardness (LV 700) tester, 17 in which a diamond indenter in the form of a right pyramid with a square base and an angle of 136° between opposite faces is forced into the material under a load F. The two diagonals X and Y of the indentation left on the surface of the material after removal of the load are measured and their arithmetic mean L is calculated
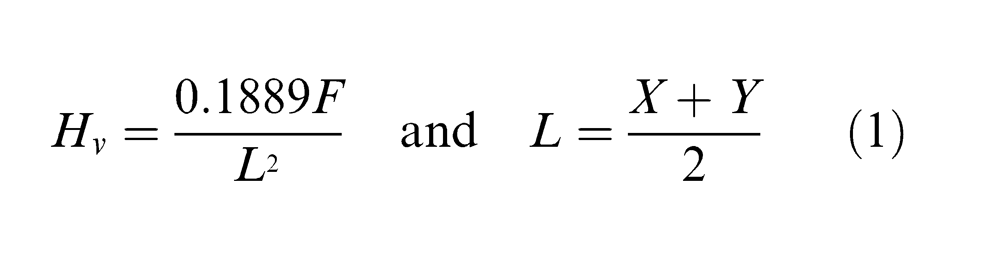
The hardness of the welded joint specimen is measured at different positions in longitudinal direction and transverse direction to the weld bead. The different locations on the welded joint are indicated on the specimen, as represented in Figure 9.
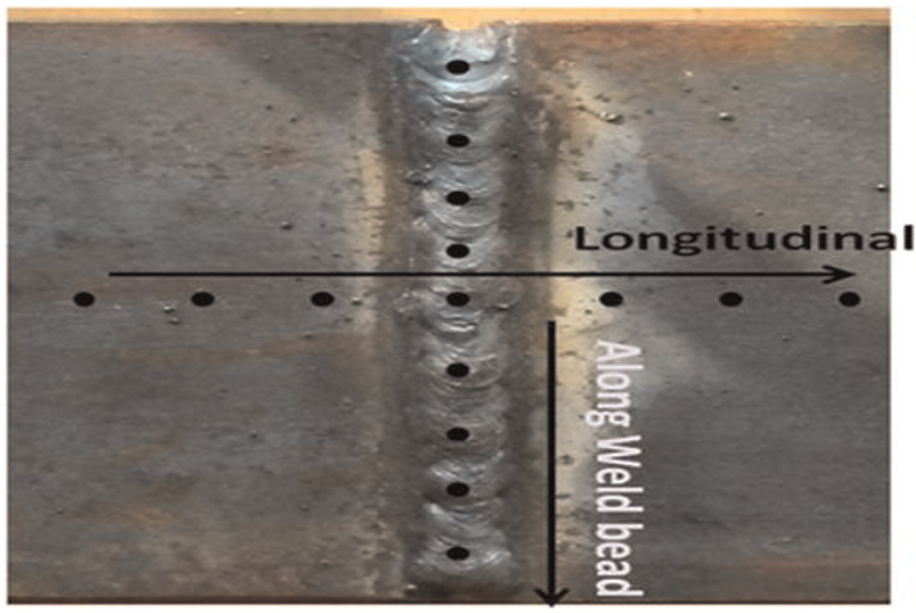
Locations for hardness testing on the welded joint.
For different combinations of voltage and time of vibration, weld specimens were prepared and tested for hardness on both of the sides. The experimental values obtained are listed in Table 2 of Appendix 2.
Flexural strength
Flexural strength represents the bend strength. It is defined as a material’s ability to resist deformation under load. The transverse bending test is most frequently employed, in which a rod specimen having either a circular or rectangular cross section is bent until fracture using a three-point flexural test technique. The flexural strength represents the highest stress experienced within the material at its moment of rupture. It is measured in terms of stress.
The three-point bending flexural test provides values for the modulus of elasticity in bending, flexural stress, flexural strain, and the flexural stress–strain response of the material. The main advantage of a three-point flexural test is the ease of the specimen preparation and testing. However, this method has also some disadvantages: the results of the testing method are sensitive to specimen and loading geometry and strain rate. Figure 10 shows the dimensions of the specimen, which are taken from the ASTM D790 standards. 18 The specimens prepared for conducting the three-point bend test are shown in Figure 11.
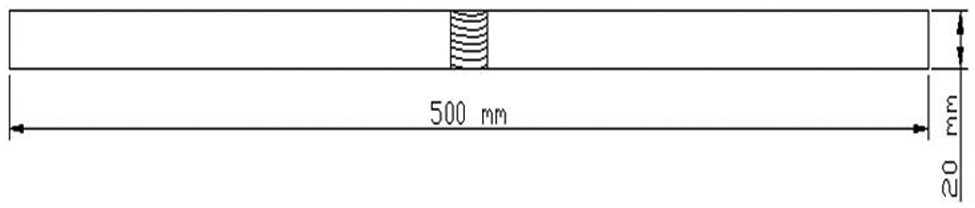
Line diagram of flexural specimen.
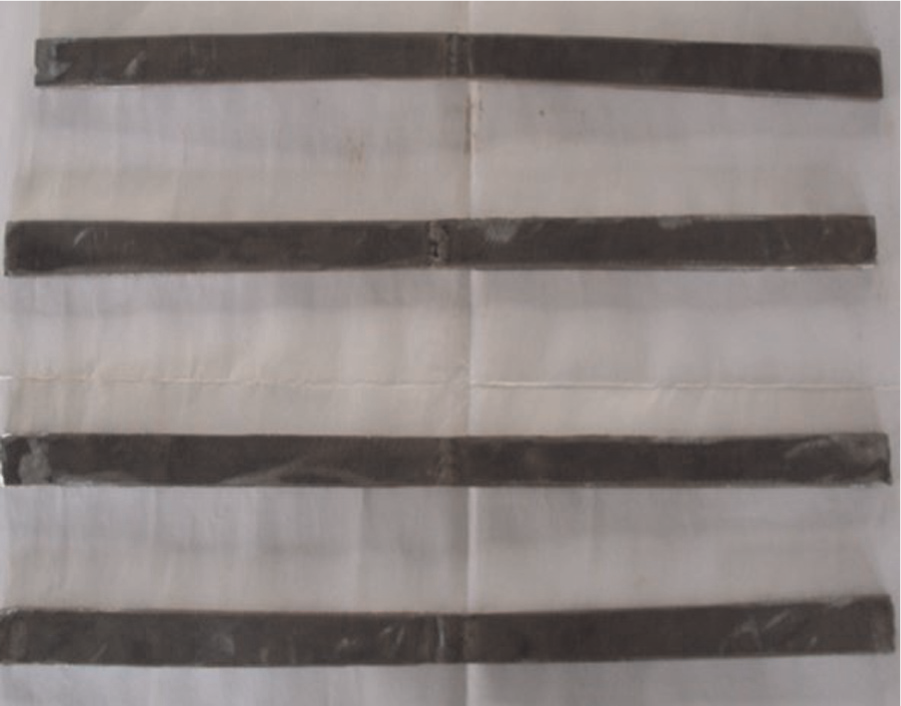
Flexural test specimens before test.
The test method for conducting the test usually involves a specified test fixture on a universal testing machine (UTM). For rectangular cross section, flexural stress of the specimen is calculated as
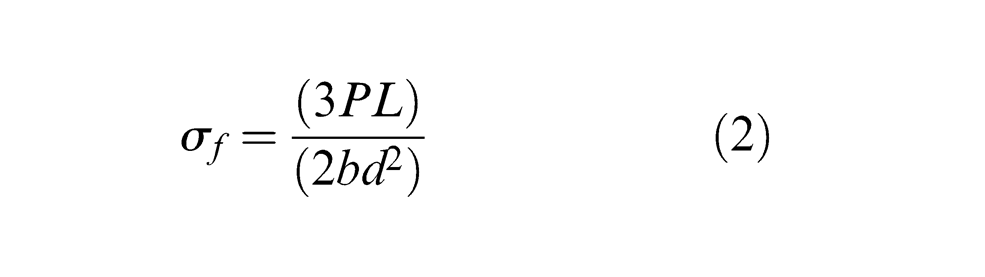
Flexural strength of a welded joint is increased with respect to the increase in the amplitude and acceleration of the specimens in terms of voltage input given to the vibromotor. It can be noted from Figure 12 that flexural strength for the weldments in the presence of vibration is superior as compared to the condition where there was no vibration.
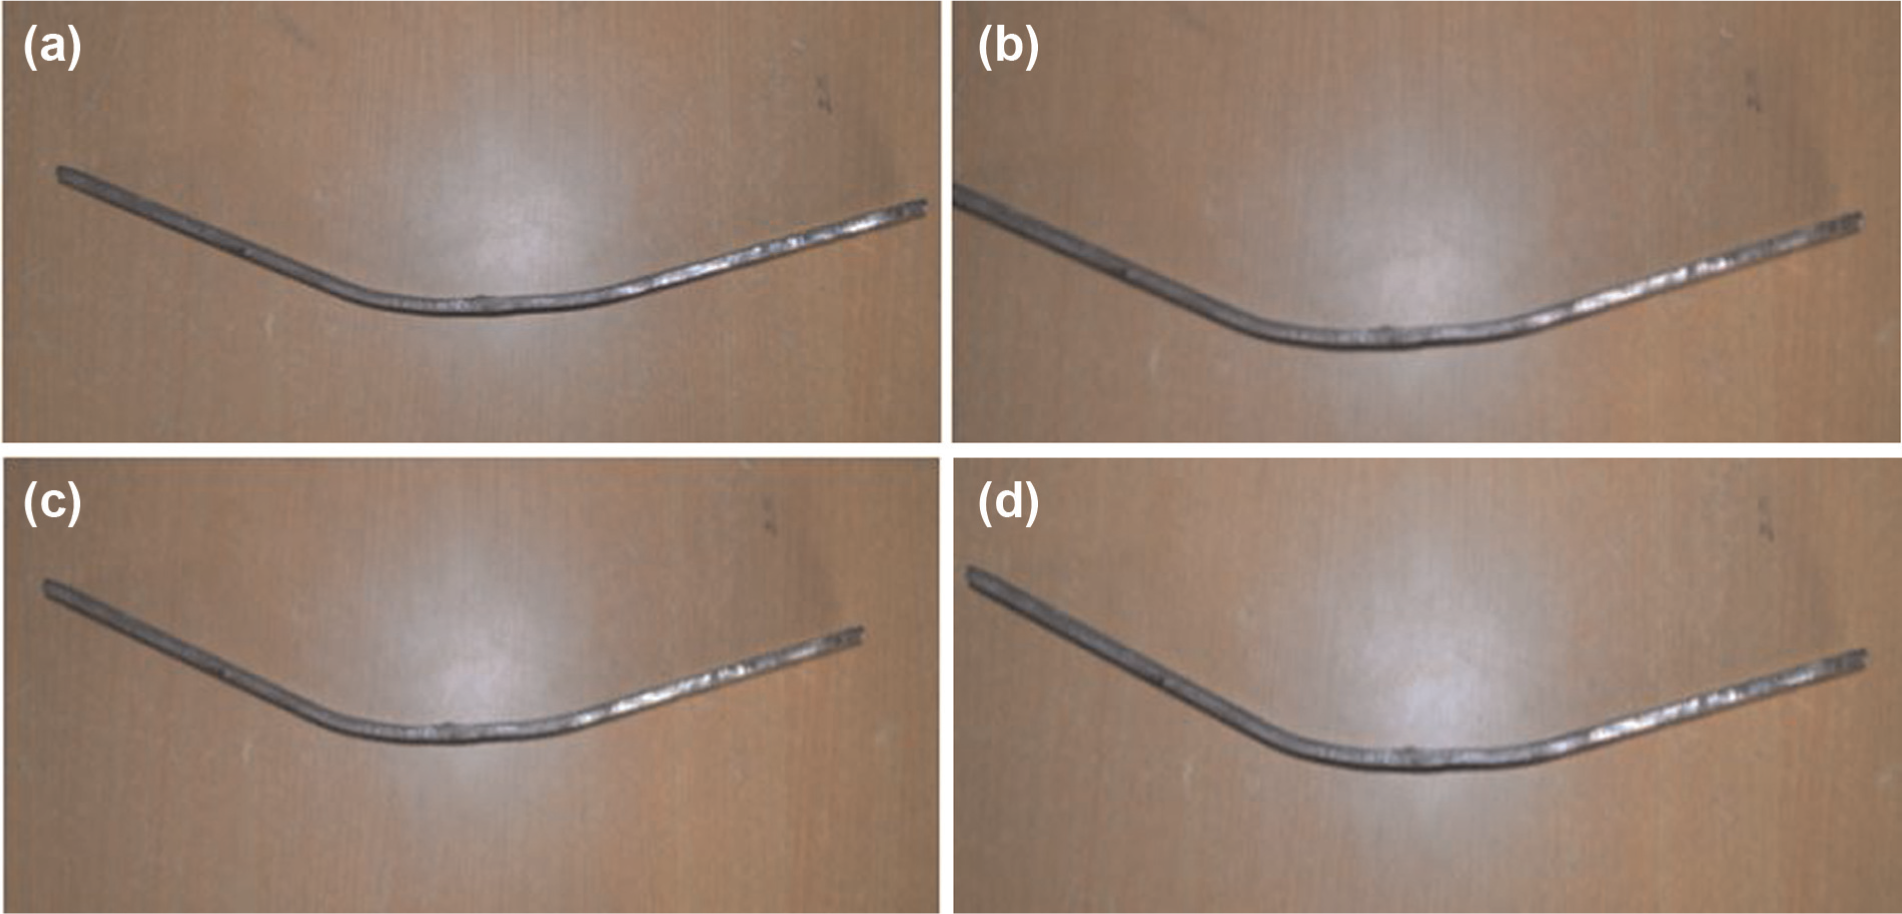
Specimen after flexural test (a) without vibration, (b) at 70& V, (c) at 150& V, and (d) at 230& V.
Ultimate tensile strength
Ultimate tensile strength or ultimate strength is the maximum stress that a material can withstand while being stretched or pulled before failing or breaking. 17 Tensile test is conducted on UTM for different specimens, which are prepared under the influence of mechanical vibration. Figure 13 represents the line diagram of actual tensile test specimen. The dimensions of the test specimen are taken from the ASTM D638 standards. 19
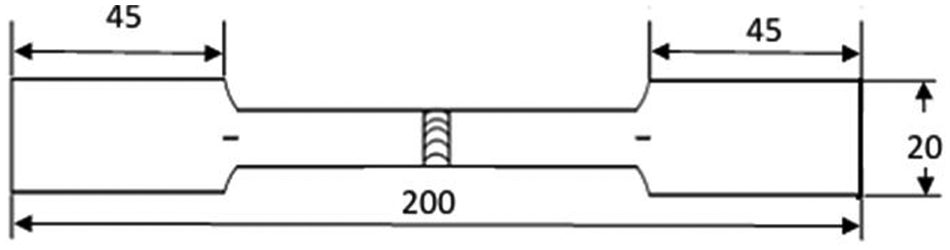
Line diagram of tensile test specimen.
The test process involves placing the test specimen in the testing machine and applying tension to it until it fractures. During the application of tension, the elongation of the gauge section is recorded against the applied force. The data are manipulated so that it is not specific to the geometry of the test sample (Figure 14). The elongation measurement is used to calculate the engineering strain
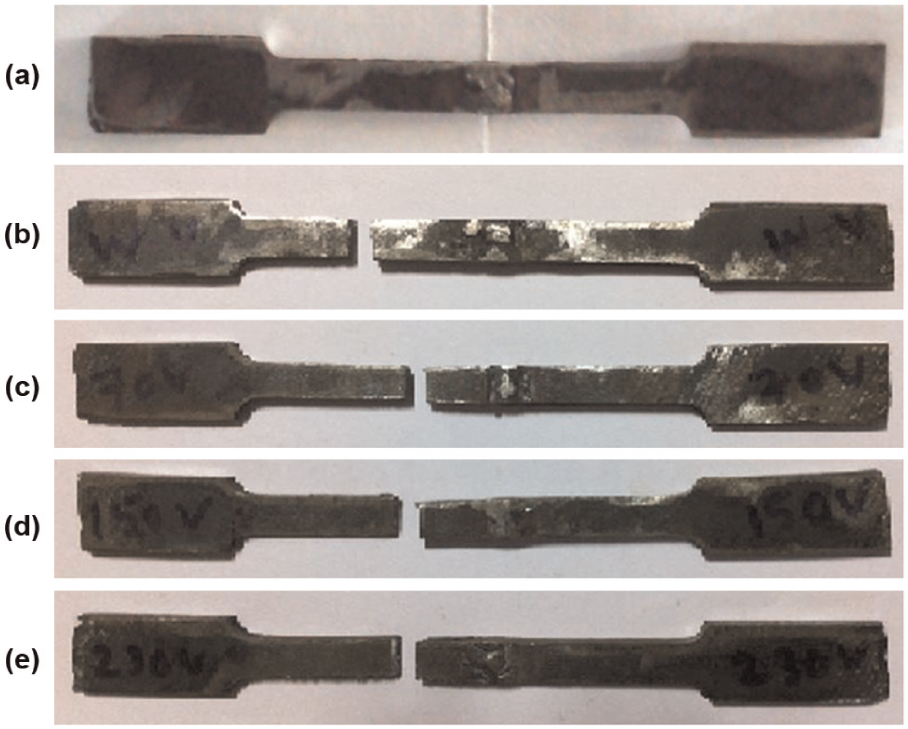
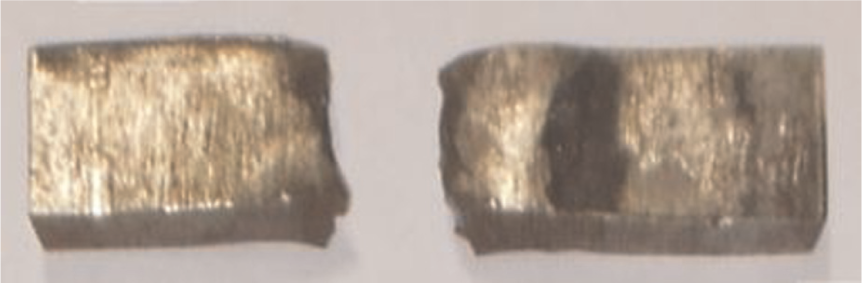
Tensile test specimen (a) before testing; (b) after testing, which was produced in the absence of vibration; (c) after testing, which was produced in the presence of vibration at 70& V; (d) at 150& V; and (e) at 230& V.
where ΔL is the change in gauge length, L 0 is the initial gauge length, and L is the final length. The force measurement is used to calculate the engineering stress, σ, using the following equation
where
Impact strength
Impact tests 17 were conducted on Izod impact testing machine. The specimens were prepared under the influence of mechanical vibration. The impact strength increases with respect to the increase in the amplitude and acceleration in terms of voltage input given to the vibromotor. Figure 15 represents the line diagram of the specimen, which shows the dimensions of the specimen, and Figure 16 shows the vibratory welded joints ready for testing. Figures 17 and 18 represent the specimens after performance of impact test.
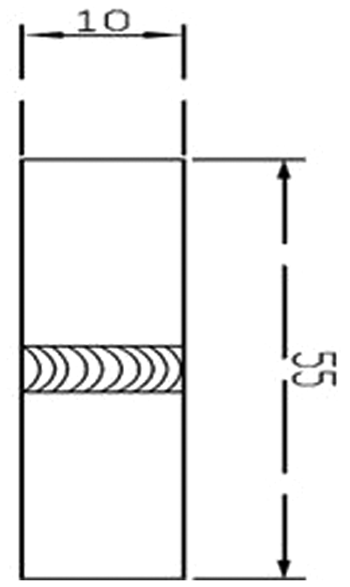
Line diagram of impact specimen.

Impact test specimen before testing.
Weld specimen without vibration after testing.
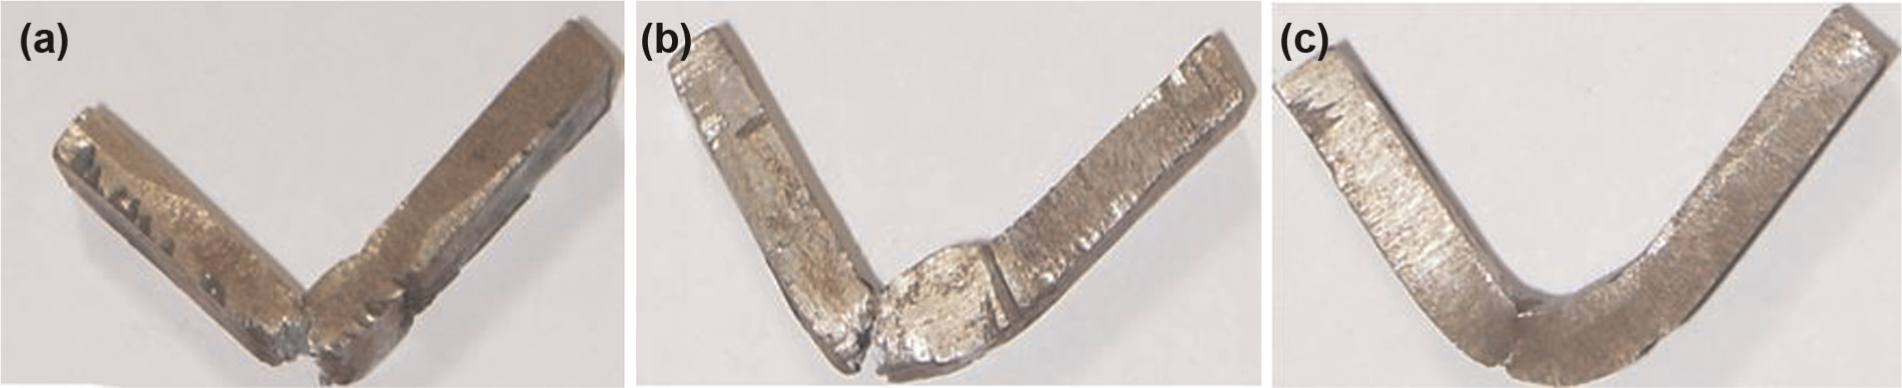
Weld specimen with vibration after testing at (a) 70& V, (b) 150& V, and (c) 230& V.
Results and discussion
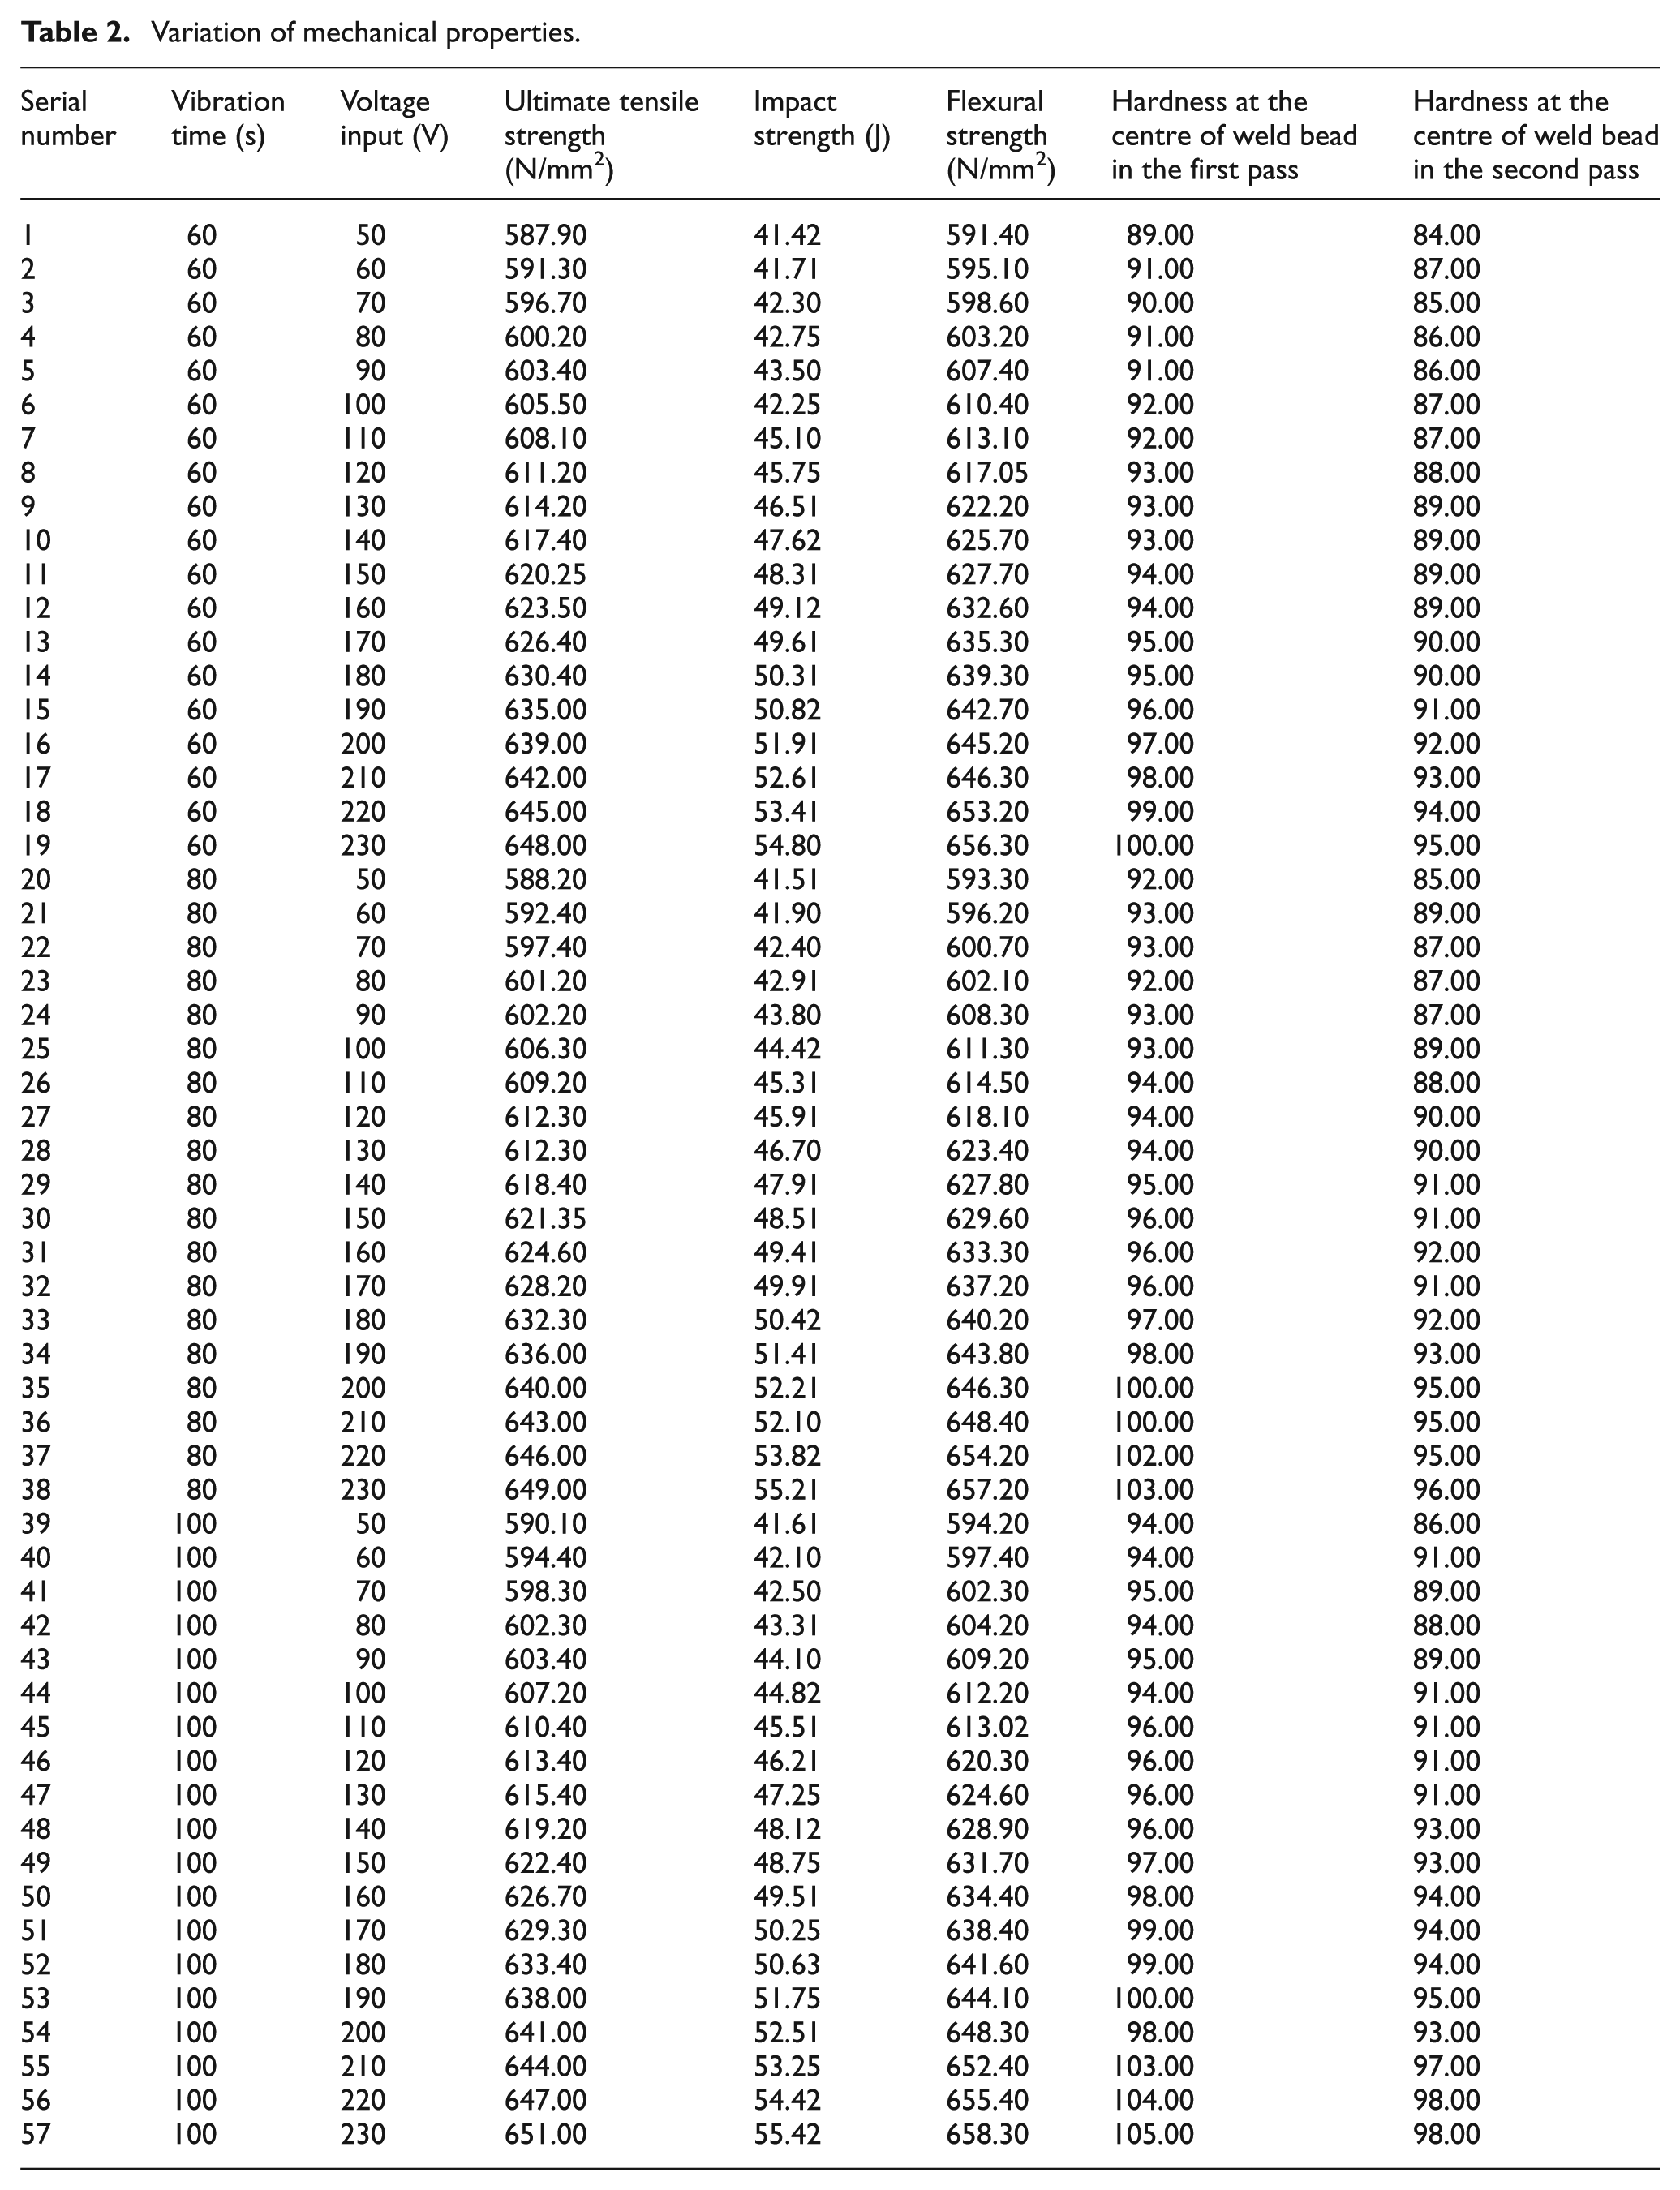
Ultimate tensile strength, flexural strength, and impact strength of the welded joints are increased and hardness of two sides of the specimens (along the weld bead and normal to the weld bead) are also improved with respect to the increase in the amplitude and acceleration of the specimens in terms of voltage input to the vibromotor. Table 2 illustrates the variation of mechanical properties with respect to voltage and the time of vibration.
Analysis was performed at the constant vibration time for 60, 80 and 100& s, and the input voltage was varied from 50 to 230& V. To better understand about the mechanical properties variation, a total of 57 of specimens were prepared at the welding parameters, as illustrated in Table 2.
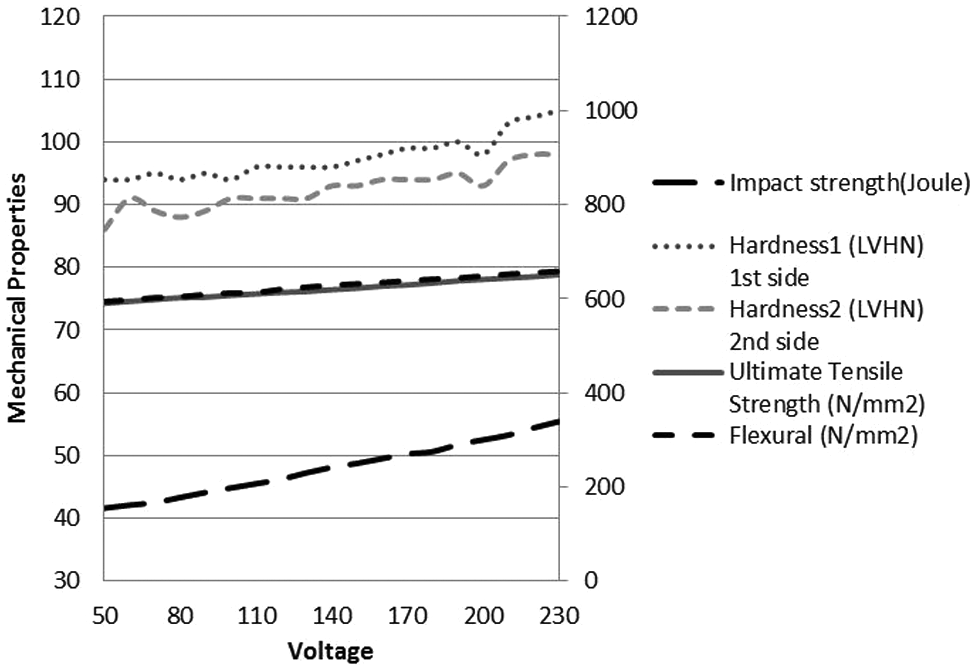
Figure 19 represents the graph of mechanical properties at the constant vibration period of 60& s. It is observed that the mechanical properties are getting better with increased voltage. Ultimate tensile strength and flexural strength are varying almost in linear manner. It is observed from Figure 19 that all mechanical properties are maintaining linear relation above the input voltage of 180& V.
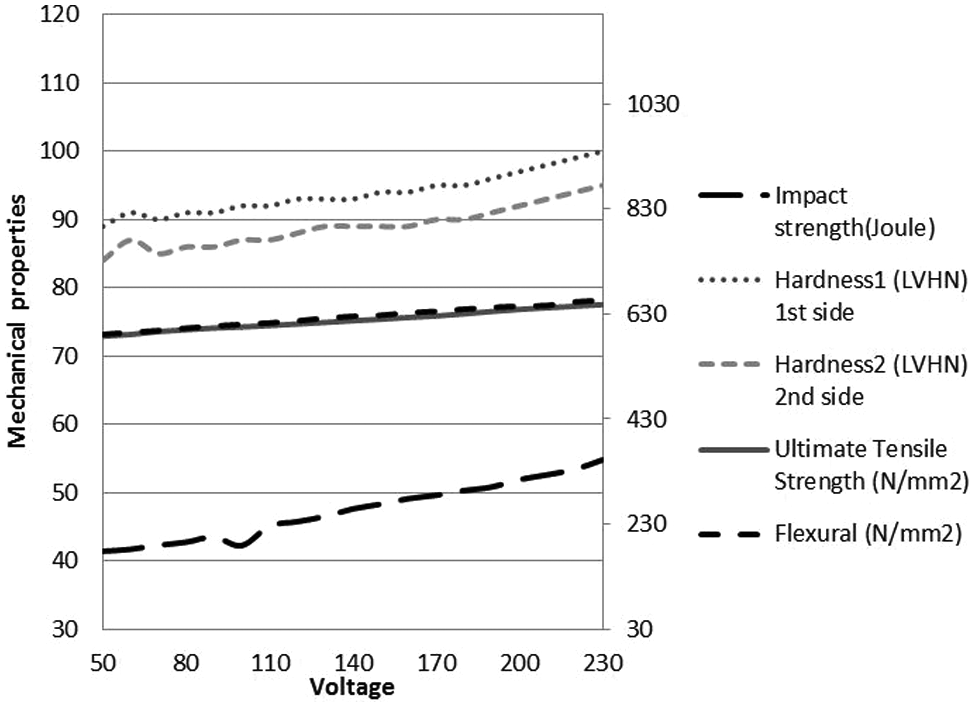
Variation of mechanical properties when vibration time is 60& s.
From the graph as represented in Figure 20, it is observed that better mechanical properties are achieved at the constant time of vibration at 80& s as compared to the time of vibration at 60& s with respect to the voltage. From the test results, it is clear that the hardness of the specimen is more sensitive while the flexural strength curve is showing linear characteristic as compared with the previous case.
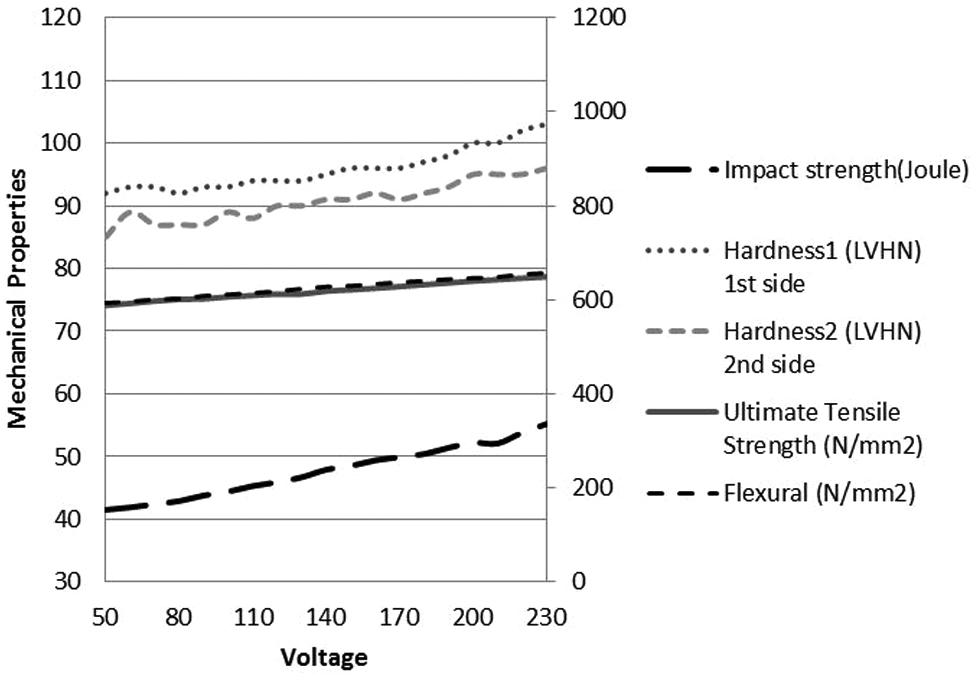
Variation of mechanical properties at the time of vibration 80& s.
Figure 21 indicates that the mechanical properties are achieved better compared with the constant time of vibration at 60 and 80& s, with increase in voltage. The tests were conducted at the constant time of vibration at 100& s. The hardness of the specimen is more sensitive while flexural strength maintains linear characteristics as compared to the previous two scenarios.
Variation of mechanical properties when the vibration time is 100& s.
Conclusion
In this present work, a new vibratory welding technique for inducing mechanical vibrations into the weld pool during welding process is proposed. The designed vibratory set-up produces the required vibrations at frequency with the amplitude and acceleration in terms of voltages. An increase in the flexural strength, impact strength, ultimate tensile strength, and hardness of the weld pieces at the HAZ is observed. The increase in mechanical properties is because of the formation of refined microstructure during the weld pool solidification. This mechanism is responsible for the improvement in flexural strength, ultimate tensile strength, impact strength, and hardness of welded joints. From the experimental results, it is clear that the mechanical properties are improved considerably with the increase in the acceleration and amplitude of the specimens.
Mechanical properties are improved with rise in the input voltage and vibration period. But these properties are not maintaining certain relation with the welding parameters.
As a future work, it is required to obtain a relationship among the mechanical properties and welding process parameters. Then the process parameters are to be optimized using some adaptive learning techniques.
Footnotes
Appendix 1
Appendix 2
Variation of mechanical properties.
| Serial number | Vibration time (s) | Voltage input (V) | Ultimate tensile strength (N/mm2) | Impact strength (J) | Flexural strength (N/mm2) | Hardness at the centre of weld bead in the first pass | Hardness at the centre of weld bead in the second pass |
|---|---|---|---|---|---|---|---|
| 1 | 60 | 50 | 587.90 | 41.42 | 591.40 | 89.00 | 84.00 |
| 2 | 60 | 60 | 591.30 | 41.71 | 595.10 | 91.00 | 87.00 |
| 3 | 60 | 70 | 596.70 | 42.30 | 598.60 | 90.00 | 85.00 |
| 4 | 60 | 80 | 600.20 | 42.75 | 603.20 | 91.00 | 86.00 |
| 5 | 60 | 90 | 603.40 | 43.50 | 607.40 | 91.00 | 86.00 |
| 6 | 60 | 100 | 605.50 | 42.25 | 610.40 | 92.00 | 87.00 |
| 7 | 60 | 110 | 608.10 | 45.10 | 613.10 | 92.00 | 87.00 |
| 8 | 60 | 120 | 611.20 | 45.75 | 617.05 | 93.00 | 88.00 |
| 9 | 60 | 130 | 614.20 | 46.51 | 622.20 | 93.00 | 89.00 |
| 10 | 60 | 140 | 617.40 | 47.62 | 625.70 | 93.00 | 89.00 |
| 11 | 60 | 150 | 620.25 | 48.31 | 627.70 | 94.00 | 89.00 |
| 12 | 60 | 160 | 623.50 | 49.12 | 632.60 | 94.00 | 89.00 |
| 13 | 60 | 170 | 626.40 | 49.61 | 635.30 | 95.00 | 90.00 |
| 14 | 60 | 180 | 630.40 | 50.31 | 639.30 | 95.00 | 90.00 |
| 15 | 60 | 190 | 635.00 | 50.82 | 642.70 | 96.00 | 91.00 |
| 16 | 60 | 200 | 639.00 | 51.91 | 645.20 | 97.00 | 92.00 |
| 17 | 60 | 210 | 642.00 | 52.61 | 646.30 | 98.00 | 93.00 |
| 18 | 60 | 220 | 645.00 | 53.41 | 653.20 | 99.00 | 94.00 |
| 19 | 60 | 230 | 648.00 | 54.80 | 656.30 | 100.00 | 95.00 |
| 20 | 80 | 50 | 588.20 | 41.51 | 593.30 | 92.00 | 85.00 |
| 21 | 80 | 60 | 592.40 | 41.90 | 596.20 | 93.00 | 89.00 |
| 22 | 80 | 70 | 597.40 | 42.40 | 600.70 | 93.00 | 87.00 |
| 23 | 80 | 80 | 601.20 | 42.91 | 602.10 | 92.00 | 87.00 |
| 24 | 80 | 90 | 602.20 | 43.80 | 608.30 | 93.00 | 87.00 |
| 25 | 80 | 100 | 606.30 | 44.42 | 611.30 | 93.00 | 89.00 |
| 26 | 80 | 110 | 609.20 | 45.31 | 614.50 | 94.00 | 88.00 |
| 27 | 80 | 120 | 612.30 | 45.91 | 618.10 | 94.00 | 90.00 |
| 28 | 80 | 130 | 612.30 | 46.70 | 623.40 | 94.00 | 90.00 |
| 29 | 80 | 140 | 618.40 | 47.91 | 627.80 | 95.00 | 91.00 |
| 30 | 80 | 150 | 621.35 | 48.51 | 629.60 | 96.00 | 91.00 |
| 31 | 80 | 160 | 624.60 | 49.41 | 633.30 | 96.00 | 92.00 |
| 32 | 80 | 170 | 628.20 | 49.91 | 637.20 | 96.00 | 91.00 |
| 33 | 80 | 180 | 632.30 | 50.42 | 640.20 | 97.00 | 92.00 |
| 34 | 80 | 190 | 636.00 | 51.41 | 643.80 | 98.00 | 93.00 |
| 35 | 80 | 200 | 640.00 | 52.21 | 646.30 | 100.00 | 95.00 |
| 36 | 80 | 210 | 643.00 | 52.10 | 648.40 | 100.00 | 95.00 |
| 37 | 80 | 220 | 646.00 | 53.82 | 654.20 | 102.00 | 95.00 |
| 38 | 80 | 230 | 649.00 | 55.21 | 657.20 | 103.00 | 96.00 |
| 39 | 100 | 50 | 590.10 | 41.61 | 594.20 | 94.00 | 86.00 |
| 40 | 100 | 60 | 594.40 | 42.10 | 597.40 | 94.00 | 91.00 |
| 41 | 100 | 70 | 598.30 | 42.50 | 602.30 | 95.00 | 89.00 |
| 42 | 100 | 80 | 602.30 | 43.31 | 604.20 | 94.00 | 88.00 |
| 43 | 100 | 90 | 603.40 | 44.10 | 609.20 | 95.00 | 89.00 |
| 44 | 100 | 100 | 607.20 | 44.82 | 612.20 | 94.00 | 91.00 |
| 45 | 100 | 110 | 610.40 | 45.51 | 613.02 | 96.00 | 91.00 |
| 46 | 100 | 120 | 613.40 | 46.21 | 620.30 | 96.00 | 91.00 |
| 47 | 100 | 130 | 615.40 | 47.25 | 624.60 | 96.00 | 91.00 |
| 48 | 100 | 140 | 619.20 | 48.12 | 628.90 | 96.00 | 93.00 |
| 49 | 100 | 150 | 622.40 | 48.75 | 631.70 | 97.00 | 93.00 |
| 50 | 100 | 160 | 626.70 | 49.51 | 634.40 | 98.00 | 94.00 |
| 51 | 100 | 170 | 629.30 | 50.25 | 638.40 | 99.00 | 94.00 |
| 52 | 100 | 180 | 633.40 | 50.63 | 641.60 | 99.00 | 94.00 |
| 53 | 100 | 190 | 638.00 | 51.75 | 644.10 | 100.00 | 95.00 |
| 54 | 100 | 200 | 641.00 | 52.51 | 648.30 | 98.00 | 93.00 |
| 55 | 100 | 210 | 644.00 | 53.25 | 652.40 | 103.00 | 97.00 |
| 56 | 100 | 220 | 647.00 | 54.42 | 655.40 | 104.00 | 98.00 |
| 57 | 100 | 230 | 651.00 | 55.42 | 658.30 | 105.00 | 98.00 |
Declaration of conflicting interests
The authors declare that there is no conflict of interest.
Funding
This research received no specific grant from any funding agency in the public, commercial, or not-for-profit sectors.