
Abstract
Microwave absorption properties of radar absorbing structures in X-band frequency have been investigated using carbon-based dielectric filler materials. These structures are composed of E-glass/epoxy laminates filled with various wt% (0–2.5 with an increment of 0.5) of graphene and multiwalled carbon nanotubes individually. Composite fabrication has been done using high-pressure resin transfer molding (HPRTM). The pertinent electromagnetic (EM) parameters of composite structures are measured using the waveguide measurement technique in X-band. From the results, a single-layered polymer composite with 2.5% graphene contains better absorption than others. Among multilayered structures, the 11-layered composite structure has shown the best absorption performance (reflection loss (RL) = −21 dB) which is equal to 99.9% of incident EM radiation absorption in X-band. It is found that the single-layered structure has shown ineffective absorption performance compared to the multilayered structure under low weight concentrations. Moreover, a mathematical model to predict RL of different combinations of multilayered structures based on EM wave theory is proposed for the calculation of optimum layer combination for minimizing time and money. The predictions of the mathematical model are validated for the 11-layered structure using experimentation.
Keywords
Introduction
The development of radar absorbing structures (RASs) and radar absorbing materials (RAMs) for radar cross-section (RCS) reduction technology has gained precedence due to their safety in warfare to protect the aircraft against radar detection. 1 -4 Among these two, RAS has more importance in terms of mechanical strength. 3 In this connection, the advanced techniques to develop RASs and composite structures that are made of multiple filler materials have paramount importance in RCS reduction. The typical manufacture of RAS involves the use of compounds which are efficient in producing dielectric and/or magnetic losses. Whenever the surface is impinged by an external electromagnetic (EM) wave, the target should be capable of minimizing the reflection loss (RL). 2
The fabrication of RAS is usually being carried out using polymer composite materials with epoxy, polyvinyl chloride, wood plastic, phenol formaldehyde, and so on, as base polymers due to their flexibility and ease of production. The absorption performance of materials can be improved by altering their EM properties, which can be achieved with the polymer composites while using either pure dielectric or magnetic materials as fillers. 3 Compared to traditional metal-based RAM, carbon materials/polymer-based composites have gained quality popularity owing to their lightweight, flexibility, ease of processing, and resistance to corrosion. 1 -7 In this context, microwave absorption studies using nanocomposite materials with different fillers such as carbonyl iron (CI), carbon nano fibers (CNF), carbon black (CB), multiwalled carbon nanotube (MWCNT), and graphene nanoplatelets have been reported. 1 -6 Epoxy resin was chosen as the polymer matrix in all these studies and it is reported that RL of CB-, CNF-, and CI-based composite structures is around −5 dB in X-band. 1 -4 The excellent EM properties of both MWCNT and graphene have made them popular fillers. 3 It is reported that complex permittivity of the composite material can be enhanced with low wt% of MWCNTs due to their excellent electrical conductivity and aspect ratios. 5,7 -10 From recent studies, it has been established that graphene has substantial physical EM and electrical properties. 3,10 -15 Moreover, the two-dimensional structure of graphene has sp 2 hybridization and it can be the reason for the aforementioned properties. Researchers have reported that a combination of graphene with polymer leads to enhanced multifunctional properties such as electrical conductivity, EM absorption capability, and flexibility. 16 -20 Finally, it is perceived that both MWCNT and graphene materials possess excellent dielectric properties and hence these materials have been chosen as fillers for the current study. It should be noted that this work is an extension of the authors’ previous studies. 21 -24 Higher wt% of filler material results in a reduction in the structure absorption performance because of intermolecular collisions among filler materials due to agglomeration phenomenon. 5,6,9
Multilayered RASs have shown broad bandwidth (which is more than 90% absorption in 2.1 GHz range) compared to the single-layered structure in the same X-band. 5,6,9 EM wave absorption analyses of the single-layered structure have been recently proposed by many authors. 1 -4,7-8,10 -21,23,24 It is perceived, to the best of the authors’ knowledge, that studies on multilayered RASs with low weight concentrations of fillers have not yet been reported.
Though EM wave absorption performance of multilayered structures is admirable, it requires a considerable investment of time and money to fabricate and test composites with various combinations of filler materials. The authors would like to propose a mathematical model to predict the RL of different combinations of multilayered structures based on EM wave theory. Absorption performance is measured in terms of RL for both single- and multilayered structures. In this work, two filler materials, MWCNT and graphene, are chosen to fabricate single-layered structures separately. Further, the physical model of multilayered structures with different wt% of filler materials and calculation of RL are presented, where EM properties of individual wt% of MWCNT and graphene are inserted from experimental measurements. Furthermore, an optimum multilayered structure that has the best absorption performance will be validated with experimental results.
Materials and methods
Materials
Filler materials used for the fabrication of nanocomposites are graphene with 95% purity, 6–8 nm thickness, and 120–150 m2/g surface area, glass fiber E-glass mate 610 GSM, epoxy resin LY 556, and hardener HY 951. Graphene powder is supplied by Sigma Aldrich India. Resin, hardener, and E-glass are supplied by RAM composites, India.
Fabrication of nanocomposite
Graphene is dispersed at various weight percentages (0.5–2.5 with an increment of 0.5) separately in the epoxy resin and stirred for 60 min using bath sonicator at a speed of 1000 r/min. The authors have tried many combinations and ensured the homogeneity of the mixture. Among all combinations, this combination (time 60 min and speed 1000 r/min) has been observed to give better homogeneity and for this reason, authors have used this combination and the same has been affirmed with literature. 3,10,12 The solution is then brought to a probe sonicator and sonication is done at 50 MHz for a 90-min time period. The sonication time is chosen based on previous research studies 3,10,12,15,22 which showed maximum graphene dispersion in the base fluid. The sonicated graphene/epoxy solution thus obtained is added to hardener. The ratio of hardener to epoxy/graphene mixture is maintained at 11:100 wt%. The same procedure is repeated for all wt% of graphene. The sonication of the graphene/epoxy/hardener mixture is done for 15 min individually to obtain a stable solution.
The fiber is sized into 25 × 15 mm2 rectangle shape and drenched with a prepared epoxy hardener mixture. Furthermore, these layers were stacked closely and compressed steadily until the fabricated sample thickness is 2 mm (for both single- and multilayered structures). Later, curing is done at room temperature for 24 h. In this work, composite laminates are fabricated using curing plates. The weight of each plate is 25.75 kg and the maximum load applied on the sample is a bit higher than 25.75 kg since plates are fixed with screws.
Characterization
The surface morphology along with the distribution of graphene/epoxy composite around glass fiber is observed using field emission scanning electron microscope and elemental analysis is done using energy-dispersive X-ray spectroscopy (EDS) as presented in Figure 1. The surface morphology of raw graphene presented in Figure 1(a) shows the flake structure of graphene. Generally, microwave absorption performance of material could increase by increasing internal reflections and scatterings in between flake structured interface. 20,24 The elemental composition of graphene powder is measured using EDS which is shown in Figure 1(b). A concentrated area is considered as the graphene powder which is shown in Figure 1(b) and the corresponding spectrum is shown in Figure 1(b). It is observed from Figure 1(b) that carbon and oxygen are presented in raw graphene powder. Their atomic concentrations are 95% and 5%, respectively. Carbon–oxygen ratio, specific surface, and surface morphology are the most important parameters to affect the microwave absorption. 19
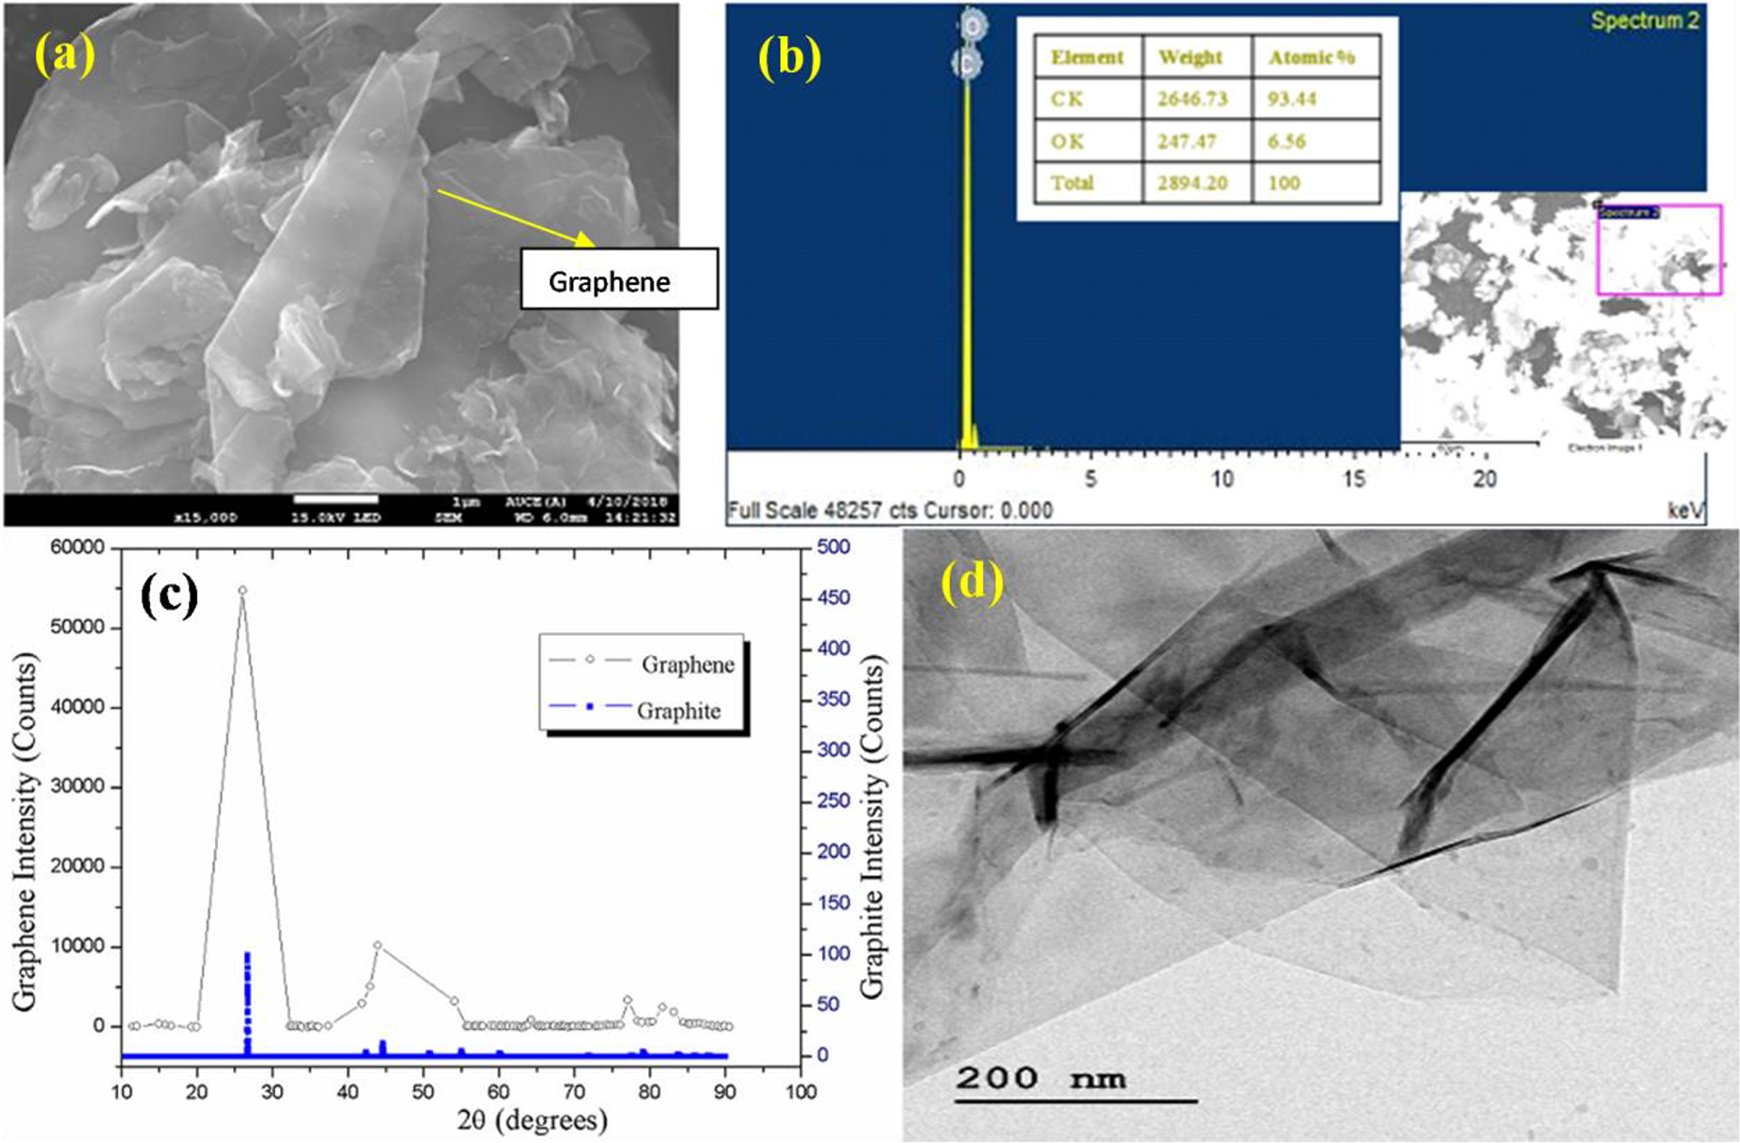
(a) FESEM image for graphene powder, (b) EDS analysis image and spectrum for graphene powder, (c) XRD pattern comparison of graphene and graphite, and (d) TEM analysis of graphene.
The X-ray diffraction technique has been used to evaluate the crystalline structure and chemical composition of graphene. This technique is performed with an incident angle of 2θ ranging from 10.0154° to 90.9524°. The comparison of graphene intensity with graphite is shown in Figure 1(c). It is perceived from Figure 1(c) that maximum intensity occurs at 26.0344° for graphene with 3.41985 Å value of “d” spacing. The maximum value of single-crystalline graphite is observed at an incident angle of 26.5°. Hence, it is concluded that the graphene possesses a highly crystalline structure. Recorded transmission electron microscope micrographs are examined for graphene structure at 200 nm scale which is shown in Figure 1(d) and the wrinkled graphene sheet is observed. This renowned characteristic of graphene flake structure and this lattice damage is attributed to chemical and thermal oxidation processes. One more observation that is recorded is the high transparency of structure which specifies a low number of atomic layers.
Measurement of EM properties
The fabricated nanocomposite material is cut into specific dimensions (22.86 × 10.16 mm2) for the waveguide measurement method to measure EM properties. Vector network analyzer with model number ROHDE & SCHWARZ ZVB20 (R&S®ZVB20) is operated in X-band (8.2–12.4 GHz) frequency range while measuring EM properties. The network analyzer is calibrated through TRL (thru, reflect, line) technique, before the experimentation. EM properties, both permittivity and permeability of the samples, are obtained from S-parameters and those are evaluated with the help of Nicholson–Ross–Weir algorithm, as it uses regressive/iterative analysis.
Modeling of RAS
The multilayered structures are designed in such a way that they should attain the RL of less than −12 dB for the EM radiation incident normal to the plane. Experimental work has been carried out for single-layered composite and mathematical modeling is proposed to measure RL of multilayered structures in X-band. Single-layered structure EM properties are measured experimentally and later these values will be used in the physical model of multilayered structures. The schematic layout of the multilayered structure with the general scheme has been shown in Figure 2 and the layer is denoted with the symbol x.

Microwave/EM absorbing multilayered structure.
Referring to Figure 2, zx indicates the characteristic impedance, Zix indicates the input impedance, tx is the layer thickness, and εx and µx are relative complex permittivity and relative complex permeability of xth layer, respectively. Ex is the electric field and ηx is the intrinsic impedance of the xth layer. The maximum number of layers is fixed to 11 and the layer thickness set at 2 mm. The order of layers is determined in accordance with the microwave characteristic impedance matching law. Perfect electric conductor (PEC) is used behind the last layer and the reason is that it arrests the further transmission of EM radiations. PEC is the starting layer (i.e. 0th layer) for both single- and multilayered structures.
RL of both single- and multilayered structures can be evaluated for RAM applications using the following equation: 5,6,9

Here Z 0 (free space impedance) value is 377 Ω and Zix is input impedance at the first air-absorber interface. Zix of the multilayer, backed by PEC, can be expressed using equation (2) for each layer x.

Here i indicates the input, if Zi (x−1) = 1 then the equation is applicable for a single-layered structure. Where kx is the wavenumber and can be estimated using the following equation:

where “f ” indicates the frequency of incident EM radiation in Hz,

Here µ 0 = 4π × 10−7 H/m and ε 0 = 8.85 × 10⁻¹² F/m are free space permeability and permittivity, respectively.
Results and discussion
EM properties of single-layered composite
The EM properties of single-layered composites filled with 0–2.5 wt% MWCNT have been measured experimentally in the previous studies. 22 Also, the fabricated graphene/epoxy single-layered structures were brought to measure EM properties using the waveguide measurement technique. Here, X-band waveguides were used to measure EM properties and the network analyzer was calibrated using the TRL technique. Relative complex permittivity (ε = ε′ − iε″) and relative complex permeability (µ = µ′ − iµ″) of various graphene wt% based polymer nanocomposites have been shown in Figure 3(a) to (d).

(a) to (d) Variation of the EM properties of single-layered composites with different graphene wt% (0, 0.5, 1, 1.5, 2, and 2.5) in X-band.
The variation of both real and imaginary permittivity in the microwave frequency range is mainly caused due to atomic, electronic polarization and it is accredited to polarization point defects and bound charges. 12 The fundamental characteristic of real part of permittivity (ε′) is the ability to store external EM energy. The free electrons in the material enhance EM energy scattering capacity from an outer field, thereby generating heat and this phenomenon is quantified by the imaginary part of relative complex permittivity (ε″). It is observed from Figure 3(a) that ε′ is increasing with weight percentage of graphene in the entire X-band. Basically, the average distance between filler particles is decreasing with an increase in wt% of the filler. Hence, the localized charge will be induced in filler due to the effect of interfacial polarization. Net polarization of the composite is increasing with filler wt%, and it results in either an increase or decrease of the dielectric constant of the material which is measured in terms of the real part of permittivity. Moreover, the net polarization of the composite directly depends on filler material net dielectric constant. It is observed from Figure 3(a) that the combined effect of net polarization in the composite and interfacial polarization in the filler has enhanced the composite dielectric constant. It can also be observed from Figure 3 (a) and (b) that the permittivity is almost constant with frequency because of the permanent dipoles present in the filler materials.
Real part of relative complex permeability (µ′) and imaginary part of relative complex permeability (µ″) of fabricated samples is shown in Figure 3(c) and (d), respectively. Complex permeability of graphene/epoxy composites is very low (of the order of 0.4–1.2) because of the nonmagnetic nature of graphene. It is perceived from Figure 3(c) that the real permeability of graphene is approximately 1 and it affirms the literature. 3,10 Imaginary permeability indicates the magnetic losses in the composite structures. For dielectric materials, imaginary permeability is “0.” But in this case, µ″ is little higher than “0” as shown in Figure 3(d) because of the magnetic nature of graphene in EM field. 10
Microwave absorption performance of single-layered RAS
RL of the composite materials basically depends on different parameters like thickness, weight percentage of the filler materials, particle size of the filler material, and so on. Here, the influence of weight percentage of the filler dispersed in epoxy resin is presented. Responses of composite materials with various weight percentages of filler material are shown in Figure 4. The RL increases with filler material wt% in X-band. It is noticed that RL for 0.5 wt% of graphene varies from −7.9 dB to −9.4 dB, and for 2.5 wt% of graphene varies from −9.3 dB to −10.4 dB in X-band.

Effect of filler wt% on RL.
When graphene is used in single-layered structures, the increase in RL is accredited to their dielectric loss which is apparent from their natural high conductivity. The presence of huge interfaces between epoxy and graphene in epoxy/graphene composites improves interfacial polarization. The real part of permittivity is increasing with filler wt% as discussed above, and then it improves the field holding capacity. Moreover, the interfacial polarization has also affected the electrical strength and field holding capacity as stated in the literature. 10,19 EM interaction within the multipoles at polarized interfaces affects the microwave absorption of the graphene–epoxy composites. The existence of complex permittivity differences between graphene and epoxy in one composite structure has resulted in interfacial scattering. Hence, multiple reflections take place within the randomly oriented sheet-like structure and EM radiation holding capacity of composite has improved.
It is reported that the multiple reflections within the graphene/epoxy composite will be increasing the propagation of EM radiation and this statement can be corroborated with impedance matching conditions. 10,19 Moreover, attenuation constant and alternating current (AC) conductivity influence the absorption capability of composite structures and the following sections describe them in detail.
Effect of AC electrical conductivity
Dielectric loss of composite material depends on its AC electrical conductivity (σ AC) since it affects the absorption capability of the composite. Hence, electrical conductivity indirectly influences the microwave absorption of the composite. AC electrical conductivity (σ AC) of epoxy-based graphene polymer composite materials is calculated using equation (5) and their response with respect to frequency is shown in Figure 5.
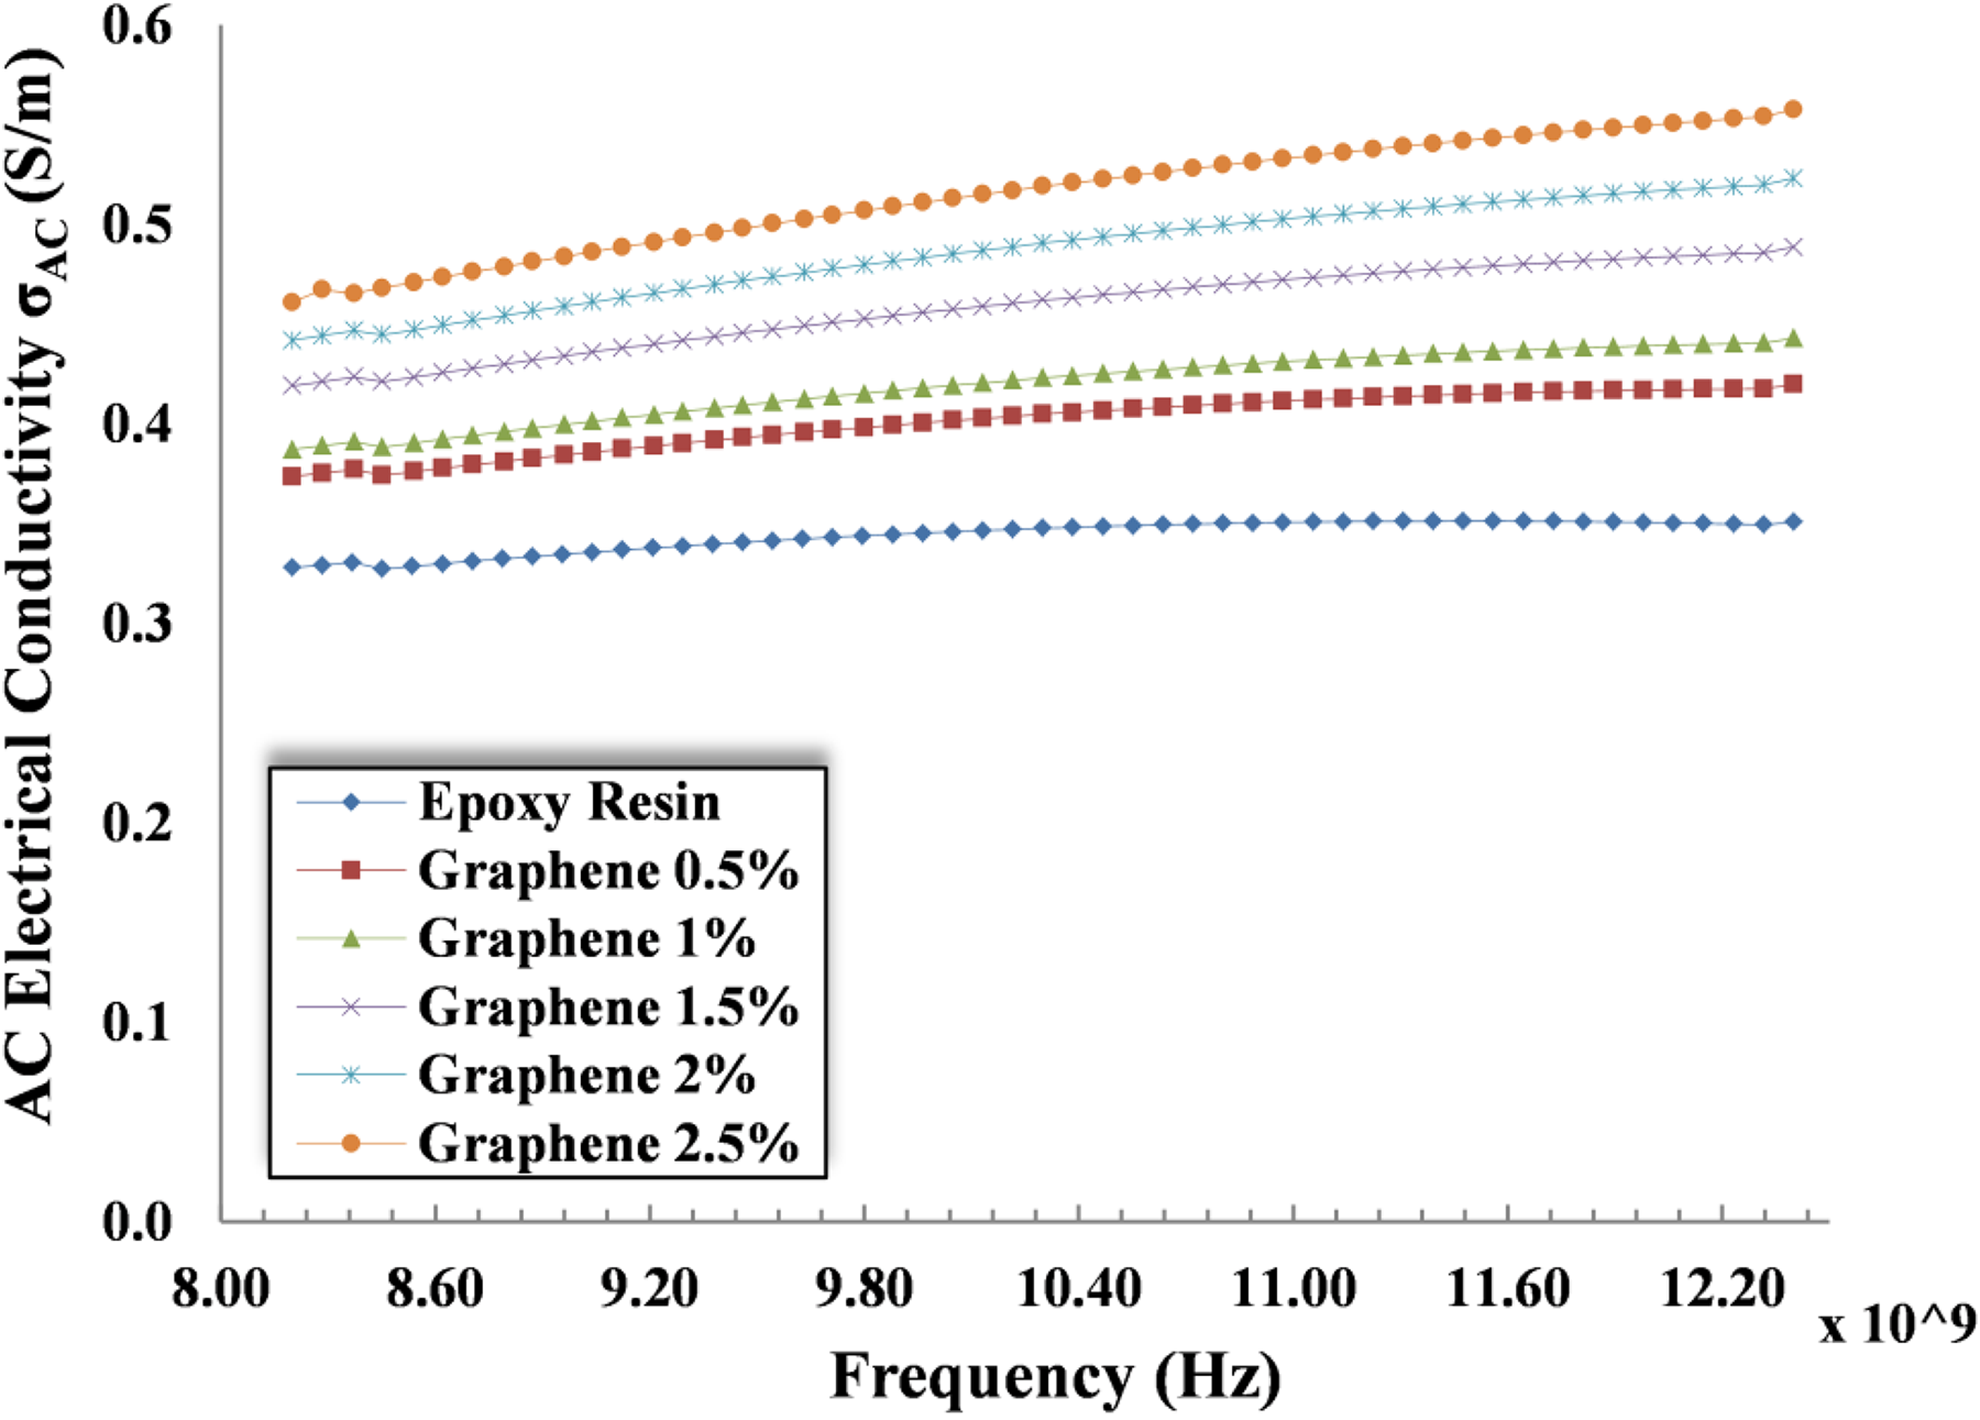
AC electrical conductivity variation in X-band.

Here f indicates the input frequency and ε 0 and ε″ are the free space permittivity and the imaginary part of complex relative permittivity, respectively. From EM theory, conductivity in composite material arises due to three mechanisms. As per the first mechanism, conducting charge is induced in graphene/epoxy composite due to EM fields, the second mechanism arranges a passageway of charge particles through the thin epoxy layer in between graphene flakes, and the last mechanism allows conductivity through the shortest distance between graphene particles. 19 Among these, second and third mechanisms highly influence the conductivity induced in composite materials and also depend on the type of the filler and its concentration. Basically, AC conductivity is a frequency-dependent parameter and percolation threshold is the main cause for this behavior. Also, Koop’s theory explains the effect of grains and grain boundaries on AC conductivity at higher frequencies (>104). It is observed from Figure 5 that pure epoxy composite exhibits very low value (0.35 S/m) of electrical conductivity when compared to the remaining, which is due to the lack of mobility of charge carriers through the composite. It is resulting from cluster formation while adding graphene to epoxy. It is observed from Figure 5 that, at 12.4 GHz frequency, AC conductivity certainly falls within 0.35–0.55 range because the mobility of charge carriers in graphene is higher than pure epoxy composite.
Effect of impedance matching condition
Input impedance Z in is calculated using equation (6), its absolute values are presented in Figure 6(a) and the ratio of input impedance to free space impedance is shown in Figure 6(b).
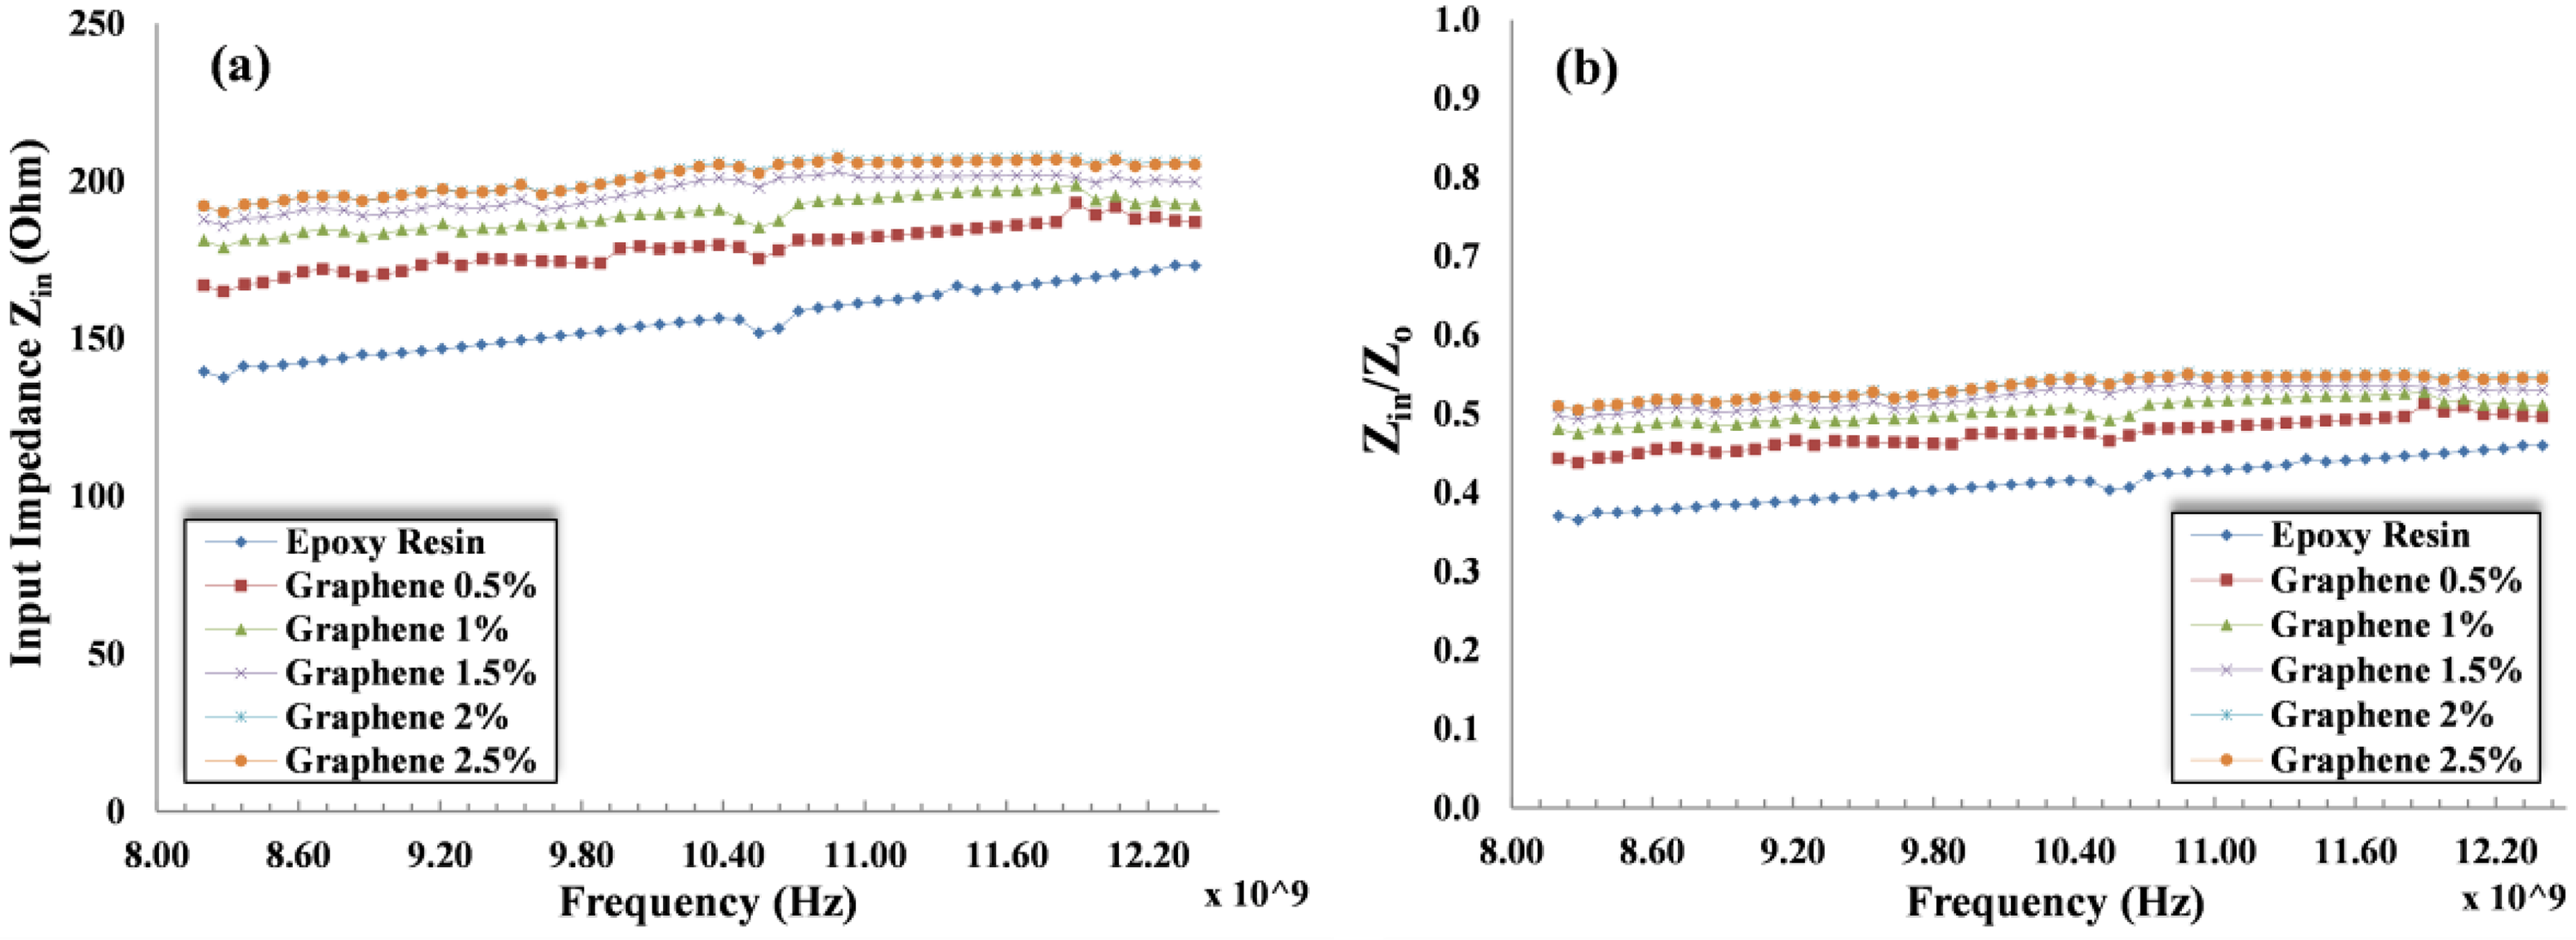
(a) Frequency response of absolute input impedance and (b) frequency response of Z in/Z 0.

where Z 0 ≈ 377 Ω is the free space impedance; µr and εr are the relative permittivity and permeability, respectively; t is the thickness of the composite structure; and c is the velocity of light. Microwave absorption performance of structure depends on how much energy is incident on the surface of the structure and also how much energy has penetrated the surface of the structure. This can be predicted using the value of input impedance. To achieve the maximum amount of microwave energy propagation, Zin should be equal to Z 0 (377 Ω). Similarly, another absorption mechanism is possible in the case of single-layered structures wherein there is a possibility of observing strong RL at the surface because of the cancellation of two microwaves at the absorber interface. 23 As a consequence of this mechanism, it is believed that at the point where real and imaginary parts of Zin will become 377 Ω and zero, respectively, the structure exhibits minimal RL value. From Figure 6(a), the absolute input impedance value of 2.5 wt% graphene composite was observed as 206.648 Ω which was close to Z 0 and higher than pure epoxy resin. Similarly, Zin values of 2 and 2.5 wt% graphene composites were very close to each other and this Zin /Z 0 value is approximately 0.5, which can be seen from Figure 6(b). Finally, it is concluded that 2 and 2.5 wt% graphene/epoxy composites can absorb more microwave radiations than other composites.
Effect of attenuation constant (α)
Attenuation constant (α) of a composite material describes the microwave absorption ability of the structure. It is calculated using equation (7) and frequency response of attenuation constant is shown in Figure 7(a).
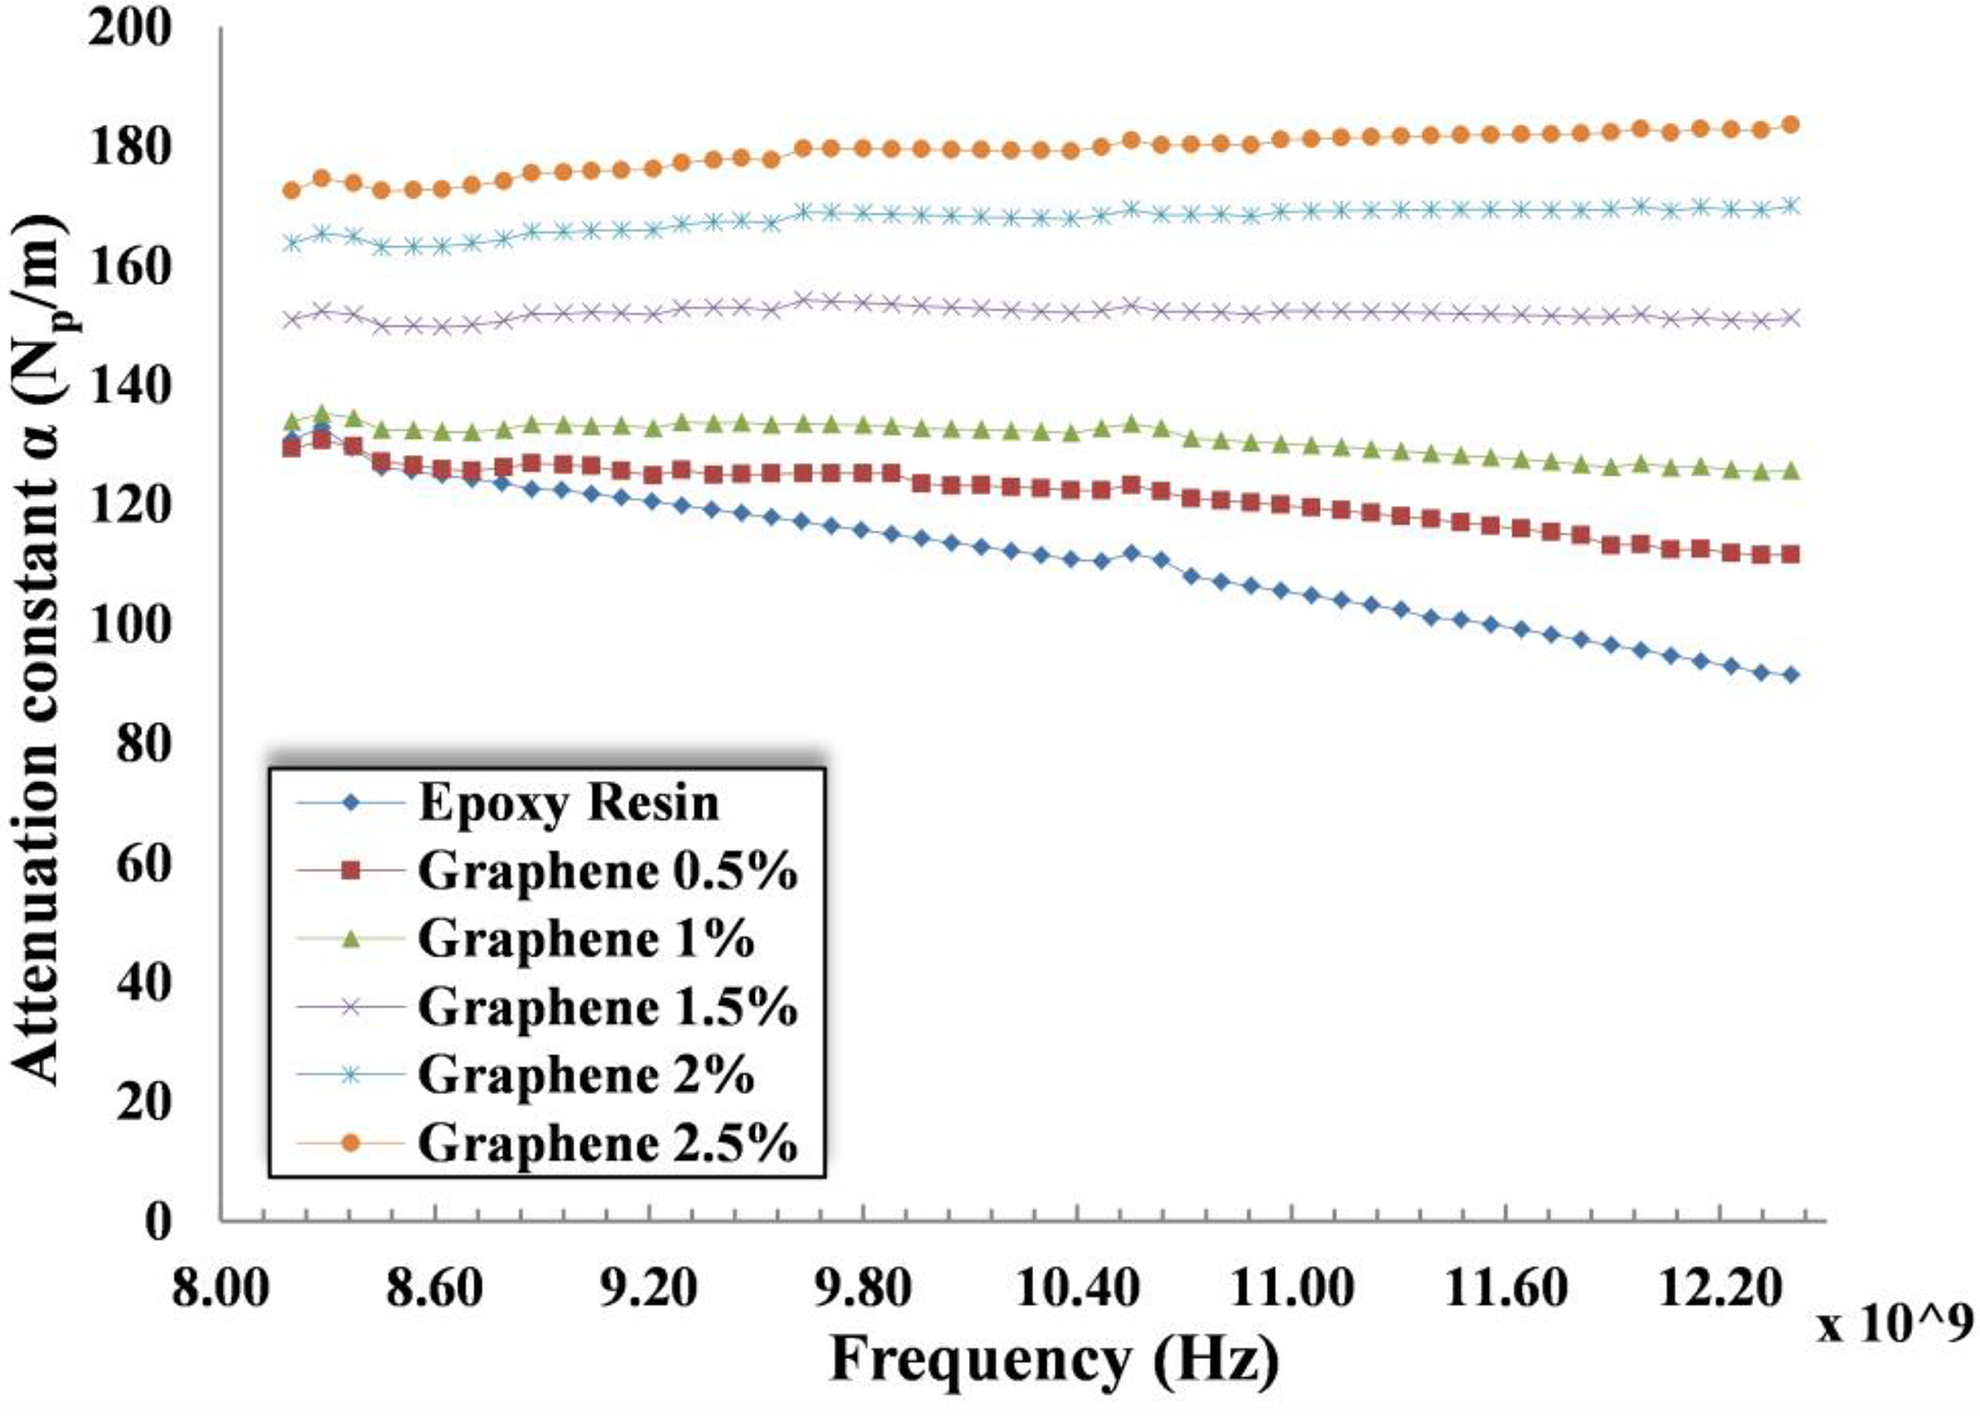
AC properties for single-layered graphene/epoxy composites in X-band.

It is observed from Figure 7(a) that graphene 2.5 wt%/epoxy composite has high α value when compared to other composites. As discussed above, graphene 2.5 wt% has a higher Z 0 and it allows the microwave radiations into the composite, thereby enhancing the absorption capability on account of multiple reflections inside the composite. Microwave attenuation constant depends on dielectric and magnetic losses in addition to layered structure, aspect ratio, residual defects, and groups that are presented in composite structures; those effects lead to a rise in multiple reflections in composites.
The effect of AC electrical conductivity, impedance matching condition, and attenuation constant on microwave absorption of a single-layered structure is presented. Although the Z 0 values of graphene 2 and 2.5 wt% are approximately the same, graphene 2 wt% has low σ AC and α. It can be concluded that graphene 2.5 wt%/epoxy composite is more advantageous than other heavy inorganic materials. Moreover, these results are applicable to analyze the microwave absorption of multilayered structures.
Microwave absorption performance of multilayered structures
RL of multilayered structures is generally based on the EM properties of filler, number of layers along with layer order. First, multilayered structures are fabricated with pure graphene with various wt% and these results are compared with MWCNT single-layered structure. It is found that EM wave absorption performance has not improved. However, these results are not incorporated in this article.
The multilayered structures are composed of an epoxy base reinforced with two fillers (MWCNT and graphene). The number of layers is varied from 2 to 11 in X-band and layers are arranged as per impedance matching condition. EM properties of individual single-layered MWCNT and graphene composite are used to estimate the absorption performance of multilayered structures as stated above. For the case of multilayered structure, each layer is represented with a unique code and the same coding is used to estimate RL in MATLAB R19b, the codes are presented in Table 1.
Unique coding of materials for multilayered structure.

MWCNT: multiwalled carbon nanotube.
In an instance, 3- and 4-layered structures are represented in equations (8) and (9), respectively. The row in matrix designates case number which is predicted from the input impedance of each filler wt% and column represents the layer number. Upon applying the impedance matching condition to both 3- and 4-layered structures, corresponding cases obtained are 10 and 45, respectively. The same procedure is applied for remaining multilayered structures and their cases are listed in Table 2.
RL of various structures in X-band.
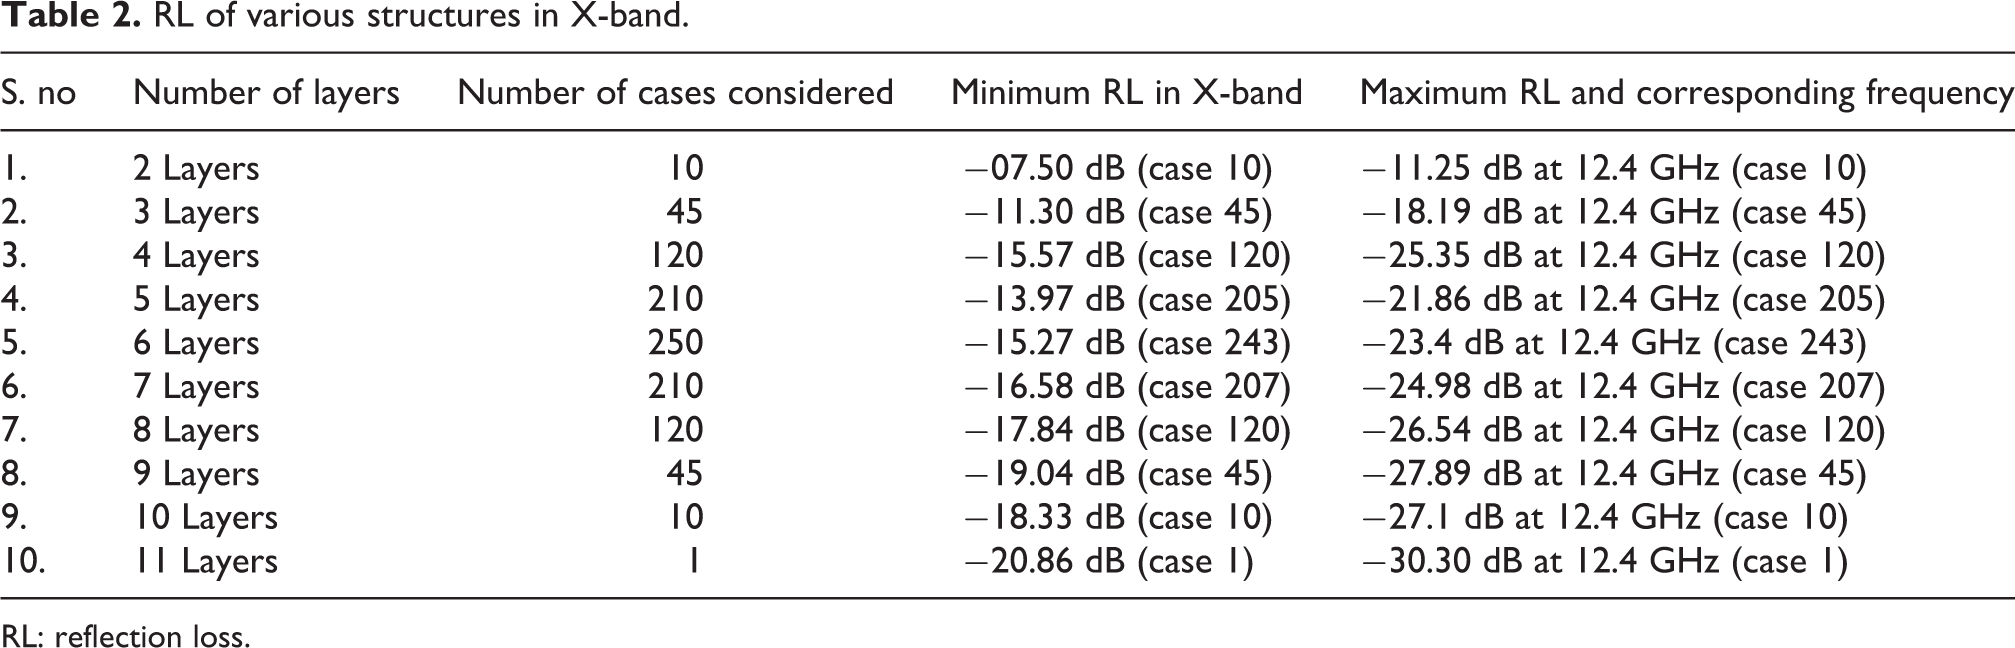
RL: reflection loss.

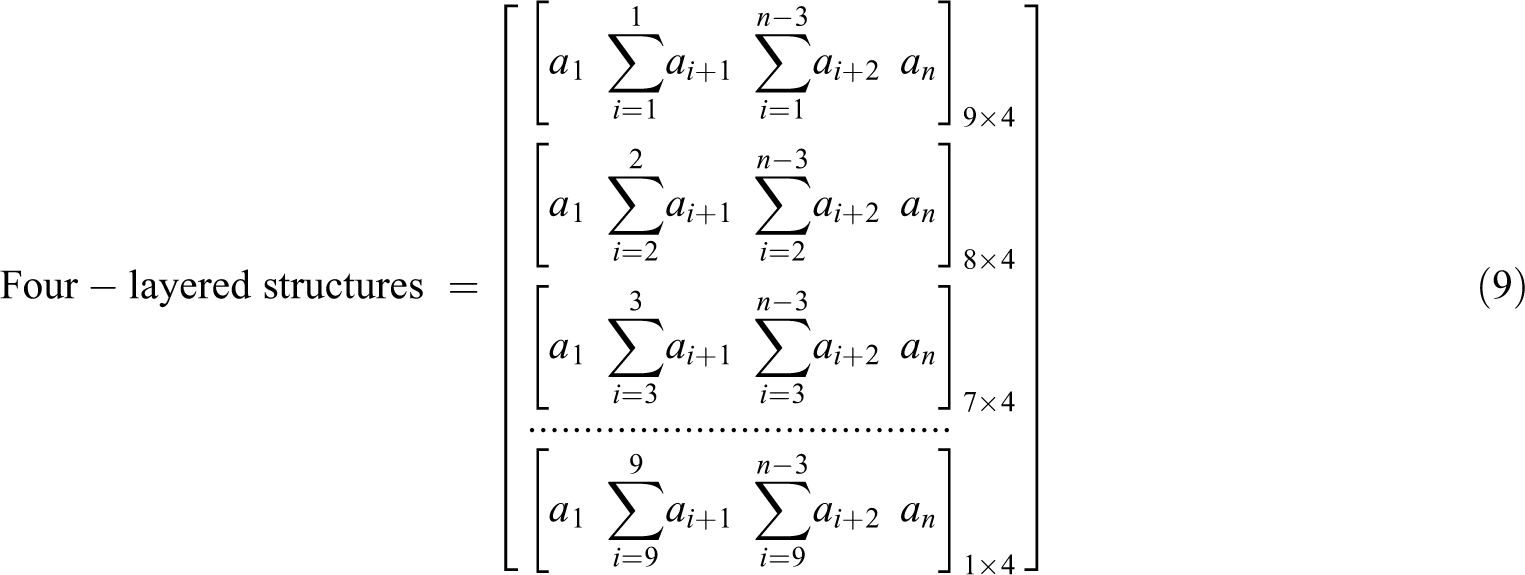
where n is the total number of materials considered and the value is 11.
The variation of RL in X-band for different multilayered structures has been presented in Figure 8. For a multilayered structure, it is observed that RL increases in X-band. It is observed that each layer has RL within the X-band and the maximum RL value is obtained at 12.4 GHz frequency as presented in Table 2. In addition to this, the minimum value of RL which is observed at a particular case number (within the parentheses) and frequency has been presented in Table 2.

RL variation of multilayered structures in X-band.
It is found that the maximum RL is observed for 11-layered composite because of the interfacial polarization benefit in the X-band. In the case of single-layered structure, the variation of RL increases with an increase in wt% of filler material, whereas in the case of multilayered structures RL increases monotonically but does not follow the layer increment. It is apparent from Figure 9 that most of the multilayered structures attained required RL (lower than −10 dB) in X-band. In addition, an 11-layered composite structure absorbs 99% of the incident EM radiation and it can be used for microwave absorption application. The present study reveals that EM wave absorption performance can be enhanced using multilayered structures in X-band, which is composed of an epoxy base with nanofillers (MWCNTs and graphene). The schematic layout of the 11-layered composite structure which is predicted using a mathematical model is presented in Figure 10(a). This 11-layered structure has maximum RL value among all other structures and the same can be seen from Table 2. The layer order along with filler material wt% for the fabrication of an 11-layered structure is presented in Figure 10(a).

Comparison of maximum RL for different numbers of layers at 12.4 GHz frequency.

(a) Layer order of 11-layered structure backed by PEC and (b) RL of 11-layered structures over X-band.
Further, the 11-layered structure is fabricated in the laboratory and it is brought to measure EM properties using waveguide experimental setup in X-band. Subsequently, experimentally measured results will validate the mathematical model RL results as shown in Figure 10(b). The average error between theoretical and experimental RL values is 2.896%. RL results of present work are compared with available literature as presented in Table 3. It is found that 6- and 11-layered composite structures (thickness 12 and 22 mm, respectively) have enhanced absorption performance with various filler material wt% (0.5–2.5).
Comparison of RL of the multilayered structure of present work with previous studies.

RL: reflection loss; CNF: carbon nano fiber; MWCNT: multiwalled carbon nanotube.
Conclusions
Epoxy-based nanocomposite filled with MWCNTs and graphene is proposed to study the EM wave absorption performance with various wt% (0–2.5 with an increment of 0.5).
Polymer nanocomposites are fabricated using high-pressure resin transfer molding and characterized for physical structure and chemical composition conformation.
Microwave absorption in terms of RL was investigated for two different types of structures namely single- and multilayered in X-band.
EM wave absorption performance analysis has been carried out as follows.
EM properties of single-layered graphene polymer nanocomposites were measured using waveguide measurement technique in X-band and subsequently, RL is estimated with the help of EM wave theory. The results show that RL increases with graphene wt% and maximum RL is observed with graphene 2.5 wt%. In single-layered structures, better microwave absorption is achieved with low filler concentration.
Effect of attenuation constant and AC conductivity measurements on microwave absorption performance has been investigated and also proved that the graphene 2.5% composite obeys the impedance matching condition.
Proposed a mathematical formulation for the multilayered structure to optimize time and experimentation cost.
The number of layers is varied from 2 to 11 for multilayered structures; corresponding RL is calculated using EM wave theory. The results of 3 and 6 multilayered structures are compared with the available literature. It is found that 99% of absorption is observed with the 11-layered structure of 22 mm thickness in X-band. The values of RL are −20.86 dB minimum in X-band and the maximum of −30.30 dB at 12.4 GHz frequency.
Finally, the 11-layered structure is fabricated and the results are validated with mathematically predicted structure. The accuracy of mathematical model is verified by validating RL results with experiments. It is found that the mathematical model can predict EM wave absorption for various multilayered structures while using different fillers prior to experimentation.
These 6- and 11-layered structures can be applicable in military warfare and naval applications because these structures can absorb more than 95% of incident EM radiation.
Footnotes
Acknowledgements
The authors would like to express their gratitude to Naval Research Board (NRB), Ministry of Defence Government of India, for providing their experimental facilities to do research and MHRD, TEQIP Phase II, CoE for financial support.
Declaration of conflicting interests
The author(s) declared no potential conflicts of interest with respect to the research, authorship, and/or publication of this article.
Funding
The author(s) received no financial support for the research, authorship, and/or publication of this article.