
Abstract
The aim of the research is to prepare a polymer composite material for high-voltage cable insulation purposes. Many researchers have blended a silicone rubber (SiR) and ethylene propylene diene monomer (EPDM) at different ratios to identify the composition which possesses excellent electromechanical properties. SiR-EPDM blends in 90:10 and 10:90 ratios were taken up for this study. To these polymer blends, metallic filler titanium dioxide (TiO2) with different densities have been used as the filler materials. The electromechanical performance and the physico-chemical behaviour of SiR-EPDM blends with filler addition were compared with SiR-EPDM blends of the same blend ratio without filler. The electromechanical parameters were measured according to the International Electrotechnical Commission (IEC) and ASTM standards. The surface morphology and filler dispersion were examined by the scanning electron microscopy images. The elemental compositions of the samples were obtained from the energy dispersive X-ray analysis. The changes in electromechanical behaviour of the samples were analysed from Fourier-transform infrared spectroscopy results. The investigations reveal that 5 wt% of high-density TiO2-filled SiR-rich blend possesses the best electromechanical performance of all prepared samples.
Keywords
Introduction
The safety and effectiveness of the conducting wire depend on the insulation material used. Nowadays, the traditional ceramic and glass insulating materials used in high-voltage transmission and distribution systems are being replaced by polymeric materials. The polymeric insulating material offers high mechanical strength to weight ratio, resistant to vandalism, lightweight and superior performance in heavy polluted and wet conditions. 1 Among various available polymers, silicone rubber (SiR) finds its extensive use as insulators since it is non-reactive, stable to extreme temperature and possesses hydrophobic properties. For the past four decades, SiR-based composites are widely used as high-voltage insulators for outdoor applications. 2 High temperature vulcanized and room temperature vulcanized (RTV) SiRs are widely used for high-voltage insulation purpose. 3 The degradation of inorganic insulating material can be avoided by replacing the polymeric insulators highly resistant to direct sunlight, air contamination and rain. 4 SiR is also called as poly dimethyl siloxane since its chemical structure contains organic hydrocarbon methyl group (–CH3) as a functional substituent and inorganic siloxane (Si–O) as the backbone. 5 Ethylene propylene diene monomer (EPDM) has good mechanical properties since it possesses a saturated structure with polymer backbone and also it is inexpensive compared to SiR. The chemical structure of EPDM is a terpolymer which contains ethylene, propylene and diene monomer. The diene monomer may be ethylidene norbornene, dicyclopentadiene and vinyl norbornene. The backbone structure of EPDM having this diene functionalities is used to make crosslinks. 6 Many pieces of research had been carried out to produce a cost-effective SiR-EPDM blend with enhanced electromechanical properties. To understand the blending properties of SiR and EPDM at different blend ratios, their physico-chemical and electromechanical properties were studied. 7 Titanium dioxide (TiO2) has drawn its attention as filler material in recent years as it is inexpensive, commercially available and non-toxic. It also enhances the electrical properties of the polymer and has very good interaction between the polymer matrix. 8,9 Titania is available in different polymorphs such as rutile, anatase and brookite. Rutile is the most stable and available form of TiO2 among the polymorphs. Though the filler size is small and uniform, the electrical, mechanical and dielectric properties variations are predominant for the dispersion variations of filler material in the polymer blends. 10 In an attempt to synthesize polymeric insulating material with superior performance, a wide range of material formulations were carried out and tested by many researchers. A number of investigations have shown that the particle size, density and filler concentration play an important role in modifying the properties of the material. 11 Hall–Petch (HP) relation tells that the mechanical strengthening of the composite material can be achieved by decreasing the grain size. 12 SiR- and EPDM-rich polymeric blends filled with rutile TiO2 of different densities and particle size, loaded at different concentrations were taken up for the study. To understand the performance of the synthesized insulating materials, electromechanical characterization tests were performed and the results were interpreted with the morphological and physico-chemical analytical tools such as scanning electron microscopy (SEM), energy dispersive X-ray analysis (EDXA) and Fourier-transform infrared spectroscopy (FTIR) results.
Materials and methods
The densities of low-density (LD) TiO2 and high-density (HD) TiO2 filler materials were 3600 and 4200 kg m−3. The filler particle sizes of LD TiO2 and HD TiO2 were 550 and 290 nm, respectively. Two different polymer blends of SiR-EPDM in 90:10 and 10:90 ratios were loaded with the different densities of TiO2 filler material at three different concentrations. The SiR- and EPDM-rich blends were represented as X and Y, respectively. LD TiO2 filler was added to X and Y blends in three different concentrations of 2, 5 and 10 wt%. Similarly, HD TiO2 filler in the same weight proportions was added. To facilitate the identification of composites prepared, specific names were given according to the composition as given in Table 1, where XL and XH blends denote X blend filled with LD TiO2 and HD TiO2, respectively. Similarly, YL and YH blends denote Y blend filled with LD TiO2 and HD TiO2, respectively. As an initial step in material formulation, the RTV SiR, EPDM, LD TiO2 and HD TiO2 were weighed using a precision digital balance according to the requirement of each specimen as mentioned in Table 1. Dicumyl peroxide (DCP) at 2 phr was added along with the polymer matrix of each specimen for vulcanization and fast curing. SiR, EPDM and filler composite along with DCP was fed into a two-roll milling machine (Shoail, China). The polymer composites were blended well and rolled into thin sheets. The sheeted material blends were dried in an electric oven at 110°C before compression moulding to remove the moisture content. The sheets were cut into small strips and placed on a rectangular moulding tray of size 20 × 15 × 0.3 cm3. Then it was compressed under high temperature and pressure at 200°C and 1000 psi, respectively, using the hydraulic compression moulding machine. The curing time was set to 180 s for SiR-rich blends while it was set to 250 s for EPDM-rich blends. This is due to higher curing time for EPDM than SiR among the polymers used in the polymer matrix. On releasing the pressure, the polymer composite sheet material was carefully taken out of the moulding tray and allowed it to cool at room temperature.
Sample names assigned for prepared specimens with their composition in weight %.

SiR: silicone rubber; EPDM: ethylene propylene diene monomer; LD: low density; HD: high density; TiO2: titanium dioxide.
The results were taken from the reference paperwork on SiR-EPDM blends without filler (WOF) by the co-authors, R. Deepalaxmi and V. Rajini. 13 The sample names were assigned as XWOF for SiR-EPDM blend of 90:10 ratio and YWOF for blend ratio of 10:90.
Characterizations
Electromechanical characterization
As per the ASTM and International Electrotechnical Commission (IEC) standards, the electromechanical parameters were measured. The electrical parameters, volume resistivity (VRY), surface resistivity (SRY) and arc resistance time (ART) were measured. Mechanical parameters such as tensile strength (TS), percentage of elongation at break (EB) and hardness (H) for all the specimens were measured.
Electrical parameters
The VRY and SRY of the samples with LD and HD TiO2 fillers were measured as per ASTM D257/IEC 60093 standard. Each sample was cut into a circular shape of 10 cm diameter and 0.3 cm thickness. A 500 V direct current was applied between two electrodes that were in contact with a specimen. Both VRY and SRY were measured with the same setup operated in two different modes. Circular samples measuring 5 cm diameter were taken from each specimen for ART measurement according to the standard ASTM D495. Alternating current supply of 12.5 kV was applied to the electrodes placed over the test specimen. Time taken to form electrically conductive paths between the electrodes and the generation of arc ceases was measured as ART.
Mechanical parameters
The TS and EB of prepared samples were measured using Hounsfield H50KS (US), the universal testing machine. The shape and size of the dumb-bell-shaped specimen follow ASTM D412 standard for TS and EB measurement. Shore A Duo durometer (Linear Instruments, Chennai, India) was used to measure the H of samples as per the standard ASTM D2240.
Physico-chemical analysis
SEM and EDXA
Hitachi (Japan) S 3400N was used for SEM analysis and EDXA was measured with its accessory supporting port. As the sample is an insulator, it was gold sputtered to avoid the surface charging and to obtain quality images. Ion sputter coater with a gold target was used for sputtering the samples.
FTIR analysis
FTIR instrument (Bruker, US, Model-Alpha T) was used in attenuated total reflectance (ATR) mode for analysing the samples. FTIR measurement gives a clear spectrum within lesser time which may be used for both qualitative and quantitative analyses. The specimens were used in its natural state itself and there is no need to grind heat or press into pellets since FTIR was taken in ATR mode. The functional groups and absorption intensity of each polymer composites were identified from corresponding peaks and its wavenumber of their FTIR spectra.
Results
Electromechanical parameters
Volume resistivity (VRY)
Enhancement in VRY was noticed in all filler-added samples when compared to WOF samples. From Figure 1, it was noticed that blends YL2p and YH2p possess maximum VRY among other blends. Increasing the filler content to 5 and 10 wt% to both YL and YH blends showed a reduction in VRY values. The VRY of blends XL and XH increased as the filler concentration increased from 2 wt% to 5 wt% and on the further increase at 10 wt% showed a reduction in VRY value. The VRY of XH samples for all concentrations were higher than the XL samples.

Volume resistivity of X and Y blends with different density and weight % of TiO2.
Surface resistivity (SRY)
Figure 2 reveals that the SRY of XL and XH showed the maximum value for all weight percentage of filler addition. SiR- and EPDM-rich samples loaded with 2 wt% of both types of filler exhibit the maximum value of SRY.
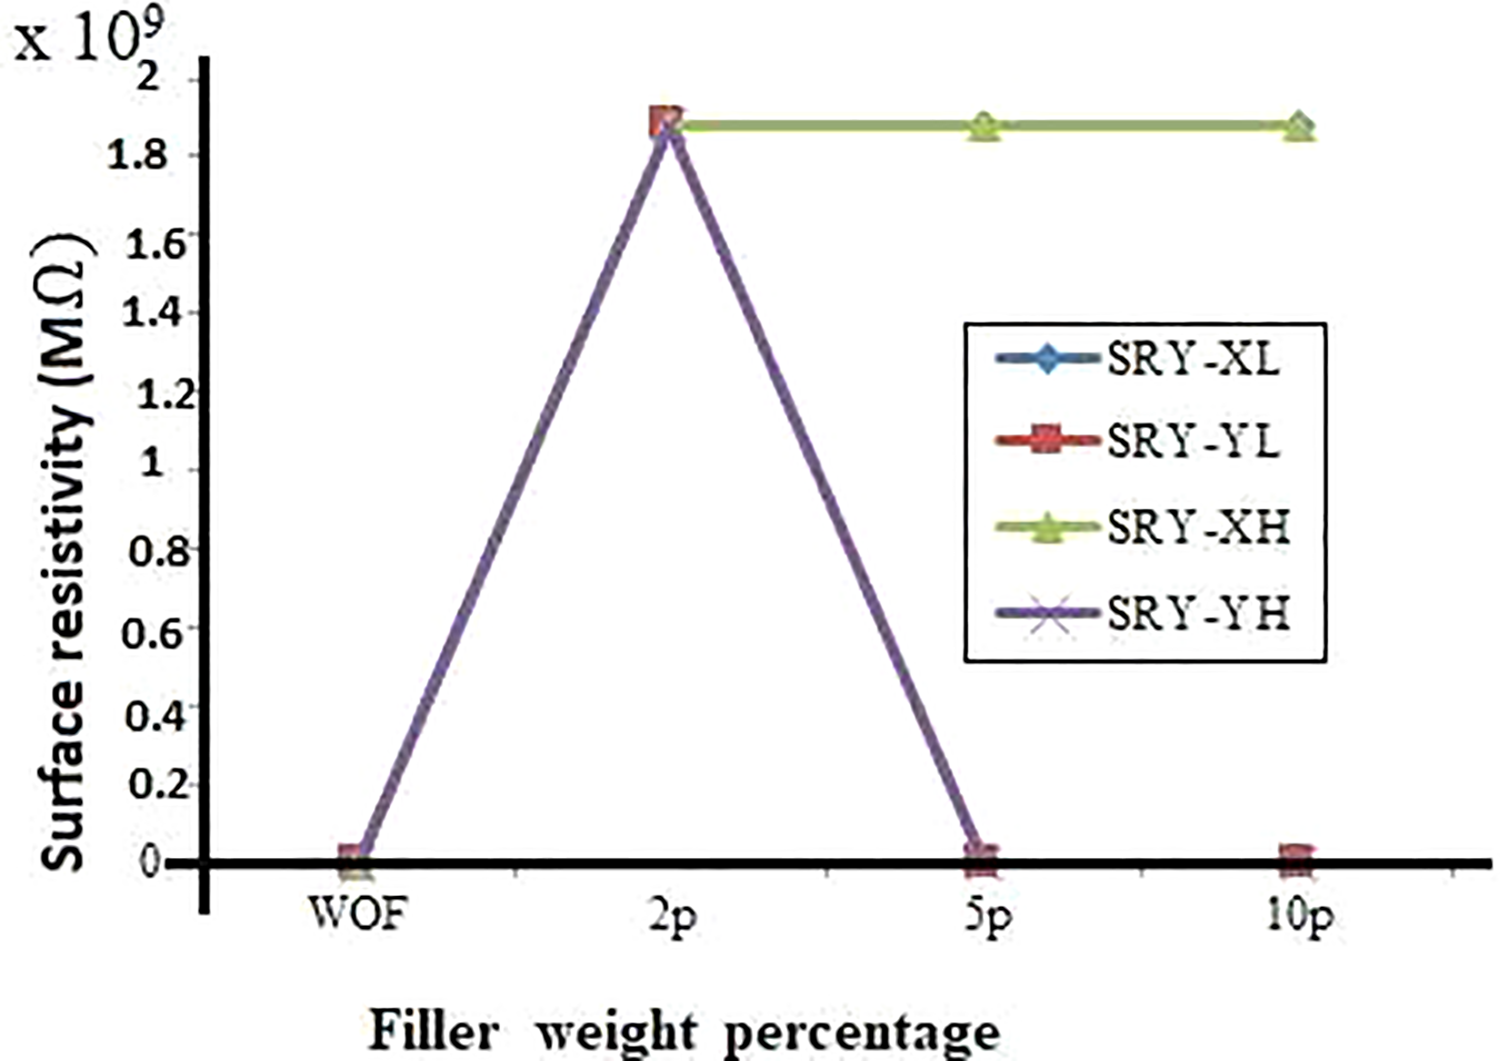
Surface resistivity of X and Y blends with different density and weight % of TiO2.
Arc resistance time (ART)
The ART of SiR-rich samples was higher than the EPDM-rich samples. The blend XH5p had withstood up to 10 mA and the ART measured was 180 s. The ART of other samples was less than 180 s with current less than 10 mA. From Figure 3, it is evident that the ART of XH blends was higher than XL blends and the ART of the filler-added samples was lesser than the WOF samples.

Arc resistance time of X and Y blends with different density and weight % of TiO2.
Tensile strength (TS)
An enhancement of TS parameter value was noticed on filler addition of both LD and HD TiO2 to X and Y blends when compared to WOF samples. TS of all blend combinations increased linearly as the filler addition increased from 0 wt% to 5 wt% and decrement in value was noticed on the further increment of filler addition to 10 wt%. Thus, the maximum value of TS in all blend combinations was observed at 5 wt%. From Figure 4, it was observed that the sample XH5p possesses the maximum TS value among the samples taken for analysis. This increment in TS value at 5 wt% of HD TiO2 to X blend was 153% greater than the WOF sample. The sample YH5p showed the peak value among filler-added Y blend samples. This value was 446% greater than the WOF-added Y blend samples. HD TiO2 filler addition of smaller particle size possesses higher TS in X and Y blends.

Tensile strength of X and Y blends with different density and weight % of TiO2.
Elongation at break (EB)
Figure 5 shows that the EB was higher for SiR-rich XL and XH blends compared to that of EPDM-rich YL and YH blends. This may be due to more elastomeric nature of SiR-rich blends than EPDM-rich blends. It was inferred that the EB had improved for SiR-rich blends and decreased for almost all EPDM-rich blends (except for YH5p) when compared to corresponding polymer blends WOF. From Figures 4 and 5, it was inferred that the addition of LD and HD fillers to Y blend showed an increase in TS but decrease in EB when compared to YWOF. The filler material with HD having smaller particle size has higher TS but reduced EB than that of LD filler-added samples. This shows that the TS increase as the filler particle size reduces and also becomes brittle due to smaller grain size in the boundary of the polymer matrix hence, reduced EB value. Thus, the EB value was lesser for HD filler-added sample than the LD filler-added one. Whereas, the TS was better for HD TiO2 samples than that of LD TiO2-filled samples.

Elongation at break of X and Y blends with different density and weight % of TiO2.
Hardness (H)
H of YL and YH samples were much higher than that of XL and XH samples. The plot shown in Figure 6 reveals that the H value gets improved for XH, YL and YH blends for all concentrations compared to WOF. But the H value gets reduced for the samples of XL blends compared to XWOF. The maximum value of H was noticed for the sample YH10p. This was 28% greater than that of YWOF. On the whole, the H of all the combinations of blends with HD filler-added blends were higher than blends with LD filler addition.
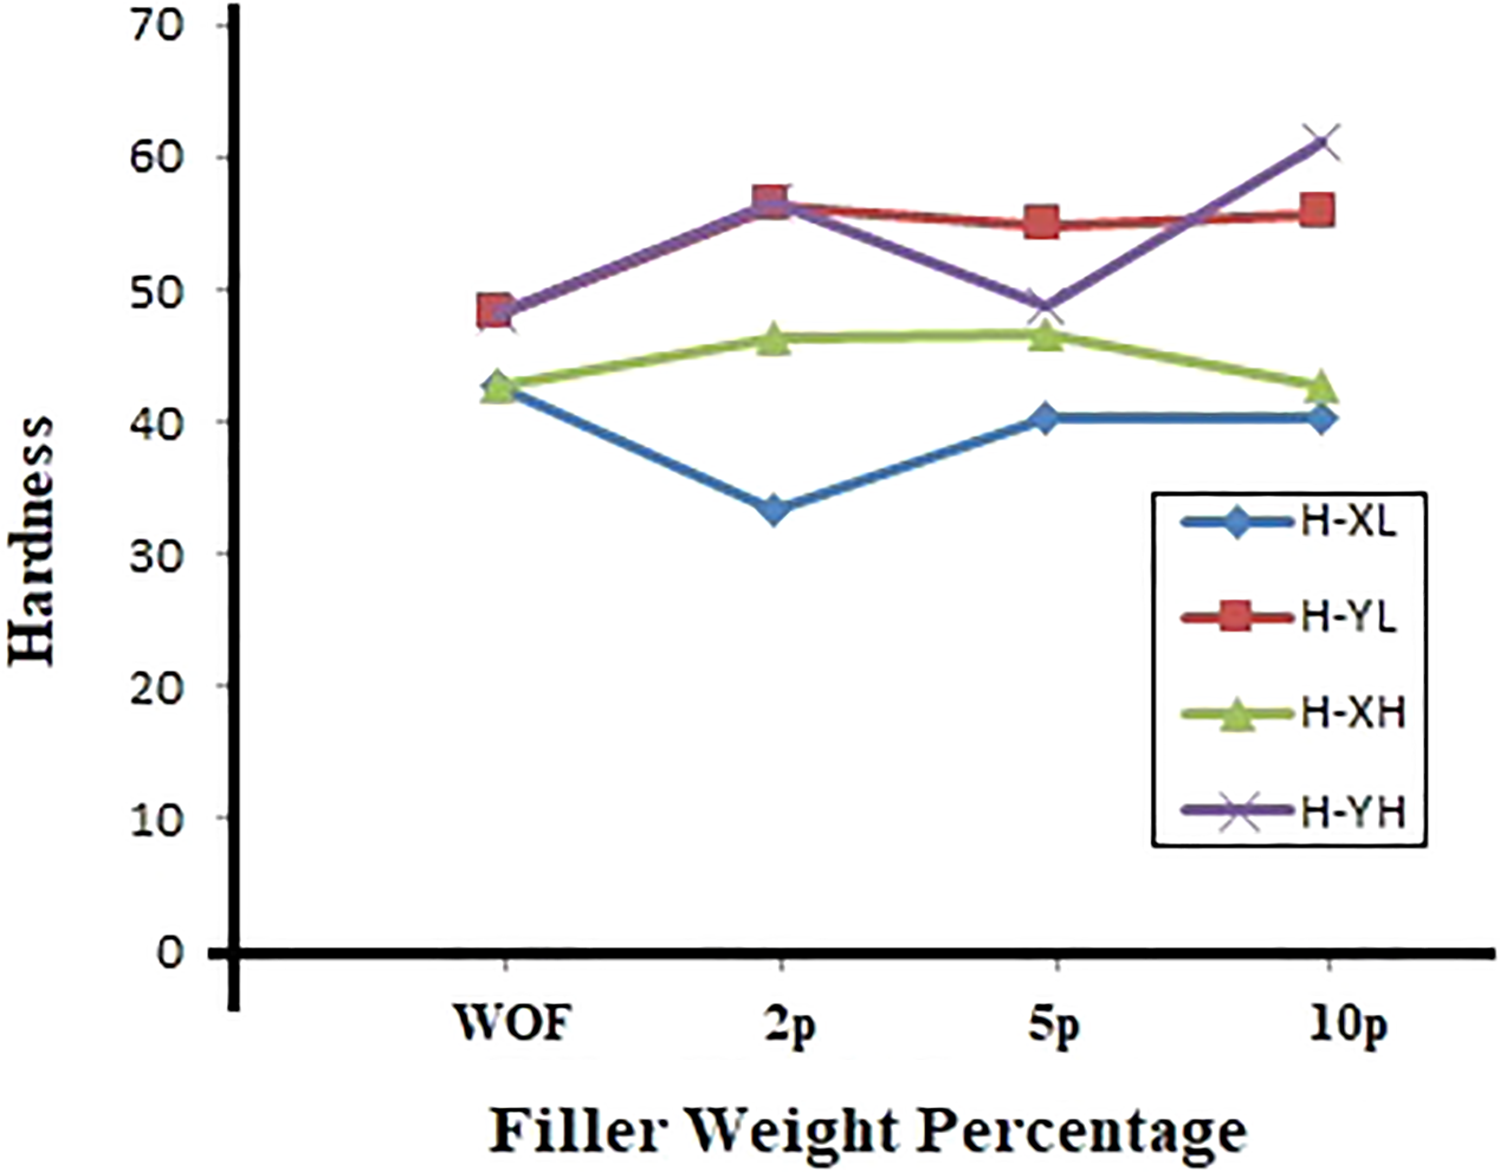
Hardness of blends X and Y with different density and weight % of TiO2.
Physico-chemical analysis
SEM analysis
The SEM images were taken for all the prepared samples at five different magnifications. Figure 7(a) shows the SEM images of LD TiO2-filled SiR-rich blends and Figure 7(b) shows the morphology of LD TiO2-filled EPDM-rich blends. From Figure 7, it was observed that the surface morphology of SiR-rich filler-added polymer composites was smoother than that of the EPDM-rich samples. Agglomeration of particles was noticed for YL5p and YL10p samples. Figure 8(a) shows the SEM images of HD TiO2-filled samples in SiR-rich blends and Figure 8(b) shows the images of HD TiO2-filled samples in EPDM-rich blends. The left column of both (a) and (b) are the SEM morphology images with 500 magnification and right column with 4000 magnification. Figures 7(b) and 8(b) show that the filler dispersion was not uniform at higher filler loadings of YL10p and YH10p.
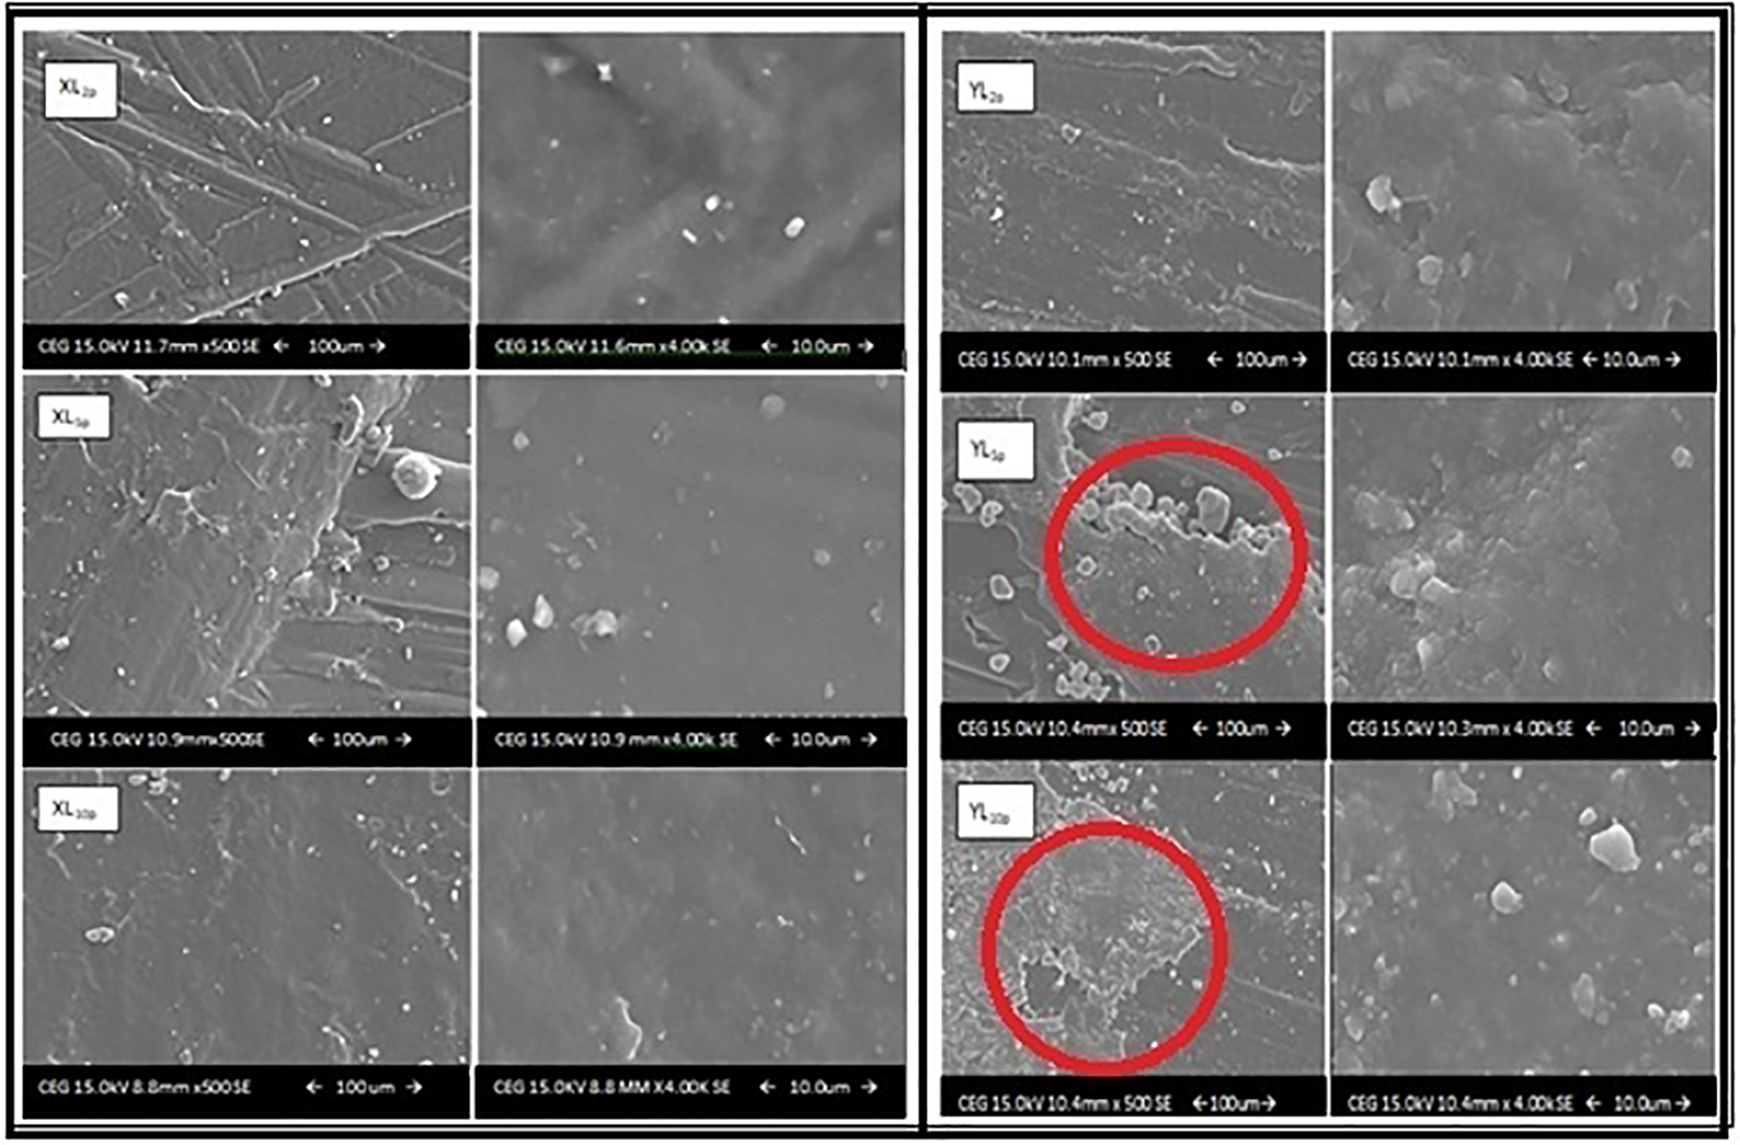
(a) SEM images of LD TiO2 filled X blends with different filler concentrations. (b) SEM images of LD TiO2 filler in Y blends with different filler concentrations.

(a) SEM images of HD TiO2 filled X blend with different filler concentrations. (b) SEM images of HD TiO2 filler in Y blend with different filler concentrations.
EDXA
Table 2 shows the major elemental composition of SiR- and EPDM-rich polymeric blends with filler and WOF. The atomic wt% of titanium was lesser for LD TiO2-filled X and Y blends compared with HD TiO2-filled blends. The absence of titanium wt% in the table was noticed for the samples XWOF and YWOF. It was also noticed that higher silicon wt% in SiR-rich (XL and XH) blends and carbon wt% in EPDM-rich (YL and YH) blends. Highest wt % of oxygen, carbon and titanium was noticed in YH10p among the filler-added samples. The atomic wt% of silicon was found to be higher for the sample XH2p. The atomic wt% of carbon was higher for WOF samples compared to filler-added samples.
EDXA elemental composition of prepared samples.

EDXA: energy dispersive X-ray analysis.
FTIR inference
Figures 9 and 10 depict the FTIR spectra of blend X with LD and HD TiO2 filler at different loading concentrations. Figures 11 and 12 depict the FTIR spectra of blend Y with LD and HD TiO2 filler at different loading concentrations. The detailed peak assignments and absorption percentage at each peak for the prepared samples are grouped according to the literature. 14
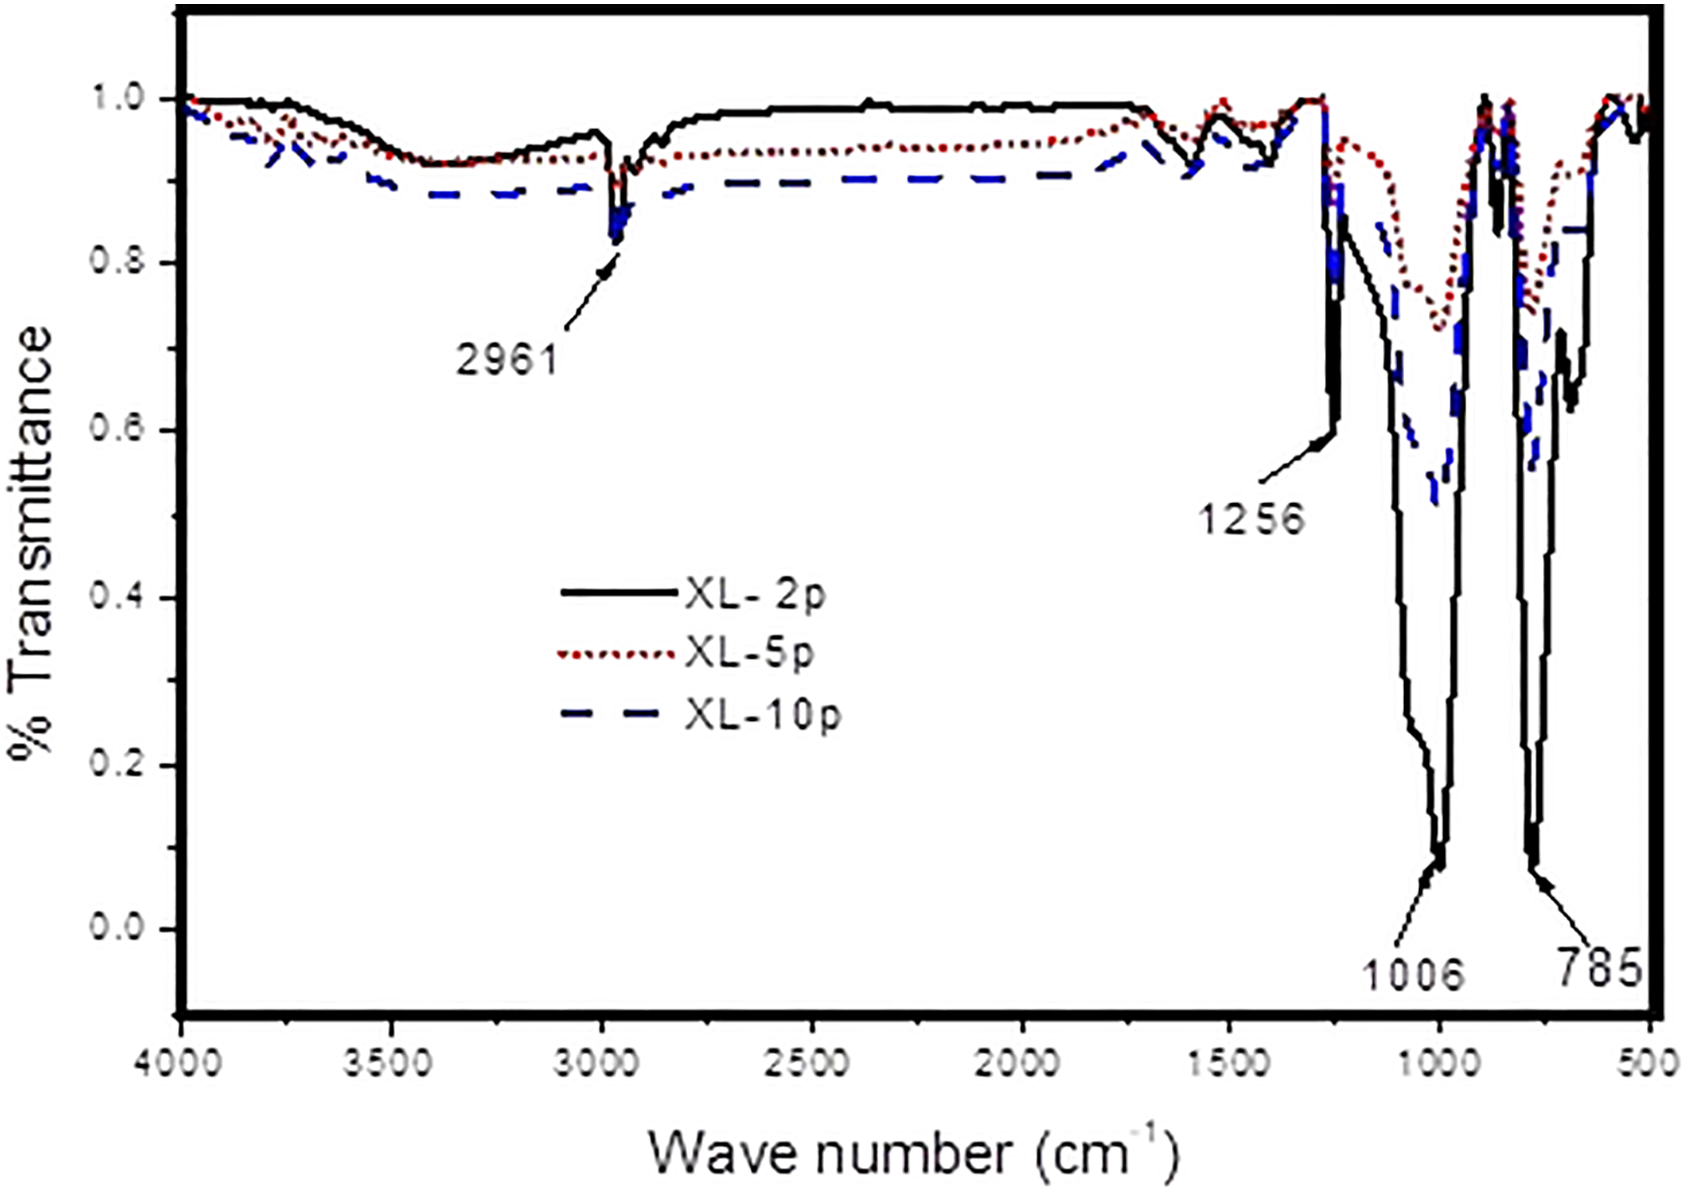
FTIR spectra of blend X with LD TiO2 filler at different loading concentrations.

FTIR spectra of blend X with HD TiO2 filler at different loading concentrations.

FTIR spectra of blend Y with LD TiO2 filler at different loading concentrations.

FTIR spectra of blend Y with HD TiO2 filler at different loading concentrations.
FTIR spectra of SiR-rich samples shown in Figures 9 and 10 have the absorption peak only for symmetric alkane stretch at 2961 cm−1. Two consecutive peaks of symmetric and asymmetric stretching of alkane group can be observed for all EPDM-rich samples in Figures 11 and 12. The H of EPDM-rich blends, YL and YH, were found to be higher due to the presence of both symmetric and asymmetric stretch alkane group. Silone, siloxane, polysiloxane, silanol, silicon chloride and alcohol are the functional groups present because of SiR. Alkane, carbonyl, alkene and aromatic groups are due to the EPDM. The peak observed at (784–789 cm−1) shows the presence of amorphous TiO2.
Discussion
Interpretation of electromechanical parameters with FTIR results
Tables 3 and 4 give the functional groups identified for X and Y blends with different density and filler loadings from FTIR spectra. The appearance of one or more functional groups and the variation in the absorption percentage as well as the shift in wavenumber maybe the reason for the change in electromechanical performance.
Functional group and vibrational band assignment for XWOF, XL and XH blends.

WOF: without filler.
Functional group and vibrational band assignment for YWOF, YL and YH blends.

WOF: without filler.
From the results, it was observed that the VRY increases gradually with an increase in wt% of filler for the samples with XL blends. Among the samples prepared the maximum value of VRY and SRY was noticed for YL2p and YH2p samples. All the other samples also showed comparatively higher VRY and SRY values than WOF samples. This enhancement in electrical properties of both VRY and SRY after the filler addition was due to the appearance of new functional groups such as polysiloxane, silanol and silicon chloride. The absorption percentage of silanol functional group for XL blends at 2, 5 and 10 wt% was found to be 7.5%, 2% and 3.78%, respectively. The silanol absorption percentage was found to be 21.09%, 4% and 3.9% for XH blends. The absorption percentage of silanol functional group for XH blends was comparatively higher than XL blends for all concentrations. This may be the reason for higher VRY values of XH blends than XL blends for all concentrations. The maximum value of SRY (1.88 × 10 9 MΩ) was obtained for XL and XH blends when compared to XWOF having a very low value of SRY (7.52 MΩ). The presence of amorphous TiO2, the new functional group, in filler-added samples was noticed in XL and XH blends compared to XWOF. Amorphous TiO2 with high absorption percentage of 13.1–78.6% at the wavenumbers from 784 cm−1 to 786 cm−1 in XL and XH blends may be the reason to obtain maximum SRY values.
The ART of XWOF was very high compared to the other samples with fillers. This may be due to the presence of an alcohol functional group with very high absorption percentage of 146% at 3499 cm−1 found in XWOF samples. The ART of YH blends decreases with increase in filler content. This may be due to the reduction in absorption percentage of alcohol functional group from 4.3%, 3.6% and 3.4% at wavenumbers 3334, 3373 and 3377 cm−1, respectively. The ART values of YWOF were comparatively higher when compared with filler-added YL and YH blends. The absorption percentage of the alcohol functional group at YL2p and YH2p was 2.8% and 4.3% at 3418 and 3334 cm−1, respectively. But the absorption percentage for the alcohol group was 106% at 3418 cm−1 for the sample YWOF. The ART of YH2p was higher among the filler-added Y blend samples. This may be due to the higher absorption percentage of alcohol with 4.3% at wavenumber 3334 cm−1.
The H of all XL blends showed reduced values than XWOF. The H of all XH blends has improved when compared to the reference. From this, it is evident that the same filler concentration with a higher density of smaller filler size had improved the H of the samples. The detailed band assignments presented in Table 3 showed the presence of carbonyl C=O stretching at 1812 and 1719 cm−1 with the percentage of absorption 2% and 2.6% for XL5p and XL10p, respectively. It was observed that the band at 1718 cm−1 attributed to C=O stretch can be seen for sample XH5p. A shift in wavenumber was noticed among XL5p and XH5p for carbonyl functional group from wavenumbers 1812 and 1718 cm−1, respectively. The carbonyl functional group was not noticed for samples XL2p, XH2p and XH10p. The H measured for the above samples showed lesser value among the blend groups. Appearance of the alkene C=C group in XWOF sample would also be the reason to show high H values since this group was absent in XL2p and XL10p in XL blends. The sample XL5p shows the presence of alkene group at 1665 cm−1 with less absorption percentage of 1.5% compared to XWOF. Hence XL5p shows higher H value among XL blend group but the value was lesser than XWOF. Though the presence of alkene C=C with higher absorption percentage was noticed, XWOF shows lesser H value compared to XH2p and XH5p. This implies that the appearance of the aromatic C=C group in XH2p and XH5p may also be responsible for the improvement in H value compared to XWOF.
H value was maximum for YH10p and it was 1.27 times greater than YWOF. This is due to the presence of C=C aromatic stretch group present for filler-added samples compared to WOF samples. The absorption percentage of YH10p for aromatic group was 7.1% at 1402 cm−1, 6.3% at 1405 cm−1 for YH2p and 5.3% at 1408 cm−1 for YH5p. From this, it implicates that the H value is high for YH10p and then for YH2p and the last comes YH5p. The H value is improved as the sample has high absorption percentage for aromatic C=C group. Table 4 details that the C=O carbonyl group and C=C alkene group were not present in YL5p and YH5p. Hence lower H was noticed for 5 wt% among YL and YH group of blends.
The improvement in EB was noticed for YH5p sample compared to all other EPDM-rich samples. This may be due to the reduction in absorption percentage to 5.3% at 1408 cm−1 for aromatic C=C stretch group and the absence of C=O carbonyl and C=C alkene functional groups. From this, it was inferred that EB may be improved if the absorption percentage of double bond functional group was lesser or absent. The TS and EB of XH blend increase with an increase in HD filler concentration. A gradual reduction in absorption percentage of polysiloxane group from 32.1%, 11.4% and 11.1% at 1258, 1256 and 1256 cm−1, respectively, was noticed. From this, it is inferred that TS and EB increase as the absorption percentage of polysiloxane reduces with increase in filler content of XH blends. Absence of the alkene group at XL10p may be the reason to possess lesser TS of the sample.
The sample loses its mechanical strength which may be due to non-uniform distribution of the filler materials with the blends at higher wt%. 15 It was observed from the results obtained that the TS was higher at 5 wt% of filler loading and lesser at 10 wt%. The reduction in TS was noticed for XL10p, XH10p, YL10p and YH10p when compared to XL5p, XH5p, YL5p and YH5p, respectively. This TS reduction may be due to the non-uniform distribution of filler materials with the SiR-EPDM blends at higher concentration of 10 wt%.
Interpretation of electromechanical parameters with SEM and EDXA
On comparing the EDXA values in Table 2 with the FTIR values in Tables 3 and 4, an interpretation between EDXA and FTIR measurements of the samples were done. From Table 2, it was observed that the filler-added samples YH10p, XH2p, YH5p and YH10p showed the maximum content of oxygen, silicon, carbon and titanium, respectively. The absorption percentage of polysiloxane, siloxane and silanol functional group of XH2p was 32.1%, 76.6% and 21.09%, respectively. The absorption percentage was found to be the highest for XH2p sample and thus higher atomic wt% of silicon was noticed in it. The silicon content of EPDM-rich samples was lesser than the SiR-rich samples. The carbon content of EPDM-rich samples was comparatively higher than the SiR-rich samples. Thus, the major elemental composition variations of SiR and EPDM were reflected in SiR- and EPDM-rich samples. The atomic weight percentage of titanium in LD TiO2 filler-added samples was lesser than the HD TiO2 samples. As the particle sizes of the HD TiO2 filler-added samples were lesser and tightly packed than LD TiO2 filler-added samples, the atomic wt% titanium of it may be higher. The sample YH10p possesses higher atomic wt% of titanium and oxygen and hence the H of the sample was maximum. The TS and EB of YH5p sample were better among the EPDM-rich samples as the carbon content in it was higher.
From the SEM images, the particle agglomerations were noticed for samples YL5p and YL10p. Hence, VRY and SRY of YL2p were much higher than YL5p and YL10p samples. A reduction in electromechanical parameter values of YL10p and YH10p was noticed compared to YL5p and YH5p, respectively. This reduction was due to non-uniform dispersion of filler particles at higher weight percentage which may be noticed in the SEM images.
According to HP behaviour, the strength of the material is higher for smaller particles. Hence, HD TiO2 filler with smaller particle size added to the polymer composites showed higher TS and H than LD TiO2 filler-added samples. The uneven dispersion of filler particles at 10 wt% had led to the particle agglomeration. The formation of a dislocation move in the polymer composites would have occurred due to this agglomeration. This may be the reason for weakening the TS of the polymer composites at a higher weight percentage of 10 wt% filler loadings than at 5 wt%. The electrical parameters VRY, SRY and ART reduction at 10 wt% than 5 wt% of filler addition may also be due to this uneven dispersion which had led to the particle agglomeration.
Conclusions
It is evident from the electromechanical results that the property enhancement was noticed for both LD TiO2 and HD TiO2 filler-added samples compared to WOF samples. From the FTIR analysis, the presence of new functional groups such as carbonyl C=O, aromatic C=C, polysiloxane, silanol, amorphous TiO2 and silicon chloride were identified for filler-added samples compared to WOF material. The enhancement in electromechanical performance was due to these additional functional groups present in the filler-added samples. On considering the results of electromechanical and physico-chemical analysis, it can be concluded that the SiR-rich sample loaded with 5 wt% of TiO2 filler of HD and lesser particle size (XH5p) polymer composite possesses the best electromechanical properties. Small variations in the filler loading and density have shown a distinct change in their electromechanical properties. Hence, sample XH5p, the polymer composite material, is best suitable for high-voltage cable insulation purposes.
Footnotes
Acknowledgements
The authors are highly indebted to the management of SSN College of Engineering for providing the necessary fund to complete the project and also to SSN Research Centre for extending their support to utilize the lab facility required for this research work.
Declaration of conflicting interests
The author(s) declared no potential conflicts of interest with respect to the research, authorship, and/or publication of this article.
Funding
The author(s) disclosed receipt of the following financial support for the research, authorship, and/or publication of this article: This work was supported by SSN College of Engineering.