
Abstract
Multiple environmental stresses produce complex phenomena of aging in polymeric insulators. The main aim of this research is to investigate the improved aging characteristics of silica (SiO2)/alumina trihydrate (ATH) hybrid samples (HSs) in high-temperature vulcanized rubber. For this purpose, three HSs comprising 20% micro-ATH with 2% nano-SiO2 (S2), 4% nano-SiO2 (S4), 6% nano-SiO2 (S6) along with sample-virgin (SV) are subjected to long-term accelerated aging of 9000 h. A special aging chamber is fabricated for the aging process of samples. The aging characteristics of these samples are investigated by measuring leakage current (LC) and hydrophobicity classification (HC) after every weathering cycle. Similarly, Fourier transform infrared (FTIR) spectroscopy is performed to observe the important structural changes over the entire aging time. The dielectric strength of AC is also performed after every 1000 h of aging. Tracking and erosion resistance and mechanical properties are also investigated before and after aging. From the critical investigation, it is observed that HSs possess improved results in all the conducted tests. S2 has the lowest LC and HC values throughout the aging time. Similarly, S6 described the highest breakdown strength at the end of the accelerated aging. In the case of FTIR, it is analyzed that the important wave numbers remain intact for all the HSs in the accelerated aging environment. The loss percentage in the wave number for SV is higher, compared to the HSs. After performing the tracking and erosion resistance test, HSs have superior performance. For some of the mechanical properties, HSs showed improved values. Thus, from the experimental analysis, it is deducted that the sample S2 offers the highest resistance to the aging conditions, compared to the SV and other HSs.
Introduction
In a power distribution system, the reliable power supply is the main concern, thus effective insulation is the most important requirement. For external environmental conditions, polymer insulators are widely used and accepted over the period of the last four decades for medium high voltage applications. 1 Among the polymers, silicone rubber, ethylene propylene diene monomer (EPDM), epoxy, and thermoplastic elastomers are the well-known base materials used for the preparation of composite insulators. 2 From all the polymers, silicone rubber gained more popularity due to its improved hydrophobicity characteristics. 3 -8 In comparison with ceramic and glass insulators, the composite polymeric insulator possesses various advantages, such as lightweight, improved performance in polluted environment, hydrophobicity, and ease of handling. 9 -11 Despite its excellent features, the composite polymer insulators are still under research and in developmental phase. These polymers are susceptible to degradation when subjected to harsh weather conditions. 1
The multiple stresses present in the environment cause degradation in the polymer and this effect causes aging of the insulator. 12 -14 The same degradation phenomenon is experienced by high-temperature vulcanized rubber (HTV-SiR) when subjected to multiple environmental stresses. 2 These environmental stresses cause a decrease in flash overvoltage, increased leakage current (LC), reduction in electrical characteristics, and loss of hydrophobicity. These are the main concerns for the power industry and insulator manufacturers. 15 So, multiple aging is a complex process experienced by insulators when placed in the outdoor environment for long-term reliability.
In recent years, the base materials with micro- and nanofillers are reported to offer enhanced corona, tracking/erosion, thermal and electrical characteristics. 16 -19 The previous researches indicated an improvement in the performance of silicone rubber by the addition of a small amount of fillers. 2,20 In an organic polymer, sometimes an inorganic filler is added to improve the properties of the base material, such as improved thermal stability, breakdown strength, and rigidity. The commonly used inorganic fillers are silica (SiO2), 20 calcium carbonate, 21 aluminum hydroxide, 22 and aluminum oxide. 23
Furthermore, the filler size, percentage, and classification are the major influencing factors for attaining different enhanced characteristics. 24 From all the defined fillers, SiO2 is one of the most reported filler for the polymer. It possesses a variety of applications, namely automotive, different industrial products, electronics, and aerospace applications. Before the advancement in nanotechnology, microfillers were widely used for the upgradation of the base material. Recently, the addition of microparticle is replaced by the addition of a small amount of nanofillers, for further enhancement in its characteristics. In Liu et al., 25 the authors used nano-aluminum oxide as filler with different sizes to enhance the thermal characteristics of the base material. Some recent work proved the enhance performance of polymer by the simultaneous addition of nano and micro (hybrid) as compared to the single filler addition (micro or nano). 26 The aging phenomenon of the hybrid composite will be an interesting phenomenon to investigate in near future.
Considering the above issues, hybrid samples (HSs) with 20% microfiller (alumina trihydrate (ATH)) along with the addition of nanofiller (SiO2) of 2% (S2), 4% (S4), and 6% (S6) are prepared, respectively. For critical and long-term investigation, aging time of 9000 h (≈13.5 years) is considered. Three HSs and one sample-virgin (SV) (neat) samples are analyzed with details as: (a) 2% nano-SiO2 + 20% micro-ATH, (b) 4% nano-SiO2 + 20% micro-ATH, (c) 6% nano-SiO2 + 20% micro-ATH, and (d) SV (neat). All the fillers are added by weight in the HSs. Finally, hydrophobicity classification (HC), LC, breakdown strength, mechanical, tracking/erosion, and Fourier transform infrared (FTIR) spectroscopy are conducted to evaluate and compare the HSs. The major contributions in this article are listed as: Preparation of the above discussed HSs and the construction of an aging chamber with the application of aging conditions. Aging of samples conducted for 9000 h that is equivalent to 13.5 years of field aging. Tests listed as HC, LC, breakdown strength, mechanical properties, erosion/tracking, and FTIR are performed for the investigation of the entire aging period. A comparative analysis of the HSs is performed to select the sample with superior characteristics.
Sample preparation, sample codes, and aging apparatus
Nano and microfillers are bought from Sigma Aldrich, America. Twelve nanometer nano-SiO2 and 5 µm micro-ATH particles are selected for this research work. The details of the particles are presented in Tables 1 and 2. All other chemicals used in this process are industrial grade. For the sample preparation, mixing and compounding method is used. In this method, the fillers are suspended in 100 ml ethanol and then stirred mechanically for 20 min. Ultrasonication is performed on this solution for 30 min to obtain the homogenous suspension of the filler in the mixture. HTV-SiR is added to this solution under sonication. This mixture is heated for an hour at 100°C for the removal of ethanol (only HTV-SiR and fillers are left). For making the mixture hard, sulfur is amalgamated with the mixture and placed in the desiccator for 10 min. The above mixture is placed in a mixer at 150°C for 20 min at 150 r/min. The mixture is poured in preheated steel molds to achieve the desired size and shape of sample. The samples are then cured at room temperature for 1 day (24 h). SiO2 nanoparticles with varying percentages (2%, 4%, and 6%) is added in the HTV-SiR base material, keeping the percentage of ATH constant (20%). One base sample is also prepared for comparison purposes. The dimensions of all the samples are 135 × 100 × 3 mm3. The composition of all samples is shown in Table 3.
Details of microfiller (ATH).

ATH: alumina trihydrate.
Details of nanofiller (SiO2).
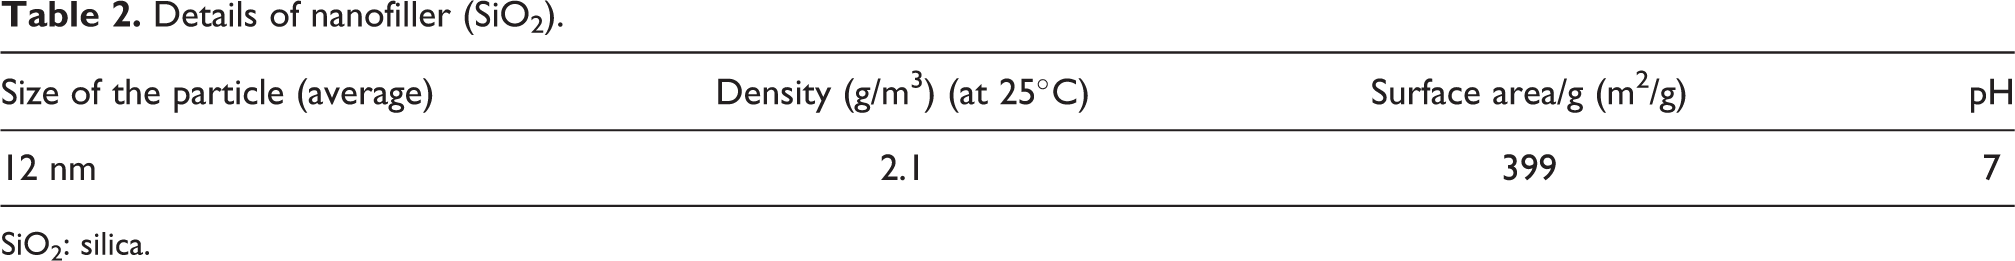
SiO2: silica.
Sample codes and concentrations.
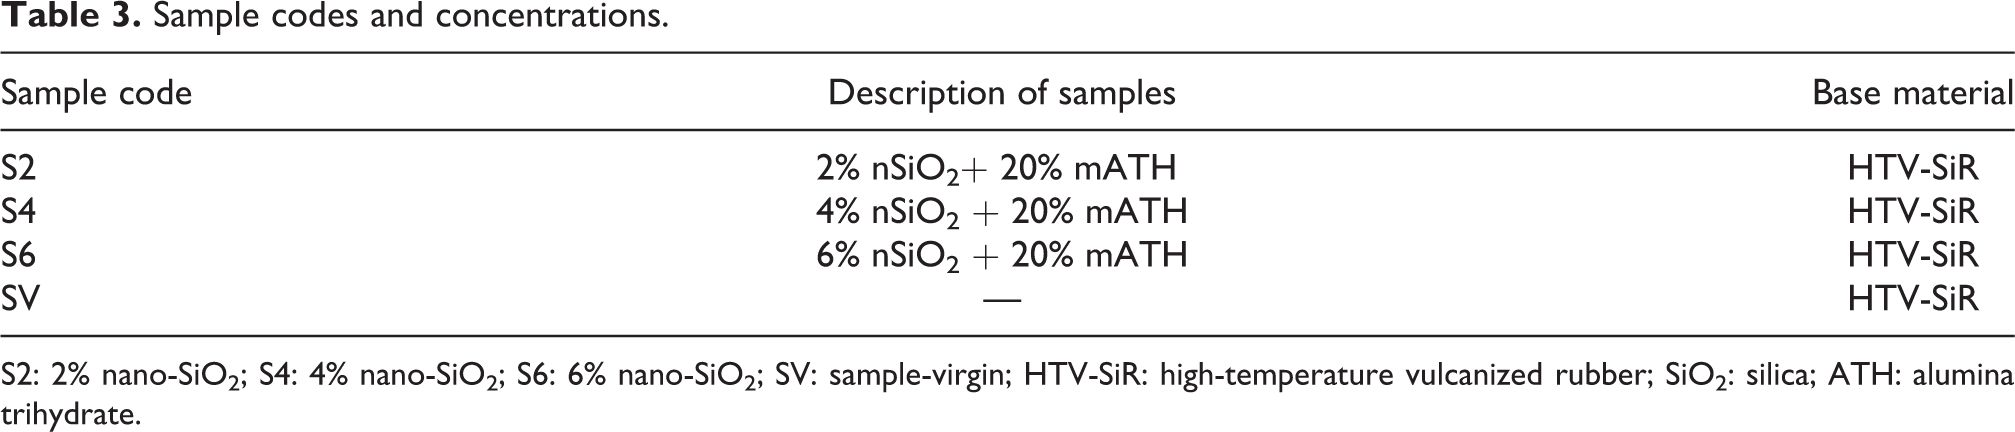
S2: 2% nano-SiO2; S4: 4% nano-SiO2; S6: 6% nano-SiO2; SV: sample-virgin; HTV-SiR: high-temperature vulcanized rubber; SiO2: silica; ATH: alumina trihydrate.
A special aging chamber of 5 ×3 × 2 ft3 is fabricated to simulate the desired aging environment. All the samples are aged in this chamber simultaneously. The fabricated chamber is shown in Figure 1. Figure 2 presents the real aging chamber placed in the High Voltage Laboratory. Figure 3 shows the original samples before the application of aging conditions.

Aging chamber.
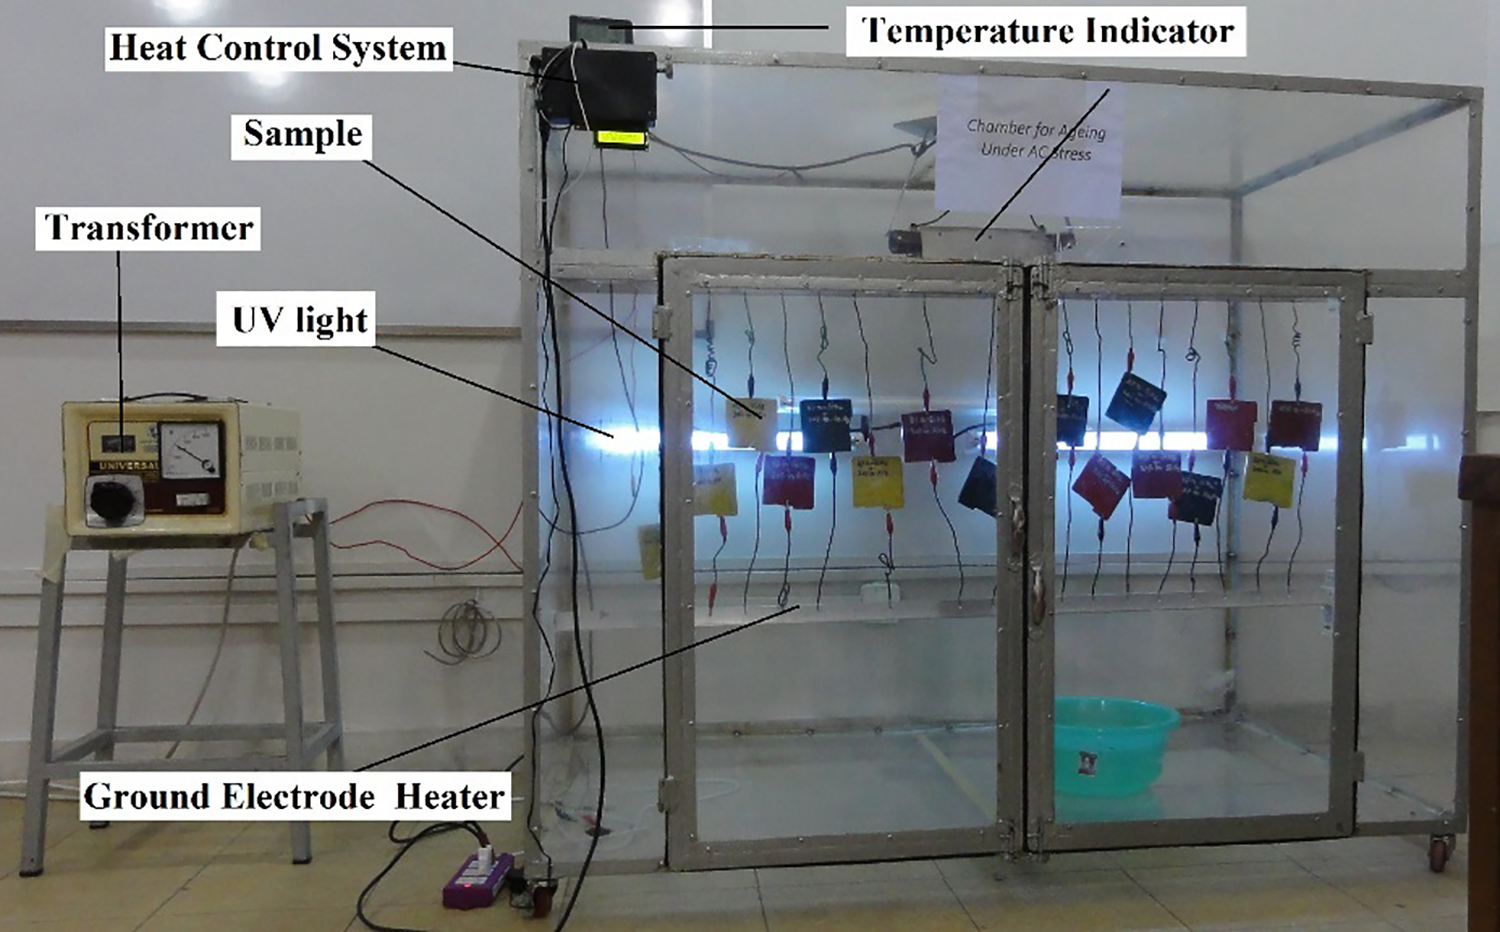
Real aging chamber with samples.

Original samples before aging.
The samples are placed in this chamber and different multi-stresses, namely fog, humidity, acid rain, ultraviolet (UV) radiation, and electrical stresses are applied for 9000 h. For the heating purpose, a 1000 watt heater is used with heat control system. Three (20 watts) UV lamps are used for specific hours according to the different weather cycle requirements described in Table 2. A step-up transformer (220 V/5 kV) is used to provide continuous 2.5 kV to the samples for electrical stress. Summer and winter cycles are developed and then samples are aged accordingly in the aging chamber. The cycle details are given in Table 4.
Summer and winter cycles.

UV: ultraviolet.
Analysis
Hydrophobicity classification
All the prepared samples are classified according to the HC test using a HC guide. 27 To find the hydrophobicity level, the sample is first placed horizontally and then water is sprayed on the surface of the sample. Within 1 min, the droplets are stabilized and photographed. From the photographs, the HC level is identified. Hydrophobicity is performed after every weather cycle, thus 28 values are recorded in this section for 9000 h during laboratory aging.
LC analysis
For LC, 2 kV input source and a 10 kΩ resistor is placed in series with the sample as shown in Figure 4. A voltmeter is used to find the voltage across the sample and LC is calculated. Five readings are recorded for each sample and then its average value is calculated. The readings are taken in a closed chamber. As the LC is directly related to the humidity and environmental temperature, 28 all the values are recorded at 25°C and 40% humidity. Values are recorded for the whole time period of 9000 h after every winter and summer cycle.

Leakage current measurement apparatus where ‘L’ represnts line and ‘N’ represents neutral of the transformer.
Breakdown strength
For the breakdown voltage test, ASTM D149-09 29 is used with a rising rate of 500 kV/s at 60 Hz. The breakdown test is performed at 25°C with the humidity of 45–50%. A sample of 2.5 mm is placed between two round-shaped brass electrodes with 6 cm in diameter. Transformer HV-9015 is used in the laboratory for AC voltage production. A 100 pF capacitor is used which served as voltage measuring capacitor. All the samples are tested for five times and then the average values are recorded. All the breakdown measurements are calculated according to the formula as:

In equation (1), “E bd” is the breakdown strength in kV/mm, “V” is the breakdown voltage, and “t” is the thickness of the sample. Breakdown strength test is performed after every 1000 h to observe the pattern for 9000 h of aging.
Mechanical testing
For performing the tensile strength test on these composite insulators, Universal Testing Machine (Instron, UK) is used. The crosshead speed of 100 mm/min is used according to the ASTM D412 standard. Five samples are tested and their average values are calculated. To find the hardness values of samples, Shore-A durometer (ASTM D2240 standard) is utilized.
FTIR spectroscopic analysis
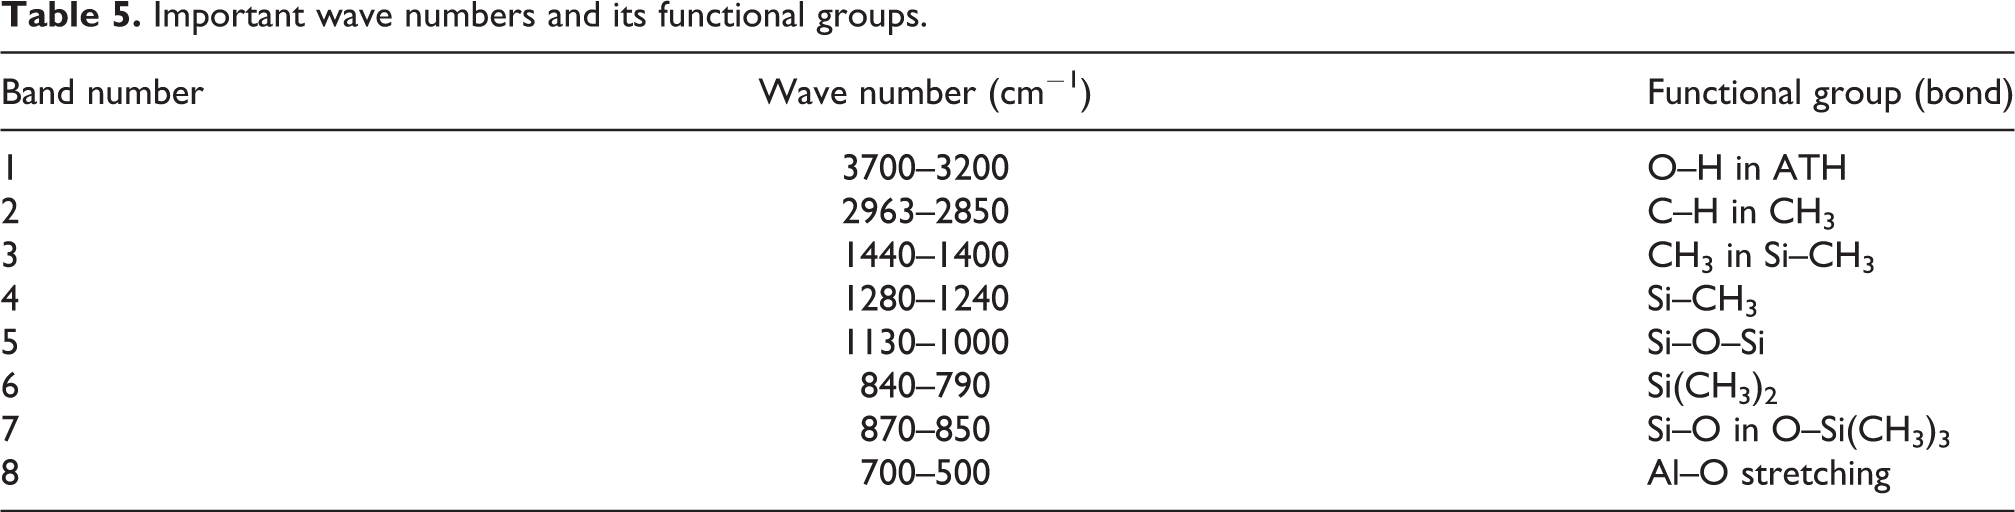
FTIR is used to assess the degradation of the polymer over the period of entire aging hours. Perkin–Elmer Spectrum 2000 FTIR spectrometer (American global corporation) is used to obtain the absorbance spectrographs. At the end of each cycle, spectroscopy is performed immediately. The wave numbers observed are given in Table 5. 30
Important wave numbers and its functional groups.
Tracking and erosion resistance
Inclined plane tracking (IPT) test is used to evaluate the resistance of polymer composites to surface tracking according to the IEC-60587 standard. 31 A comparative tracking analysis is performed for all the HSs and neat sample. A 220 V (50 Hz) AC voltage source with a variable transformer (50 kVA/10 kV) was used to apply voltage according to the standard on each sample (size: 85 × 50 × 6 mm3). A 10 kΩ resistor is added in series with the sample and contamination flow rate of 0.15 ml/min is used. The initial voltage of 2 kV with an increment of 0.25 kV after every hour is selected according to the standard. 31 For contamination source, ammonium chloride (NH4Cl) with concentration of 1 g/dm3 of distilled water is utilized. In addition, while measuring the LC, the sample’s thermal images are also monitored and recorded using Flir-TG165 infrared (IR) camera. A digital multimeter is used for monitoring the LC for specific time period. All the samples were treated with isopropyl alcohol before initializing the test.
Results
Hydrophobicity classification
Figures 5 and 6 show the real-time pictures for HC before and after aging. Figure 7 shows the HC level for all the samples and cycles. During the entire aging period of 9000 h, the recovery and loss pattern in hydrophobicity can be observed. This loss and recovery pattern in hydrophobicity was also observed by other researchers. 32,33 It can be seen from Figure 7 that SV sample losses hydrophobicity from HC1 to HC5 level. The SV sample started with a high HC3 level and then dropping to HC2 level for some time. However, the HSs lose the hydrophobicity from HC1 to HC2 level. From Figure 7, it can be analyzed that near 6000 h aging time, all the samples lose their hydrophobicity, thus rising to next HC level.
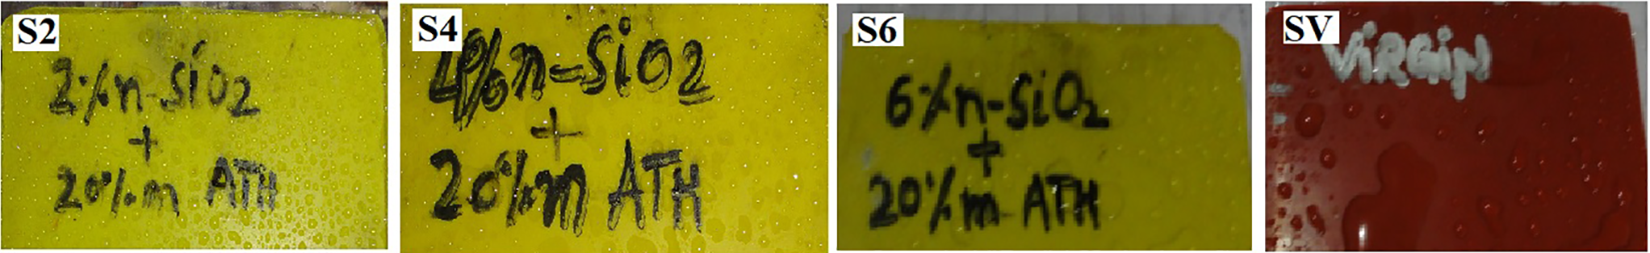
HC before aging.
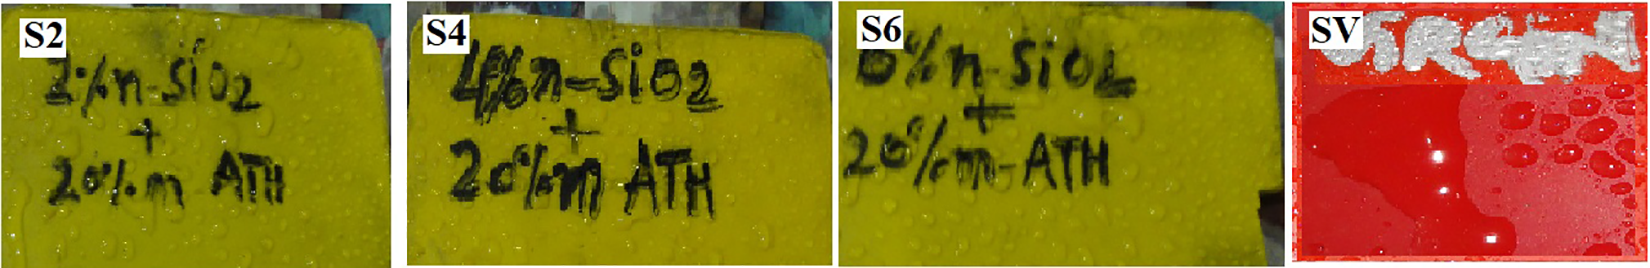
HC after aging of 9000 hours.

Hydrophobicity classification of all samples for 9000 hours.
Leakage current
From Figure 8, LC values for every summer and winter cycle can be observed. All the samples show the loss and recovery pattern, also verified by the HC results. The same pattern was also verified by past researchers. 33 In the beginning, in case of SV sample, the LC has the highest value of 5.54 µA, whereas the HSs (S2, S4, S6) have LC of 2.27 µA, 3.2 µA, and 3.47 µA. Then after aging, a decrease in the LC is observed for all HSs and SV. At around 6000 h, all the samples experience an increase in the LC that can also be verified by the HC. The reason for this abrupt increase in all the samples is unknown and the term “Saturation Current” is used by the authors. 31 All the authors observed that this rise in LC at some point is due to long-term aging of silicone rubber.

Leakage current of all samples for 9000 hours.
At 9000 h, the LC value for HSs (S2, S4, S6) is 2.23 µA, 2.29 µA, and 2.27 µA. In the case of SV samples, the value is 3.27 µA. All the HSs have comparable LC values at the end of the aging whereas SV shows relatively high value. Higher values of the LC indicate the degradation of the polymer due to the application of electrical and environmental stresses.
Breakdown strength
Figure 9 describe the breakdown strength of all the samples. Based on the experimental analysis and standards, the level of deterioration of the samples is assessed on the basis of calculation of the mean breakdown strength compared with the SV sample. From the graph in Figure 9, it can be seen that the un-aged HSs (S2, S4, S6) possess relatively high breakdown strength (23.8, 24.1, 24.3 kV) as compared to the SV sample (20.7 kV). The decrease in the breakdown strength for all the samples is observed over the entire time of 9000 h due to the aging of the samples. For SV sample, the breakdown reduces to the lowest breakdown strength of 16.1 kV, compared to the other HSs. In HSs, S6 moves down to 20 kV after 9000 h aging that is the lowest among all the HSs. However, the end result of breakdown after aging for all the HSs is comparable. The best breakdown strength after 9000 h of aging is exhibited by S2 and then S4.
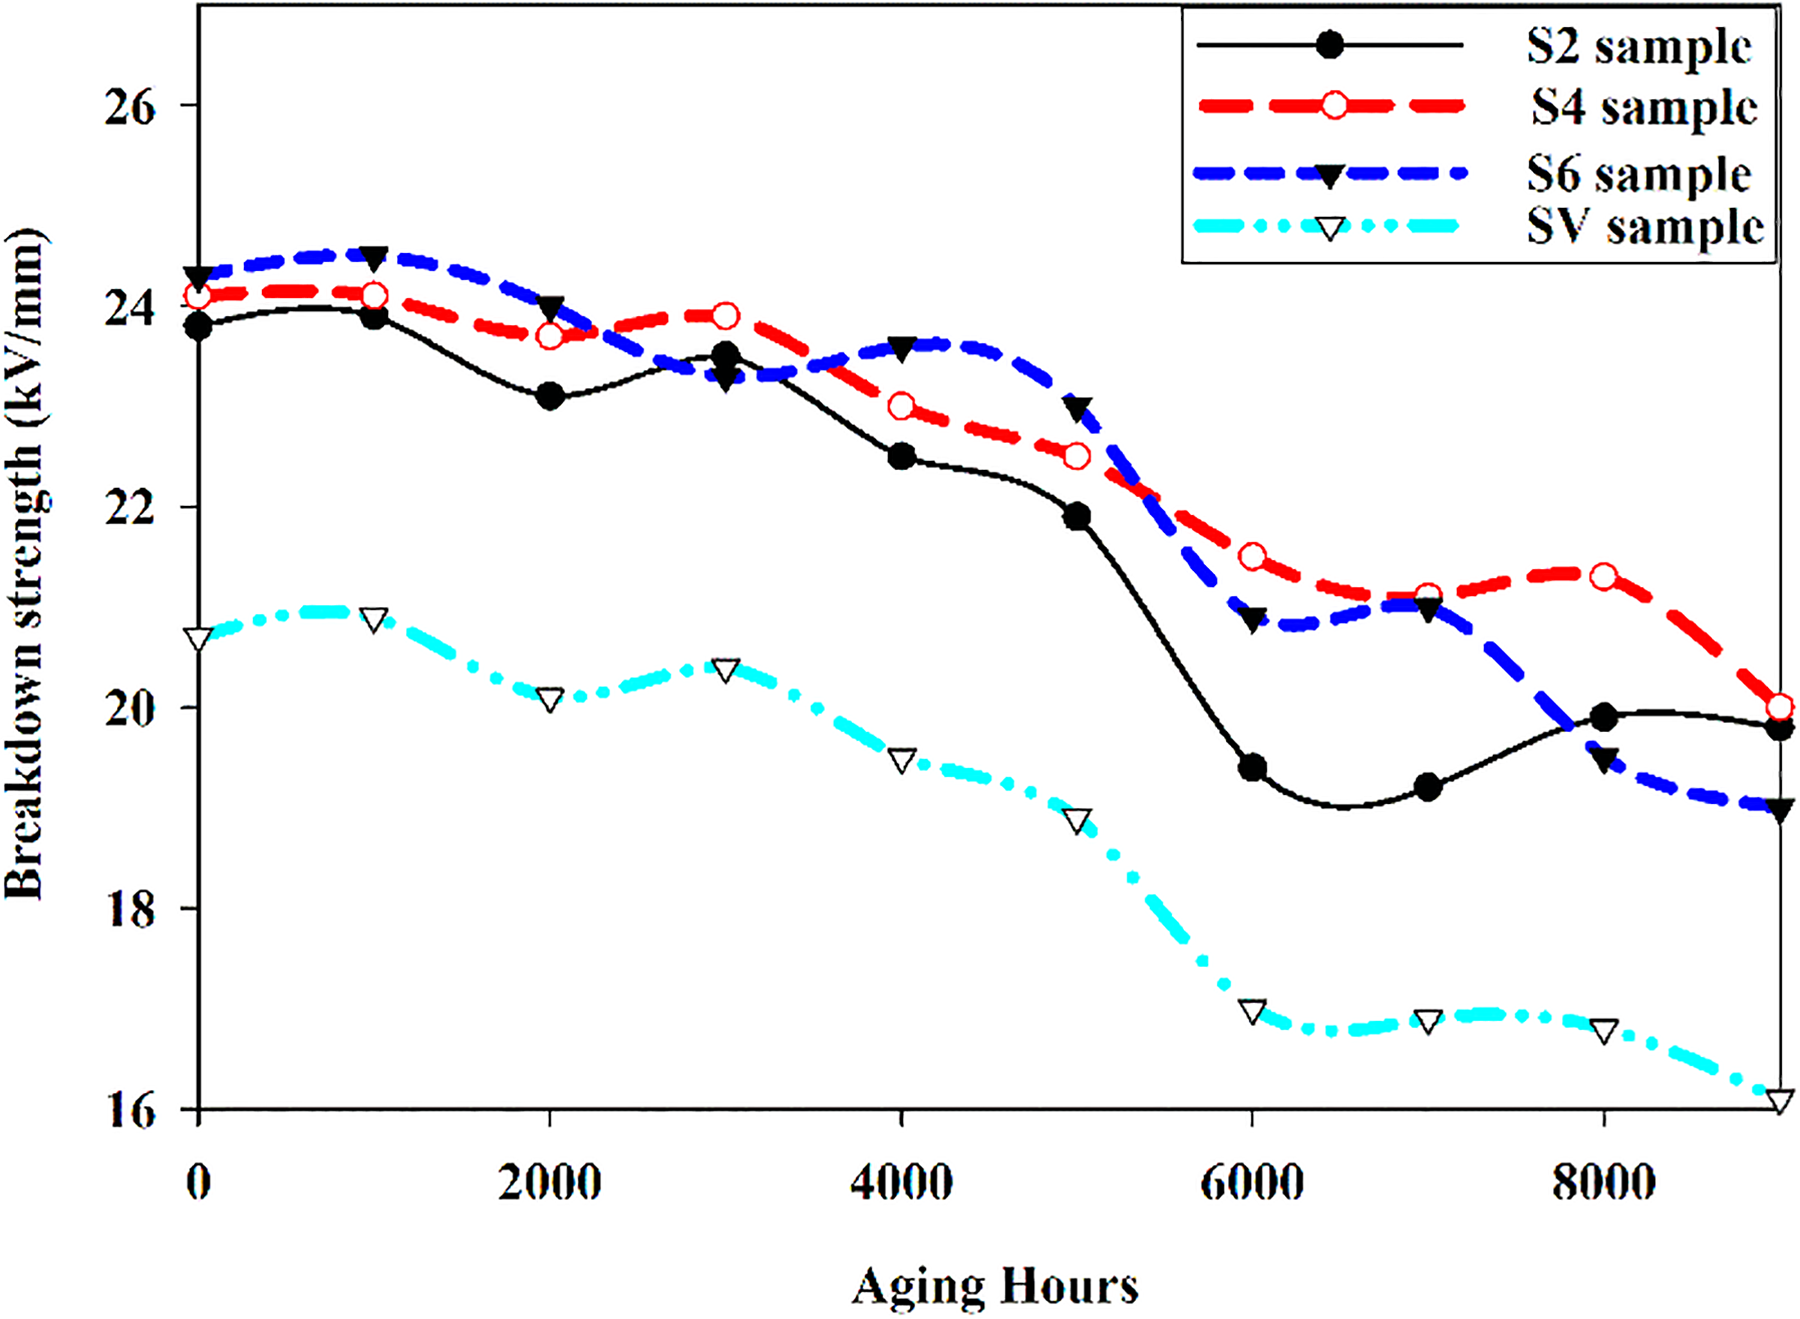
Breakdown strength for 9000 hours.
Mechanical properties
Mechanical properties such as ultimate stress, elongation at break, and hardness are presented in Table 6 for all the blends of HSs before and after aging.
Mechanical properties of the samples before and after aging.

S2: 2% nano-SiO2; S4: 4% nano-SiO2; S6: 6% nano-SiO2; SV: sample-virgin.
Substantial increase in the stress value can be observed from S2 to S4 sample. The highest stress value was exhibited by the S6 sample. However, when compared with SV sample and HSs, the S2 sample has the lowest stress value. The improvement in the HSs (S4 and S6) is due to the high surface area, uniform dispersion, micro-/nanoparticle interaction with the base, and compatibility of micro-(ATH) and nano-(SiO2) particles. So, the S6 sample has the superior stress value among all the samples with highest nano-SiO2 content of 6%. The results after aging showed 5%, 7%, 11%, and 8.2% loss for S2, S4, S6, and SV, respectively.
In the case of elongation at break (%), an increasing trend was recorded for HSs. However, all the HSs have the lowest values as compared to the SV sample. The decreased values of elongation at break (%) as compared to the SV sample indicate the stiffness of the HSs. After aging, the lowest loss in the elongation at break (%) among HSs was presented by S2 sample which is 7% whereas the highest loss in elongation at break is exhibited by S6 sample which is 10.2%. The highest loss was exhibited by the SV (23%), indicating the sample highly affected by the weathering conditions.
Before aging, the hardness of the samples increases with the varying filler loading. The highest value is exhibited by the S6 sample and overall HSs have the highest values as compared to SV sample. After aging, the same pattern was observed with S6 having the highest value of 68. The results indicated the better concentration of the nano-/microfiller and interaction with the polymer matrix in case of hybrids is the main reason for the improved performance in the environmental stresses.
FTIR spectroscopic analysis
The spectrographs for the entire aging time period for all the samples are shown in Figures 10 to 13. The absorbance peaks indicate the presence of specific structures and bonds that are further compared with the aged samples. Variation of peaks is observed continuously during the entire aging period due to degradation caused by the different electrical, thermal, and weathering stresses.

(a) FTIR for S2 before aging, (b) FTIR for S2 after aging.

(a) FTIR for S4 before aging, (b) FTIR for S4 after aging.

(a) FTIR for S6 before aging, (b) FTIR for S6 after aging.

(a) FTIR for SV before aging, (b) FTIR for SV after aging.
In the case of S2 sample, from Figure 10, the wave number at 3700–3200 (cm−1) for O–H in ATH showed 100% increase in intensity after the sample is aged. This indicated the presence of water throughout the 9000 h. The presence and increase in the water component after aging indicates the hydrophobicity of the sample. For the wave number at 2963–2850 (cm−1) for the C–H bond in CH3, a loss–gain pattern is observed, compared to the un-aged sample. 15.8%, 16.8%, 21.0%, 21.0%, 21.0%, 24.2%, 18.9%, 16.8%, and 15.7% loss is observed for 936, 2016, 2952, 4032, 4968, 6048, 6984, 8064, and 9000 h. The continuous loss in peaks is present till the 6048 h and after that a recovering pattern is found. The same pattern is observed in HC classification, breakdown and LC values. For 1440–1400 (cm−1) peak showing CH3 in Si–CH3, the loss is shown after 2952 h and indicates the same recovery in loss after 6048 h. In case of 1440–1400 (cm−1), 840–790 (cm−1) and 870–850 (cm−1) show the same loss and then gain after 6000 h. However, for Si–O–Si bond at peak the wave number 1130–1000 (cm−1), the recovery at the end is with a gain of 7.7%. The Al–O stretching shows the highest percentage loss of 18% at the end of the 9000 h aging.
For sample S4, the same 100% increase for wave number 3700–3200 (cm−1) for O–H bond in ATH is present indicating the presence of water and the increase in the hydrophobicity of the sample at the end of aging. The wave numbers at 2963–2850 (cm−1) for C–H in CH3 show an increase in percentage loss around 6000 h and then the gain–recovery pattern is present. This wave number reaches to 20% loss in its magnitude after 9000 h of aging. 1440–1400 (cm−1) peak showing CH3 bond in Si–CH3 and 1130–1000 (cm−1) for Si–O–Si bond indicate the highest loss pattern around 6000 h. The wave 1440–1400 (cm−1) fully loses itself at the end of aging. All the other waves show same pattern around 6000 h and then recovery after it except the Al–O stretch and CH3 bond in Si–CH3. The Al–O stretch experience the highest loss percentage of 23% after the recovery of 27.53% loss percentage around 6000 h. However, the wave number at 1130–1000 (cm−1) for the Si–O–Si bond is the only peak that almost recovers fully and showed a loss of 4%.
The variation for the S6 sample is presented in Figure 12. Sample S6 absorbance peaks also show the variation pattern for all the wave numbers that are presented in Figure 12. The wave number at 3700–3200 (cm−1) for the O–H bond showed 100% increase after 9000 h. This wave number behavior is same for all the HSs. CH3 bond in Si–CH3 at wave number 1440–1400 (cm−1) is totally lost at 2952 h and then regained itself at 6984 h. This wave number is lost again to full at the end of the experiment thus indicating the destruction of CH3 bond in Si–CH3 bond due to weathering and oxidization after laboratory aging. The percentage loss in Si–O bond in O–Si– (CH3)3 for the wave number 870–850 (cm−1) is 13.63% that is highest loss among all wave number at the end of the laboratory aging. However, the overall percentage loss for all the wave number is very less as compared to the other sample. Therefore, the above phenomenon makes it more resistant to the long-term accelerated aging.
For the SV sample, the loss–recovery pattern is observed by all the absorbance peaks but percentage loss for all the peaks mentioned in Table 5 is highest as compared to the HSs. CH3 bond in Si–CH3 at the wave number 1440–1400 (cm−1) is the one that losses itself 100% and unable to recover itself. Wave numbers 1130–1000 (cm−1) for Si–O–Si bond, 840–790 (cm−1) for Si– (CH3)2, and 870–850 (cm−1) for Si–O bond in O–Si(CH3)3 are the ones with a percentage loss of 25% at the end of experiment. The loss–recovery pattern is observed for all the wave numbers except 1440–1400 (cm−1). Overall, the loss recovery percentage for SV is higher as compared to the HSs. This indicates the adverse weathering effects on this sample as compared to the HSs, thus making HSs more reliable option in FTIR spectroscopy.
Tracking and erosion resistance
The LC before and after aging for tracking/erosion test results are presented in Tables 7 and 8. Whereas the IR thermographs for the testing time are added in Tables 9 and 10, respectively. For tolerance time, all the samples passed the 6-h test without failing. From Table 7, it is observed that the lowest LC throughout the test is exhibited by S2 (1.09–1.27 µA), whereas the highest current values are recorded for SV (3.99–5.99 µA). Among HSs, the second and third lowest LC values are measured for the S4 and S6. The same pattern was present in previous tests. The IR thermograph in Table 9 reflects the same situation as in Table 7.
LC values for tracking/erosion test before aging.

S2: 2% nano-SiO2; S4: 4% nano-SiO2; S6: 6% nano-SiO2; SV: sample-virgin; LC: leakage current.
LC values for tracking/erosion test after aging.

LC: leakage current; S2: 2% nano-SiO2; S4: 4% nano-SiO2; S6: 6% nano-SiO2; SV: sample-virgin.
IR thermographs before aging.

IR: infrared; S2: 2% nano-SiO2; S4: 4% nano-SiO2; S6: 6% nano-SiO2; SV: sample-virgin.
IR thermographs after aging.
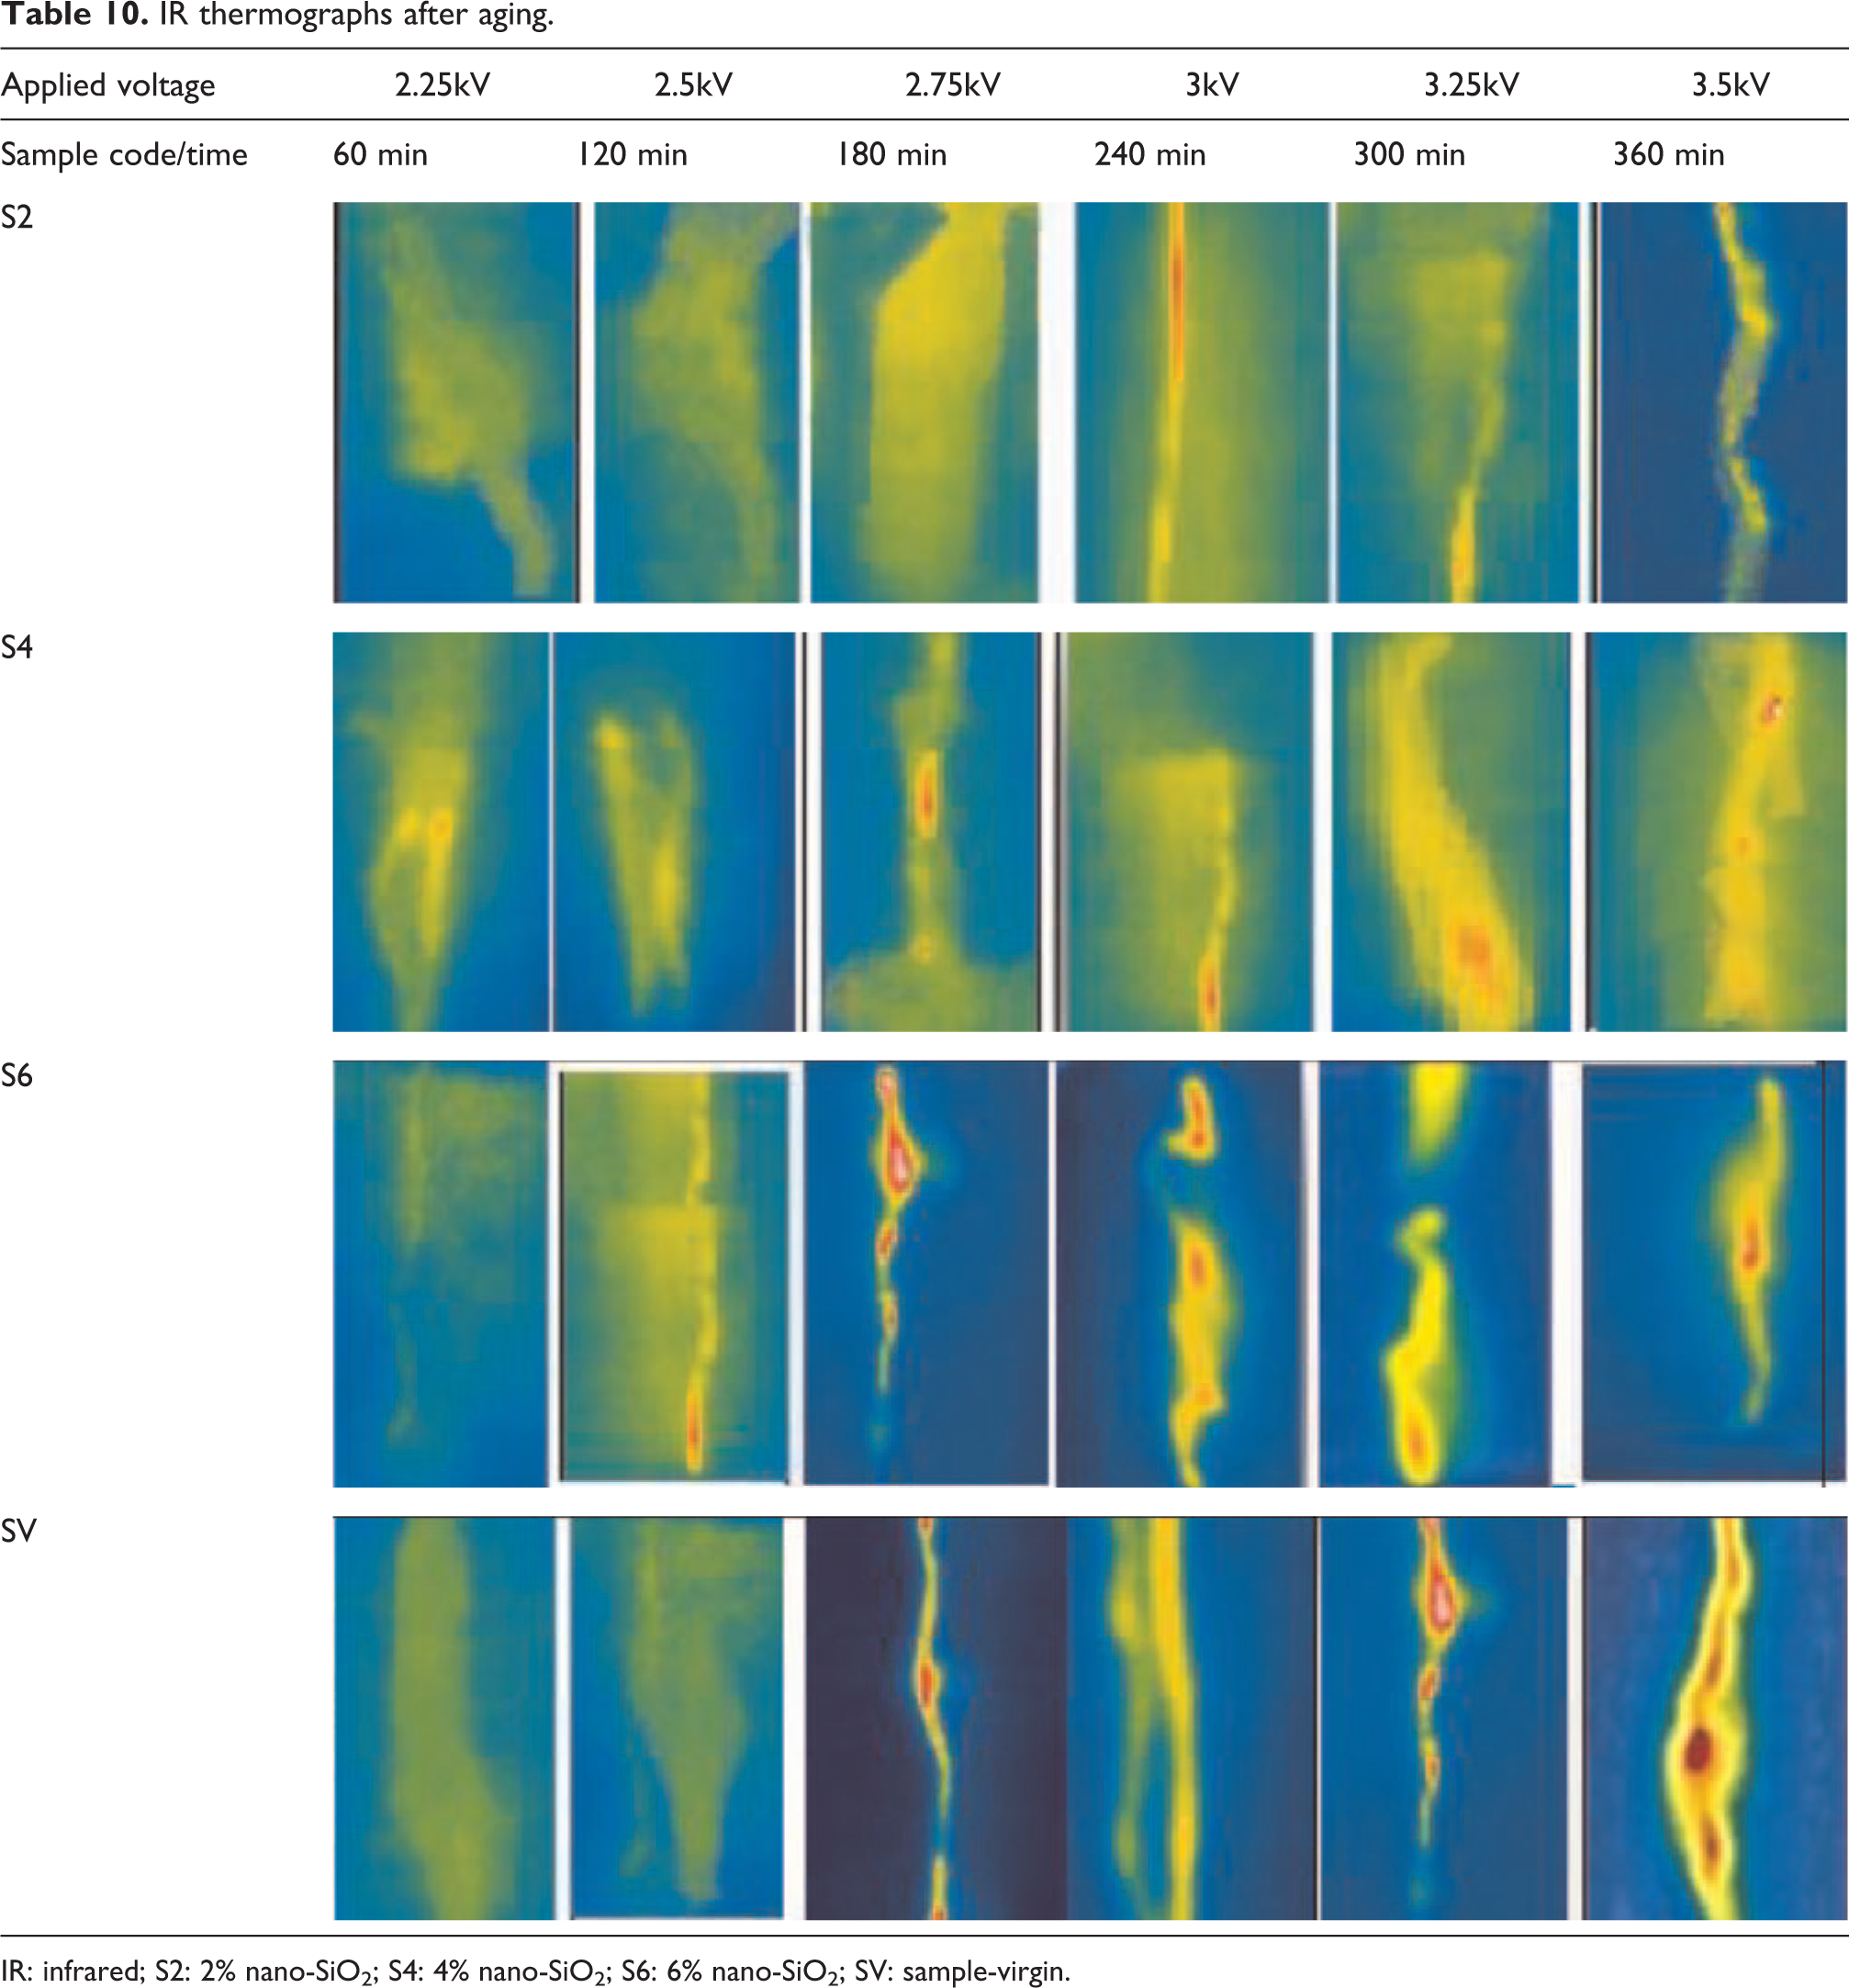
IR: infrared; S2: 2% nano-SiO2; S4: 4% nano-SiO2; S6: 6% nano-SiO2; SV: sample-virgin.
In the case of aging, an increase in LC is observed for all samples. For S2, the test started at 2.10 µA and ended at 2.29 µA. In case of S4, the LC started at 2.16 µA at 5 min and ended at 3.32 µA. For S6, the initial LC is 2.40 µA and the final LC is 3.51 µA. SV sample has the highest LC started at 4.19 µA and ended with 7.89 µA. However, all the HSs have improved performance as compared to SV. Among all the HS, S2 has the superior tracking/erosion resistance to the environmental conditions after long-term accelerated aging.
Siloxane backbone analysis
The presence of a unique siloxane backbone is the main reason for the silicone rubber precedence over the other polymers present for high voltage insulation. The siloxane chain is also responsible for the hydrophobicity recovery phenomenon. Therefore, the intensity and presence of this group is very important to investigate the measure of degradation caused by external environmental factors. The aging conditions in rubber usually cause the scission of the siloxane chain. Hence, it is of utmost importance to analyze the condition of this group throughout the aging process. FTIR is performed for observing all the important wave numbers. From all the wave number, 1130–1000 (cm−1) (Si–O–Si) showed the intensity for the siloxane backbone. So it is important to check the absorbance of the residual for this specific wave number.
For the S2 sample, the loss percentage for wave number 1130–1000 (cm−1) at the end of aging is 0%. Around 6000 h, the percentage loss is 6%. The sample recover itself after 6000 h and maintained its recovery until the end. In the case of S4 sample, the wave number 1130–1000 (cm−1) percentage loss is 4% at the end. However, the loss around 6000 h is 16%. This sample also recovered itself. But full recovery is not observed for this sample. The wave number 1130–1000 (cm−1) for sample S6 showed loss percentage of 6% at the end of the aging cycles. The maximum loss in percentage (18%) is observed before 6000 h. After 6000 h, recovery phase is observed for S6. For SV sample, the highest percentage loss of 25% is exhibited by the wave number 1130–1000 (cm−1). In case of SV, the recovery is not much pronounced.
From all these percentage losses, it can be concluded that the Si–O–Si bone is affected by weathering conditions in S2 but it has recovered itself. The same is the case with the S4 sample and S6. However, for SV, the loss is permanent at the end of the test. From analyzing the siloxane backbone from FTIR test, it can be concluded that the S2 sample has superior performance among all the samples. The recovery of this wave showed the intactness of the sample at molecular level. An increase in nano-SiO2 particle improves some of the mechanical and dielectric properties of the HSs, however, it does not guarantee the intactness of sample after long term aging.
Discussion
The loss in hydrophobicity shows that the HTV-SiR samples experience degradation of insulation when exposed to the laboratory aging. The loss and gain pattern presented by all the samples are also verified by the LC measurements. From hydrophobicity pattern, it is elaborated that HSs maintain their hydrophobicity for a long time, whereas the SV sample losses its hydrophobicity more quickly or completely if exposed to the environmental conditions for longer period of time. The long term and permanent loss of hydrophobicity in silicone rubber was observed by Du et al. 33 and Zhu et al. 34 when exposed to the corona stress for a long period of time. However, in our case, the HSs are unable to lose their hydrophobicity after subjecting to long-term laboratory aging thus making them superior. The environmental stresses, such as applied voltage and exposure to UV radiations, produce ionic particles and ozone. These stresses affect the insulation at chemical level by breaking the bond and degrading the macromolecular chain to low weight molecules (LWMs). 34 The production of ozone will degrade the insulation by initiating a chain of reactions forming stronger polar groups, such as –OH, –C=O and C-O, pore and tree structures, and cross-linking of molecular structures. The reaction mechanism is given Figure 14.
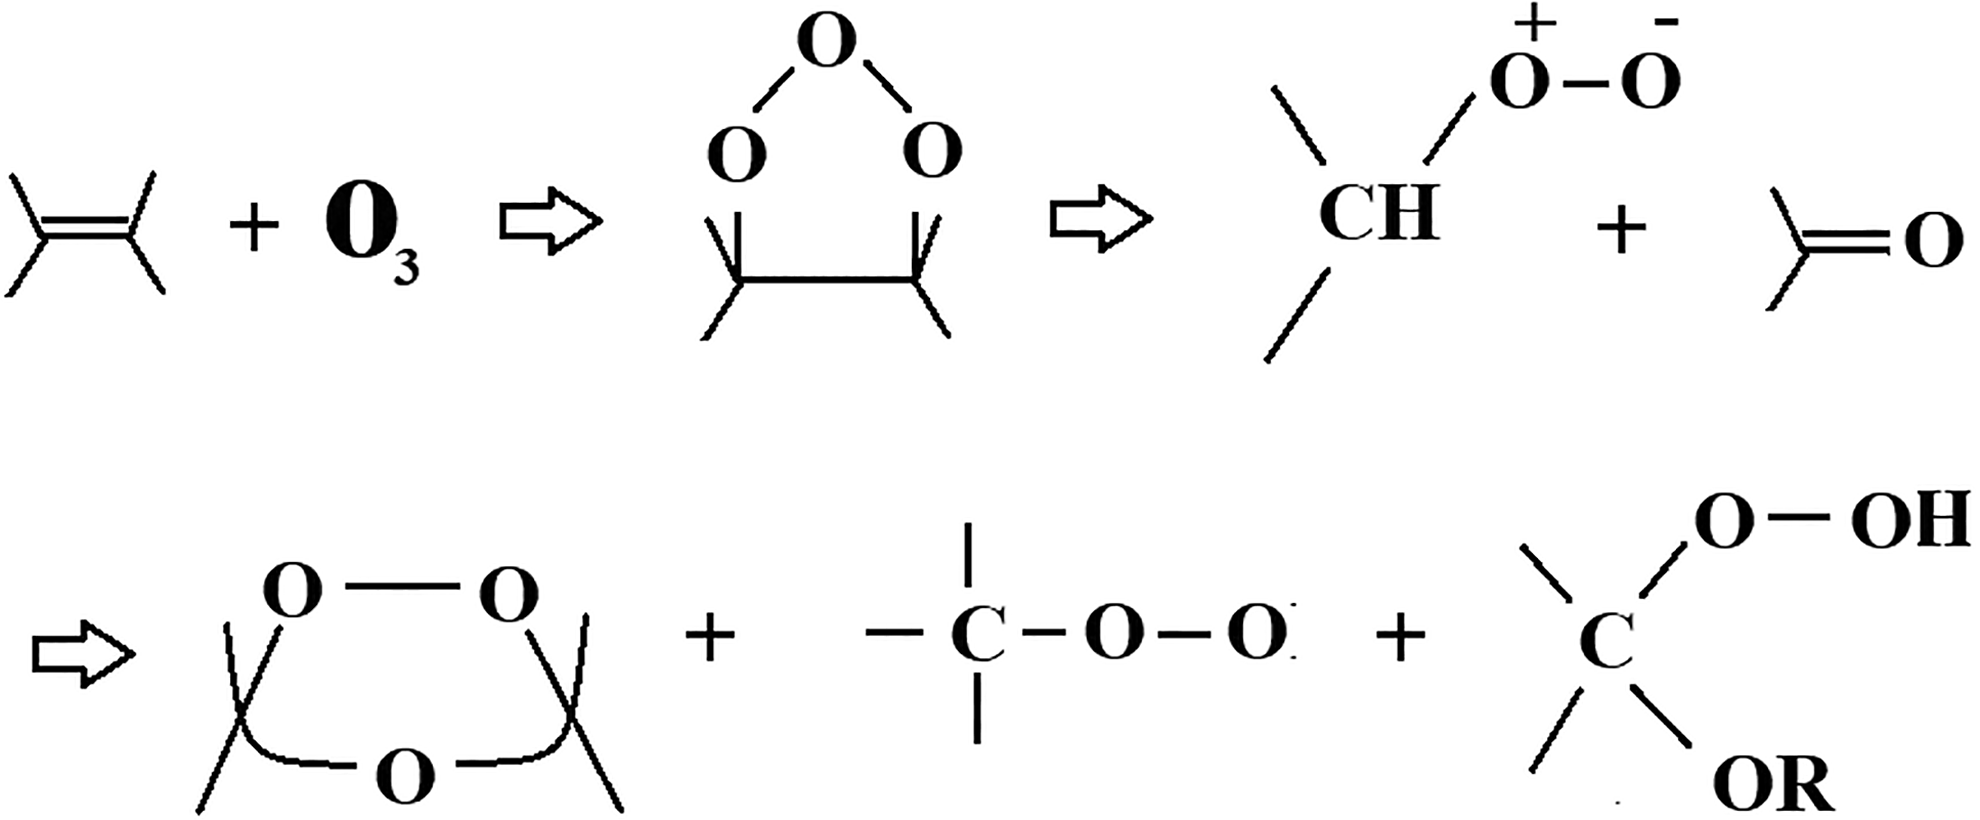
Silicone rubber reaction with ozone.
Thus, the above-discussed reasons show the degradation of all the samples around 6000 h. The improvement in the HC level for HSs is because of the addition of micro- and nanofiller. The addition of fillers increases the interaction between the silanol group and the silicone rubber due to which the HSs become resistant to environmental/electrical stresses. After 6000 h, the recovery pattern is observed due to the movement of LWMs to the surface of the HSs. The loss pattern after 8000 h was observed due to the aging effects on the HSs. However, keeping in view the hydrophobicity factor, the S2 sample is the best option among all the samples.
The improved performance for LC in the case of hybrid composite is mainly due to the addition of nanoparticles as well as microparticles. Synergy effect is caused by the simultaneous addition of nano- and microparticle thus proving them to be more reliable. 35 All the samples show comparable LC values; however, the S2 sample is selected on the basis of lower amount of nanoparticles.
The highest breakdown strength for all the hybrids is due to homogenous filler structure, higher bond energy, and lower surface energy. Furthermore, the addition of both nano- and microparticles increases the bonding energy and cross-linking between the base matrix and the filler, thus results in improved breakdown strength of the HSs. The micro- and nanofiller addition improves the thermal conductivity 36 that in return improves the breakdown strength of the HSs. In Khan et al., 26 the authors observed an improvement in breakdown strength when nano- and micro-SiO2 were added in silicone, epoxy, and EPDM. According to the authors, the reason for improved breakdown strength is due to barrier formation by the addition of micro- and nanofillers in base material. The same phenomenon is observed in our case.
The main reason for the superior performance of HSs in the tensile strength test after aging is the presence of O2 (oxygen) on the surface of SiO2 that attributed to the hydrogen bond formation resulted in improved characteristics. 37 -39 The lowest loss in elongation at break for HSs is due to high cross-linking of the base matrix with the nano-/microfillers that restrict the movement of polymer chain thus sustaining the improved elongation at break (%) value. The reason for the improved hardness for HSs is the micro-/nano-interaction with the base matrix, cross-linking, and uniform dispersion that is less affected by long-term aging.
In the case of FTIR analysis, the decrease in absorbance peaks of Si–CH3, Si–O–Si, and C–H groups of silicone polymer was previously reported by many researchers due to weathering. 40 For all HSs, the base material is silicone rubber, and the loss and recovery pattern for silicone rubber was observed by other authors. 9 However, the addition of nano- and microfillers improved the loss and percentage pattern as compared to the one with base material after aging. The addition of SiO2 nanoparticles also showed enhanced properties in silicone rubber at different conditions. 41 The reason for the improved properties is the presence of the silanol groups present on the nano-SiO2 particle, the main part to keep the polymer intact and thus resistant to extreme weathering. 42-43
From the recorded values of the IPT test, it can be observed that an increase in the LC is observed as the addition of the SiO2 particles increases. Previously, ATH was used in polymers for improved tracking/erosion. 44 However, in our case, other than ATH, variation in the nano-SiO2 also affects the tracking/erosion resistance. The addition of nano-SiO2 along with ATH increases the surface resistance that makes HSs resistant to IPT conditions.
Comparative analysis: Critical discussion with recent state-of-art work
From the above analysis, it is concluded that S2 outperforms the rest of the samples. Moving one step forward, the performance of S2 is further investigated with state-of-the-art published work. Table 11 presents a critical analysis of S2 with other samples based on the following: (a) aging time, (b) wave numbers, (c) % loss in absorbance peaks after aging, (d) LC, (e) breakdown strength, and (f) HC. In Verma et al., 15 the investigation was conducted for 1000 h. However, after aging of 9000 h, it is analyzed in our research that S2 presents a profound improvement. All of the samples in Verma et al. 15 presented an increased LC, thus indicating the extensive deterioration of the samples. S2 shows the lowest LC, making it more stable after 9000 h of aging. S2 presented improved breakdown strength (percentage loss) as compared to the samples in Yuan et al. 10 In case of Khattak et al., 32 5000 h aging was performed and the obtained results indicated the improved performance of SNC-5 (silicone rubber with 5 wt% nano-SiO2). The overlapping wave number presented better performance of SNC-5 as compared to the SNC-2.5 (silicone rubber with 2.5 wt% nano-SiO2). SNC-5 shows some wave number with lower loss percentage as compared to our S2. This may be due to the extended aging time period of 9000 h. Overall, the improved LC, breakdown strength loss, and HC are compared to the results in Khattak et al. 32 The research article 45 investigated the results for the real-time aged sample of 3–22 years. The important wave numbers indicated the highest degradation caused by extreme aging conditions. However, our work presented the results after approximately 13.5 years of aging. In case of Nazir and Phung, 30 the HSs were prepared and subjected to extreme corona for 7 days. After FTIR analysis, their sample MSR1 (39% micro-ATH + 1% nano-alumina) described the minimum loss percentage for important wave number. When above works are compared with our HSs, S2 presents the lowest percentage loss after aging, making it better option for selection after aging. The main reason for the enhanced results is the improved interaction of the micro- and nanofiller with the base material. S2 sample possessed superior surface quality, loss in wave numbers, LC, and HC.
Comparison of our work with recent research papers, where ‘—’ represents the increase or gain.

RTV-SiR: room temperature vulcanized silicone rubber; HC: hydrophobicity classification; LC: leakage current; SiO2: silica; ATH: alumina trihydrate; SNC-2.5: silicone rubber with 2.5 wt% nano-SiO2; SNC-5: silicone rubber with 5 wt% nano-SiO2.
Conclusion
This research investigates the long-term accelerated aging characteristics of the co-filled nano-SiO2 and micro-ATH HSs (HSs (S2, S4, S6)) in HTV silicone rubber as the base. After the experimental testing, it is concluded that the simultaneous addition of nano-SiO2 and micro-ATH in HSs resulted in improved electrical, mechanical, and aging characteristics as compared to the unfilled sample. The HC shows loss and recovery pattern but the loss for the unfilled sample is highest as compared to the HSs. The highest breakdown strength is also observed in HSs. Resistance to tracking and erosion test indicated the improved tolerance to the test conditions before and after aging for HSs. In the case of FTIR, the low loss percentage is observed for all HSs. From all the experimentation, it can be observed that around 6000 h of aging, a decline in the readings are observed. After 6000 h, all the samples recover themselves but HSs showed high recovery rate as compared to the unfilled sample. The reason for the improved performance of HSs is mainly due to the addition of small amount of micro- and nanoparticle, thus gaining the benefit of both particles. From all the HSs, S2 sample (2% wt SiO2 + 20% wt micro-ATH) is selected for improved characteristics, thus making it economically suitable for outdoor insulation application.
Supplemental material
supplementary_document - Long-term aging characteristics of co-filled nano-silica and micro-ATH in HTV silicone rubber composite insulators
supplementary_document for Long-term aging characteristics of co-filled nano-silica and micro-ATH in HTV silicone rubber composite insulators by Arooj Rashid, Jawad Saleem, Muhammad Amin and Sahibzada Muhammad Ali in Polymers and Polymer Composites
Footnotes
Acknowledgement
The authors are highly grateful to the High Voltage and Short Circuit Laboratory, Rawat, High Voltage Lab COMSATS University, and GIK Laboratory for providing a platform to conduct HV tests smoothly.
Declaration of conflicting interests
The author(s) declared no potential conflicts of interest with respect to the research, authorship, and/or publication of this article.
Funding
The author(s) received no financial support for the research, authorship, and/or publication of this article.
Supplemental material
Supplemental material for this article is available online.
References
Supplementary Material
Please find the following supplemental material available below.
For Open Access articles published under a Creative Commons License, all supplemental material carries the same license as the article it is associated with.
For non-Open Access articles published, all supplemental material carries a non-exclusive license, and permission requests for re-use of supplemental material or any part of supplemental material shall be sent directly to the copyright owner as specified in the copyright notice associated with the article.