
Abstract
Polypropylene (PP) satisfies many of the requirements as power cable insulation thanks to its high thermal stability, ability to withstand high voltages, and eco-friendly properties. Due to the high stiffness and brittleness of PP, the extrusion of PP as power cable insulation becomes difficult. Therefore, elastomers have been blended with PP to enhance PP’s flexibility. Nevertheless, one common issue arises when blending elastomer with PP is the degradation of PP/elastomer blends’ dielectric properties. Recently, nanodielectrics have drawn utmost attention as a promising material system for improving the overall performance of polymer-based insulating materials, but such a material system has yet to be pursued for PP blend materials. The current work therefore investigates the effects of titania (TiO2) on the structure and dielectric properties of PP/ethylene-based elastomer (EBE) and PP/propylene-based elastomer (PBE). While adding high amounts of TiO2 degrades the blend materials’ breakdown strength, the inclusion of small amounts (0.5 wt% and 1 wt%) of TiO2 improves the breakdown strength of the blend materials by as much as 10%. Notably, the effect of TiO2 is more apparent on PP/EBE system over PP/PBE system. Mechanisms underlying changes in the breakdown strength of the materials, under both alternating current (AC) and direct current (DC) fields, are analyzed.
Introduction
Many attempts to develop advanced polymeric insulating materials in the cable industry are gaining traction, driven by the anticipation of future capacity expansion. Worldwide, rapid advancements in high-voltage power cable technology demand materials that can withstand higher operating temperatures and reduce electric field stress, surpassing the performance of conventional cross-linked polyethylene (XLPE). 1 Polypropylene (PP) has been suggested as a prime candidate due to its good thermo-mechanical and electrical properties. 2 The emergence of PP has been considered in academia and started in the early 2000s as a viable alternative for XLPE. 3 PP meets most criteria as an alternative for XLPE due to its high thermal stability, boasting a melting point of around 165°C, and has excellent capability for melt processing. 4 Moreover, as sustainable materials are becoming a future trend in power cable insulation, PP offers significant advantages in recyclability. Nevertheless, high stiffness of PP results in poor flexibility, 5 rendering it inappropriate for power cable extrusion.
To improve PP’s mechanical flexibility, several modification methods have been applied to tailor the performance of PP. These include nano-doping, chemical grafting, copolymerization, heat treatment, and elastomer blending. Among these methods, elastomer blending stands out in the industry due to its simplicity and practicality in modifying polymer properties. 6 Extensive studies have investigated PP blends with different types of copolymers and elastomers, particularly in the field of dielectrics. 7 Based on antecedent research, the incorporation of elastomers or copolymers in PP has led to significant improvements in mechanical properties. For instance, Ismail et al. 8 concluded that blending PP with elastomers such as polyolefin elastomer (POE) and ethylene propylene diene monomer (EPDM) is an effective and convenient method in altering the mechanical properties of PP. Sharip et al. 9 also reported that the addition of 10 wt% ethylene-octene copolymer (EOC) and 10 wt% of EPDM to PP significantly improved the breaking elongation of the PP blends. Nevertheless, the breakdown strength reduced remarkably with the presence of EOC and EPDM in PP, mainly due to incompatibility between the elastomers and PP. Kamarudin et al. 10 also found that blending EOC with PP generally led to diminished breakdown performances of the PP blends, albeit that the incorporation of copolymers with low ethylene contents and at low weight percentage offered enhanced breakdown performances. Generally, the addition of elastomers such as POE, EOC, and EPDM effectively improved the mechanical properties, but mostly degraded the dielectric properties of PP especially with increasing elastomer contents.
Recently, the incorporation of nanofillers into polymer matrices has emerged as a transformative approach to improving the dielectric properties of polymer-based materials. Polymer nanocomposites containing inorganic fillers have garnered considerable attention due to their unique properties and a wide range of applications in contemporary technology. 11 Recent advancements in nanodielectrics revealed that the addition of nanoparticles can improve the electrical properties of low-density polyethylene (LDPE) and XLPE. Nanoparticles, including magnesia (MgO), silica (SiO2), titania (TiO2), alumina (Al2O3), zinc oxide (ZnO), montmorillonite, and zeolite, have been incorporated into both LDPE and XLPE. 12 Extensive research has shown that incorporating inorganic nanofillers significantly improves the electrical, mechanical, and thermal properties of polymer nanocomposites. 13 This enhancement is attributed to the substantial interfacial area generated between the nanofillers and the polymer matrices, which effectively modifies the inherent properties of the host polymers. 14
Although adding nanofillers to polymers can improve insulation properties, the ability of polymer nanocomposites to increase breakdown strength remains uncertain due to the risk of nanoparticle agglomeration. Notably, the surfaces of nanofillers can be modified to achieve uniform dispersion within polymer matrices. This process can help prevent agglomeration of the nanofillers and increase their compatibility with polymer matrices by addressing the immiscibility between hydrophilic fillers and hydrophobic polymers. 14 Surface modification can be achieved by using chemical treatments such as silane coupling agents. Using a variety of silane coupling agents is expected to create different interfacial effects in nanocomposites, which could result in unique dielectric behaviors, to enhance breakdown performances. Ketsamee et al. 15 studied the influence of surface-modified TiO2 and MgO nanofillers with different polar coupling agents on dielectric properties. They found that ethoxy-modified nanofillers brought significant improvements in breakdown performance. This shows that the dielectric properties of nanocomposites depend not only on the type of nanofillers, but also on the surface structure of nanofillers. Furthermore, Nguyen et al. 16 investigated the influence of silane treated TiO2 using vinyltrimethoxysilane (VTMS) in LDPE polymer and reported that surface-treated TiO2 demonstrated better dispersibility in the LDPE matrix with improved tensile properties as compared to untreated TiO2.
In conjunction with advancements in PP insulation, recent experimental studies on PP nanocomposites have demonstrated that incorporating nanofillers can significantly improve the dielectric properties of these materials. 17 PP nanocomposites have been extensively explored with respect to breakdown strength, which are crucial for various applications, including insulation materials, energy storage, and electronics. For example, Azmi et al. 18 studied the effect of PP nanocomposites containing magnesium aluminate (MgAl2O4) and calcium carbonate (CaCO3). The findings showed a less substantial reduction in direct current (DC) breakdown strength in treated PP/CaCO3 systems over PP/MgAl2O4 systems. The study suggested that the absence of polar surfaces and the associated adsorbed species contributed to the improved breakdown performance. Mirjalili et al. 19 further explored the critical role of nanoparticle dispersion in influencing PP/Al2O3 nanocomposites’ performance. The study demonstrated that incorporating a dispersant facilitated uniform distribution of nanofillers within the PP matrix, thereby enhancing both mechanical and dielectric properties of the nanocomposites. Meanwhile, Cao et al. 20 investigated the effect of surface-treated MgO on PP in terms of thermal, morphological, and dielectric properties. The findings revealed that low amounts of treated MgO (1 wt %) led to good dispersibility, increased crystallinity, improved breakdown strength, and restricted space charge. Ketsamee et al. 14 studied the influence of surface-modified TiO2 and MgO nanofillers with different polar coupling agents on dielectric properties. They found that ethoxy-modified nanofillers brought significant improvements in breakdown performance. Overall, these studies show that the dielectric properties of nanocomposites depend not only on the type of nanofillers, but also on the surface structure of nanofillers.
While numerous studies have investigated the effects of nanofillers on standalone PP, research on PP blends, including the incorporation of various nanofillers in PP/elastomer blends, has mainly focused on the thermo-mechanical properties of PP blend nanocomposites.21–24 For example, Hanim et. al 23 explored the incorporation of nano-precipitated calcium carbonate (NPCC) and POE into PP matrices to determine their effects on thermal and mechanical performances. The results demonstrated that NPCC acted as a nucleating agent, increasing the crystallization temperature of PP by approximately 9°C. The PP blend materials achieved a maximum impact strength at 30 wt% of POE and 15 wt% of NPCC. However, it was challenging to achieve a balanced combination of thermal stability, toughness, and stiffness. Meanwhile, Wahit et al. 24 explored the thermal and mechanical properties of PP/polyamide 6 (PA6) blends modified with POE and organophilic modified montmorillonite (MMT). Notably, the addition of 4 wt% of MMT and 10 wt% of POE resulted in good toughness retention without significant loss of mechanical stiffness and strength of the materials. These studies underscore the significance of elastomer-nanofiller synergy in tailoring the thermos-mechanical properties of PP blend nanocomposites.
From the perspectives of dielectrics, the effects of nanofillers on PP/elastomer blends have received little attention as far as we are aware. Recently, Hu et al. 25 investigated the effect of thermal aging on the space charge profile of PP/POE blend and PP/POE/ZnO blend. The findings indicated that, after thermal aging, there was an increased accumulation of space charge in both PP/POE blend and PP/POE/ZnO blend nanocomposites, with the charge dissipating rapidly in PP/POE/ZnO blend nanocomposites. Zhou et al. 26 studied treated MgO in PP/POE blends and found that adding POE and small amounts of MgO not only improved the tensile strength and flexibility of PP but also optimized the DC breakdown strength and resistivity of PP due to extensive interfacial areas and strong adhesion between the nanoparticles and the polymer matrices. Kamarudin et al. 27 examined the dielectric effects of MgO nanofiller on PP/EOC blends and reported that the addition of MgO compromised the breakdown performance due to the presence of water molecules. According to Sharip et al., 28 nanostructuration of PP blends with 1 wt% surface-treated MgO improved the breakdown strength of the material by up to 14% due to better molecular interaction and minimal defects within the material system. In terms of mechanical properties, the incorporation of a small amount of MgO into PP blends containing 10 wt%, 20 wt% and 30 wt% of EPDM did not lead to significant changes in breaking elongation of the PP blend systems. 28 This indicates that no appreciable changes in mechanical properties of PP blends are observed with low nanofiller loadings. This observation is consistent with reference 29, suggesting that the addition of nanofillers at low concentrations generally does not cause a notable alteration in the mechanical properties of PP.
To date, most research has focused on the impact of nanoparticles within single polymer matrices (e.g., LDPE and PP). While literature on nanostructuration of PP blends is available, most of them focused on the thermo-mechanical properties of PP blend nanocomposites, with little emphasis on the dielectric properties of PP blend nanocomposites. As such, the effects of nanostructuration on PP blend nanocomposites, particularly regarding their dielectric properties, remain underexplored. The current work therefore investigates the effects of silane-treated TiO2 (0.5 wt%, 1 wt%, 3 wt%, and 5 wt%) on the structure and dielectric properties of PP/ethylene-based elastomer (EBE) and PP/propylene-based elastomer (PBE) blend systems. Notably, the proportion of PP blend systems were selected based on our previous experience, 30 where blending 20 wt% of both the elastomers with PP results in optimized electro-mechanical properties. Specifically, the mechanical tensile strengths of PP blended with 20 wt% of EBE and PBE were ∼21 MPa and ∼26 MPa, respectively, while their Young’s modulus values were ∼1172 MPa and ∼96 MPa, respectively. Significantly, the underlying mechanisms driving changes in the dielectric properties of the PP blend nanocomposites are discussed along with morphological, thermal, and chemical analyses. These provide valuable insight for advancing the development of PP blend nanocomposites as next-generation materials for power cable insulation under alternating current (AC) and DC applications.
Experimental works
Materials
The primary polymer used was the PP homopolymer series Pro 6531 M manufactured by Lotte Chemical Titan. Ethylene-butene elastomer (EBE) and propylene-based elastomer (PBE) were used as elastomers. The EBE was of Tafmer DF740 series obtained from Mitsui Chemicals while the PBE was of Vistamaxx 6202 series obtained from ExxonMobil. Nano-titanium dioxide (TiO2) produced Skyspring Nanomaterials was used as a nanofiller. The rutile phase TiO2 nanopowder was surface treated by 3-methacryloxypropyltrimethoxysilane and had average particle size range of 10–30 nm, as reported by the manufacturer.
Sample Preparation
Initially, raw PP, EBE, PBE, and TiO2 materials were subject to a vacuum-drying process at 60°C for 24 h to remove any potential moisture. To produce PP/EBE/TiO2 blend nanocomposites, a melt-mixing procedure was employed to blend PP, EBE, and TiO2. 20 wt% of EBE content was selected for blending with PP as this amount of EBE provided a well-balanced combination of electro-mechanical performance based on our previous study. 30 For nanostructuration, TiO2 was incorporated at varying amounts of 0 wt%, 0.5 wt%, 1 wt%, 3 wt%, and 5 wt% into PP/EBE blend. The blending process was conducted by utilizing a Brabender mixer operating at 180°C with a rotational speed of 50 rpm for 10 min. The resulting mixture was compressed into a thin film with a thickness of approximately 100 µm by utilizing a hydraulic hot press at 180°C under a load of 2.5 ton. To produce PP/PBE/TiO2 blend nanocomposites, a similar sample preparation technique with PP/EBE/TiO2 blend nanocomposites was used to blend PP with 20 wt% of PBE and varying TiO2 loadings of 0 wt%, 0.5 wt%, 1 wt%, 3 wt%, and 5 wt%.
Structural Characterization
The chemical profiles for all the investigated samples were analyzed by using Thermo Scientific Nicolet iS10 Fourier transform infrared (FTIR) spectrometer operated in the attenuated total reflection mode. FTIR measurements were conducted with a wavelength range of 600 cm−1 to 3600 cm−1 over 32 scans. The resolution of the FTIR spectra was set to 4 cm−1.
The melting and crystallization behaviors of all the samples were characterized using a TA Instrument differential scanning calorimeter (DSC) 25. Approximately 5 mg of sample was sealed with an aluminum pan and heated under a nitrogen atmosphere from 30°C to 200°C at 10°C min−1 heating rate to eliminate the thermal history of the sample. Subsequently, the sample was cooled from 200°C to 30°C at 10°C min−1 cooling rate to assess its crystallization behavior. Finally, the melting behavior was obtained by increasing the temperature from 30°C to 200°C at 10°C min−1 heating rate. The crystallinity, X
c
of the sample was determined based on equation (1).
31
The dispersion state of TiO2 was determined using Hitachi model TM-3000 tabletop scanning electron microscope (SEM). Before SEM analysis, each sample was fractured under liquid nitrogen. Subsequently, the sample was coated with platinum under a vacuum environment using Emitech 21 K550X to enhance resolution during SEM. A 15 kV accelerating voltage and a 30 mm working distance were used for obtaining each SEM micrograph.
Dielectric Measurements
To assess the dielectric response of the as-prepared samples without additional surface treatment, dielectric spectroscopy measurements were carried out utilizing the Gamry Instruments Interface 1000TM equipped with a Tettex’s 2914 Test Cell for Solid Insulants (featuring a 25 mm radius inner guarded electrode). The test cell consisted of a three-terminal electrode setup, having a measuring electrode, a guard electrode, and a ground electrode. This enables accurate dielectric response measurements by isolating bulk current from surface leakage using a guard electrode surrounding the measuring electrode, as outlined in the Standard Test Methods for AC Loss Characteristics and Permittivity (Dielectric Constant) of Solid Electrical Insulation, American Society for Testing and Materials (ASTM) D150. 32 A 1 Vrms AC signal was set with a frequency span extending from 100 Hz to 100 kHz, with data points taken at a rate of 20 points per decade.
Electrical breakdown tests were conducted with a Baur PGK 110 HB test set. AC and DC tests were carried out by referring to the guidelines of the Standard Test Method for Dielectric Breakdown Voltage and Dielectric Strength of Solid Electrical Insulating Materials at Commercial Power Frequencies and Standard Test Method for Dielectric Breakdown Voltage, ASTM D149
33
and Dielectric Strength of Solid Electrical Insulating Materials Under Direct-Voltage Stress, D3755 standards, respectively. Each sample was placed between two steel ball electrodes with a diameter of 6.4 mm, and the test cell was filled with silicone oil to avoid surface flashover. For each AC breakdown test, a step-by-step voltage method was applied, where 1 kVrms was injected at every 20 s until breakdown. For each DC breakdown test, a 2 kV step-by-step voltage was injected at every 20 s until breakdown. To ensure data reproducibility, 15 breakdown points were tested for each of the investigated materials. The breakdown strength was calculated by employing equation (2).

The breakdown data were analysed by using the two-parameter Weibull statistical analysis shown in equation (3).
Results and discussion
Chemical Profile
Figure 1 shows the FTIR spectra of TiO2. The broad peak around 600 cm−1 shown in Figure 1 is associated with the stretching vibration of the Ti-O-Ti bond in TiO2 lattice.
4
Meanwhile, a strong peak at 1100 cm−1 corresponds to the stretching of the Si–O–C bond belonging to the trimethoxy silane group
34
in 3-methacryloxypropyltrimethoxysilane (MCPTS), a silane coupling agent employed by the manufacturer to modify the surface of TiO2. A meagre amount of hydroxyl or water-related molecules on the surface of TiO2 was detected around 3400 cm−1 and 1600 cm−1, suggesting that majority of the surface hydroxyl groups were replaced by the propyl groups upon silane treatment.
35
Similar observations were reported elsewhere.
36
FTIR spectra of TiO2.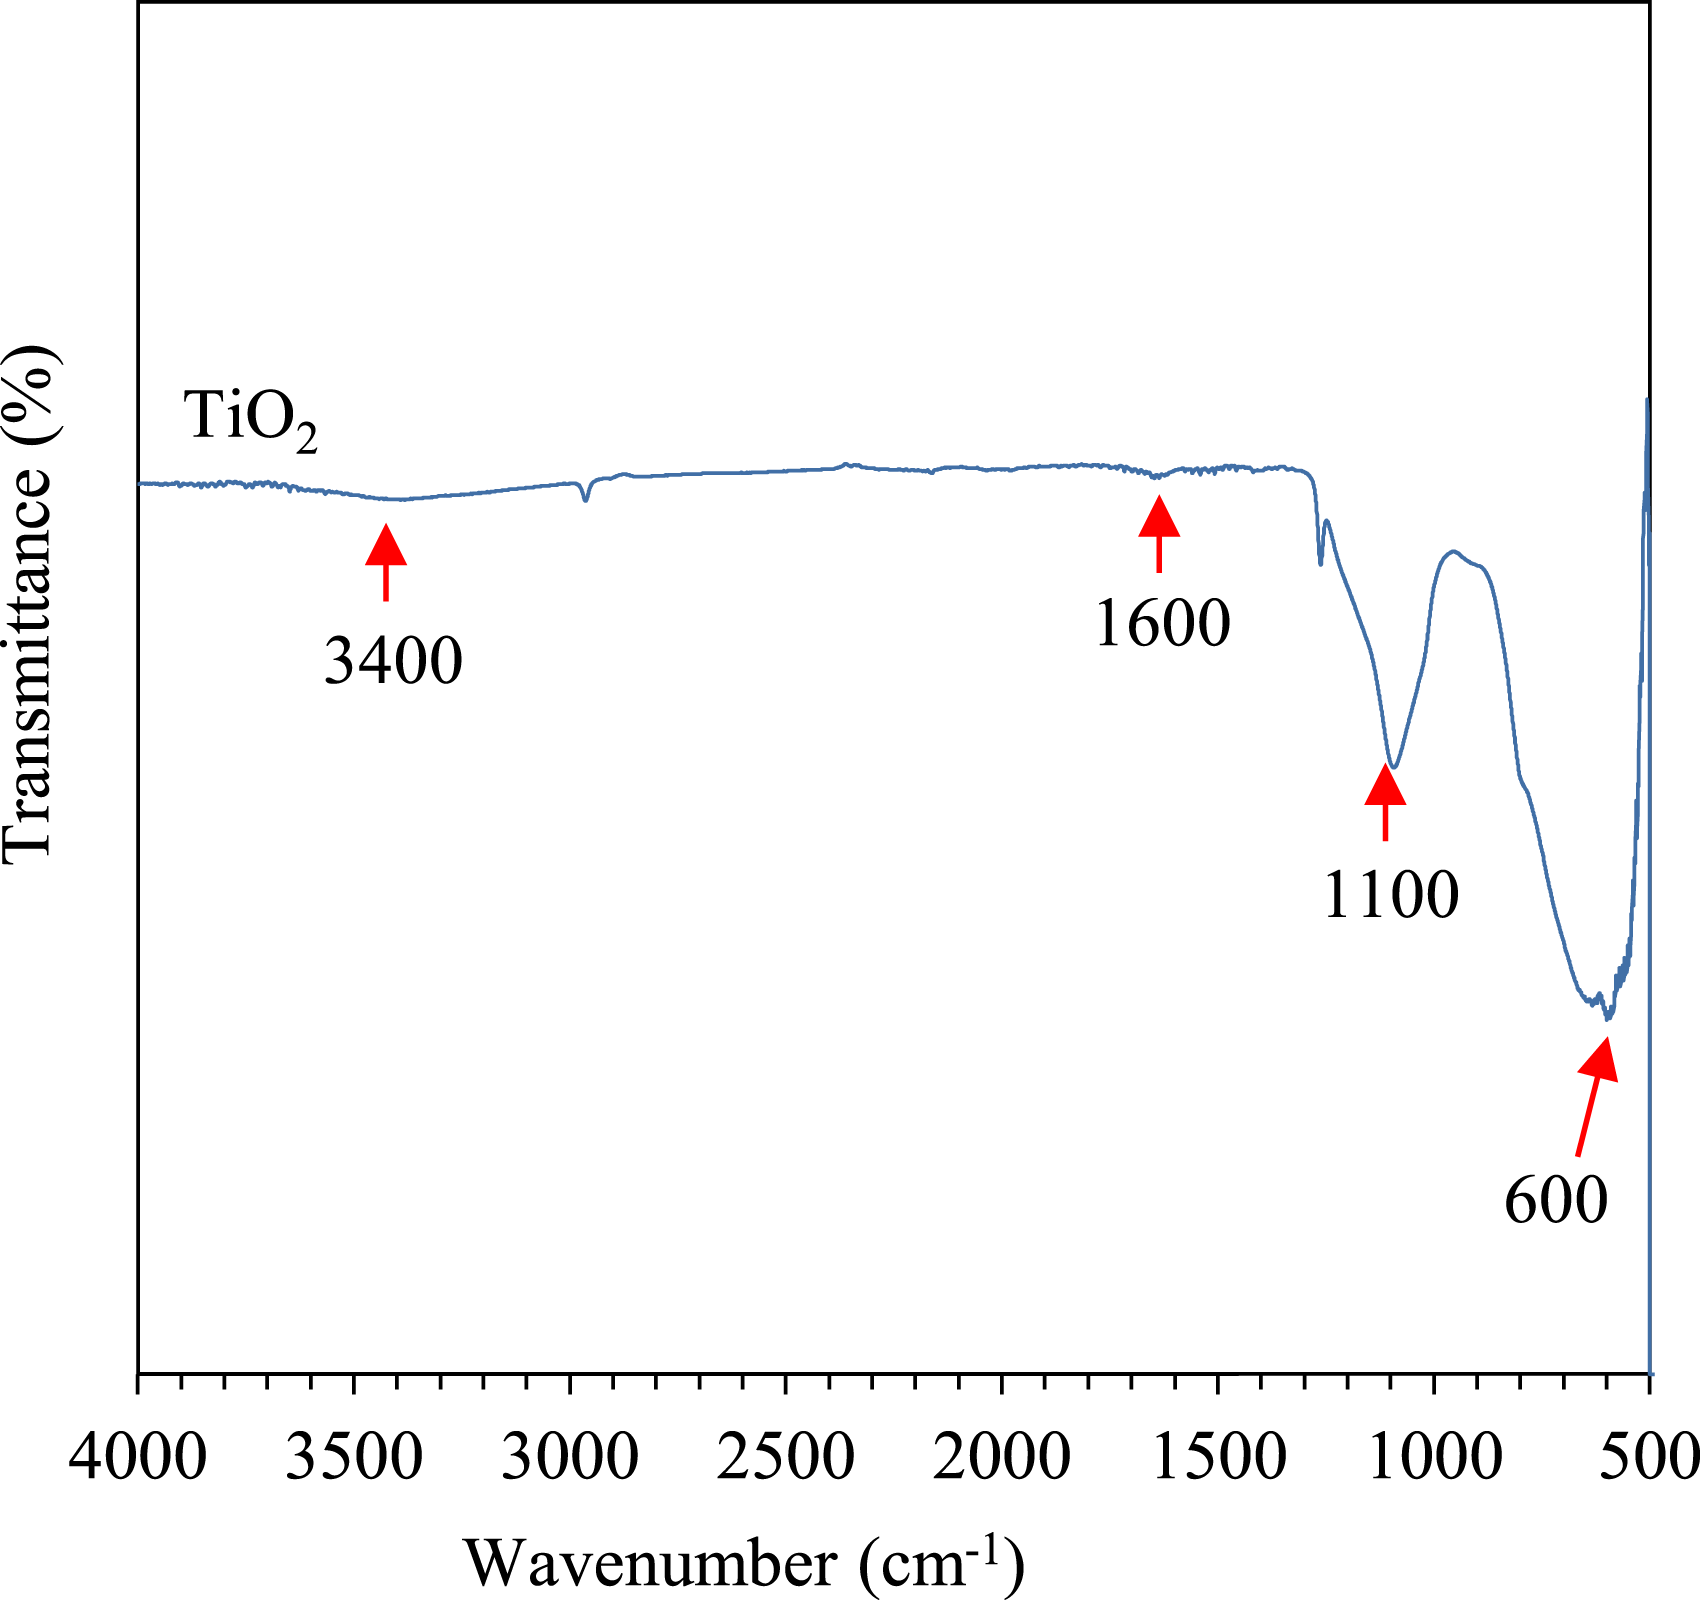
Figure 2(a) and (b) demonstrate the FTIR spectra of PP/EBE/TiO2 and PP/PBE/TiO2 blend nanocomposites, respectively. In PP/EBE/TiO2 blend nanocomposites (refer Figure 2(a)), the addition of TiO2 at 0.5 wt% loading level into PP/EBE blend exhibited an apparent broad band around 600 cm−1, which was attributed to the stretching vibration of Ti-O-Ti bond.
4
The absorption band becomes more pronounced as the concentration of TiO2 increases to 1 wt%, 3 wt%, and 5 wt% loadings levels. In addition, the absorption peak at 1100 cm−1 is associated with trimethoxy silane becoming more prevalent with as increase in TiO2 content. Likewise, the incorporation of TiO2 in PP/PBE system (refer to Figure 2(b)) exhibited a noticeable broad band between 500 cm−1 to 600 cm−1 alongside with a peak at 1100 cm−1. These results indicate that the TiO2 nanoparticles have been successfully integrated into the PP/EBE and PP/PBE blends, respectively, consistent with findings from a prior study.
37
FTIR spectra of (a) PP/EBE/TiO2, (b) PP/PBE/TiO2 blend nanocomposites.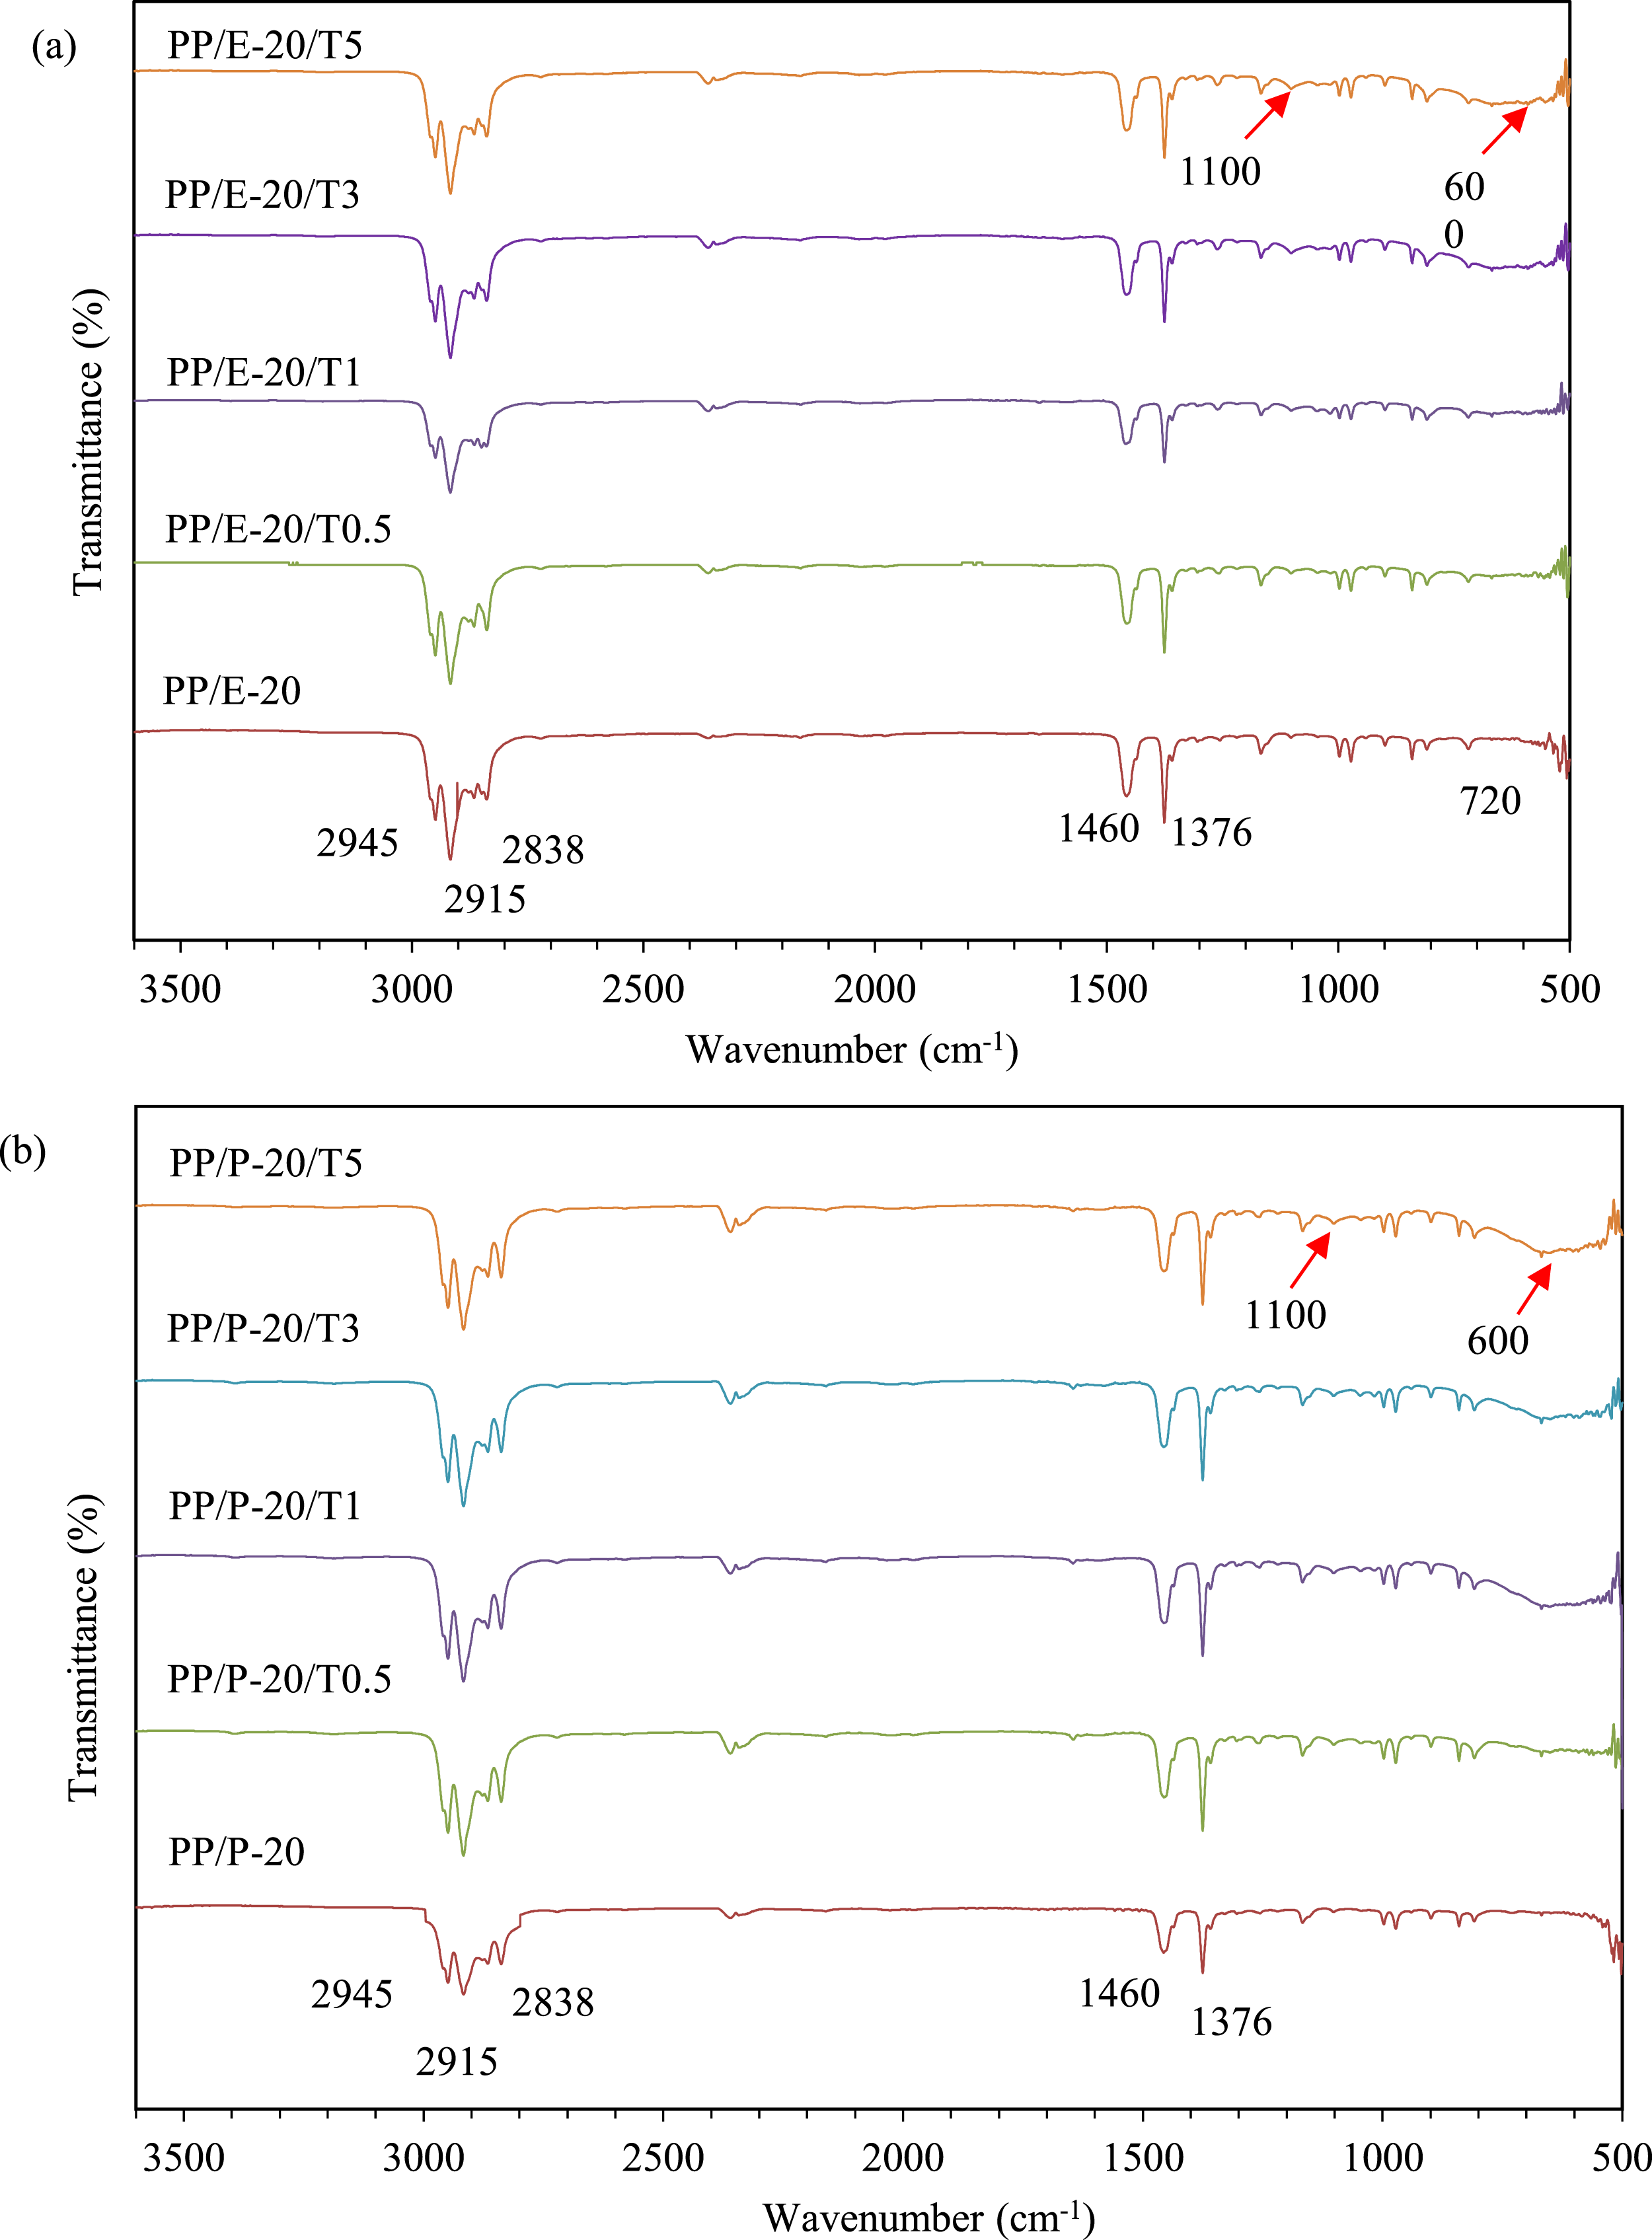
Thermal Profile
Figure 3 shows the DSC melting behaviors comparing PP/EBE/TiO2 and PP/PBE/TiO2 blend nanocomposites. The melting temperature T
m
for PP/EBE without the addition of TiO2 is 161°C, aligning with the fusion peak characteristic of the α-crystal structure of PP.18,38 Notably, the inclusion of TiO2 causes a slight shift of the melting peak to higher temperatures, especially with increasing amounts of nanofiller. For example, at 5 wt% TiO2 loading level, the melting peak slightly increased to 162°C. Of note, the presence of a secondary melting peak at 148°C with the addition of TiO2 reflects the β-crystal properties.18,38 The secondary melting peak becomes more pronounced in PP blend nanocomposites with escalating quantities of TiO2. Similarly, the inclusion of TiO2 in PP/PBE blends affects the melting behavior of final blends, where the presence of TiO2 nanoparticles slightly increases the value of T
m
. For the PBE system, the secondary melting peak at 148°C is, again, noticeable with the inclusion of 1 wt%, 3 wt%, and 5 wt% of TiO2. Melting traces of PP/EBE/TiO2 and PP/PBE/TiO2 blends nanocomposites.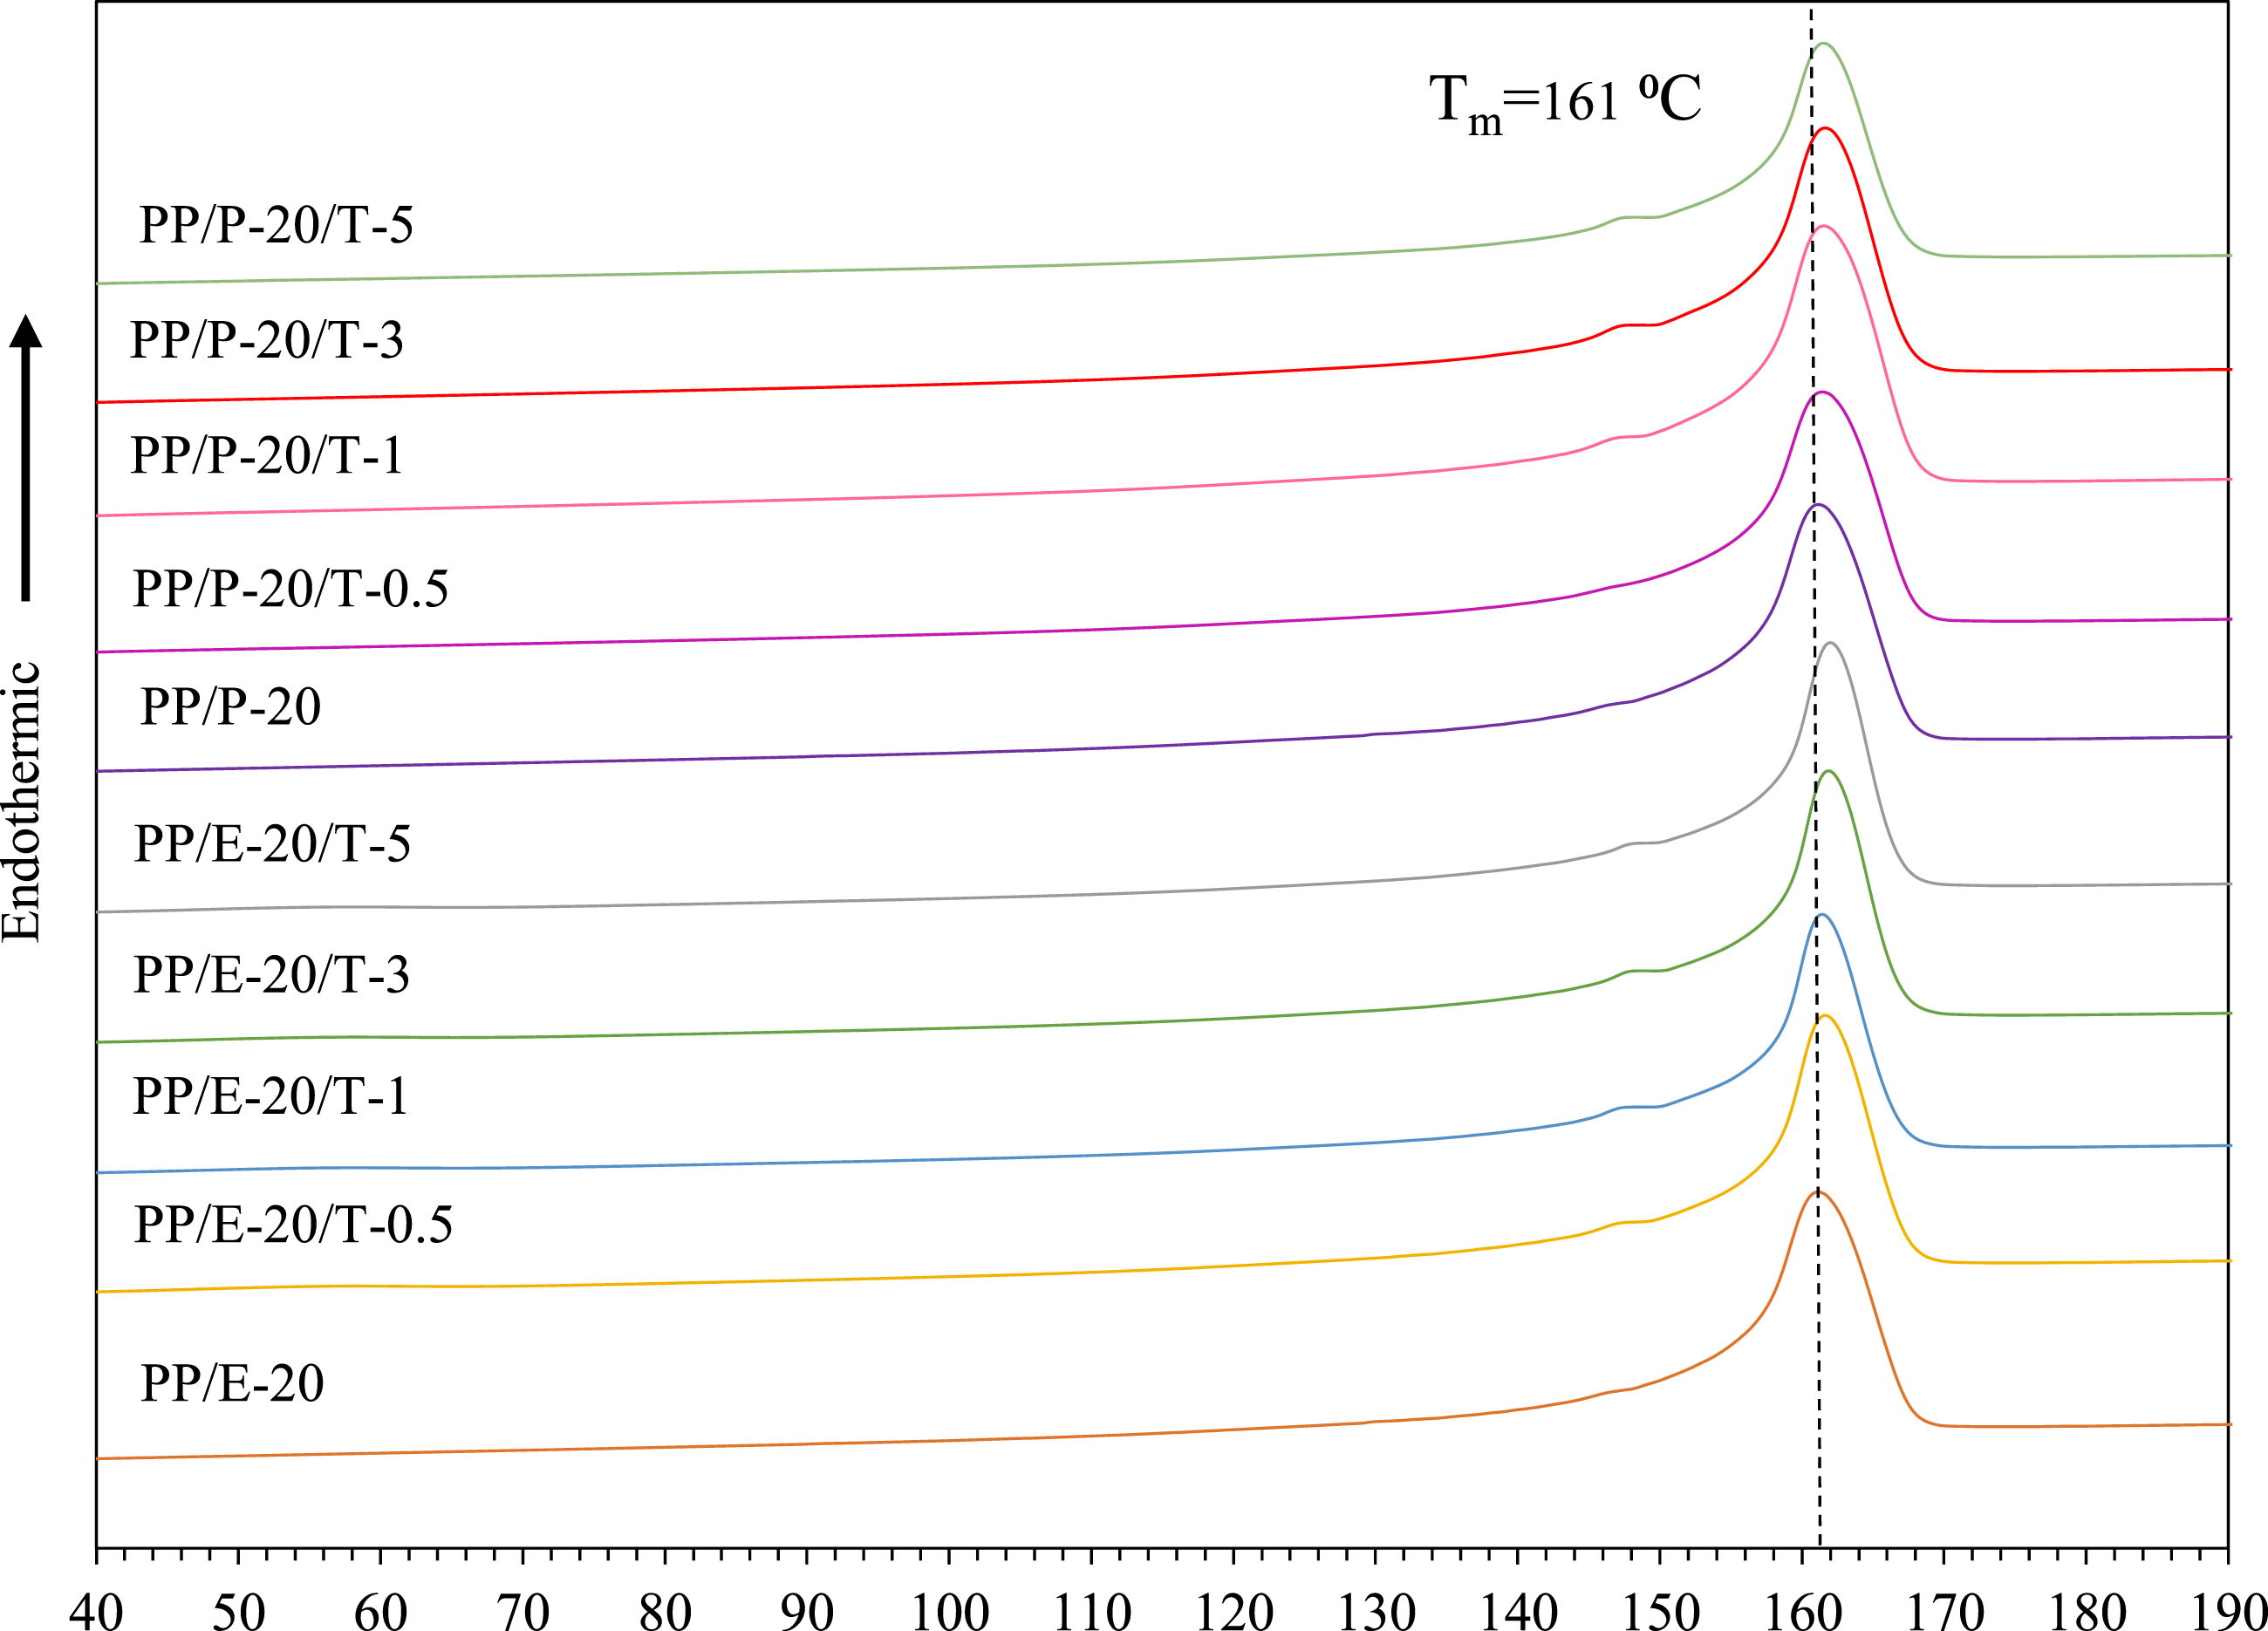
Figure 4 shows the DSC cooling behaviors of all investigated samples. The cooling peak for PP/EBE blend without the inclusion of TiO2 is 118°C. It can be observed that the cooling peak of PP/EBE/TiO2 blend nanocomposites gradually shifts to higher temperatures with increasing amounts of TiO2. For instance, the cooling peak becomes nearly 120°C at 5 wt% of TiO2 loading. Likewise, the addition of increasing amounts of TiO2 in PP/PBE blend gradually shifts the cooling temperature to nearly 120°C. These observations suggest that TiO2 functions as a nucleating agent, altering the overall structure of PP/EBE and PP/PBE blends. Cooling traces of PP/EBE/TiO2 and PP/PBE/TiO2 blends nanocomposites.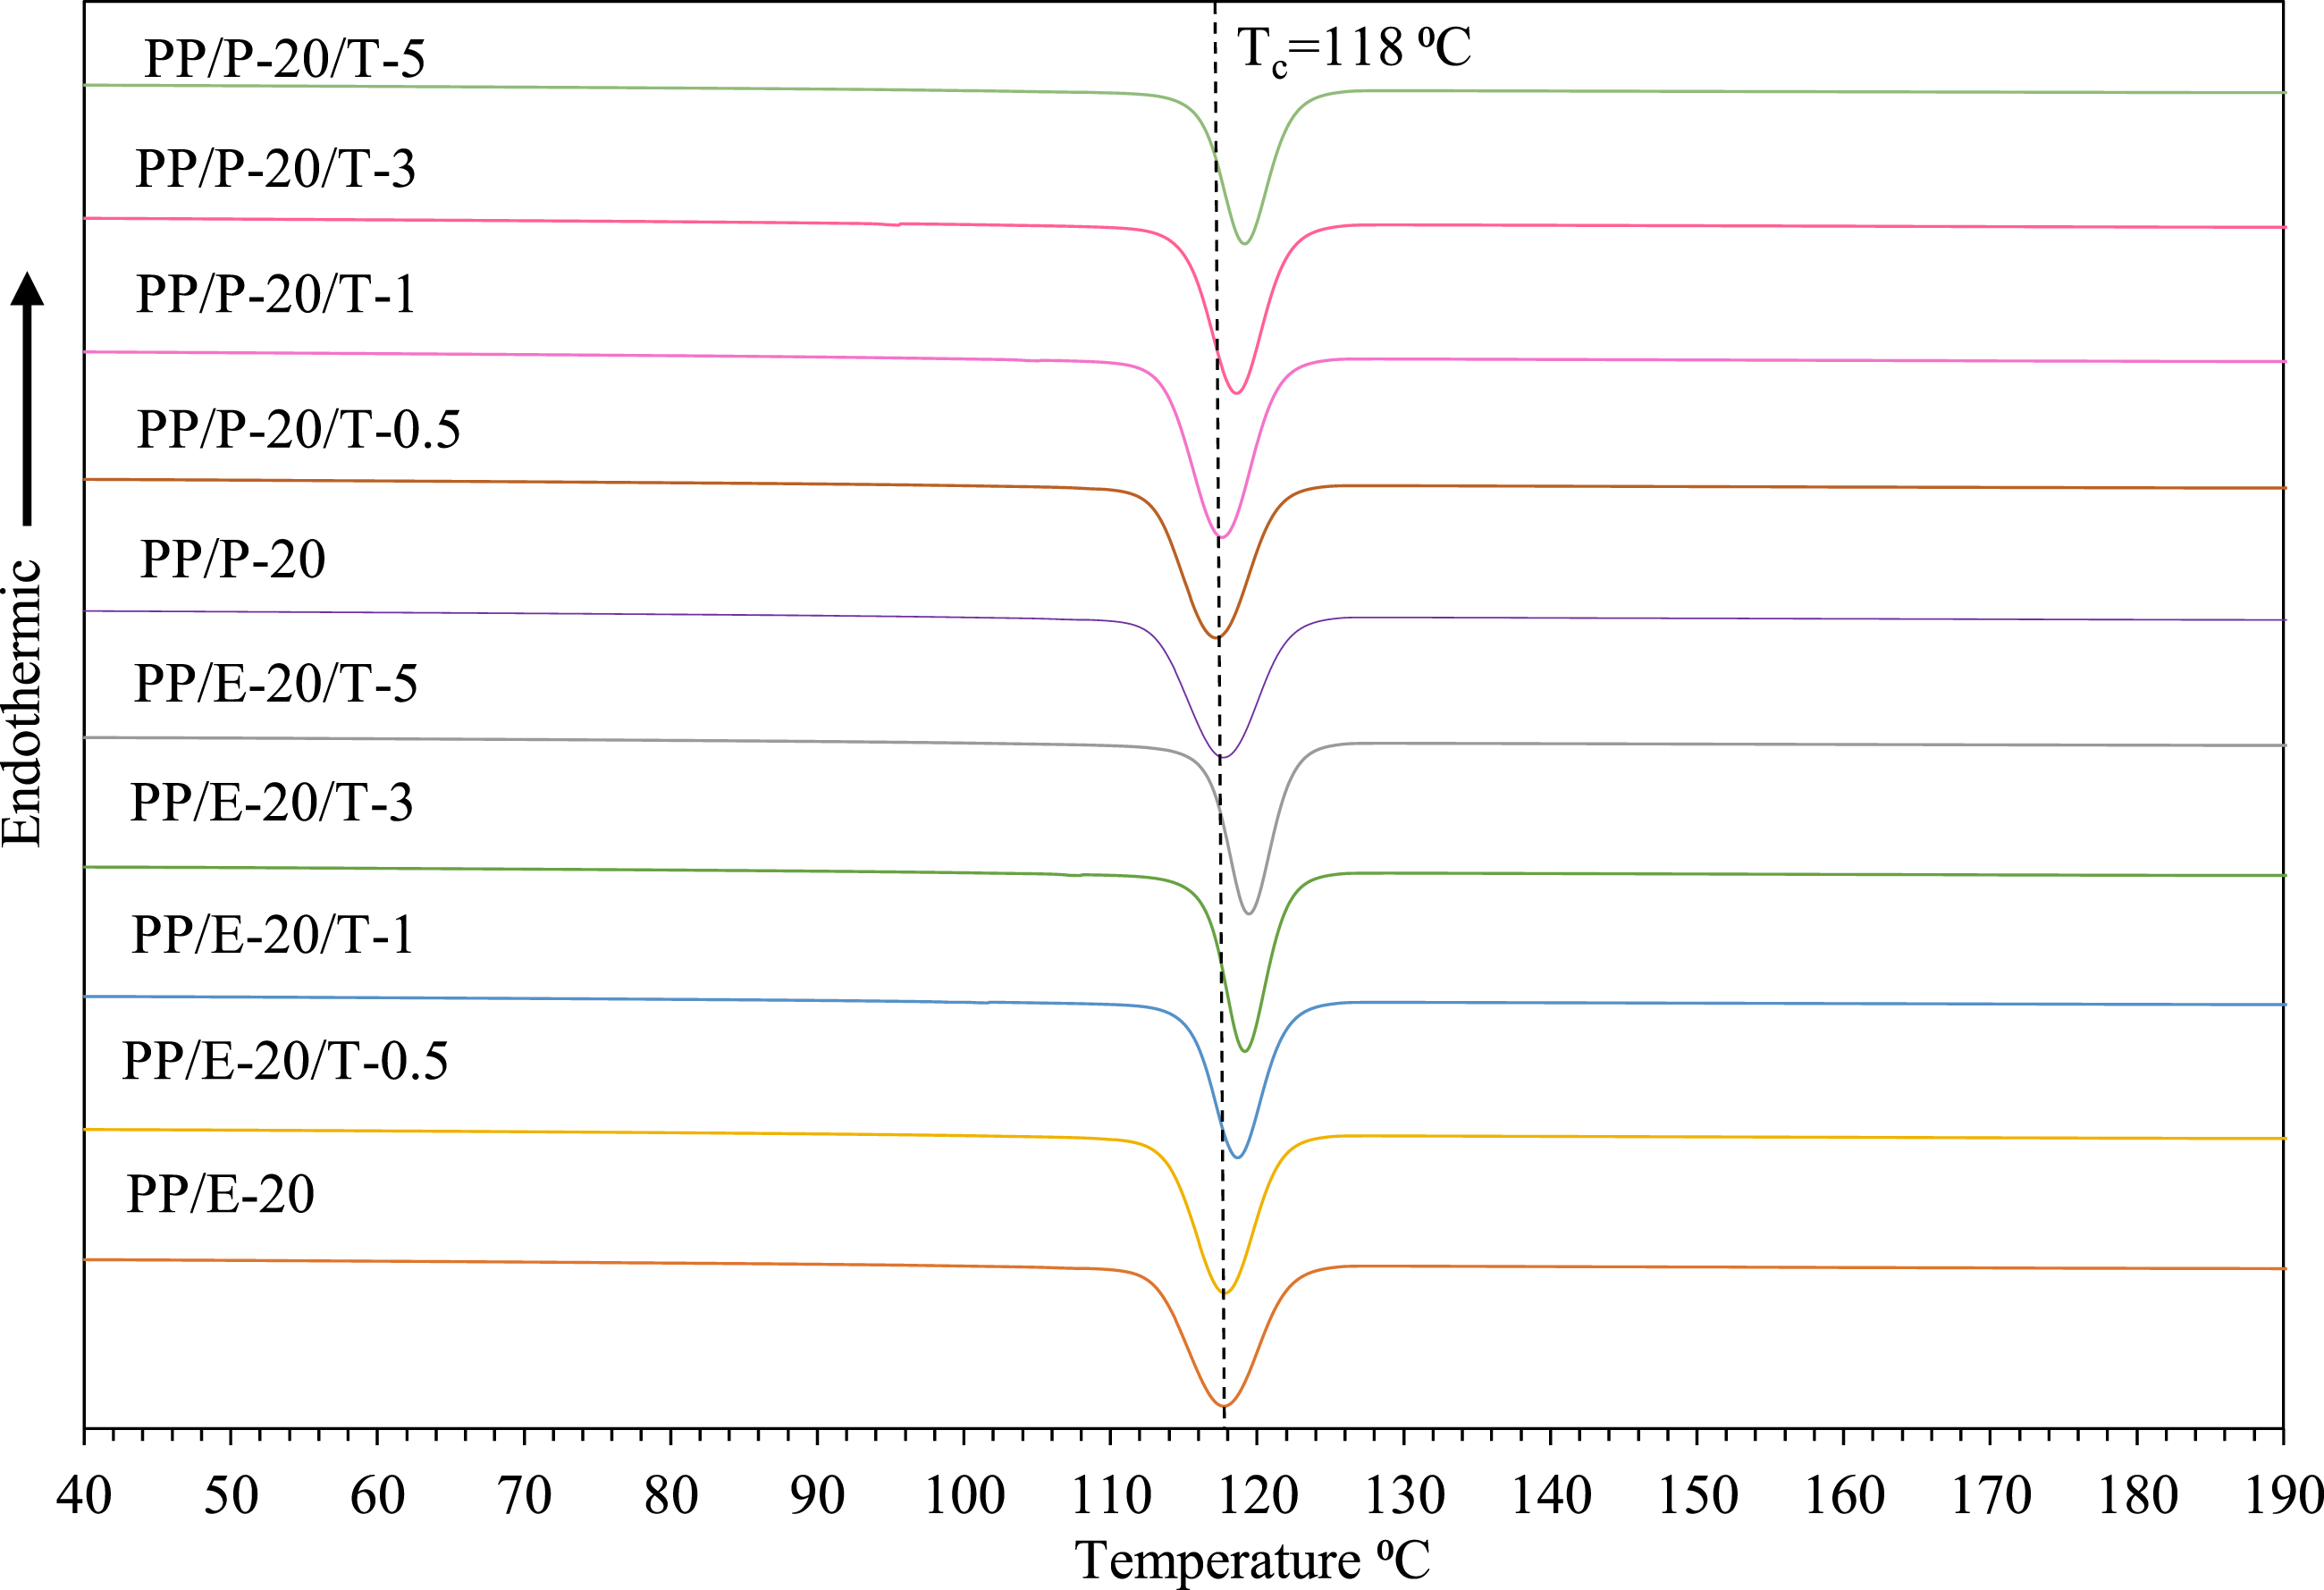
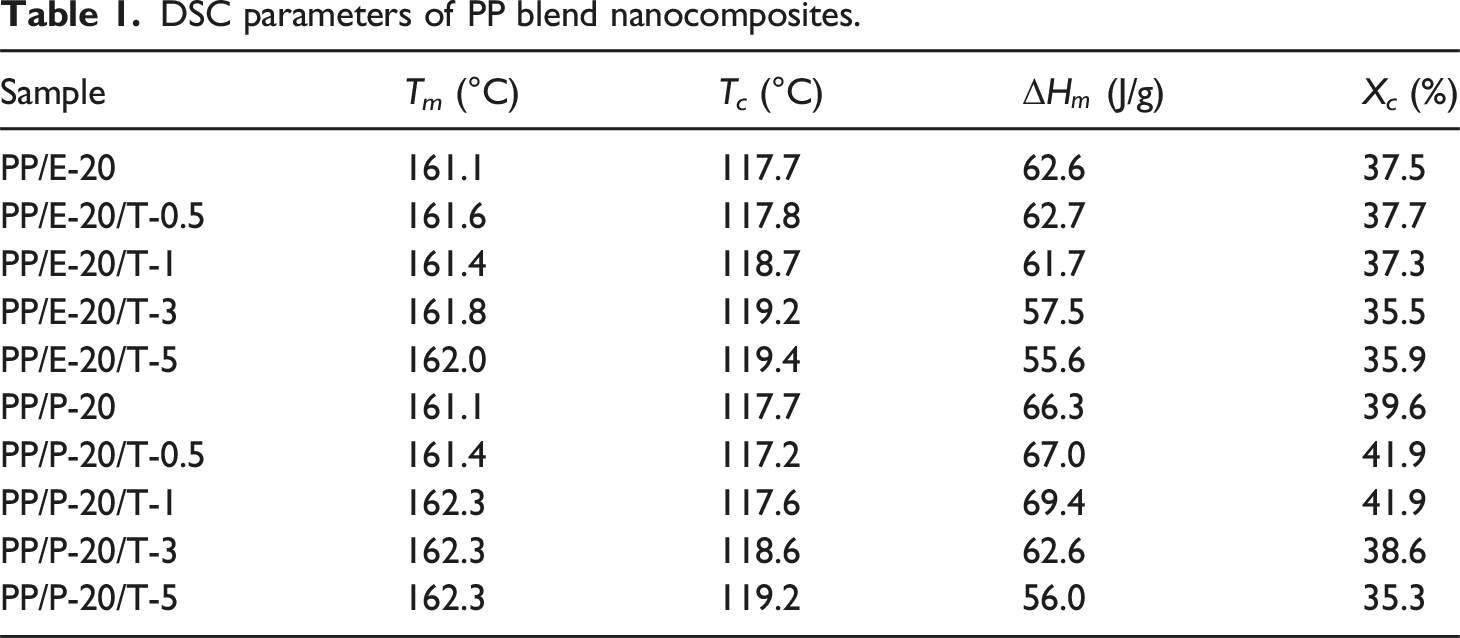
Figure 5 demonstrates the DSC crystallinity of PP/EBE/TiO2 and PP/PBE/ TiO2 blend nanocomposites. For PP/EBE blend nanocomposites, the crystallinity of the unfilled PP/EBE blend is 37.5%. It is worth noting that the addition of TiO2 in the PP/EBE system does not remarkably disrupt the crystallinity of PP/EBE blends, except for a slight reduction of crystallinity at 3 wt% and 5 wt% of TiO2 loading levels. While the addition of TiO2 up to 1 wt% does not significantly affect the crystallinity level for PP/PBE system, the addition of 3 wt% and 5 wt% of TiO2 to PP/PBE blend significantly reduces the crystallinity to 38.6% and 35.3%, respectively. These findings suggest that the addition of increasing amounts of TiO2 reduces crystallinity as the interaction between TiO2 and PP molecules impedes the crystallization process. The fact that PP/PBE/TiO2 blend nanocomposites have higher crystallinity values compared to PP/EBE/TiO2 blend nanocomposites at 3 wt% and 5 wt% of TiO2 loading levels suggests that high amounts of TiO2 in PP/PBE blend results in greater molecular chain disruptions over PP/EBE blend. The DSC parameters of PP blend nanocomposites are summarized in Table 1. The crystallinity of PP/EBE/TiO2 and PP/PBE/TiO2 blends nanocomposites. DSC parameters of PP blend nanocomposites.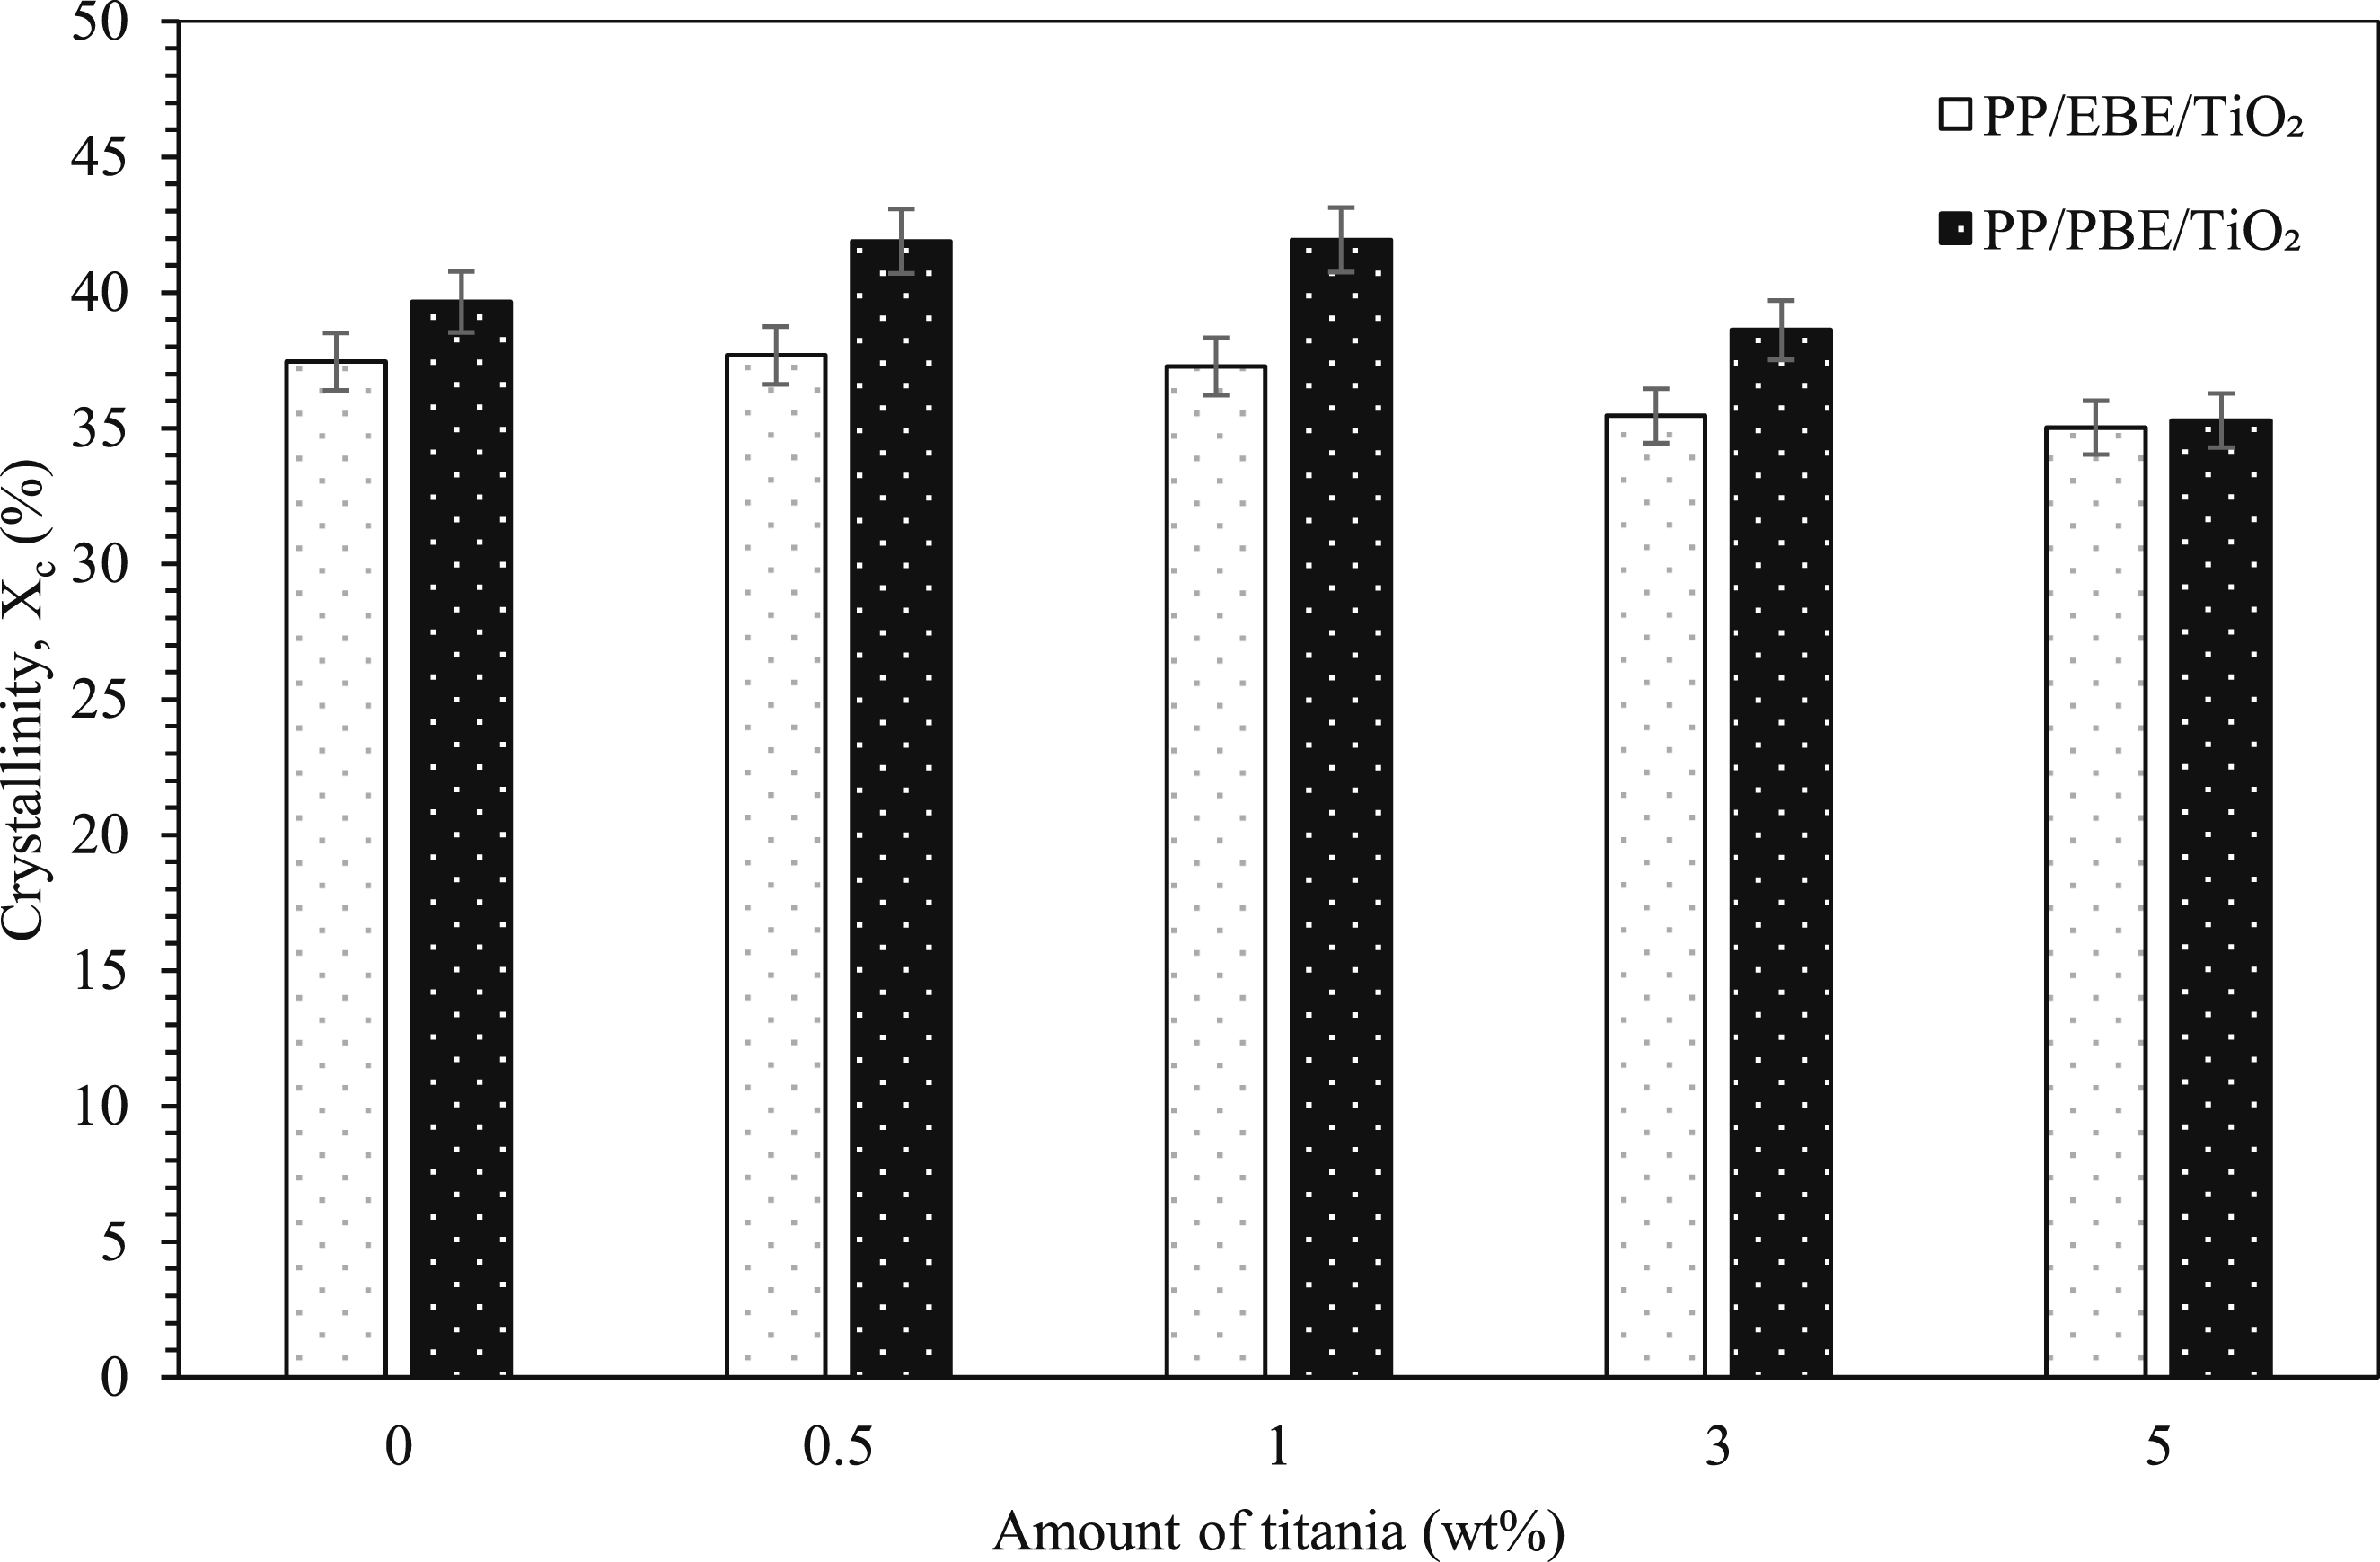
Morphology
Figure 6 demonstrates the cross-sectional morphology of PP/EBE/TiO2 (Figure 6(a)–(e)) and PP/PBE/TiO2 (Figure 6(f)–(j)) blend nanocomposites. For PP/EBE system without the addition of TiO2 (Figure 6(a)), the SEM micrograph shows several “orb-shape” structures (dotted circled) that are uniformly dispersed in PP, indicating the distribution of the EBE elastomer. The addition of TiO2 at 0.5 wt% to PP/EBE blend (Figure 6(b)) appears to disperse uniformly (arrowed) in PP/EBE system with slight aggregates (circled). This suggests that TiO2 disperses well in polymer-based composites due to the absence of surface hydroxyl groups, which reduce its tendency to agglomerate.
39
Nevertheless, the increase in TiO2 concentration results in more prevalent agglomerations (circled in Figure 6(c)–(e)). Specifically, at 3 wt% and 5 wt% of TiO2 loading levels, the number of large agglomerations becomes more pronounced. This reflects the poor dispersion of TiO2 at high nanofiller concentrations. Cross-section morphology of PP/EBE/TiO2 blend nanocomposites at TiO2 concentration of (a) 0 wt%, (b) 0.5 wt%, (c) 1 wt%, (d) 3 wt%, (e) 5 wt% and PP/PBE/TiO2 blend nanocomposites at TiO2 concentration of (f) 0 wt%, (g) 0.5 wt%, (h) 1 wt%, (i) 3 wt%, (j) 5 wt%.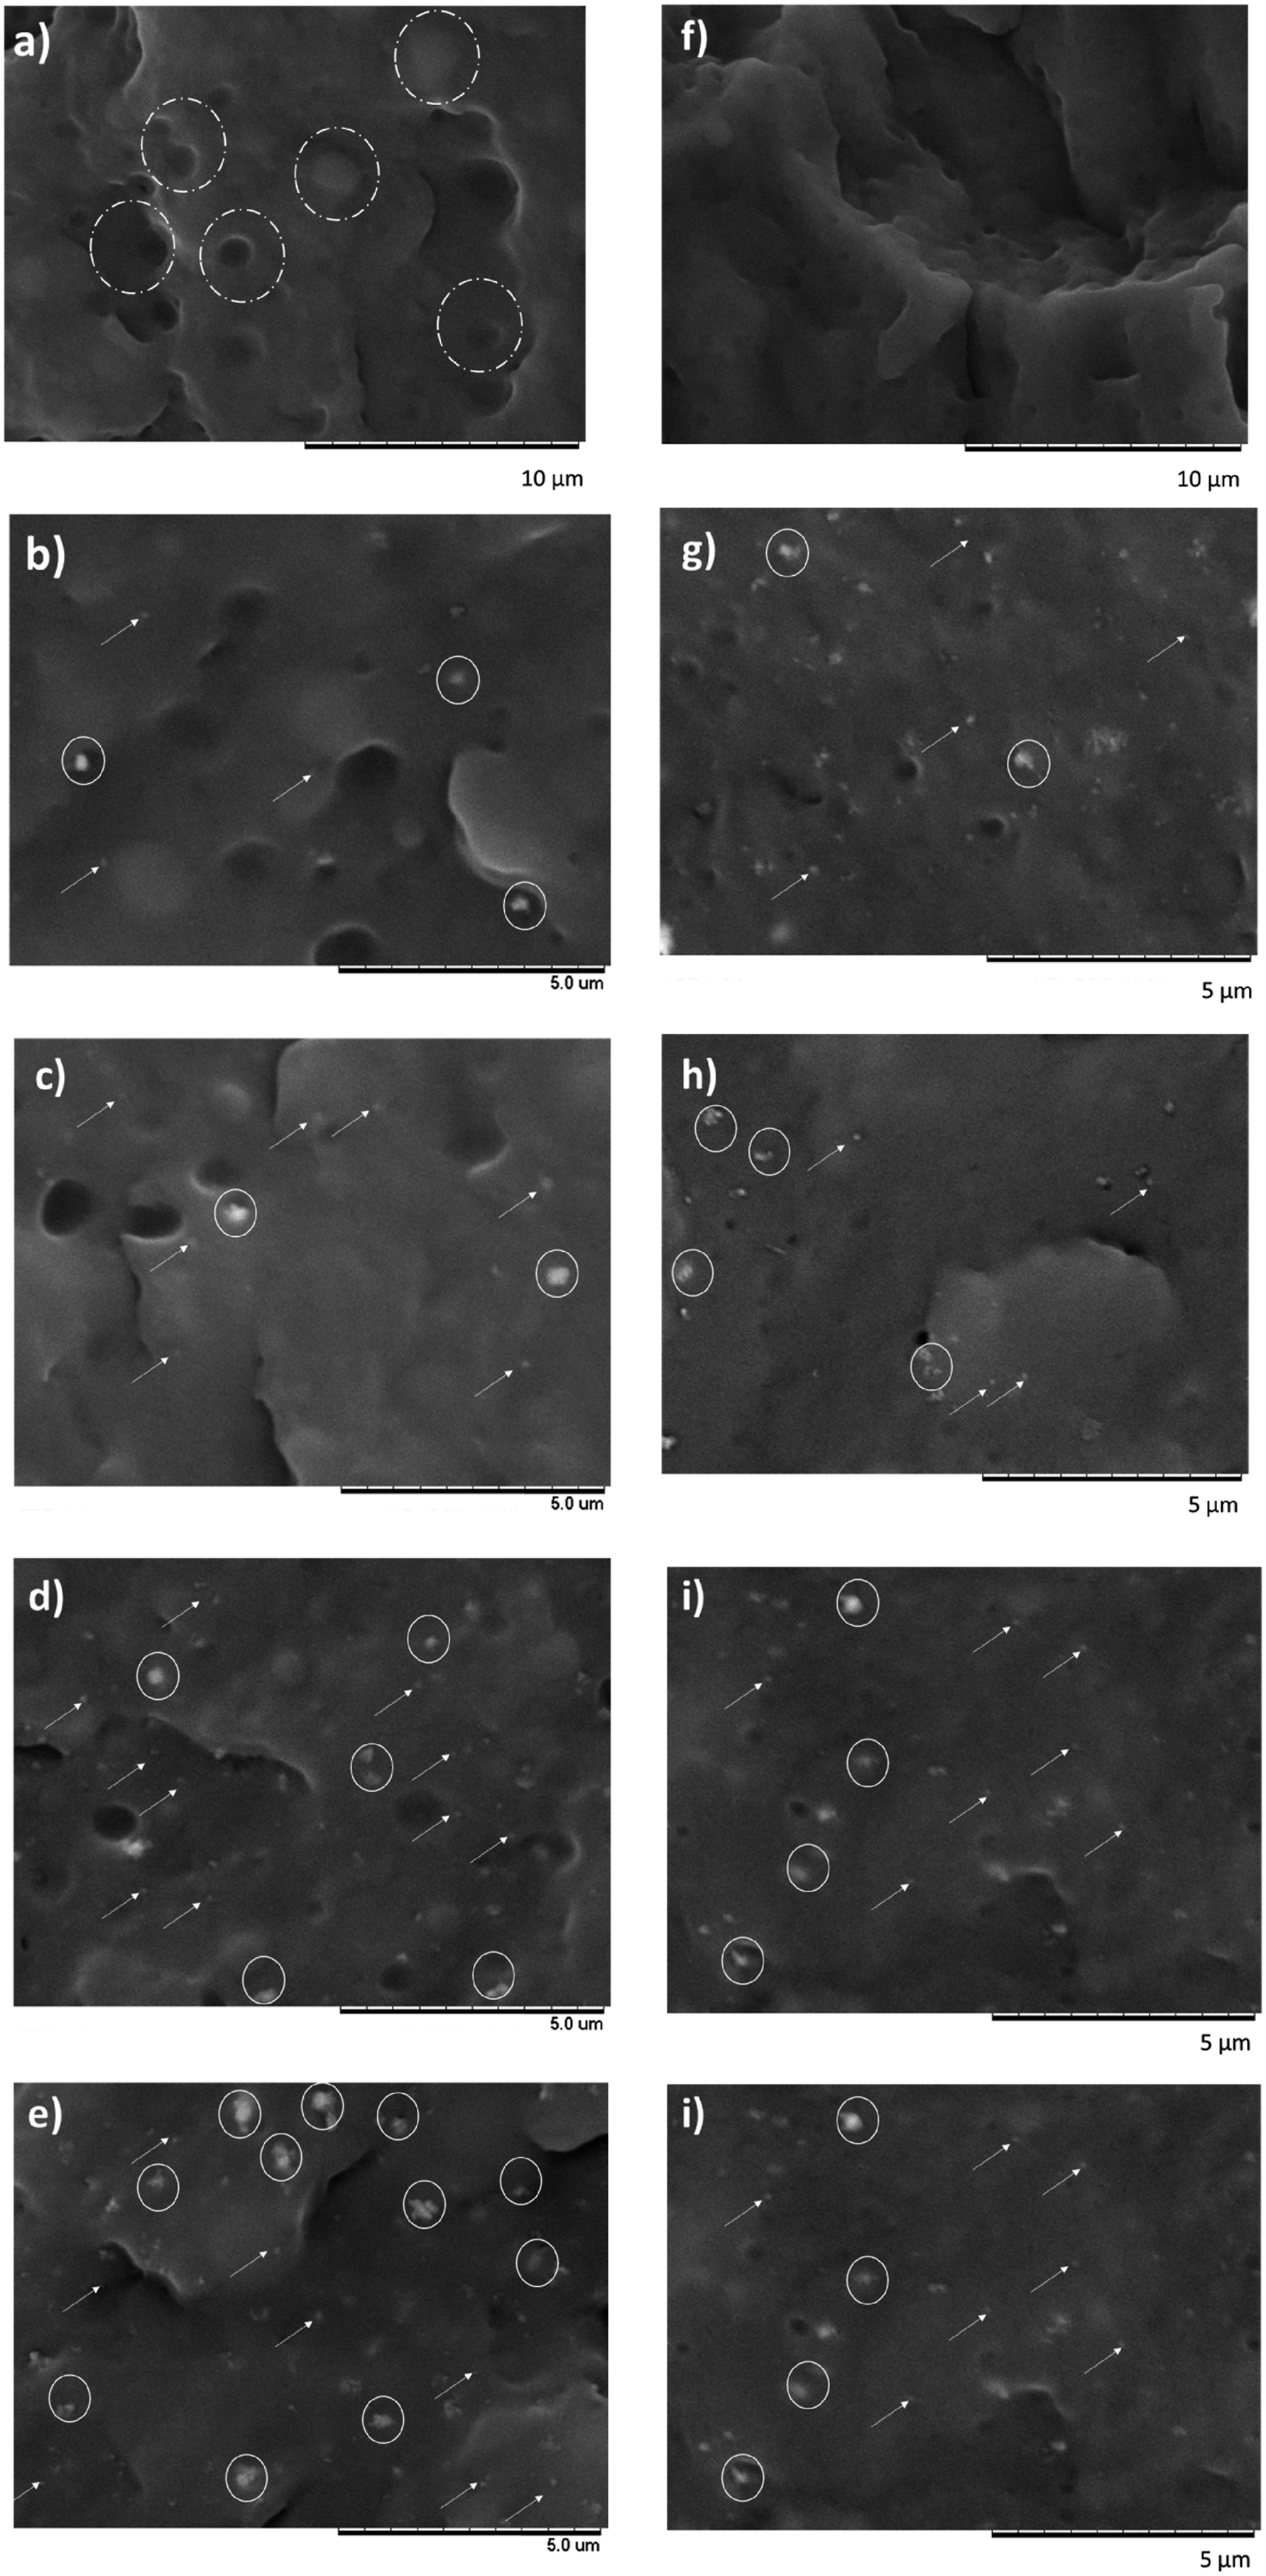
For PP/PBE system without the addition of TiO2 (Figure 6(f)), the “orb-shape” structures representing the PBE elastomer are less apparent, indicating better compatibility of the PP with the PBE elastomer over the EBE elastomer, as discussed elsewhere. 30 The inclusion of 0.5 wt% of TiO2 in PP/PBE system shows good dispersion (arrowed) with few agglomerations (circled), as illustrated in Figure 6(g). However, incorporating 5 wt% of TiO2 results in a notable increase in the number and size of micrometer-sized clusters, as circled in Figure 6(i). This is likely due to TiO2 nanoparticles possessing a very high surface area-to-particle size ratio, which promotes the formation of aggregates at high TiO2 concentrations, resulting in poor dispersion within the matrix. 17
Dielectric Response
Figure 7 shows the real permittivity, ε′, taken at a frequency of 1 kHz, for PP/EBE and PP/PBE blends, without and with the inclusion of TiO2. This frequency value is chosen for analysis purposes since the permittivity values are similar across the 100 Hz to 100 kHz frequency range.
37
At 0 wt% of TiO2, the ε′ of PP/EBE blend is approximately 2.81. A notable increase of ε′ is experienced when higher concentrations of TiO2 incorporated to PP/EBE blend. For instance, the inclusion of 0.5 wt% of TiO2 significantly increases ε′ by 4% to approximately 2.92. At 1 wt% and 3 wt% TiO2 loading levels, ε′ increase by 5% to ∼2.95 and 6% to ∼2.97, respectively. A remarkable increase of ε′ by 10% (3.08) at 5 wt% of TiO2 loading level. Real relative permittivity of PP/EBE/TiO2 and PP/PBE/TiO2 blend nanocomposites at 1 kHz.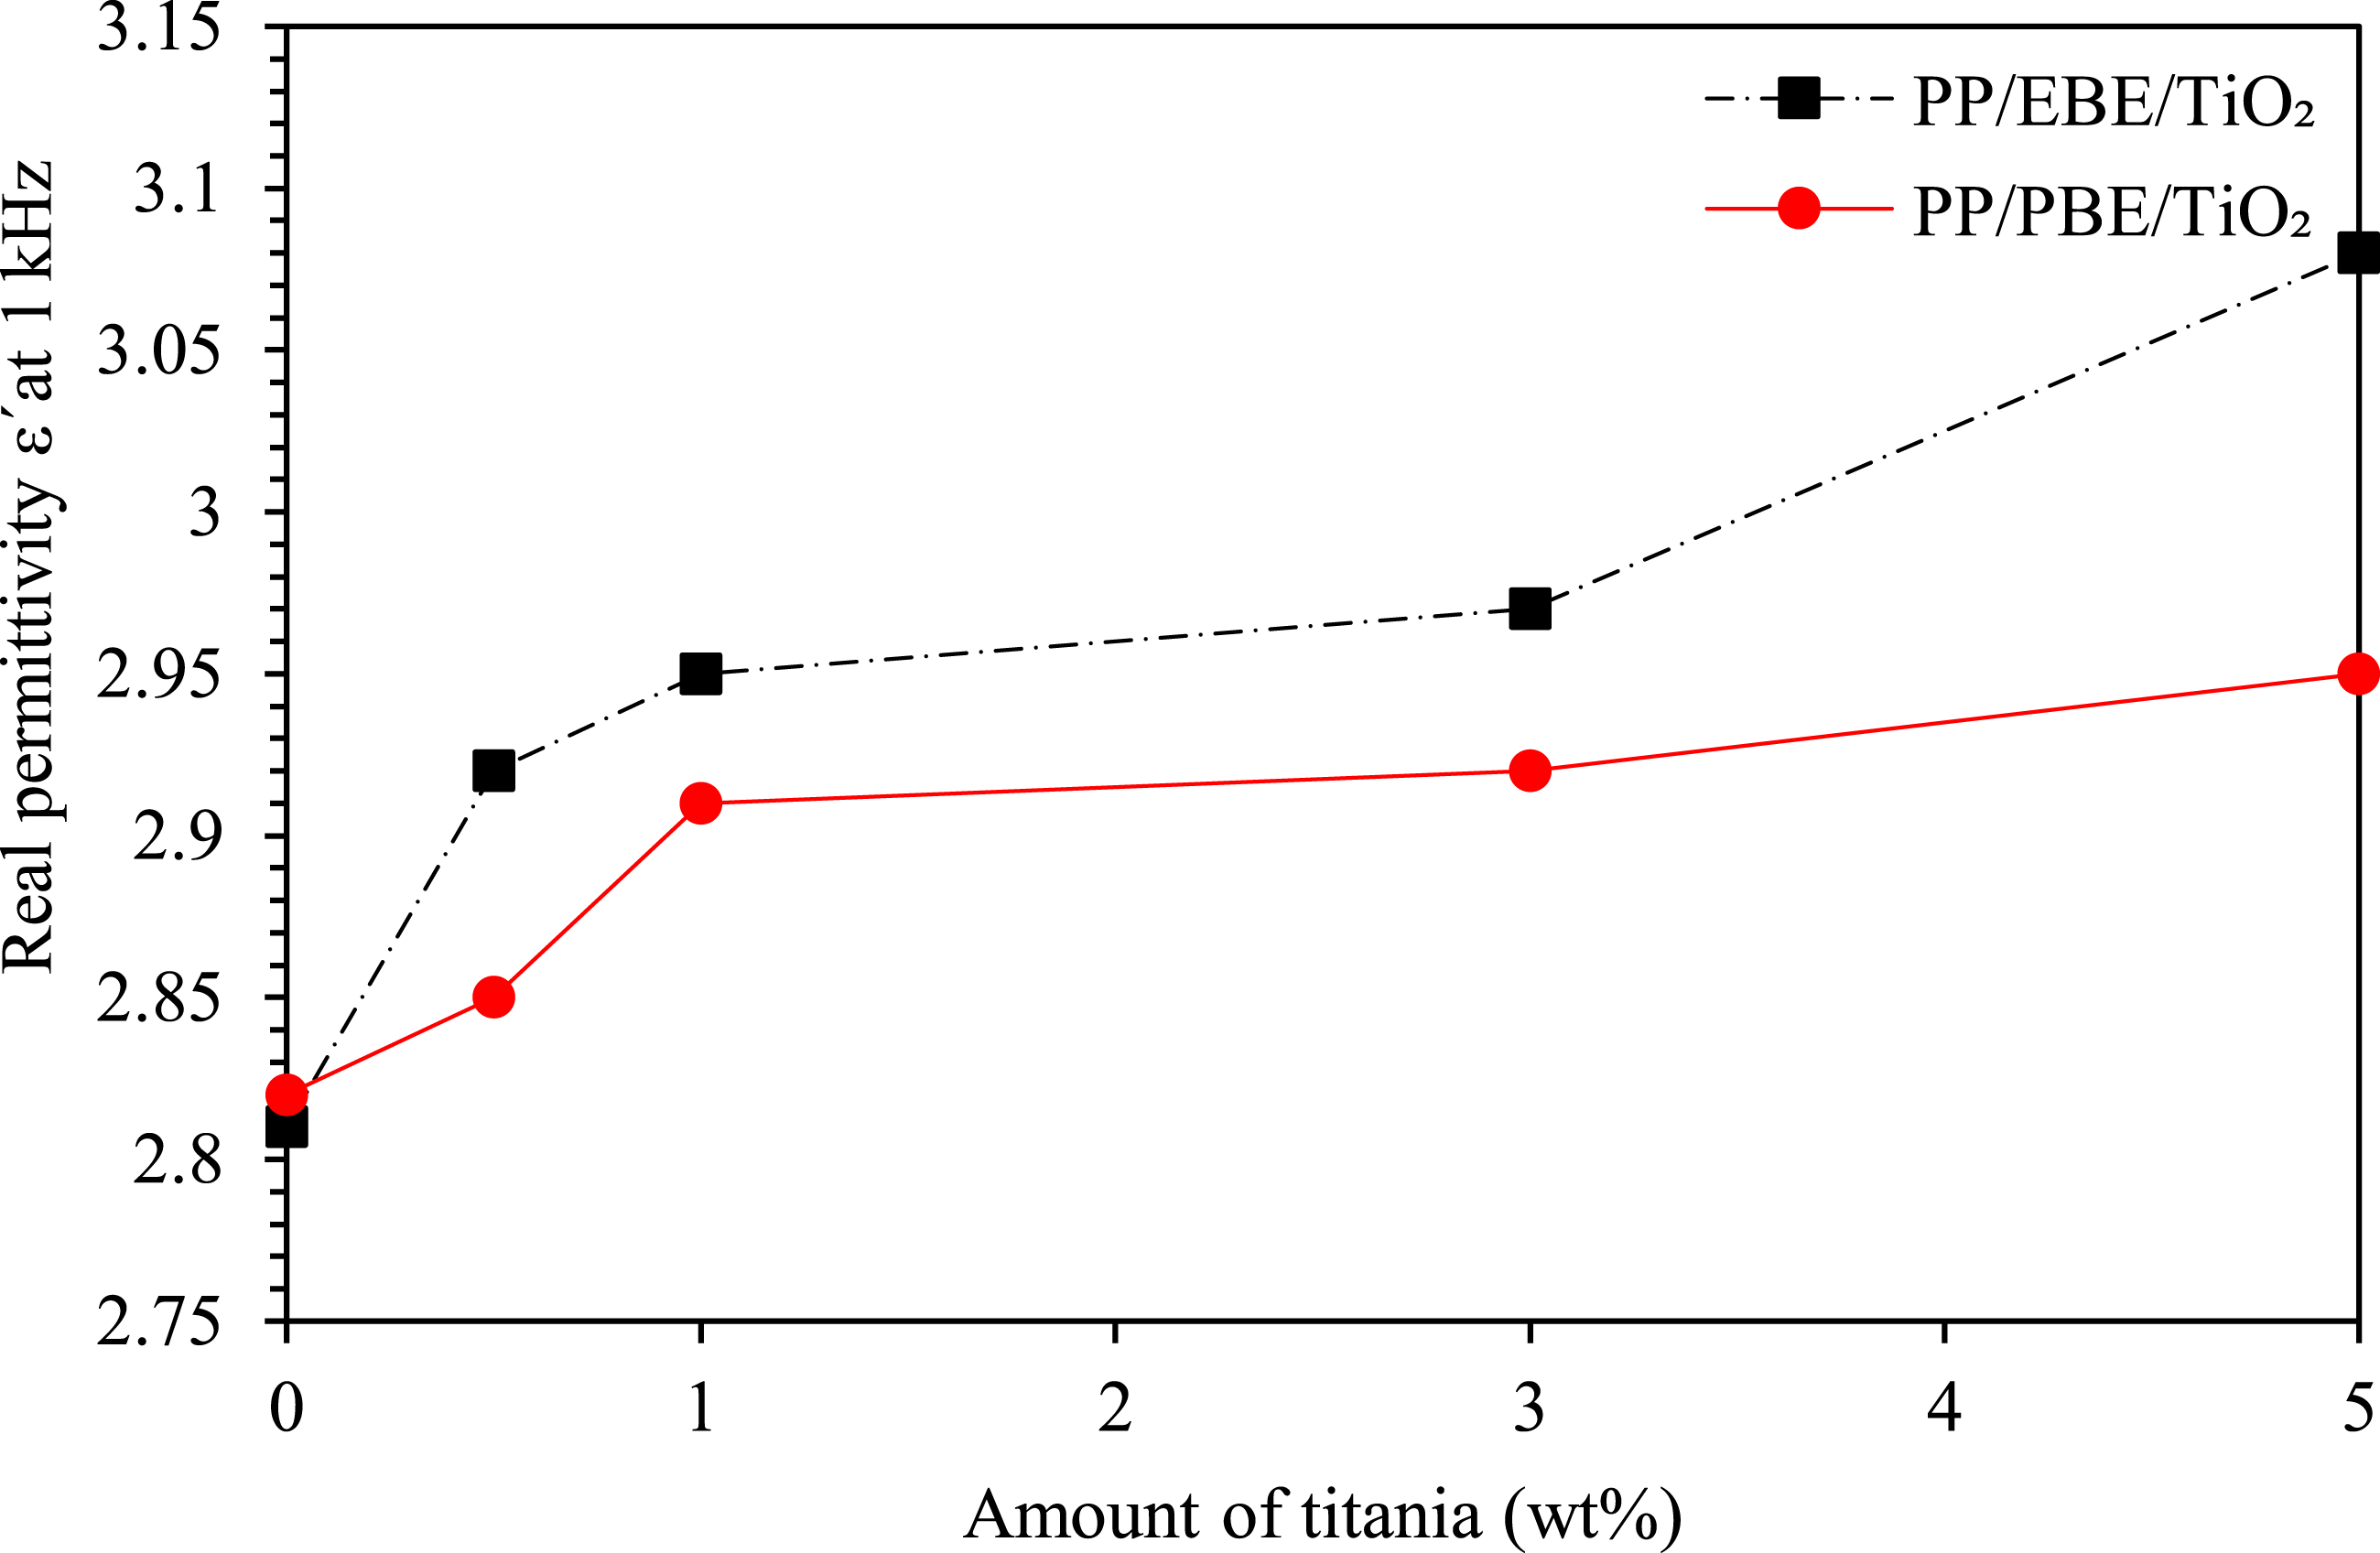
For PP/PBE system, ε′ of PP/PBE system without the addition of TiO2 is approximately 2.82. The presence of TiO2 at 0.5 wt% slightly increases ε′ by 1% to around 2.85. A significant increment can be observed at 1 wt% and 3 wt% of TiO2 loading levels, where ε′ increases by 4% (∼2.92) and 5% (∼2.95), respectively. Further increases of ε′ approximately 5% (∼2.97) as the amount of TiO2 increases to 5 wt%. It is worth noting that ε′ of PP/PBE blend nanocomposites are comparably lower than PP/EBE blend nanocomposites at all TiO2 loading levels.
It is noteworthy that the loss factors of the materials are not discussed here due to their extremely low values, which yielded no appreciable difference across the tested frequency range. This avoids unnecessary data misinterpretation, as also noted in our previous studies.40,41 While data of the loss factor is not discussed in the current work, previous studies20,42 have suggested that analyzing changes in ε′ is appropriate for assessing dielectric property variations in nanocomposites.
AC and DC Breakdown Strengths
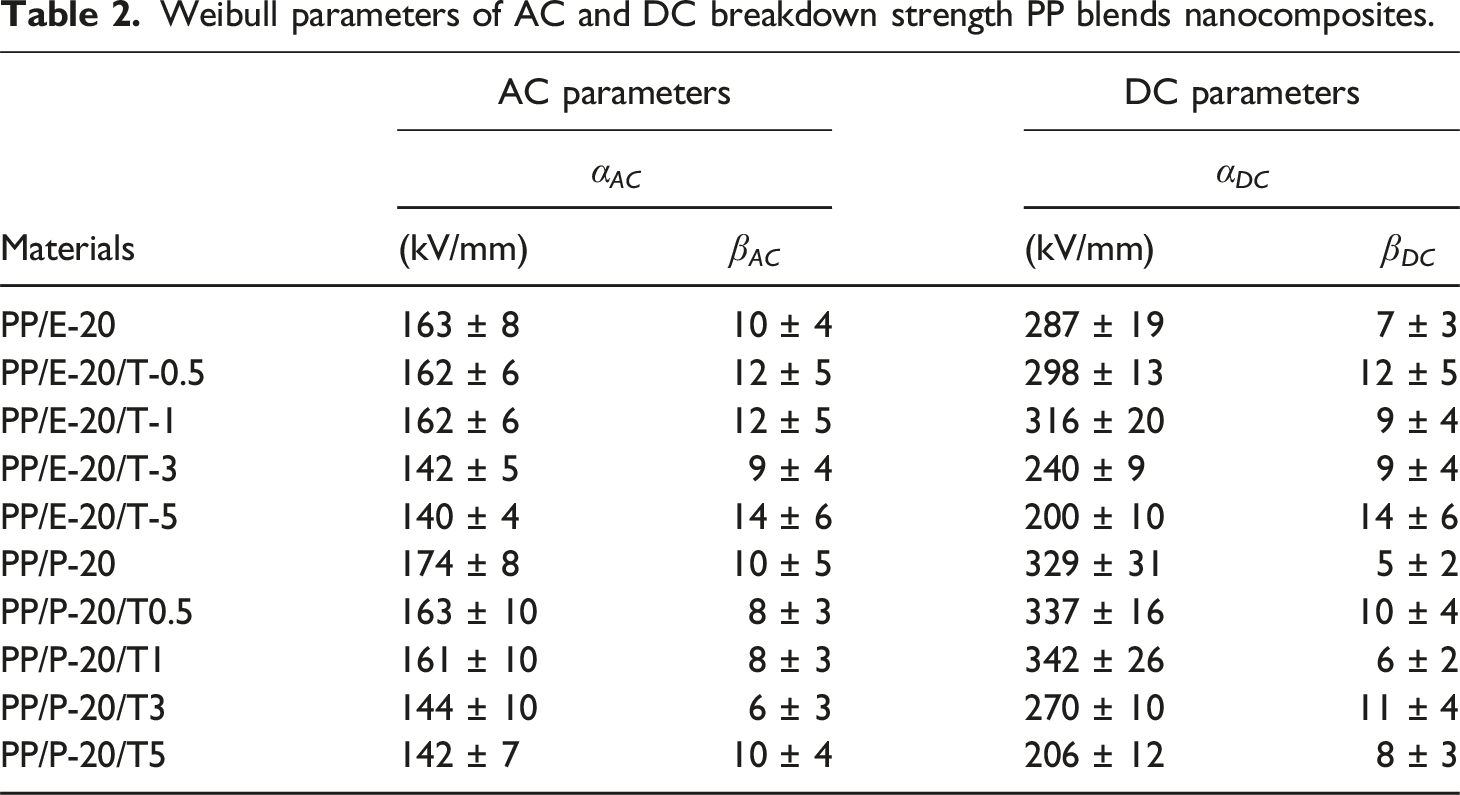
Figure 8 shows the Weibull plots of AC breakdown strength of PP/EBE/TiO2 and PP/PBE/TiO2 blend nanocomposites; the Weibull data are summarized in Table 2. The inclusion of TiO2 at 0.5 wt% and 1 wt% does not significantly affect the AC breakdown properties; the AC breakdown values are similar to the reference, unfilled PP/EBE system at 163 kV/mm. The addition of TiO2 beyond 1 wt% leads to a remarkable decrease in the AC breakdown strength of PP/EBE blends. For instance, the AC breakdown strength of PP/EBE blend nanocomposites at 3 wt% of TiO2 loading drops to 142 kV/mm. The value further declines to 140 kV/mm as the amount of TiO2 increases to 5 wt%. AC breakdown strength of PP/EBE/TiO2 and PP/PBE/TiO2 blends nanocomposites. Weibull parameters of AC and DC breakdown strength PP blends nanocomposites.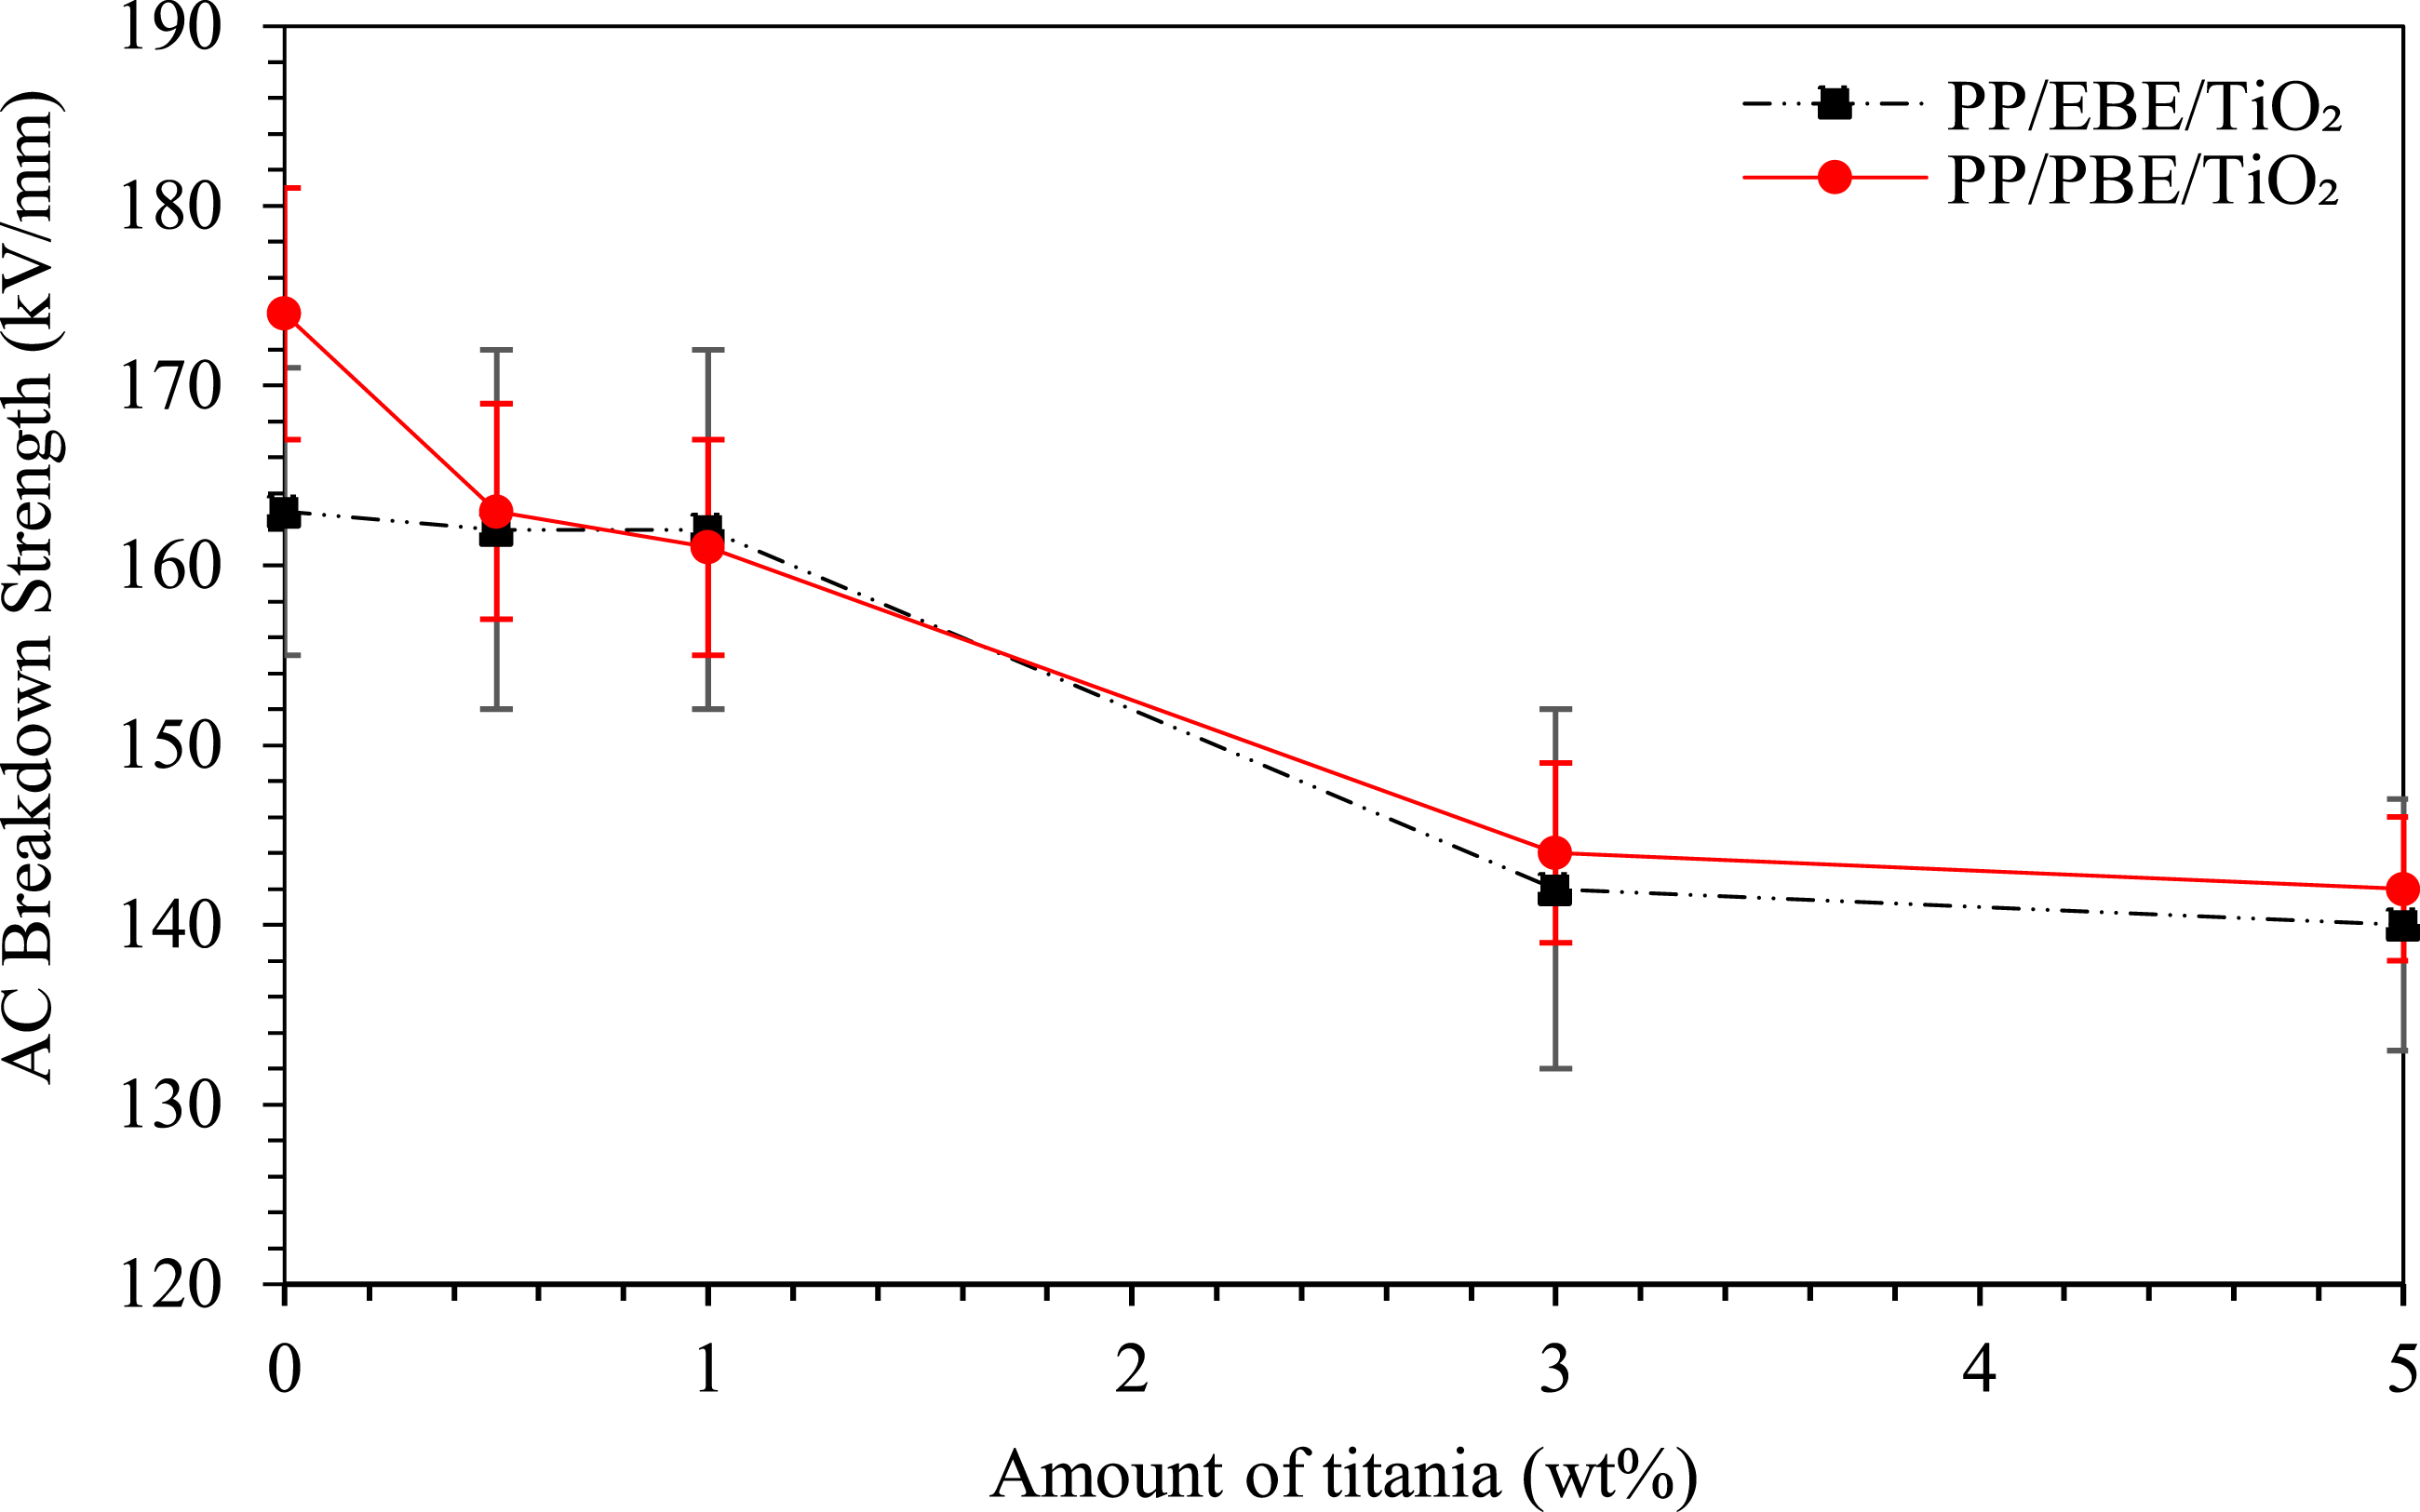
For PP/PBE/TiO2 blend nanocomposites, the incorporation of 0.5 wt% of TiO2 reduces the AC breakdown strength to 163 kV/mm compared to 174 kV/mm of the reference, unfilled PP/PBE system. Increasing the TiO2 content to 1 wt% in PP/PBE system does not significantly affect the AC breakdown strength. As with the PP/EBE system, adding more than 1 wt% of TiO2 to PP/PBE system leads to a significant reduction in AC breakdown strength. Specifically, incorporating 5 wt% of TiO2 lowers the AC breakdown strength to 142 kV/mm. Overall, the incorporation of TiO2 in PP/PBE blend and PP/EBE blend leads to similar AC breakdown behaviors.
Figure 9 shows the Weibull plots of DC breakdown strength of PP/EBE/TiO2 and PP/PBE/TiO2 blend nanocomposites; the Weibull data are summarized in Table 2. For PP/EBE/TiO2 blend nanocomposites, the DC breakdown strength improves by 4% with the addition of 0.5 wt% TiO2, compared to the unfilled PP/EBE system (287 kV/mm). At 1 wt% TiO2 loading level, the DC breakdown strength further improves to 316 kV/mm. Nevertheless, a dramatic decrease in DC breakdown strength is seen at 3 wt% and 5 wt% of TiO2 loading levels, where the breakdown values become 240 kV/mm and 200 kV/mm, respectively. DC breakdown strength of PP/EBE/TiO2 and PP/PBE/TiO2 nanocomposites.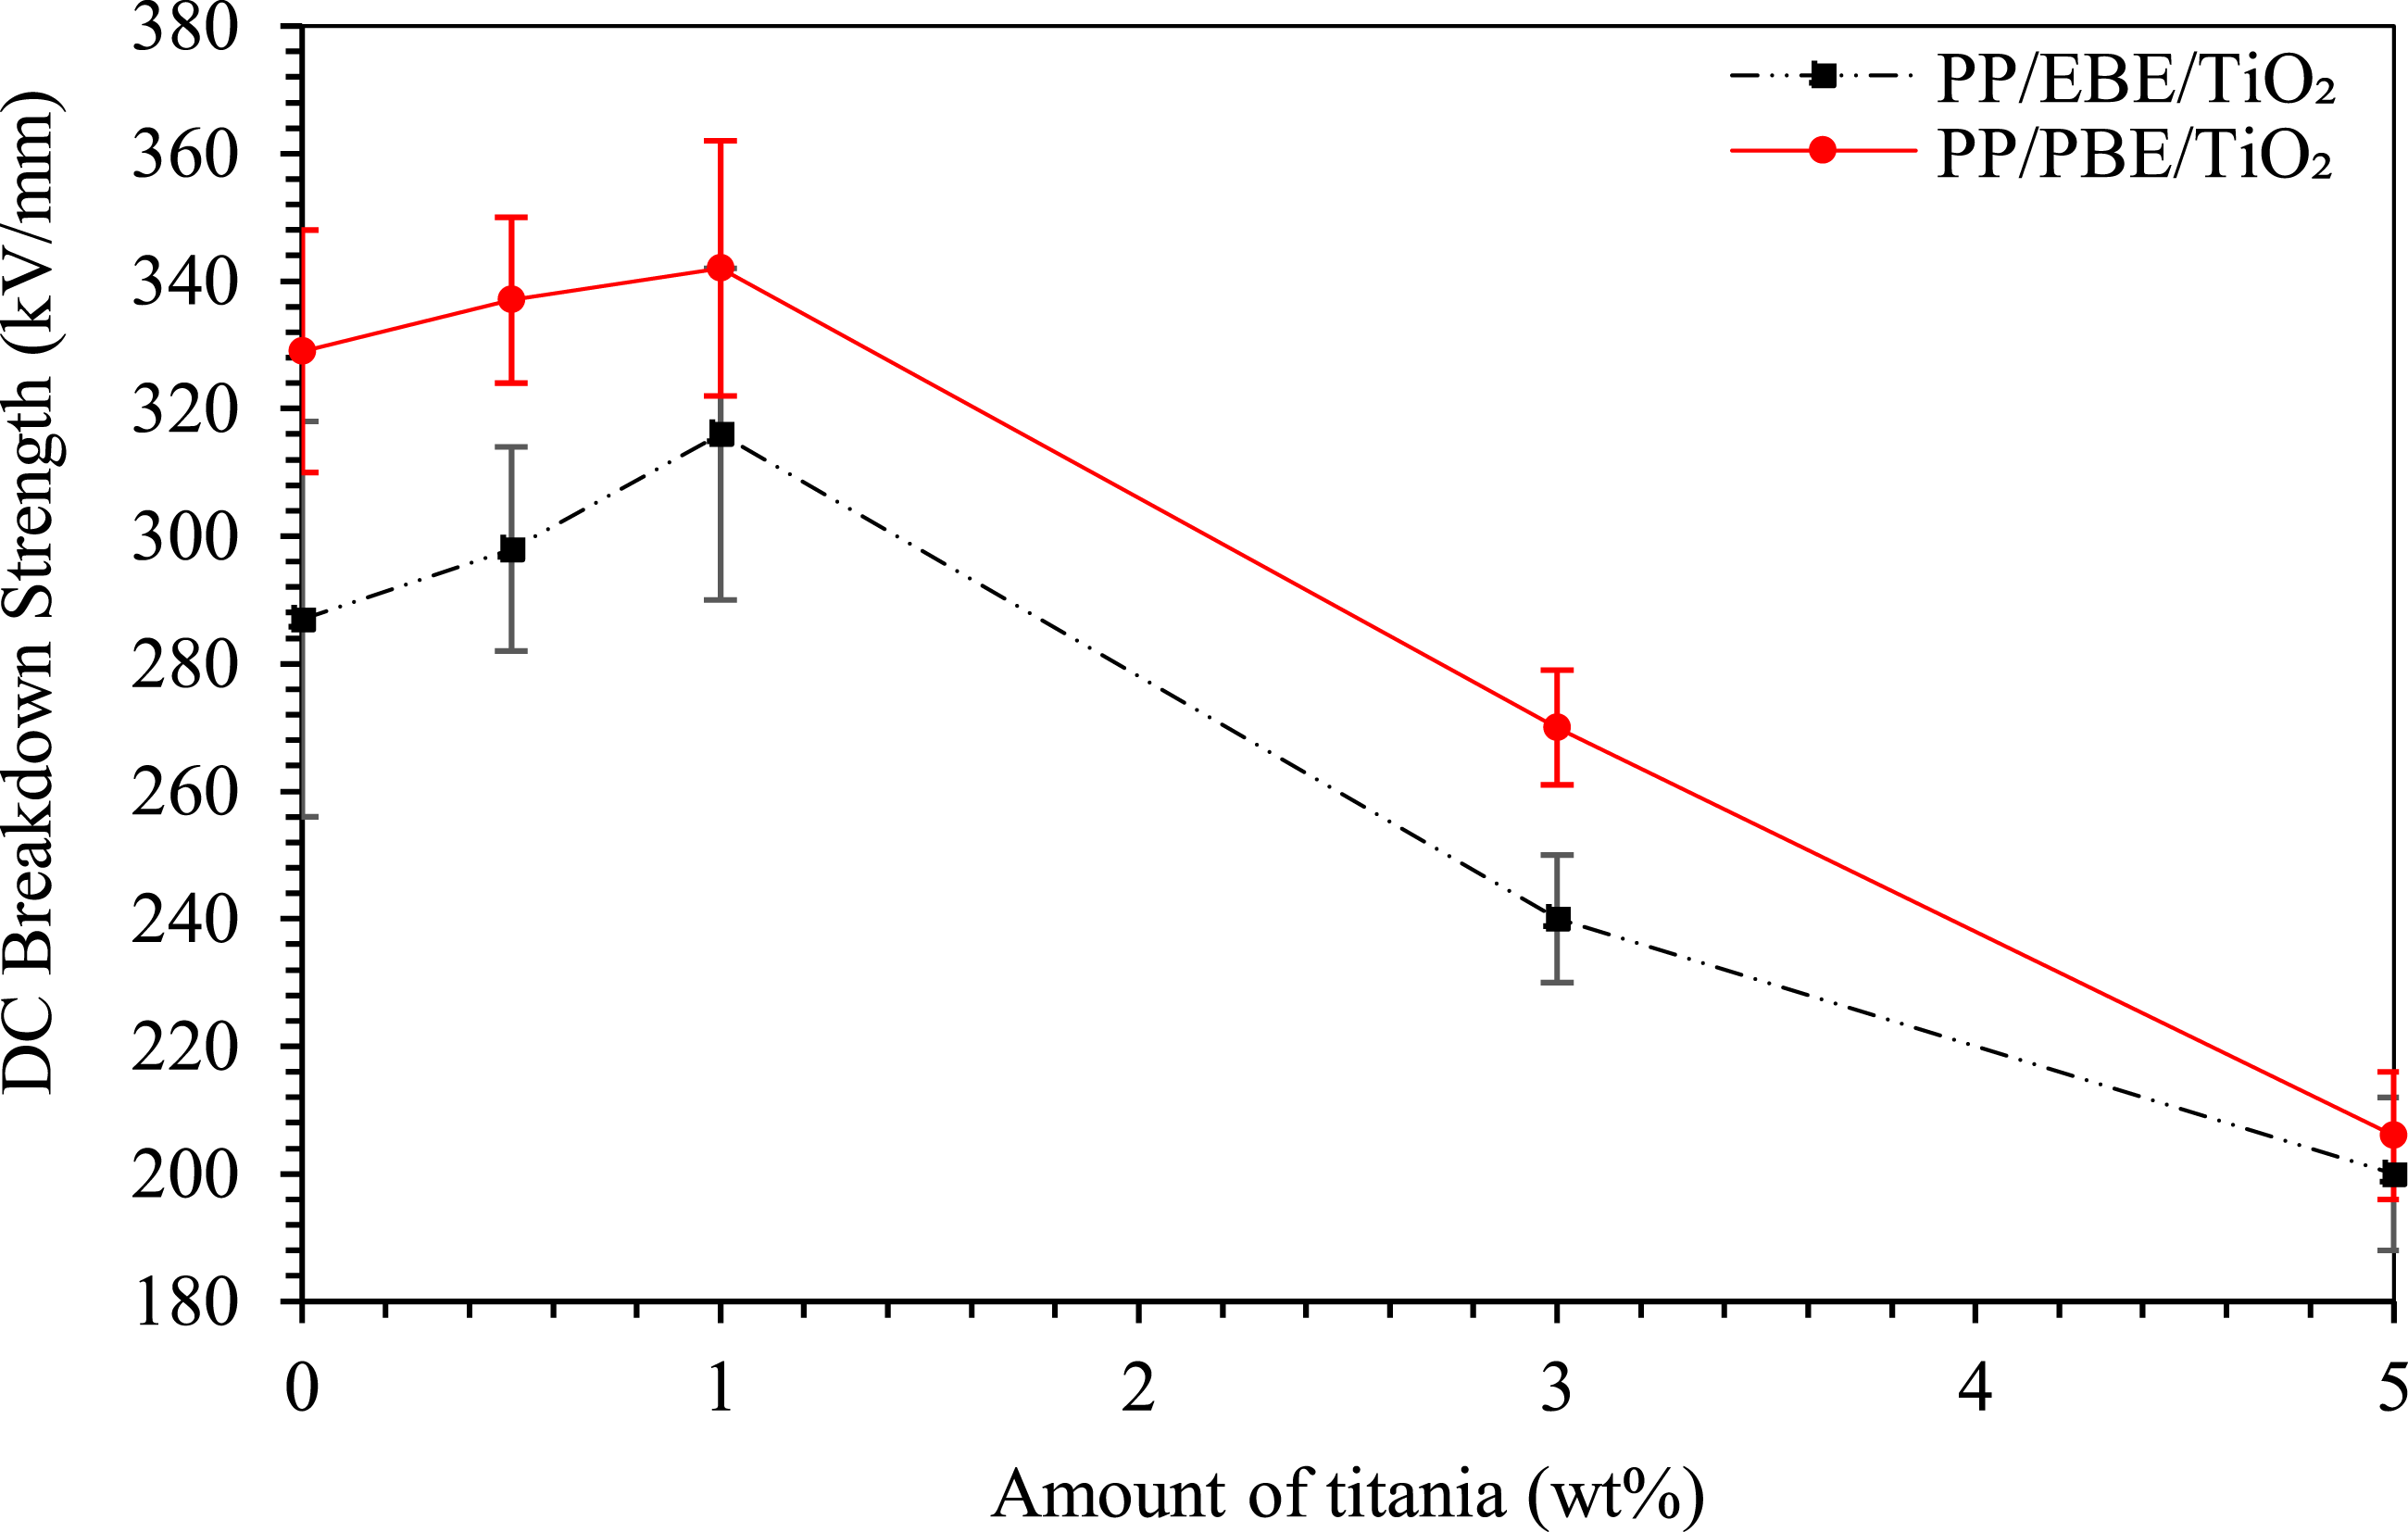
For PP/PBE/TiO2 blend nanocomposites, the inclusion of 0.5 wt% of TiO2 modestly increases the DC breakdown strength by 2% to 337 kV/mm, compared to the unfilled PP/PBE system (329 kV/mm). At 1 wt% of TiO2, the DC breakdown strength further increases to 342 kV/mm. Nevertheless, the DC breakdown strength reduces to 270 kV/mm and 206 kV/mm as TiO2 increases to 3 wt% and 5 wt%, respectively. Overall, the effects of TiO2 are similar on the DC breakdown behaviors of both the PP/PBE/TiO2 and PP/EBE/TiO2 blend nanocomposites, but the DC breakdown strength of PP/PBE/TiO2 blend nanocomposites is comparatively higher than PP/EBE/TiO2 blend nanocomposites.
Notably, the shape parameter β exhibits greater variations across the samples under DC field compared to AC field. This is likely due to higher sensitivity of DC fields to material inhomogeneities, such as filler distribution, voids, or interfacial defects, which can significantly influence local electric field. 43 Nevertheless, the primary focus of the current work is the scale parameter α, as it is more relevant from an application perspective, representing the typical breakdown strength the material can sustain. While the shape parameter β provides an important insight into the consistency and reliability of the breakdown data, its variation is less critical for the objectives of the current work, hence not discussed at length.
Discussion
At high amounts of TiO2 (3 wt% and 5 wt%), the DC breakdown strength of both the PP/EBE/TiO2 and PP/PBE/TiO2 blend nanocomposites significantly reduces. A similar observation is found under AC breakdown. The reduction in the breakdown strength can be explained in terms of TiO2 agglomeration. Pronounced TiO2 agglomeration can be observed by SEM for both PP/EBE/TiO2 and PP/PBE/TiO2 blend nanocomposites systems containing 3 wt% and 5 wt% of TiO2. Specifically, the agglomerations become more prevalent as the amount of TiO2 becomes 5 wt%. Even though surface modification by silane has resulted in TiO2 becoming more hydrophobic, some hydroxyl groups will remain due to incomplete surface modification. 35 These hydroxyl groups in TiO2 have a very high ratio of surface area to particle size, leading to the formation of agglomerations due to the high surface energy, thus making them poorly dispersed into polymer, especially at high amounts. 16 These TiO2 aggregates can function as electrical defects, amplifying the electric field intensity at the interface between the filler and the matrix, ultimately lowering the breakdown strength. 35
The reduction in the breakdown strength of PP/EBE/TiO2 and PP/PBE/TiO2 blend nanocomposites systems containing 3 wt% and 5 wt% of TiO2 can also be linked to the crystallinity effects. It is worth noting that the crystallinity significantly reduced when the amount of TiO2 increased to 3 wt% and 5 wt%, for both PP/EBE/TiO2 and PP/PBE/TiO2 blend nanocomposites systems. As such, the reduction in breakdown strength when TiO2 loading surpasses 3 wt% is consistent with the reduction in crystallinity. Since changes in crystallinity are associated with molecular chain disruptions and hence changes in spherulitic morphology, these could impact the breakdown strength regardless of the molecular composition. 35 With excessive nanoparticles incorporated in PP blends, the crystallinity decreases due to a decrease in the spherulite size. 44 Consequently, the incorporation of high TiO2 loadings in the PP blend systems reduced the materials’ spherulite size and lamellae thickness.
The DC breakdown strength demonstrates an appreciable improvement with the inclusion of 0.5 wt% and 1 wt% of TiO2 in both PP/EBE/TiO2 and PP/PBE/TiO2 blend nanocomposites systems. Such an increase in DC breakdown strength can be associated with the effectiveness of nanostructuration of both the PP blends upon TiO2 inclusion. The use of TiO2 surface modification through the MCPTS silane coupling agent renders TiO2 surface to become hydrophobic. According to Ogbonna et al., 40 treated TiO2 nanoparticles could be homogeneously disperse in polymers due to their surface-free hydroxyl groups. Modifying nanoparticles with silane coupling agents also resulted in better interfacial adhesion properties and reduces surface energy, which subsequently alters the physicochemical characteristics of the nanoparticles. 21 These explain why the incorporation of 0.5 wt% and 1 wt% of TiO2 into both PP/EBE and PP/PBE blends leads to good dispersion of TiO2, as observed through SEM. Since the dielectric properties are strongly influenced by the surface structure of the nanoparticle, 16 the PP/EBE/TiO2 and PP/PBE/TiO2 blend nanocomposites demonstrate significant improvements in DC breakdown strength under 0.5 wt% and 1 wt% of TiO2 loadings. Of note, the addition of 0.5 wt% and 1 wt% of TiO2 does not exert a significant impact on the AC breakdown strength of both PP/EBE/TiO2 and PP/PBE/TiO2 blend nanocomposites systems. Similar findings were reported by38,45 where nanofillers were found to have less influence under AC field.
Comparatively, at low TiO2 loadings (0.5 wt% and 1 wt%), the increase in the DC breakdown strength of PP/EBE/TiO2 blend nanocomposites is more pronounced than PP/PBE/TiO2 blend nanocomposites at the respective TiO2 loading levels. For example, at 1 wt% of TiO2 loading, PP/EBE/TiO2 blend nanocomposites exhibit 10% improvement in DC breakdown strength, whereas PP/PBE/TiO2 blend nanocomposites exhibit merely 4% improvement in DC breakdown strength. This suggests that TiO2 helps to improve the compatibility between the PP and the EBE through uniform dispersion of the nanoparticles across the entire blend. In more compatible PP/elastomer blends, however, the effect of nanostructuration can be limited. This is supported by the dielectric response analysis, where the increase in real relative permittivity in PP/PBE/TiO2 blend nanocomposites is less than in PP/EBE/TiO2 blend nanocomposites, at equivalent TiO2 loading levels. Since PP and PBE are more compatible over PP and EBE, TiO2 demonstrates less significant permittivity effects in PP/PBE/TiO2 blend nanocomposites. While changes in permittivity values can be associated with changes in breakdown strength, the current results suggest that the reduced breakdown strength of the materials under high TiO2 loadings is primarily associated with reduced crystallinity and TiO2 agglomeration while the improved breakdown strength of the materials under low TiO2 loadings is primarily associated with the TiO2 dispersion state. Overall, appropriately dispersed TiO2 can further enhance the DC breakdown strength of both PP/EBE/TiO2 and PP/PBE/TiO2 blend nanocomposites, with the effect being more pronounced on PP/EBE/TiO2 blend nanocomposites. Nevertheless, for these materials to be practically utilized as insulation materials in power cable applications, additional characterizations involving mechanical properties, thermal conductivity, space charge behavior, loss factor, DC conductivity, and aging effects should be considered.
Conclusions
The current work demonstrates how TiO2 influences the structure and dielectric properties of PP/EBE and PP/PBE blends. At high TiO2 loadings (3 wt% and 5 wt%), the breakdown strength of PP/EBE/TiO2 and PP/PBE/TiO2 blend nanocomposites significantly reduces under both AC and DC fields. This is attributed to the increased TiO2 agglomeration and reduced nanocomposite crystallinity. Nevertheless, the inclusion of small amounts (0.5 wt% and 1 wt%) of TiO2 improves the breakdown properties of both the PP blend systems, especially under DC field. Notably, the effect TiO2 is more remarkable on PP/EBE system over PP/PBE system. Specifically, the inclusion of up to 1 wt% of TiO2 improves the DC breakdown strength of PP/EBE and PP/PBE systems by 10% and 4%, respectively. Such breakdown strength increment is associated with the surface modification of TiO2 by silane coupling agent, which improves the dispersion of TiO2 in the PP blends. Overall, nanostructuration of PP blends demonstrates positive effects toward the breakdown performance of the materials, provided that an optimal nanofiller dispersion is achieved. These findings are crucial for future development of PP-based materials for power cable insulation applications.
Footnotes
Declaration of conflicting interests
The authors declared no potential conflicts of interest with respect to the research, authorship, and/or publication of this article.
Funding
The authors received no financial support for the research, authorship, and/or publication of this article: This work was financially supported by the Ministry of Higher Education Malaysia through the Fundamental Research Grant Scheme (FRGS/1/2023/TK07/UTM/02/21) and Universiti Teknologi Malaysia (UTM) through the UTM Fundamental Research Grant (Q.J130000.3823.22H34).