
Abstract
Glass/epoxy (G-E) products are widely used in numerous industries nowadays. This is due to favorable characteristics of these products including low cost, ease of manufacturing, good mechanical properties, and lightweight. The mechanical properties of G-E composites can be enhanced through mixing with natural reinforcement materials. In this work, we investigate the use of date seeds (DSs) as a reinforcement material for G-E composites. A DS filler has been added to G-E hybrid composites as a powder by applying a semiautomatic technique. Glass fibers reinforced with angle-ply ([±45]4) were considered as commonly used G-E composites. G-E reinforced DS composites were analyzed using various mechanical characteristics such as mica-hardness, tensile strength, and impact strength. Effects of the DS filler on the wear volume loss (VL) were investigated at different parameter settings. This loss was analyzed using the traditional Taguchi method and the nontraditional flower pollination algorithm to obtain optimal parameters. Surface inspection using a scanning electron microscope and Fourier-transform infrared (FTIR) was conducted. The results revealed that the addition of a 10% DS reinforcement to G-E composites enhanced the wear resistance and increased toughness and hardness. Finally, G-E-DS composite optimization was carried out by minimizing the wear VL. This resulted in an optimum DS reinforcement of 10% at a normal load of 10 N, an abrasive size of 1200 mesh, and an abrading distance of 420 m. Deviations from this reinforcement ratio degrade the mechanical properties of the G-E-DS composite. Moreover, the significant factors are the abrasive size, reinforcement material wt%, normal load, and abrading distance. The contributions of these factors are 30.6%, 15.5%, 11.8%, and 10%, respectively. FTIR results indicate that a chemical interaction has occurred between G-E and the organic DS. These experimental results are in good agreement with the theoretical ones.
Introduction
Organic materials such as reinforced or composite materials have witnessed increasing potential in modern industries. In addition, these materials are used due to their low cost and good mechanical properties. The industrial applications of natural and organic-reinforced materials are also predetermined by economic aspects, environmental impacts, and priorities of renewable resources. 1 -3 There has been a growing demand for green and renewable alternatives for organic fillers. Such fillers offer major advantages such as low density, cost reduction, and low mechanical wear during processing. Several studies investigated green fillers including natural fibers, olive husk and almond shells. 4 -7 More work in the literature has reported that special kinds of organic fillers, such as talc and tamarind kernel powder, are frequently used to enhance the mechanical properties and reduce the composite cost. 8,9 Bensalah et al. studied polypropylene (PP) hybrid composites based on a mixture of graphite and clay. Their results show that the hybrid composites have excellent mechanical properties when compared to the neat polymer matrix. 10
The mechanical properties of bio-composites based on polymer resins and seed cake, as particles, have been investigated by Valášek. His results revealed that the epoxy and polyurethane resins have the ability to be formed, which is consistent with the interaction of the natural particles prepared from the seeds of cake. 11
The using of the coffee husk, a waste of coffee production, as a filler material for composite reinforcement, particularly in thermoplastics, has been investigated. The results revealed that the rising of the coffee husk filler loading from 40% to 70% in the polyethylene matrix increases mechanical and thermal properties of the composites. 12,13
Agunsoye et al. investigated Delonix regia (Dr) seed particles as a reinforcement material for producing new polymeric composites. Results show an incremental increase in tensile strength and strain with the addition of Dr to recycled low-density polyethylene. 14 Senturk et al. investigated the addition of calcite, due to its good dispersion, to PP for improving its mechanical properties in engineering applications. 15 Yang et al. suggested raising the elastic modulus of thermosetting polymers through the inclusion of rice-husk flour. For the past two decades, composites with inorganic fillers such as Al2O3, SiC, glass fiber silica, nanoparticles, graphene, carbon nanotubes, and nanofibers have been studied extensively. 16 Basavarajappa et al. explored the effect of SiC particles and graphite as fillers on the tribological behavior of glass/epoxy (G-E) composites. 17 Patnaik et al. 18 and Suresha et al. 19 studied the abrasive wear behavior of glass fiber-reinforced epoxy (G-E) filled with Al2O3. The results showed that G-E composites filled with Al2O3 are more resistant to abrasive wear than unfilled G-E composites. In this article, we propose to reinforce composites with date seed (DS) fillers. These fillers are of low weight, easy for manufacturing and fabrication, highly resistant to chemicals, and environmentally friendly. 20 Due to rising concerns on the environmental impact of materials and new regulations, considerable work has been done for replacing polluting and hazardous fillers with those derived from bio-sources such as eggshells. 21 Mittal et al. investigated the effect of DS powder on bio-polyesters (polybutylene adipate-co-terephthalate). The study showed that the addition of this filler in the composites had significantly enhanced the extent of bio-degradation compared to pure polymers. 22 Ruggiero et al. studied the possibility to utilize the waste of the date palm (Phoenix dactylifera) fruit processing. Results showed that date particles did not significantly reduce the adhesive characteristics of the resin. The filling lead to 10.8% increase in the shear strength and up to 11% increase in the wear resistance at specific concentrations of bio-fillers. In impact events, several types of damage occur in composite materials such as matrix cracking, delamination, and fiber breakage. 23 Consequently, the impact behavior of laminated composite materials is an important issue to be studied. 24 Simonassi et al. explored the mechanical properties of polyester reinforced with aligned ramie fibers up to 30% by volume. Results showed that polyester–ramie fiber composites also displayed a significant improvement in toughness. The impact energy values, as measured by the Izod impact test, increased about two orders of magnitude for 30% ramie fiber composites compared to neat polyesters. 25
Different researchers have considered statistical tools to design, model, and optimize the input parameters and corresponding responses of filler-reinforced G-E composites. Babu et al. 26 used the Taguchi method to determine the optimum wear parameters of plastic and natural fiber composites reinforced with Hemp fibers. Bongale et al. exploited the Taguchi method and genetic algorithms for optimizing wear test parameters of aluminum-based hybrid nanocomposite materials, processed through powder metallurgy techniques. 27 Kumar and Rajmohan used a response surface methodology based on the central composite design for the optimization of wear rate and coefficient of friction behavior of polycarboxylate composites filled with multiwall carbon nanotubes. 28
The date fruit is among the oldest cultivated plants that appeared in the earliest records of predynastic Egypt. Cultivation of date palms in Egypt goes back to thousands of years ago. 29 DSs emerge as a biomass waste in date palm processing and can be used as economic fillers for composite reinforcement.
This work focuses on the enhancement of mechanical properties (microhardness, ultimate tensile strength, and impact strength) and wear properties of G-E composites through the utilization of natural waste material (DS powder). The enhanced composite has been prepared using a semiautomatic technique (SAT). For wear tests, effects of the filler material on the wear volume loss (VL) were investigated at different parameter settings (amount of filler content, type of filler, abrasive load and size). VL due to abrasive wear was determined experimentally and theoretically using Taguchi methods and the flower pollination algorithm (FPA), which gives the optimal parameters for minimizing the wear VL. After wear testing, morphology of the DS-reinforced G-E composite specimens was examined by a scanning electron microscope (SEM).
Experimental setup
Base materials
In this work, the benchmark materials form bidirectional composites. Glass is used as a reinforcement material with 45% while an epoxy resin (Araldite PY1092 [The chemical Huntsman Corporation] catalyzed with an HY1092 hardener) has been used as a matrix with 55%. The constituents of the DS materials included carbon (C), oxygen (O), sulfur (S), potassium (K), and iron (F) with 81, 17.6, 1.5, 1.3, and 1.44 wt%, respectively, has been added to the base material to enhance the mechanical properties of the composite.
DS filler preparation
In this work, the preparation of the DS filler material is performed as follows: Fresh DSs are collected. DS surface layer elimination is performed using H2SO4 with 50% concentration for 5 h. The DS collection is cleaned with distilled water followed by drying in the air for 24 h. The cleaned DS collection is put in an oven at 70°C for 8 h to remove moisture. The DS collection is crushed and milled using a ball mill, and then sieved using a sieve with an average particle size of 75 µm.
20,22
Experimental procedures
Equipment
In this work, specimens are manufactured using a grinding-based SAT instead of the hand-layup technique. In addition to advantages of ease of use and simplicity, the used technique produces accurate and homogeneous composite specimens with controlled thicknesses using a dial gauge and a constant speed. As well, the machine control panel is used to control the movement of the rolling tool.
SAT-based specimen manufacturing is conducted as follows: The pattern is fixed on the machine table. The first layer of fiber is fixed on the frame of the pattern. The rolling tool is mounted on the machine tool post. The layer thickness is controlled using a dial gauge mounted on the rolling tool. The resin is poured on the fiber. The rolling tool distributes the resin using the reciprocating motion of the machine table. The layup speed is controlled using a machine control panel. Repeat steps 4–6 for other layers.
Mechanical tests
Wear testing
A wear test was carried out, in which a rectangular composite specimen as shown in Figure (1) with dimensions of 5 × 9 × 30 mm3 was tested under different loads and a sliding speed of 1.4 m/s. A pin-on-disk setup per ASTM G-99-05 was used in the wear test. The diameter of the pin collet ranges from 1.5 mm to 13 mm, and it was loaded against the SiC abrasive paper fixed on the hardened steel disk with the help of a cantilever mechanism. In the wear test machine, the collet is mounted on the pin into a steel holder that is held firmly perpendicular to the flat surface of the rotating counter disk.

Samples.
The initial and final weights of the specimen are recorded using an electronic balance with an accuracy of 0.0001 gm, where the difference in the recorded weights indicates the abrasive wear loss. This difference in weight is converted into a wear volume using the calculated density of the composite. Then, the wear VL was calculated as follows

where
Microhardness testing
In microhardness testing, an indentation is made on the specimen by a diamond indented through the application of a load P. The size d of the resulting indentation is measured with the help of a calibrated optical microscope; the pyramidal Vickers-type (interracial angle 136°) indenter, which produces a square impression, is generally favored . Its counterpart in general engineering employs test loads of 5–500 kg.
Microhardness was carried out, using the Vickers hardness device, for the sake of investigating the hardenability of the composite with and without the reinforcing DS filler material. In the present work, averages of at least five readings for each sample were utilized to calculate the hardness number. The Vickers hardness number is calculated as follows:

where F is the applied load (set to 5 N) and L is the length of the diagonal of a square impression in millimeters.
Ultimate tensile strength testing
All specimens were tested on a computer-controlled servo-hydraulic universal testing machine (Model UH–500 KNA, Schematize, Japan, Qualitest – Advanced Testing Technologies company). The universal testing machine had a maximum load capacity of 50 tons and a crosshead speed range from 0.1 mm/min to 50 mm/min. The maximum distance between the two crossheads was 900 mm for tension while the distance between the movable crosshead and the base was 800 mm.
Impact testing
The Izod impact test was an ASTM standard method of determining the impact resistance of materials. A pivoting arm is raised to a specific height (constant potential energy) and then released. The arm swings down hitting a notched sample, breaking the specimen. The energy absorbed by the sample is calculated from the height the arm swings to after hitting the sample. A notched sample is generally used to determine impact energy and notch sensitivity.
The Izod impact test was carried out at room temperature, to measure the toughness of the glass fiber/epoxy addition DS (G-E + DS) composite. The specimen was prepared based on the ASTM D258 standard. The specimen was cut into a rectangular bar with a width of 13 mm and a length of 64 mm for notched it. According to the standard, after the specimen was fixed on the testing machine, it was impacted by a pendulum at a speed of 3.34 m/s. In the present work, each reported impact data sample is the average of three replicated measurements.
Worn surface testing
After coating the prepared specimen surface with gold in a vacuum sputter chamber, the JSM-6510-LA SEM (JEOL company) was used to examine the worn surface. JSM-6510-LA is a high performance multipurpose SEM with the unique high precision optics. Further, it scans a beam of electrons over a specimen to produce a magnified image of an object. Electrons from the beam hit the surface of the object and bounce off it. A detector registers these scattered electrons and turns them into a picture.
Fourier-transform infrared spectroscopy
Fourier-transform infrared spectroscopy (FTIR) is an analytical technique used to identify organic, polymeric, and inorganic materials. A Vertex 70 FTIR spectroscopy (Anton Paar USA Inc. - Company) was used to scan the G-E with/without DS composite in the range of 4000–500 cm−1. Its method uses infrared light to scan test samples of G-E with DS of the molecular structure of the sample, and the usefulness of infrared spectroscopy arises because different chemical structures (molecules) produce different spectral.
Optimization techniques for wear performances
Two optimization techniques were used to optimize the wear loss performance. In this study, these techniques are the Taguchi method and the FPA. The two techniques were respectively implemented using the Minitab 17 and MATLAB (version is 7.3) software tools.
Taguchi method
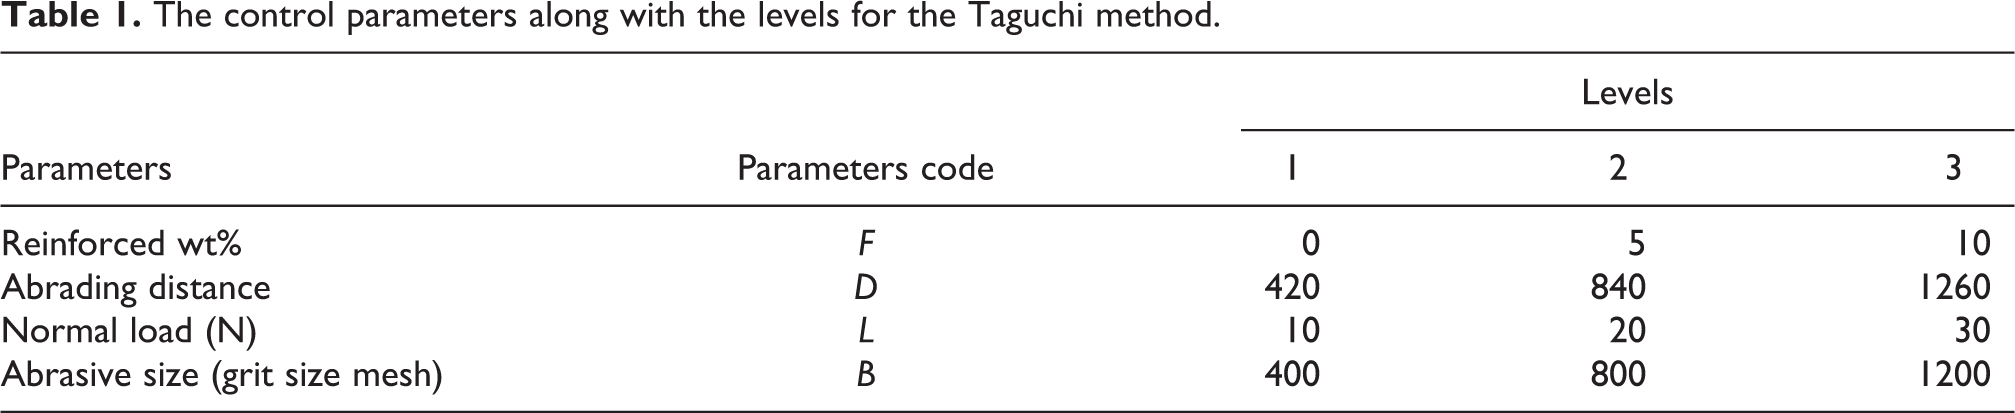
In the Taguchi method, an orthogonal array is developed to study the outcome of control parameters involved in experimental work. In this work, the Taguchi method for four factors with three levels was used. The factors and their respective levels are listed in Table 1. The experiments were made based on an L27 array.
The control parameters along with the levels for the Taguchi method.
Flower pollination algorithm
The FPA is a global population-based exploration and optimization algorithm based on the principles of genetics and natural selection. This algorithm is used to solve both linear and nonlinear optimization problems by exploring all regions of the state space.
Results and discussion
Effect of DS reinforcement on effective parameters
The volume rate of DS-reinforced composite specimens was tested with different effective parameters, namely DS filler wt% (F), abrasive size (B), normal load (L), and abrading distance (D). Figure 2 illustrates the relationship between the abrasive size and VL. A normal load (L) of 10 N and an abrading distance (D) of 420 m are taken as working conditions in this figure. It can be observed that VL decreases with increasing abrasive particle size due to the increase in the penetration ability of the specimens. Large size means a small number of particles per square inch and vice versa. For a small abrasive size, the pore decreases and particles serve as a harder surface which means higher wear resistance. Moreover, it can be seen from Figure 2 that VL decreases with DS-filled G-E composites compared with unfilled ones, that is, the increase of the DS filler weight from 5 wt% to 10 wt% tends to reduce VL. This decrease in VL can be ascribed to the fact that the DS reinforcement resists the penetration of abrasive particles into the composite. In addition, glass fibers resist the abrasion along with DS particles. Hence, there was an improvement in the abrasive resistance of the DS-filled G-E composite compared to the unfilled one.

The relation between VL and abrasive size at L = 10 N and D = 420 m. VL: volume loss; G-E: glass–epoxy.
Figure 3 presents the relation between VL and the abrading distance at a normal load (L) of 10 N, an abrasive size (B) of 400 grit size. It can be seen that VL rises with increasing abrading distance. This is because of the fracture of the hard asperities of the counter surface due to its friction with the abrasive paper. On the other hand, it could be observed that VL decreases with increasing reinforced wt%. This may be due to increasing composite hardness with increasing DS reinforcement wt%, that is, its lubricant characteristics tend to decrease VL.
The relation between VL and abrading distance at B = 400 mesh and L = 10 N. VL: volume loss; G-E: glass–epoxy.
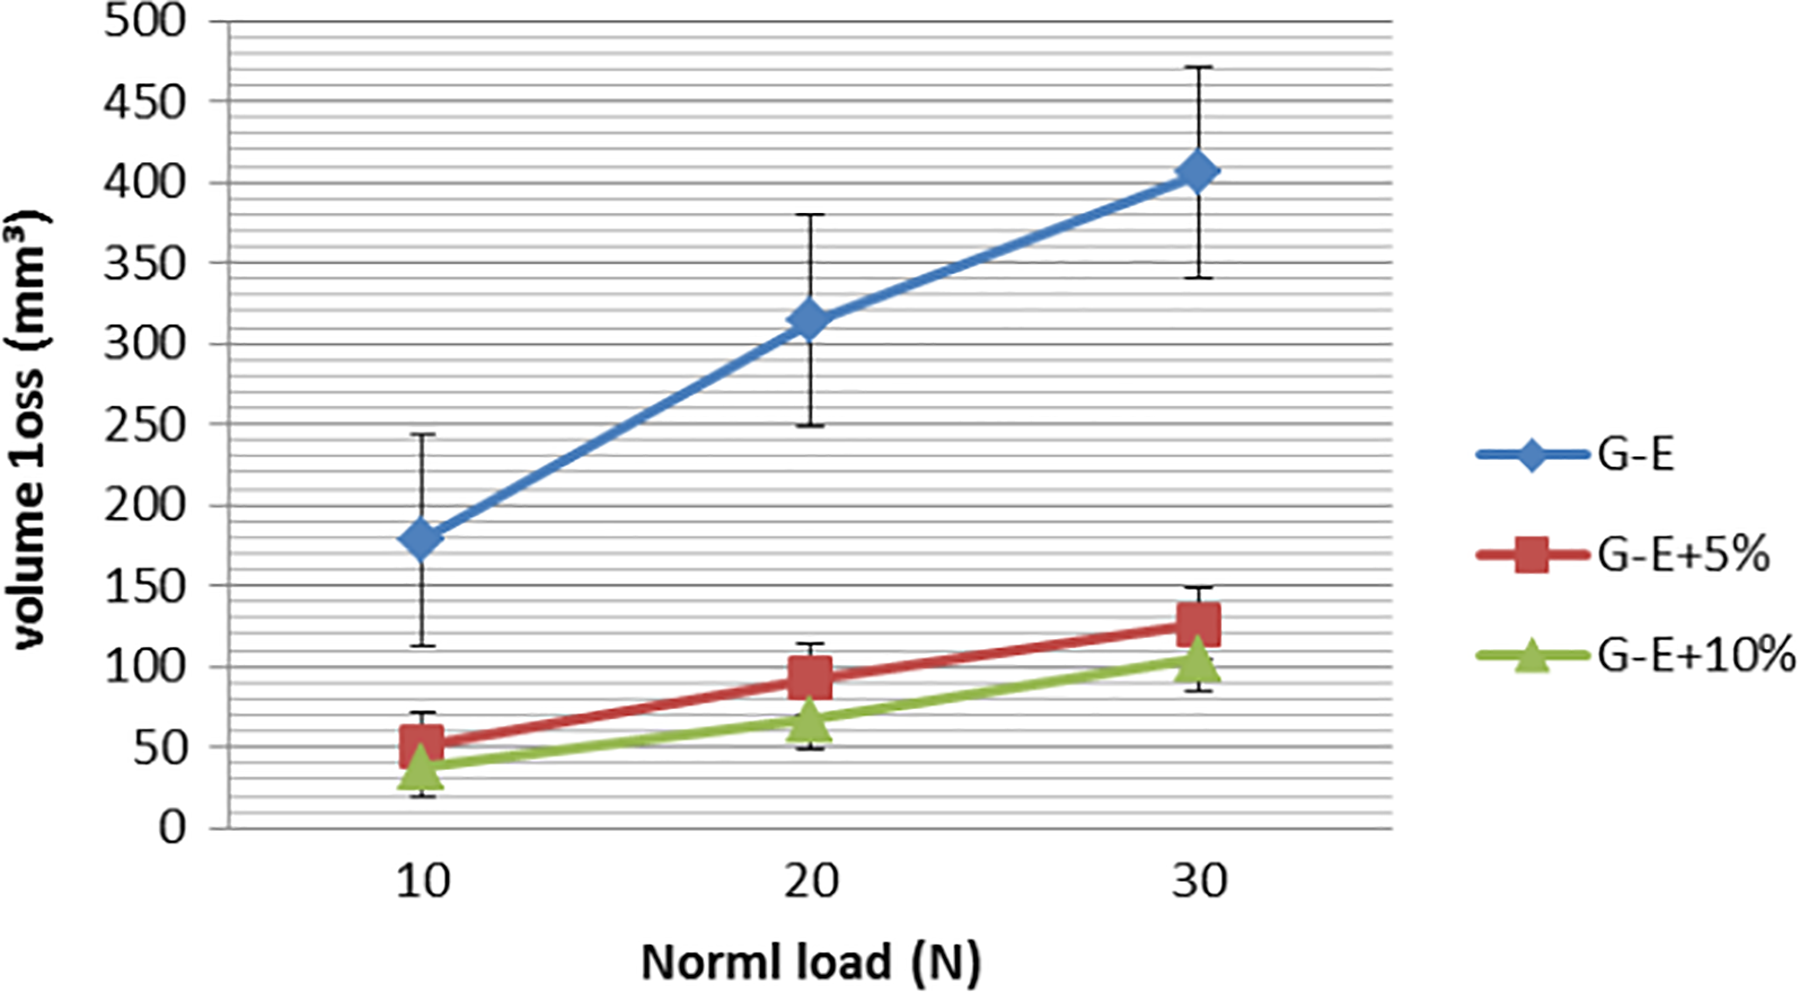
The effect of the normal load on VL is shown in Figure 4. An abrasive size (B) of 400 grit size and an abrading distance (D) of 420 m are taken as working conditions. It can be seen from this figure that VL increases with loads increasing from 10 N to 30 N. At higher normal loads, the apparent contact area is greatly raised, the contact stresses and depth of penetration of grit on the surface increase, and hence the wear VL increases. On the other hand, it could be observed that VL decreases with increasing the reinforcement material wt%, that is, the DS filler acts as a hardener, a reinforcement, and a wear-resistant material for the G-E composite.

Relation between VL and normal load at B = 400 mesh and D = 420 m. VL: volume loss; G-E: glass–epoxy.
The recommended effective parameters are F = 10 wt%, B = 1200 grit size, L = 30 N, and D = 1260 m.
Worn
In this work, the surface characteristics of the used composite material are studied through a SEM. Figure 5 illustrates the scanning electron micrograph of the worn surface of DS-filled and unfilled G-E specimens. Figure 5 shows that deep grooves occur in the abrading direction (illustrated by an arrow). These grooves are formed due to one of three major wear mechanisms, namely the micro-cutting action and micro-plowing as seen on the surface of the specimen by sharp abrasive particles. It should be noted that, from the scanning electron micrograph of a surface.

Scanning electron micrographs of the unfilled and DS-filled G-E composites: (a) G-E + 0% filler, (b) G-E + 10% DS, and (c) G-E + 5% DS. G-E: glass–epoxy; DS: date seed.
Figure 5(a) describes the big groove created on the fiber surface by crushing the matrix. With more explanation, due to the removal of the crush matrix, the lengthy glass fibers are subjected to the counterface. This characteristic obviously shows less effective structural integrity and lower G-E composite strength because it is induced in the stress of interfacial shear. It causes individual fibers to come into contact with the counterface and consequently the fiber rupture is unfavorable as it results in reduced composite wear resistance. Figure 5(b) and (c) shows a reduction in the groove that was formed, due to increasing mechanical strength and shear resistance of the surface. Moreover, reinforcement particles in the G-E composite serve as a medium to bear part of the stress that is being directly exerted onto the composite. Therefore, the presence of the DS reinforcement material in the G-E composite resulted in a reduction in the wear VL and a smoother worm surface. The measured surface roughness data of the selected samples are listed in Table 2.
Measured surface roughness data of unfilled and DS-filled G-E composites.

G-E: glass–epoxy; DS: date seed.
FTIR analysis
Figure 6 presents FTIR spectra for glass fiber/epoxy and DS-reinforced glass fiber/epoxy composite. The unfilled G-E spectrum shows four unique peaks representing C=C–H stretching vibrations, stretching C–O–C in ethers, stretching C–O–C in oxirane, and CH2 rocking modes at 1552, 1139, 885, and 781 cm−1, respectively (Figure 6(a)). On the other hand, Figure 6(b) shows the DS-reinforced glass fiber spectrum is notably different from that of the unfilled sample, where there is a powerful absorption peak of 1500–1000 cm−1 that could be allocated to enhance the C–O bond stretching vibration. Strong bands at 1556 cm−1 are assigned to the C=C weak stretching vibration and C–H stretching vibration of CH3, respectively. The bands at 2892 and 2307cm−1 are attributed to CH2 splitting. Moreover, on the FTIR analysis, it is found that G-E with organic DS showed a higher spectrum peak with more bonding molecules compared to pure G-E (without DS). 8,20

FTIR spectrum of G-E without and with DS: (a) G-E + 0% filler and (b) G-E + 10% DS. G-E: glass–epoxy; DS: date seed; FTIR: Fourier-transform infrared.
Analysis of mechanical properties
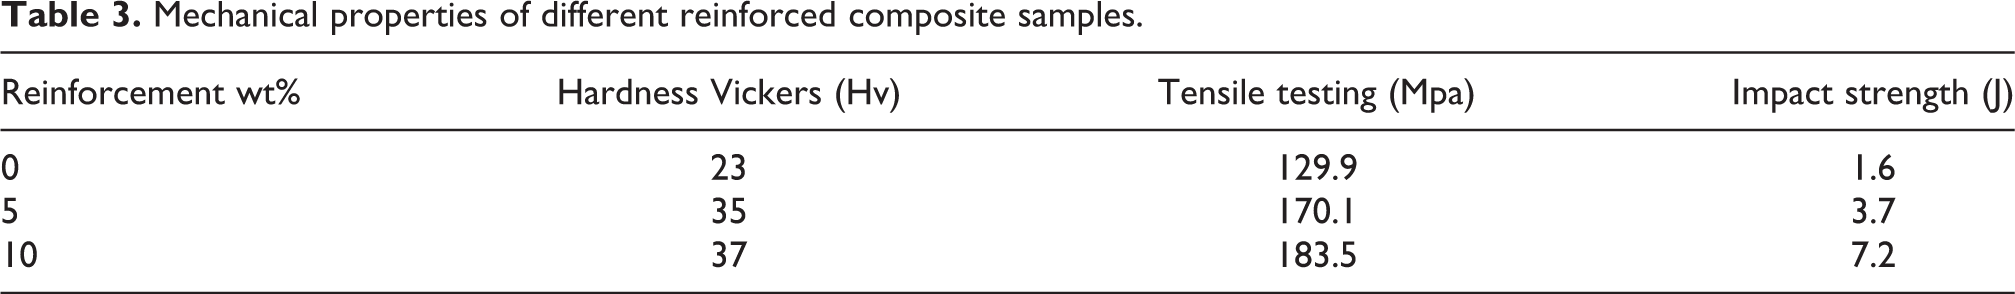
In this work, the mechanical properties of G-E composites with various reinforcement material wt% (0, 5, and 10) were analyzed. The mechanical testing results of the reinforced G-E composites are summarized in Table 3. In this composition, the reinforcement material was uniformly distributed on the matrix material by SAT. The reinforced composites show higher hardness. This is due to the strong interfacial bonding between the matrix and reinforcements of the G-E composites. The hardness increased from 23 N/mm2 for the 0 wt% DS + G-E to 37 N/mm2 for the 10 wt% DS + G-E. The DS reinforcement material acts as a barrier to the movement of dislocations. Due to good bonding, the cracks were avoided in the composite structure, and the composite strength was improved under various conditions. As well, crack deformations are avoided in the reinforced composite structure. The tensile strength increased from 129.9 MPa for the 0 wt% DS + G-E to 183.5 MPa for the 10 wt% DS + G-E. Moreover, with increasing the reinforcement wt%, more impact energy is needed to fracture the specimen, that is, toughness becomes higher. This is because, with increasing reinforcement, the interfacial bonding in the G-E composite becomes stronger. On the contrary, low impact energy would be enough to cause splitting failure of unfilled G-E composites. In general, raising the DS filler content from 5 wt% to 10 wt% leads to a 50–80% increase in toughness. Note that impact strength increased from 1.6 J for the 0 wt% DS + G-E to 7.2 J for the 10 wt% DS + G-E. The addition of DS particles in G-E showed improved strength due to good bonding, the cracks were avoided in the composite structure and toughening mechanisms. 24,25
Mechanical properties of different reinforced composite samples.
Signal-to-noise ratio analysis and results
In our research work, the signal-to-noise ratio (SNR) analysis is used to characterize the wear loss minimization performance. The SNR measure is given by

where yi is the ith measured result in a run or a row and n is the number of measurements in each test trial. SNR values for the optimization iterations are shown in Table 4 (where R: replicate).
Experimental results of wear test of composite material.
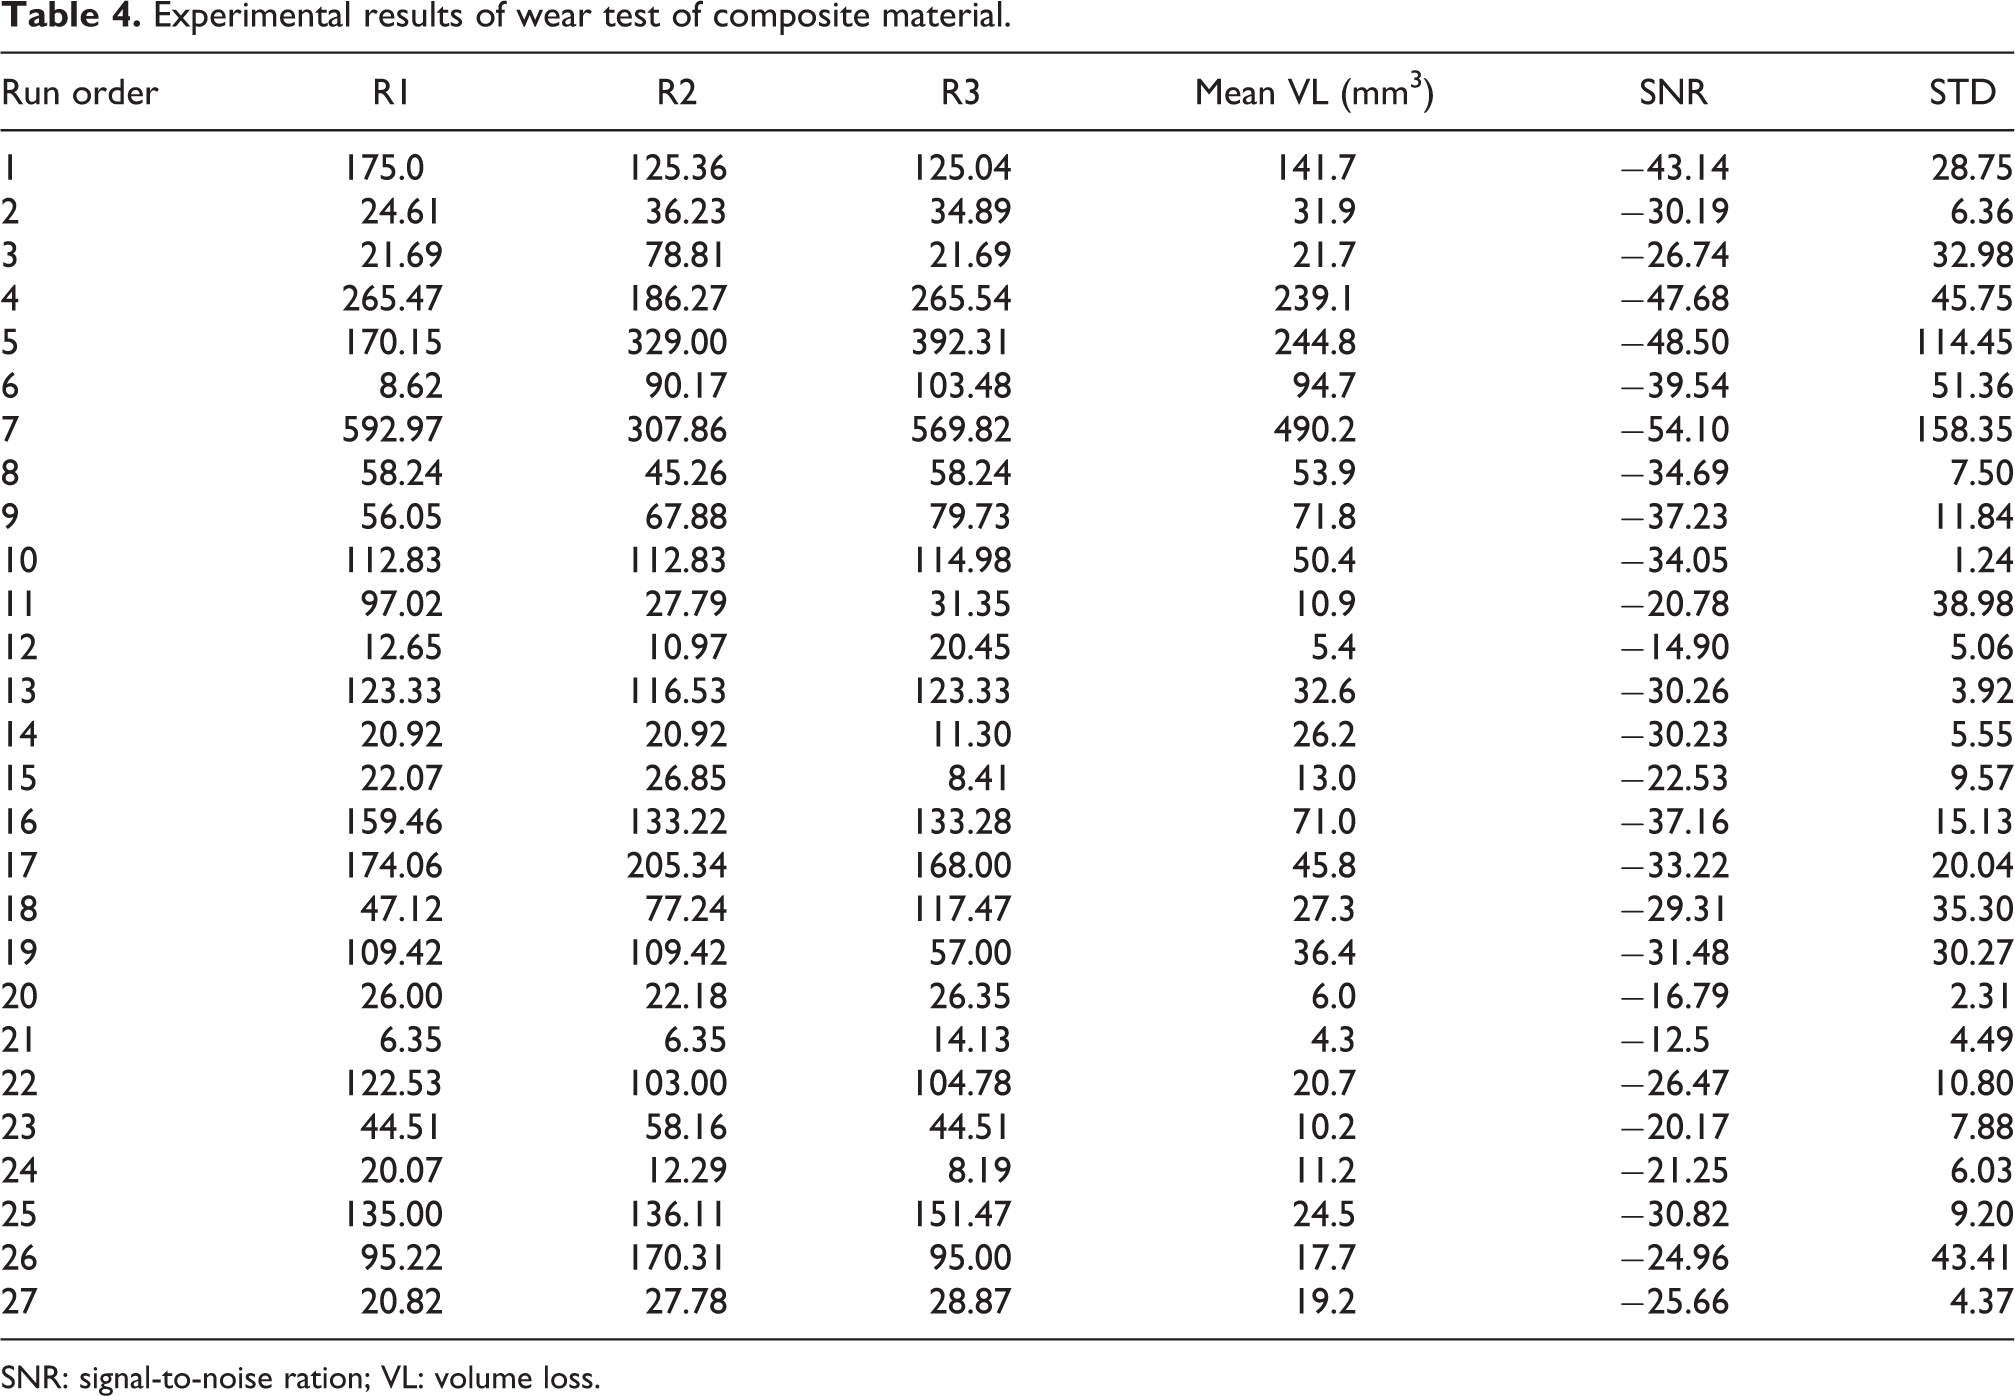
SNR: signal-to-noise ration; VL: volume loss.
Figures 7 and 8 present the influence of the effective parameters, that is, the reinforcement material wt%, the normal load, the abrasive size, and the abrading distance versus the wear VL of the composite. It can be noted that VL decreases with increasing reinforcement material weight and abrasive sizes (a large size means a small number of particles (1200 mesh) per square inch). However, the VL increases with increasing load and abrading distance for all materials. This is due to the penetration of the hard asperities of the counter surface and the wear to the softer pin surface.
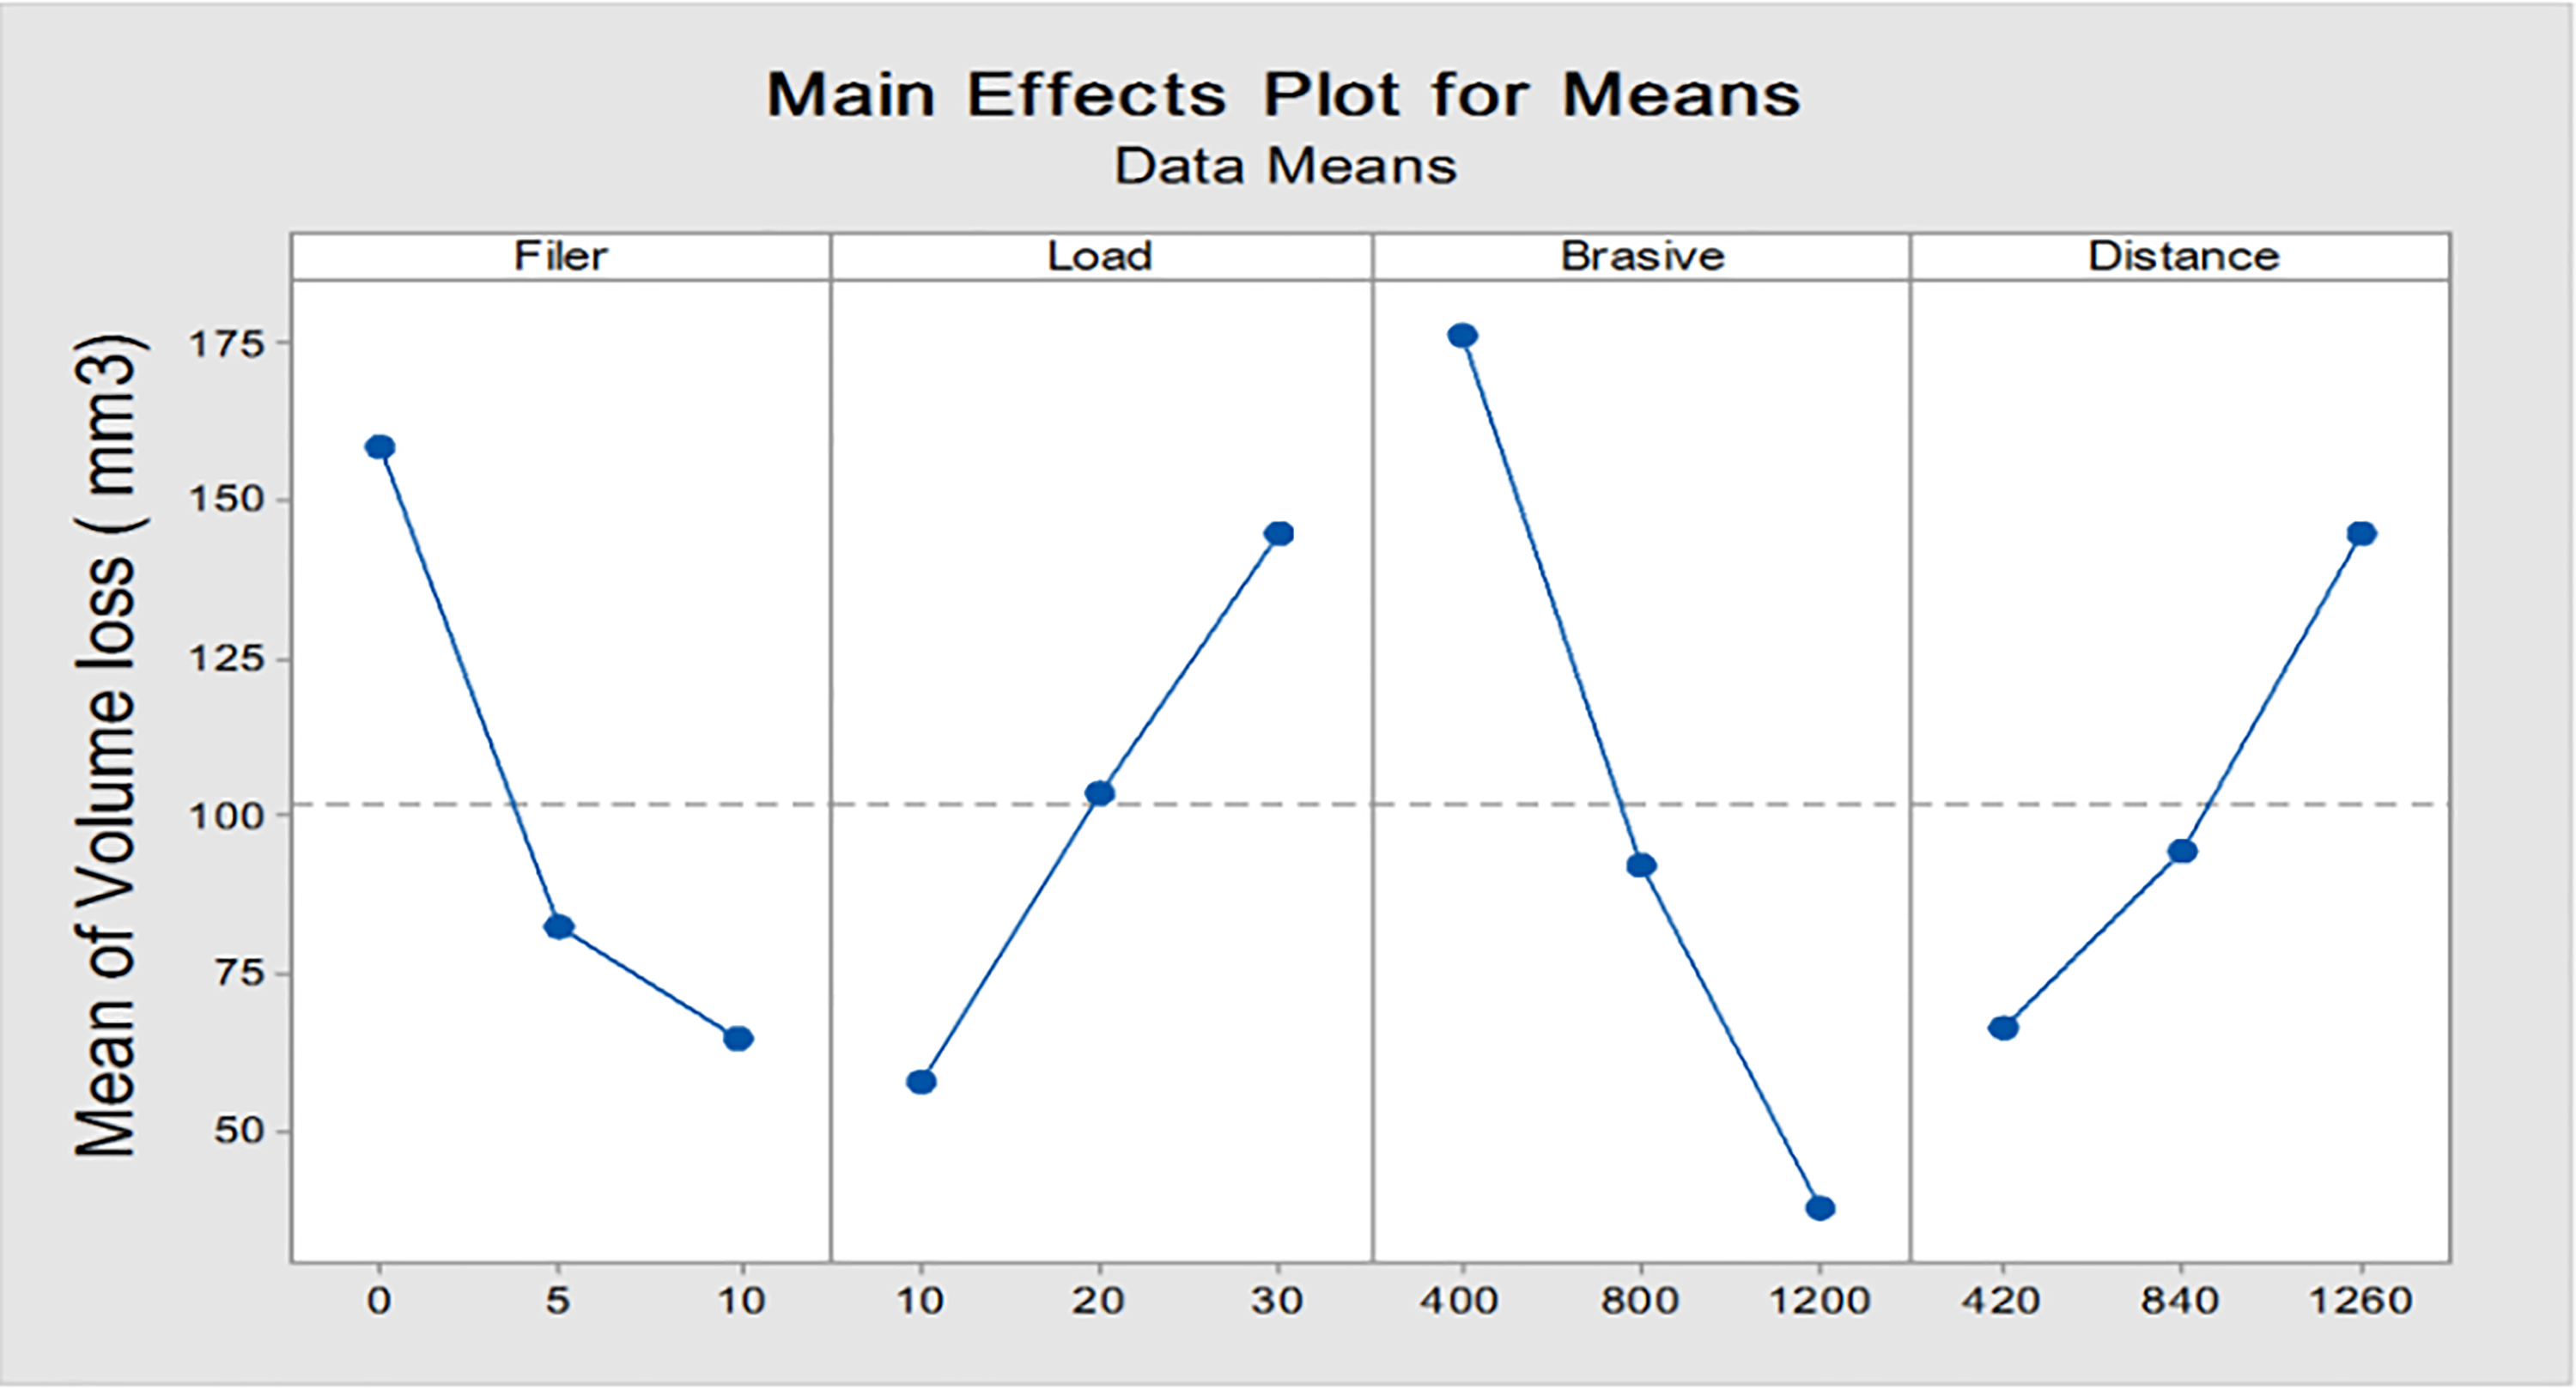
Main effects plot for mean VL at DS reinforced. VL: volume loss; DS: date seed.
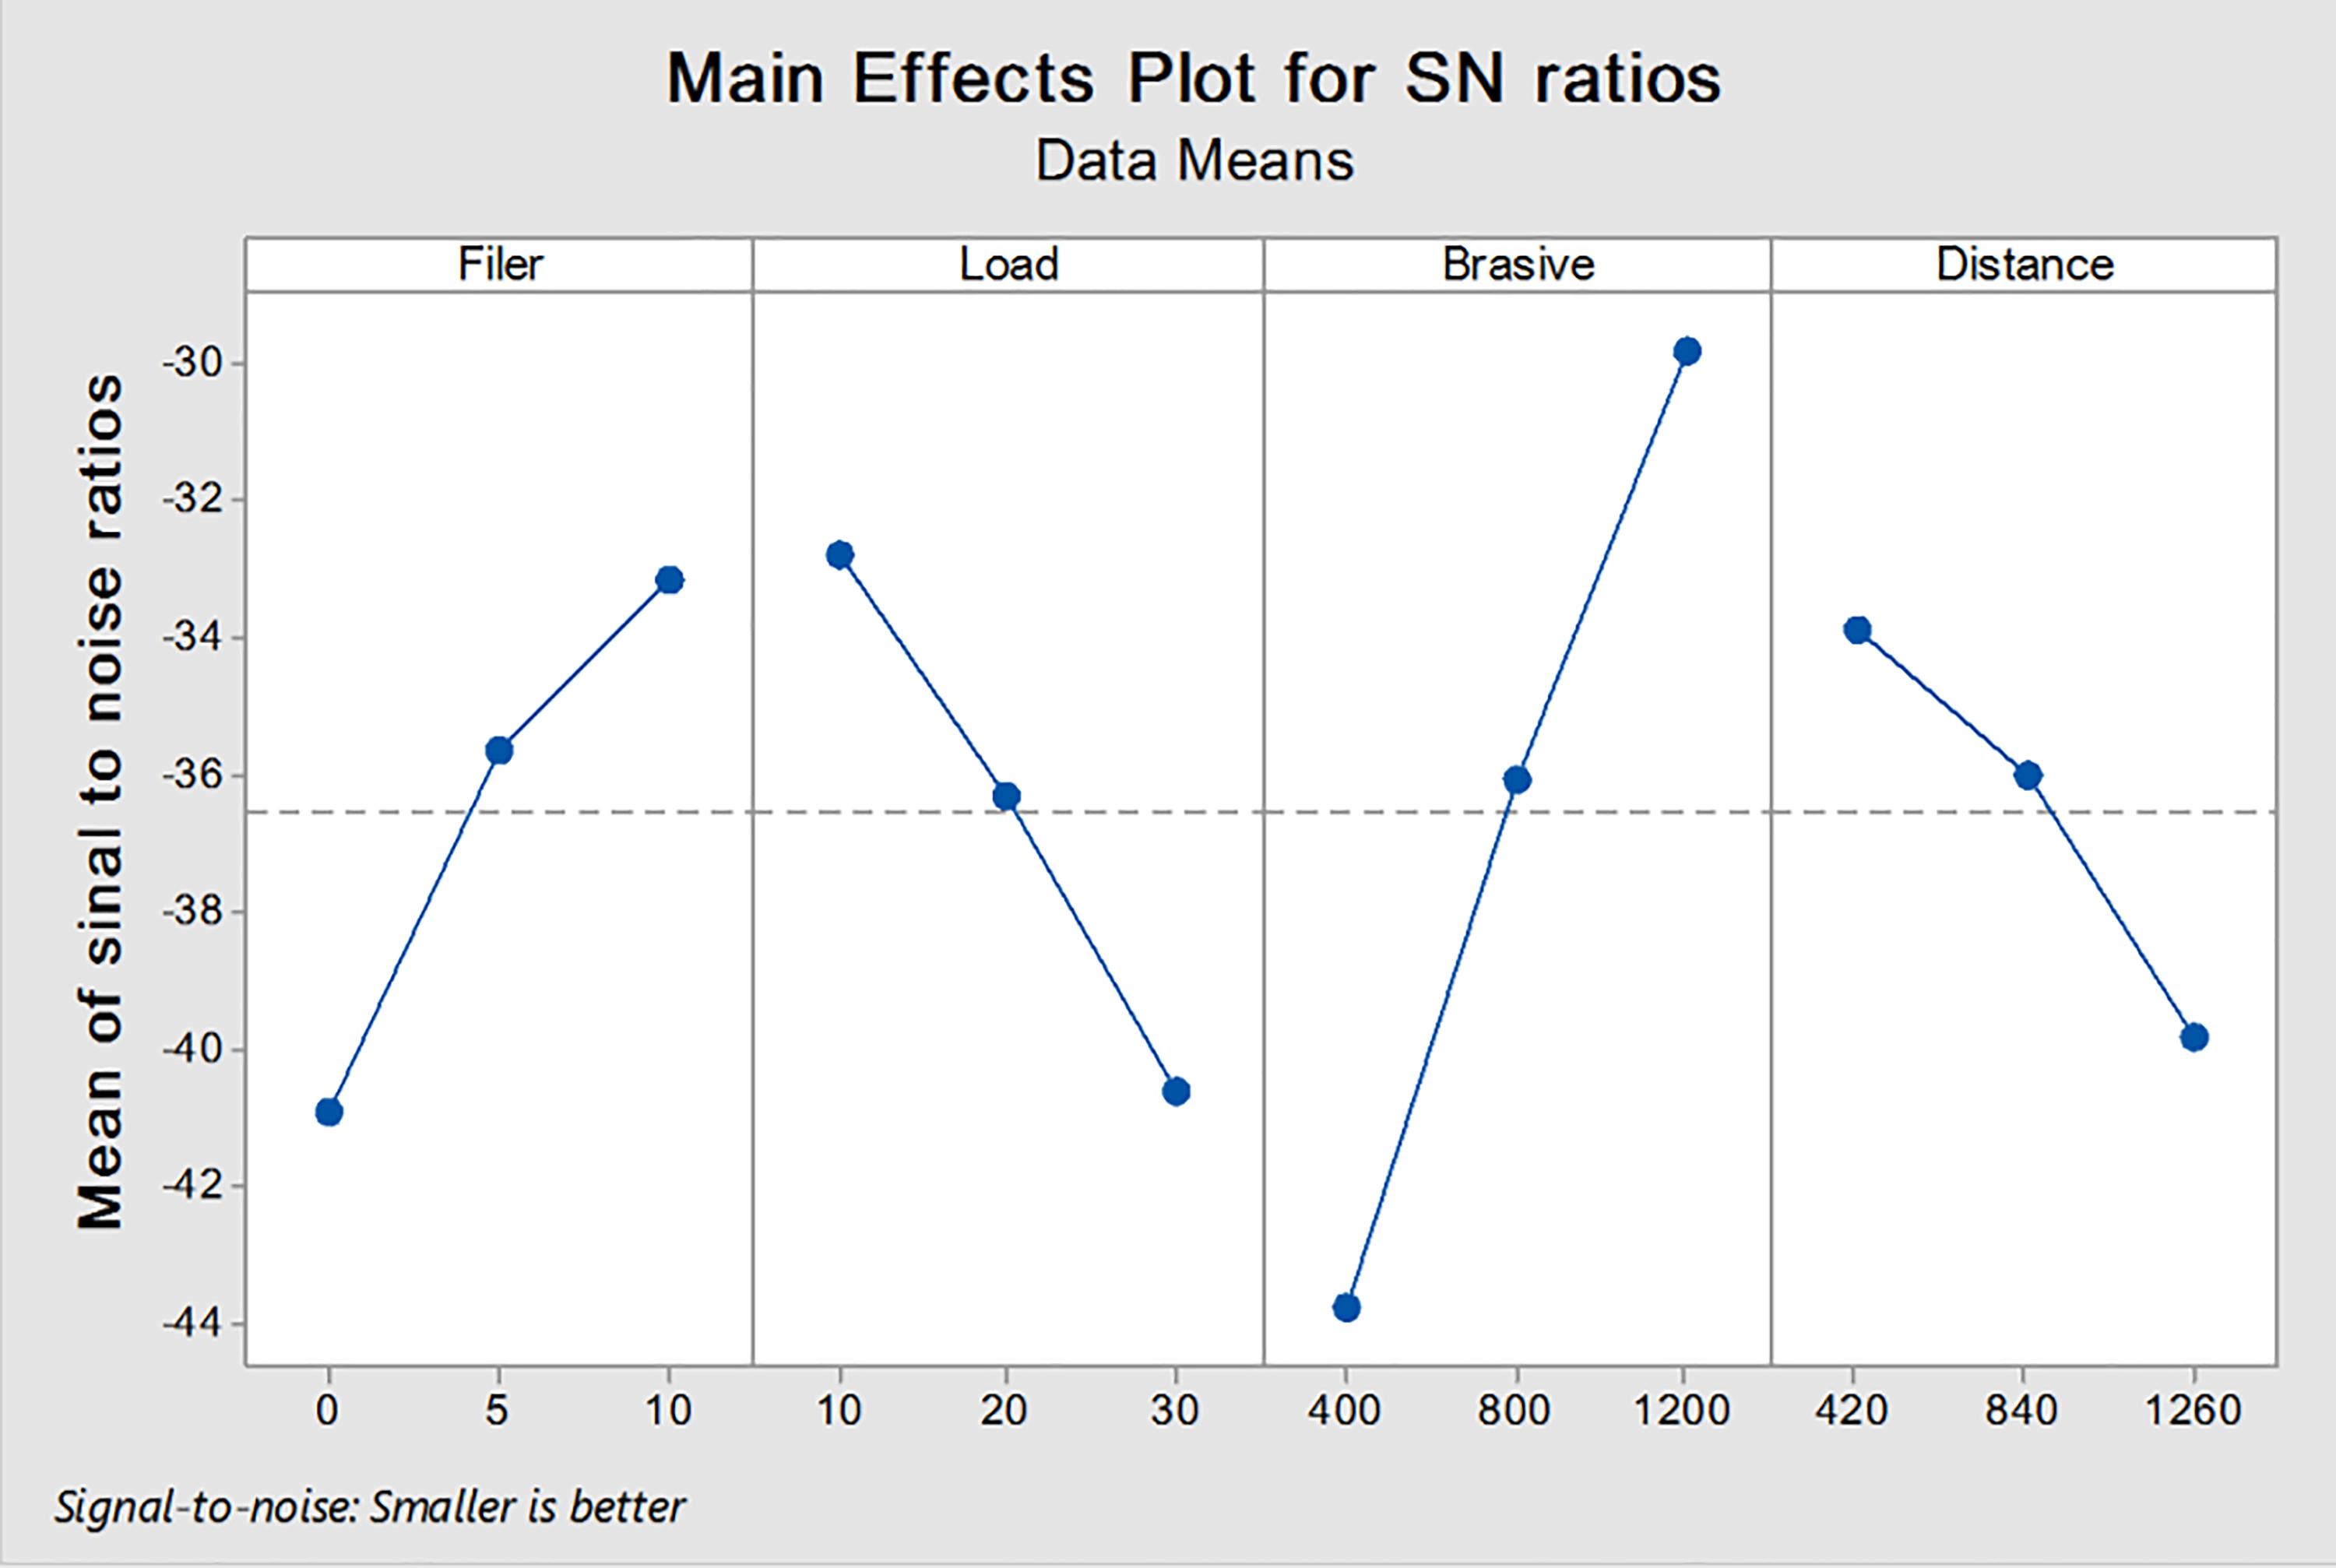
Main effects plot for the signal to noise at DS reinforced. DS: date seed.
Table 5 gives the ranking of the effective parameters that affect the mean VL of the composite: abrasive size, reinforcement material wt%, normal load, and abrading distance. Also, Table 6 ranks the effective parameters that affect the SNRs of the VL: abrasive size, normal load, reinforcement material wt%, and abrading distance. It could be observed that, among these parameters, the abrasive size is a dominant factor in wear resistance of materials.
Response table for means of VL at DS reinforced.

VL: volume loss; DS: date seed.
Response table for signal to noise for VL at DS reinforced.

VL: volume loss; DS: date seed.
Analysis of variance
Analysis of variance (ANOVA) was also applied to find the influence of effective parameters on the quality characteristic. ANOVA was applied for mean in this section. ANOVA can also provide the degrees of freedom, sequential sums of squares, mean square (MS), the F-statistic from the MS, and p value.
Table 7 lists ANOVA results, in which the analysis is considered for a level of significance of 5%, with a 95% confidence level. It can be seen in this table that the column of p value demonstrates which one of the effective parameters is a critical one and has more influence on VL.
ANOVA for mean at DS reinforced.a
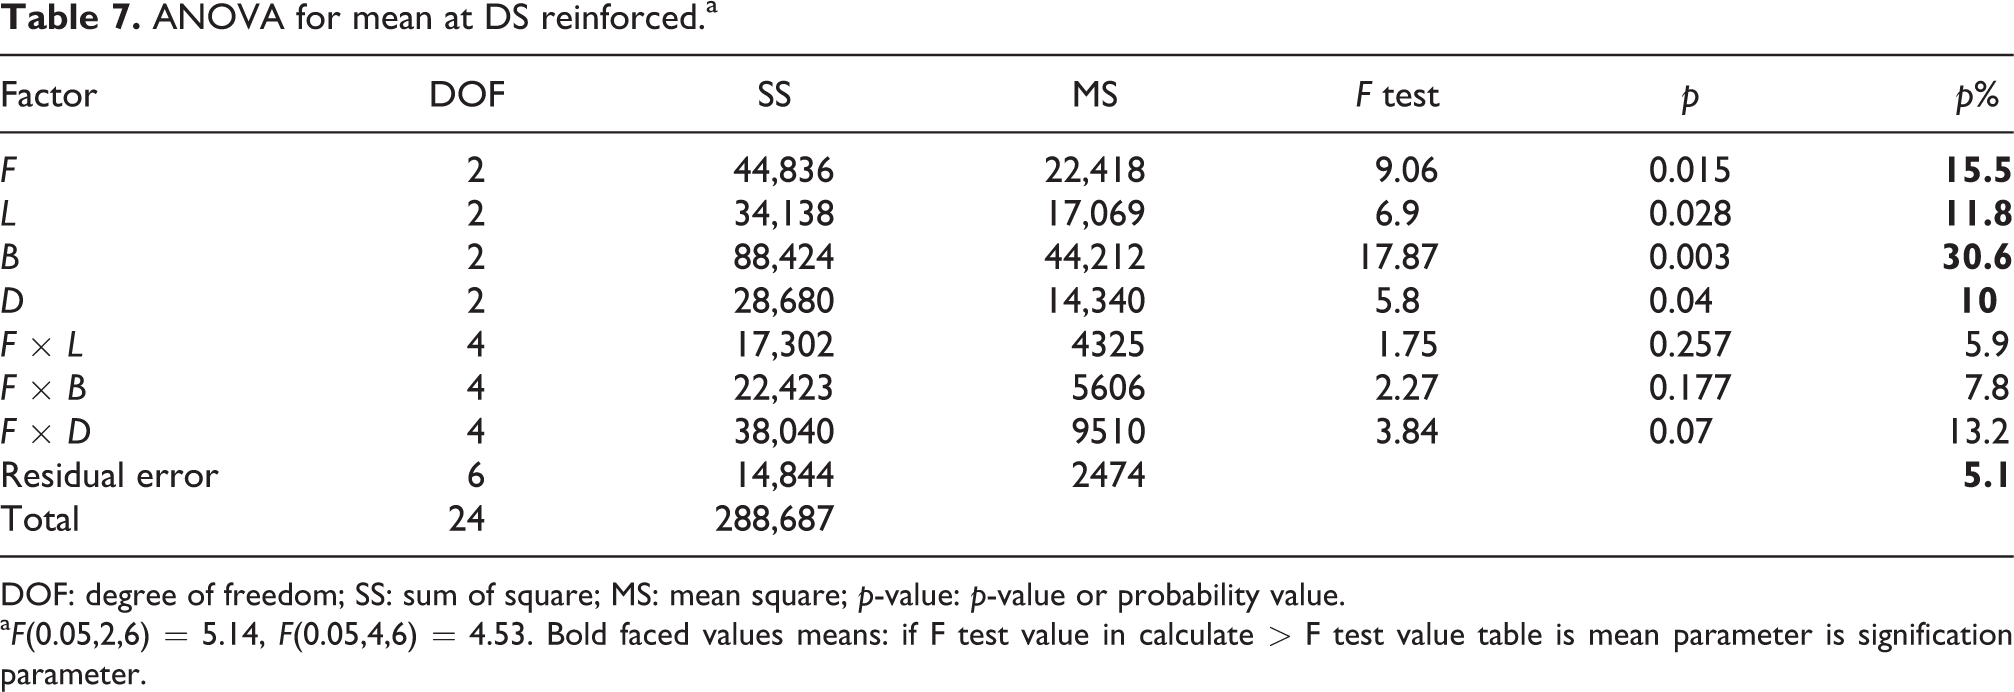
DOF: degree of freedom; SS: sum of square; MS: mean square; p-value: p-value or probability value.
aF(0.05,2,6) = 5.14, F(0.05,4,6) = 4.53. Bold faced values means: if F test value in calculate > F test value table is mean parameter is signification parameter.
The effect of test parameters and their interactions on the wear rate of the composites can be observed from the ANOVA data as shown in Table 6. The last column of Table 6 indicates the percentage contribution of each of the test parameters and their interactions on the composite wear rate.
It should be seen that parameters effect of wear volume loss e.g. (abrasive size, filler Wt.%, normal load, and abrading distance) are the most significant parameters, on other hand, their interactions parameter (e.g. filler interaction abrasive size, filler interaction normal load, and filler and abrading distance), and their contribution is 30.6%, 15.5%, 11.8%, 10%, 5.9%, 7.8%, and 13.2%, respectively. Which confirm that abrasive size is a dominant factor in wear resistance of materials among the other parameters. Further the interactions have least effect on VL as evident from Table 7.
FPA results
FPA has been achieved, which begins with the definition of the objective function and configuration of the population of flowers (n) with random solutions. The best solution in the initial population was computed. A switching probability [p ∈ (0, 1)] is defined. It controls the selection of either local pollination or global pollination. The choice between global pollination and local pollination has been calculated by generating a random number. If this random number in program was lower than the switching probability (p), and global pollination is performed that, local pollination is achieved using the mathematical representation. Equation (4) represents the fitness function for calculating minimum wear using model and constraints. Table 8 showed the comparison between experimental, Taguchi, and FPA values of volume wear.
Comparison of Taguchi result and FPA result of volume wear.

FPA: flower pollination algorithm.
Objective function

Subjected to


Conclusion
Optimization techniques and the effect of DSs as a reinforcement material on the VL of the G-E hybrid composites were explored. From this study, it was possible to conclude the following new findings: DS fillers can be used as a hard and very good reinforcement for wear-resistance G-E composites. Compared with unfilled G-E composites, DS-filled G-E composites with 10% of DS material achieve a wear VL that is lower by 71% and toughness raised by 80%. DS filling does not only reduce the cost but also enhances the mechanical properties of G-E composites. DS reinforcement reduces the wear rate in G-E composites in comparison to the unfilled composites. The DS filler material significantly improves the composite hardness, impact toughness, and tensile strength. The tensile strength increased from 129.9 MPa for the 0 wt% DS + G-E to 183.5 MPa for the 10 wt% DS + G-E. The rank of the effective parameters according to the effect on the mean VL of the composite is abrasive size, reinforcement material wt%, normal load, and abrading distance. The significant factors are the abrasive size, reinforcement material wt%, normal load, and abrading distance. The contributions of these factors are 30.6%, 15.5%, 11.8%, and 10%, respectively. Genetic algorithms (the FPA) and Taguchi’s methods investigate the optimal parameters of the DS-reinforced composite, for example, loading at 10%, an abrasive size of 1200 grit size, an applied load of 10 N, and an abrading distance of 420 m. A general quadratic model was developed to explain the relationship between VL and process parameters.
Footnotes
Declaration of conflicting interests
The author(s) declared no potential conflicts of interest with respect to the research, authorship, and/or publication of this article.
Funding
The author(s) received no financial support for the research, authorship, and/or publication of this article.