
Abstract
The phase morphology in thermoplastic (TP)/thermoset (TS) blends system plays a critical role in the improvement of composites toughness. In this article, the modified viscoelastic model coupling with the thermodynamic model was established to describe the dynamic process of polymerization-induced phase separation in TP/TS blends system, in which the effects of TS curing reactions, the chain-length asymmetry, and molecular dynamic asymmetry between TP and TS were considered. Based on developed model, simulations were implemented to study phase morphology formation in phenolphthalein poly(ether ether ketone) (PEK-C)/epoxy blends system, and the influences of different factors, including initial PEK-C volume fraction, bulk modulus of PEK-C resin, curing reaction of epoxy resin, and curing temperature, on the phase separation behavior were investigated. Also, the experiments were carried out to verify the simulation results. The results revealed that there was an induction period before phase separation started; afterward, the bi-continuous structure appeared in mixtures, in which small concentration differences existed between two phases. As the initial PEK-C concentration increased, the final phase morphology experienced a gradual transition from the islands-sea structure to the bi-continuous structure, and finally formed the phase-inverted structure. Moreover, it was found that the phase morphology evolution was influenced by viscoelastic effect of polymer molecules. As the bulk modulus of PEK-C increases, the blends system tended to organize into a bi-continuous structure and the phase-inverted morphology at a lower initial content of PEK-C.
Keywords
Introduction
The thermoset (TS) resin composites have been widely used in industrial fields due to the good mechanical properties and high fatigue resistance. The cross-linked TS resin composites are generally brittle, and the incorporation of thermoplastic (TP) resin is an effective way to improve their fracture toughness, 1 –3 in which the phase-separated structures in the mixtures play a pivotal role in affecting the toughness of composite, both the plastic deformation of TP-rich phase and the brittle fracture breakage of TS-rich phase can absorb large amount of impact energy.
The two-phase structure in the TP/TS blends system is formed via polymerization-induced phase separation (PIPS) process. That is, the initial TP/TS mixtures are in the homogeneous state, with the polymerizations occurring, the blends system enters into an incompatibility state and the driving force of phase separation increases, the decomposition takes place. As the curing goes on, the phase morphology will finally be fixed by the high cross-linked structures of TS resin. The experimental studies showed that the final phase morphology of the TP/TS blends was depended on various factors, such as the initial TP resin concentration, 4 resin molecular structure, 5 –8 the curing temperature, 9 –12 and the molecular dynamic asymmetry of the two components. 13 –16
Comparing with lots of work reported on the simulations of thermal-induced phase separation process in polymer solutions, the literatures revealed very little information concerning the mathematical predictions of PIPS behavior in the TP/TS blends system. 17 –21 Nauman and others numerically studied a ternary system consisting of styrene monomer, polystyrene, and polybutadiene using the Cahn–Hilliard model. To account for the styrene polymerization kinetics, a reaction term was added into the Cahn–Hilliard model. Moreover, they proposed a proportional flux method to force a material balance at a given point, and thus the material balance violation at the interface boundary could be avoided. 20 Yandek and Kyu simulated the phase morphology evolution process of the reactive liquid rubber (R45EPI)/diglycidyl ether of bisphenol A (DGEBA)/methylene dianiline (MDA) blend system, in which two different networks were formed, one was the curing product of DGEBA and MDA and the other one was the copolymer of R45EPI and DGEBA. The network elasticity energy contributed by the network-forming components was considered in the thermodynamic modeling, and the results showed that the network elasticity energy could increase the area of components coexistence. 21
The dynamics for different components are assumed to be same in the previous simulation works. However, there are basically significant differences between TP resin and TS resin in the molecular length and glass transition temperature. Thus, molecular dynamics, such as the relaxation and the diffusion of molecular chains, are asymmetric between different components in TP/TS mixtures, which can cause the morphology evolution exhibiting unusual features such as volume shrinking and phase-inverted morphology. 22,23 In addition, few attentions in the mathematical modeling have been given to the growth in molecular length of curing species caused by the curing reaction.
In this article, the numerical models, coupling the thermodynamic model considering curing reactions of TS resin and the dynamic model considering chain-length asymmetry and internal dynamic asymmetry between TS resin and TP resin, are developed. Then, based on the proposed models, the two-phase structure formation mechanism in commonly used phenolphthalein poly(ether ether ketone) (PEK-C)/epoxy blends system is studied. Simulations are conducted to clarify the influence of various factors including the initial PEK-C content, the bulk modulus of PEK-C, the curing reaction of epoxy resin, and the curing temperature on the phase morphology evolution.
Mathematical models
Thermodynamic model
In general, the thermodynamic state of binary mixtures decides whether phase-separated structure is presented. The free energy of TP/TS blends system changes with the curing reactions, which makes the blends system experiencing from the thermodynamic compatible state to the thermodynamic incompatible state. The free energy of mixtures consists of the mixing free energy and the interface energy between two phases, which is given by

where F is the free energy of mixtures, and fm and fs are the mixing free energy and the interface energy between two phases, respectively. V is the volume of the considered body. K B is the Boltzmann’s constant, C 0 represents the interfacial energy coefficient, and T denotes the absolute temperature of the system. ϕ 1 and ϕ 2 are the volume fractions of TP and TS resin, respectively, and the volume is assumed to be incompressible, thus ϕ 1 + ϕ 2 = 1. χ is the Flory–Huggins interaction parameter between TP and TS resin, and Np and Ns represent the number-averaged chain lengths of TP and TS resin, respectively. Obviously, the ratio of Np to Ns can reflect the chain-length asymmetry between TP and TS resin. When the stepwise polymerizations occur in the TS resin, the number-averaged chain lengths of TS resin Ns changes with the curing time, and it can be described by the Carothers equation, in which the close relationship between Ns and the resin conversions is established
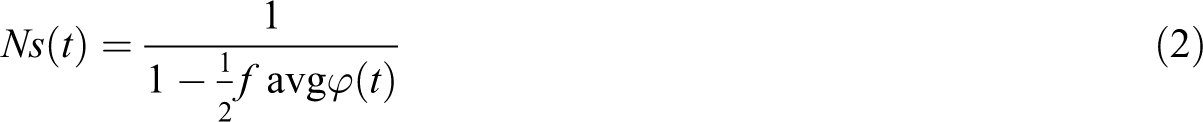
where f avg is the averaged functionalities of epoxy monomers; φ(t) is the curing degree of the TS resin, it is generally calculated by the nth kinetic model or the autocatalytic model

where m and n represent the reaction orders. k, k 1, and k 2 are the curing rate constants.
It is well known that in the thermodynamic analysis, the construction of the phase diagram requires the determination of the chemical potentials, which is defined as taking the partial derivatives of the free energy of mixtures with respect to the volume fraction of each component

where μi represents the chemical potential of component i. Component 1 represents the TP resin while component 2 denotes TS resin. With the time increasing, the blend system is separated into TP-rich phase (α phase) and TS-rich phase (β phase). The component concentrations in the α phase and the β phase at the equilibrium state can be obtained based on the condition that the chemical potential of each component must be equivalent

In each existing phases, the volume fraction of the components should also satisfy the following relationship:

Viscoelastic phase separation model
In general, the volume fraction of TP resin ϕ 1 should satisfy the continuity equation, such that

where

According to the linear friction law,

where M(ϕ
1) is the mobility coefficient, and A
1 is the bulk modulus, which describes the ease or complexity of the TP polymer chain deformations. A
1 is proportional to the volume fraction of TP resin ϕ
1, the bulk modulus in the TP-rich phase is greater than in the TS-rich phase, then the dynamic asymmetry characteristic is described by the bulk modulus A
1.

where τ is the relaxation time. A denotes the strain rate, and
By substituting equation (9) into equation (8), the viscoelastic phase separation model is obtained

Comparing with the well-known two-fluid model developed by Tanaka and coworkers, the modified viscoelastic model has advantages in satisfying the energy dissipation relation, which can provide a better numerical stability.
24
It can be seen that the dynamic process of phase separation in TP/TS mixtures is influenced not only by the chemical potential gradients but also the gradient of viscoelastic stress
Experimental
Materials
The phase separation behavior of the commonly used PEK-C/DGEBA/4,4-diamino diphenyl sulfone (DDS) blend system is studied in this article. The TP resin PEK-C (Xuzhou Engineering Plastics Company, China) is used as a modifier to toughen the epoxy resin. The matrix epoxy resin is composed of DGEBA (Shanghai Huayi Resin Company, China) with the epoxy value of 0.51 and a DDS (Shanghai Huayi Resin Company) cure agent with an amino hydrogen equivalent weight of 62 g.
Experimental procedures
Firstly, the DGEBA resin is preheated to 180°C in the oil bath, and the PEK-C resins are dissolved in the matrix resin by heating and mechanical stirring. Then by the further stirring in the isothermal oil bath at 120°C, the powdered DDS with 30 phr is dissolved in blends. The homogeneous mixtures with various volume fraction PEK-C compositions (7 vol.%, 10 vol.%, and 18 vol.%) are prepared. And the curing stage of PEK-C/DGEBA/DDS blends system is observed by optical microscopy (OM) at the temperature of 180°C.
Results and discussions
It should be noticed that the parameters in the equations are presented in the form of dimensionless type. According to the experimental results in the literature, 25,26 the phase-separated TP-rich domains were distributed in the micrometer level, while the elastic modulus of PEK-C polymer was measured in the GPa level; consequently, the characteristic value of length, modulus, and time are taken as 10−6 m, 109 Pa, and 1 s, respectively. Combined with the characteristic value, the dimensionless parameters are defined as follows: K B T = 1.1, χ = 0.82, m = 0.97, n = 2.42, M = 10, Np = 30, k 1 = 3.6 × 10⁻⁴, k 2 = 3 × 10⁻³, C 0 = 1, f avg = 2, A 1 = 6ϕ 1, τ = 10. 24,27 The initial volume fraction field is generated by a random function, and the random fluctuation is set as ±0.001. In addition, the periodic boundary condition is adopted.
The geometrical model is constructed with the dimension of 128 × 128 and meshed with triangular elements. The coupled mathematical models are solved by the finite element method. As shown in the study by Chen and Chang, 28 when the curing degree of DGEBA/DDS arrived at 0.62, the phase morphology of poly(-caprolactone)/DGEBA/DDS blends system would be invariable due to the high cross-linked structures. Consequently, the termination condition of the simulations is whether that the curing degree reaches up to 0.62 in this article.
Influence of initial PEK-C volume fraction on phase morphologies
The OM photographs in Figure 1 show the final phase morphology of the mixtures, in which the dark-colored region represents the polymer-rich phase while the light-colored represents the epoxy-rich phase. It is observed that the blends show a typical sea-island structure with the discrete PEK-C-rich phase distributing randomly in the continuous epoxy matrix when the initial PEK-C volume fraction
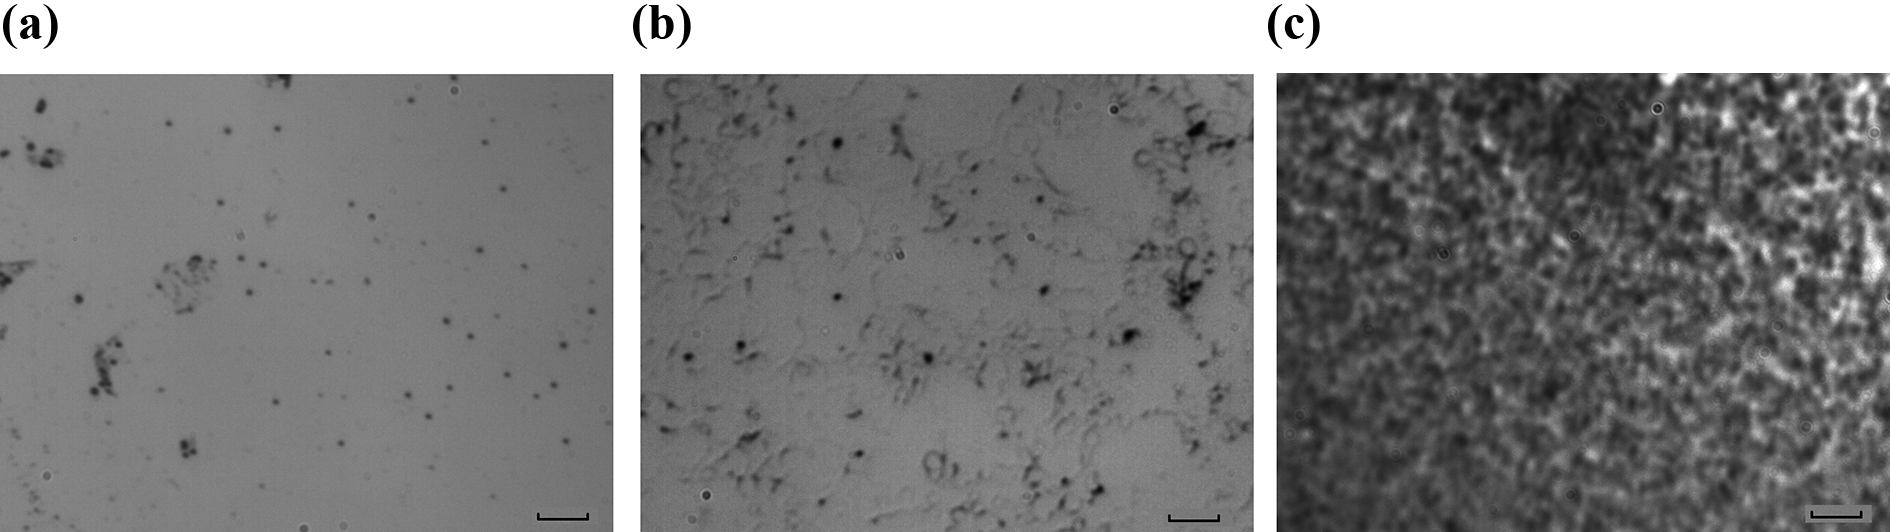
OM photographs of phase morphologies with various initial PEK-C volume fraction: (a) initial PEK-C volume fraction with 7 vol.%, (b) initial PEK-C volume fraction with 10 vol.%, and (c) initial PEK-C volume fraction with 18 vol.%. The length of short bar is 10 μm.
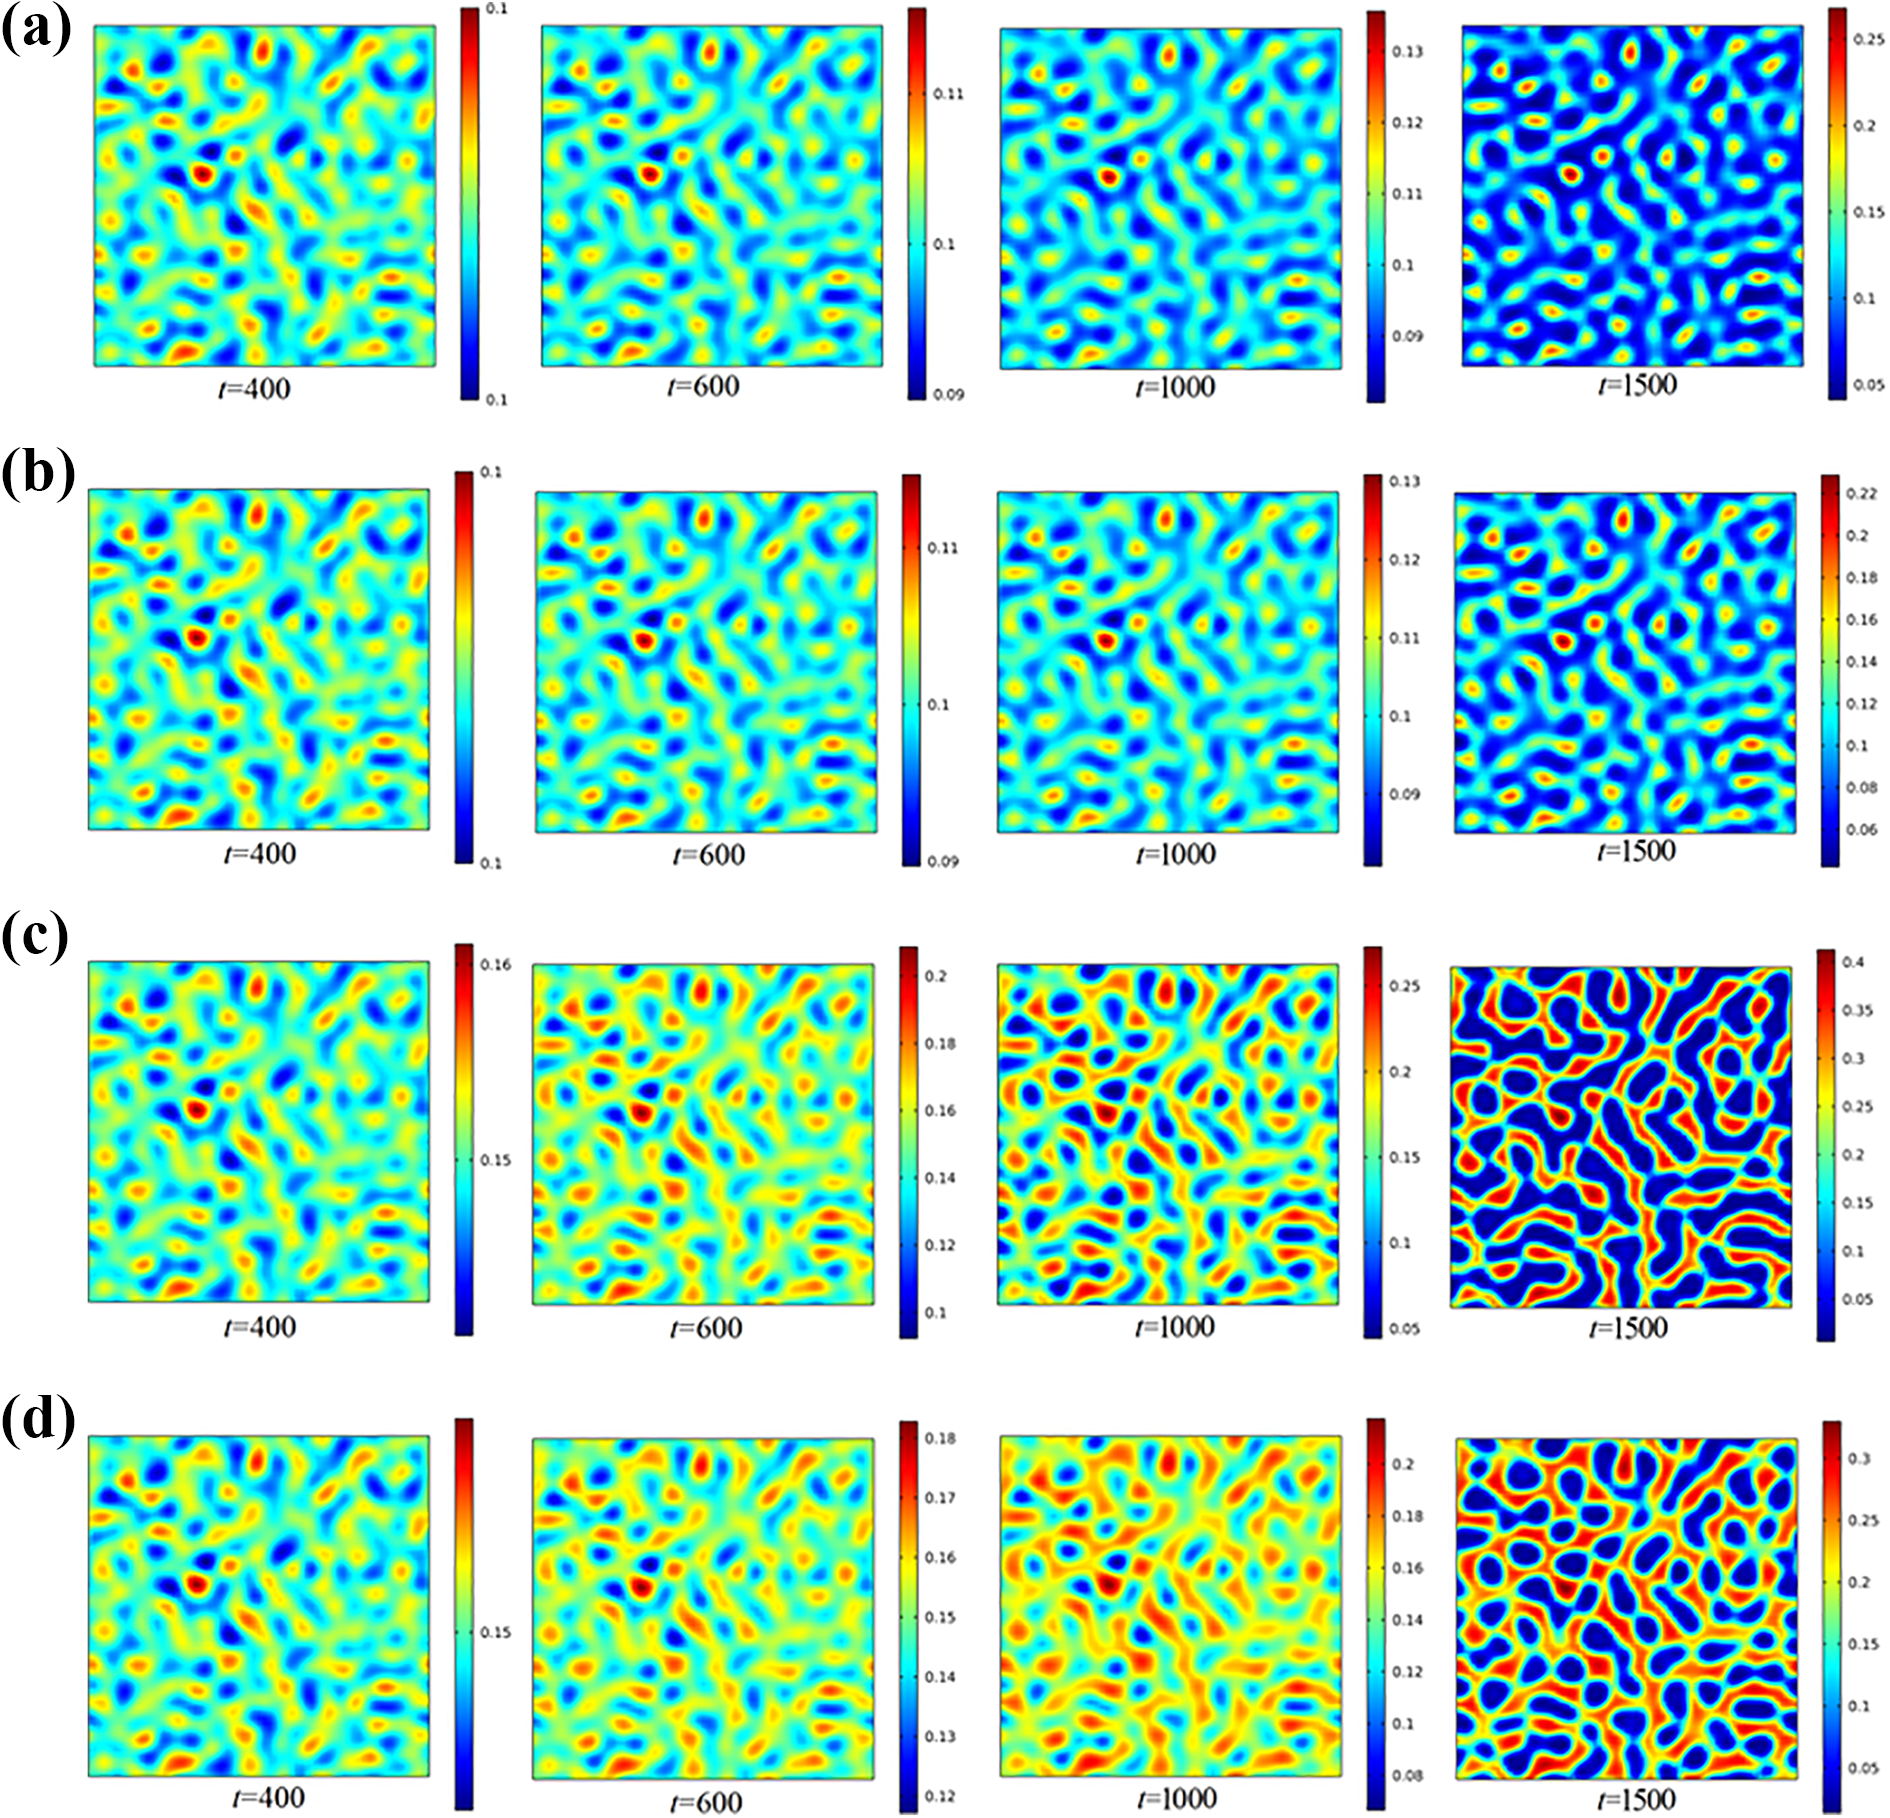
A series of simulations with initial PEK-C volume fraction ranging from 10 to 25 vol.% are carried out at 180°C, with all other parameters held constant. Figure 2 is an illustration of phase morphologies evolution process, in which the cold-colored region represents the TS-rich phase, and the warm-colored region represents the TP-rich phase. It is observed that when the initial PEK-C volume fraction is 0.1, an induction period exists before the phase separation started in the early stage of phase separation, it is because the curing degree is small, then the blends system is in the thermodynamic stable state and the homogeneous phase is presented. As the curing time goes on, the driving force of phase separation increases and the nonuniform concentration distribution across the mixtures is obvious, the bi-continuous phase appears in the blend system, it indicates that the phase separation behavior follows the spinodal decomposition mechanism. In the later stage of phase separation, the PEK-C-rich continuous phase will be broken by the continual growth of epoxy-rich phase, and the final phase morphology is in the form of sea (epoxy-rich phase)-island (PEK-C-rich phase) structure, as shown in Figure 2(a). As the initial volume fraction of PEK-C increases to 0.15, the phase decomposition process takes place in the same manner as that in the blends system with initial PEK-C volume fraction being 0.1, the only difference is that the deformation and mobility of PEK-C-rich network phase become more difficult because of the greater bulk modulus, then the bi-continuous structure is shown in the mixtures. The morphology of cured blend system gradually transits to the phase-inverted structures at higher PEK-C volume fraction (

Simulation results of phase morphologies evolution process with different initial volume PEK-C fraction (the color length: volume fraction of PEK-C): (a) initial PEK-C volume fraction with 10 vol.% (
It is obvious that the model predictions of morphology characteristic with respect to the initial PEK-C volume fraction is consistent with experimental results, that is, with the initial PEK-C concentrations increasing, the phase morphology of the blend system would experience a gradual transition from islands-sea structure (PEK-C-islands, epoxy-sea) to the bi-continuous structure, and finally formed the phase-inverted structure. However, the results also show that the initial PEK-C concentration corresponding to the different phase-separated structure types of the model predictions is a little higher than that of experimental data. It is mainly caused by the fact that the chain length of PEK-C is defined as 30 in the simulations, which is smaller than the actual value. With longer chain lengths of PEK-C, both the binodal curve and the spinodal curve in the static phase diagram will shift to the low PEK-C concentration region obviously (Figure 3); however, the smaller concentration at equilibrium state makes the numerical simulations being more instable due to the logarithmic term in the Flory–Huggins free energy. 20

Phase diagrams with different chain length of TP resin: (a) NP = 1, (b) NP = 8, and (c) NP = 30.
Influence of bulk modulus on phase morphologies
As referred above, the bulk modulus provides the information about the deformation difficulty associated with molecules. The influence of bulk modulus on the morphology evolution is investigated in this section; the simulation systems are modeled with the same PEK-C initial concentration and various bulk modulus.
The results in Figures 2 and 4 indicate that the increase of bulk modulus causes the formation of various morphologies from sea-island structure to bi-continuous structure for the case of low content of PEK-C (10 vol.%). The mixture shows a bi-continuous structure with the smaller bulk modulus for the system with 15 vol.% initial PEK-C content, and finally the phase-inverted structure will occur when the bulk modulus rises up to 10ϕ 1. As a result, the increase of bulk modulus can shift the morphology toward the bi-continuous structure or phase-inverted structure even for a low initial content of PEK-C. These observations can be explained as follows: when the bulk modulus of TP polymer is greater, both the deformation and breakage of TP-rich phase are more difficult, then the TP-rich domain is more likely to form the continuous phase. In a word, the final phase morphology of PEK-C/epoxy blends is not only depended on the thermodynamic compatibility conditions but also influenced by the dynamic conditions of the components.
Effect of bulk modulus on phase morphologies evolution process: (a)
It is also worth noting that the epoxy-rich phase and the PEK-C-rich phase have little difference in the PEK-C concentration distribution in the early stage of phase separation, and thus the viscoelastic stress gradient is small. As a consequence, the phase morphology shows little change with different bulk modulus. However, with the phase separation process undergoing, the PEK-C concentration gradient in the mixtures increases, then the extra viscoelastic stress gradient plays a more important role in the morphology evolution process.
Influence of curing reaction on phase morphologies
The curing reaction causes the increase of chain lengths for the epoxy resin (Ns ), which in turn influences the phase separation process and final phase structure. Based on the assumption that the interaction parameter χ is constant during the curing reactions, with a greater Ns , the mixing free energy density f m is larger, which makes the mixture being more incompatible. The phase diagram with respect to N s can be seen in Figure 5; with the growth of N s, the interaction parameter χc corresponding to the critical solution point decreases, and the concentration range accounting for two-phase structure is expanded.
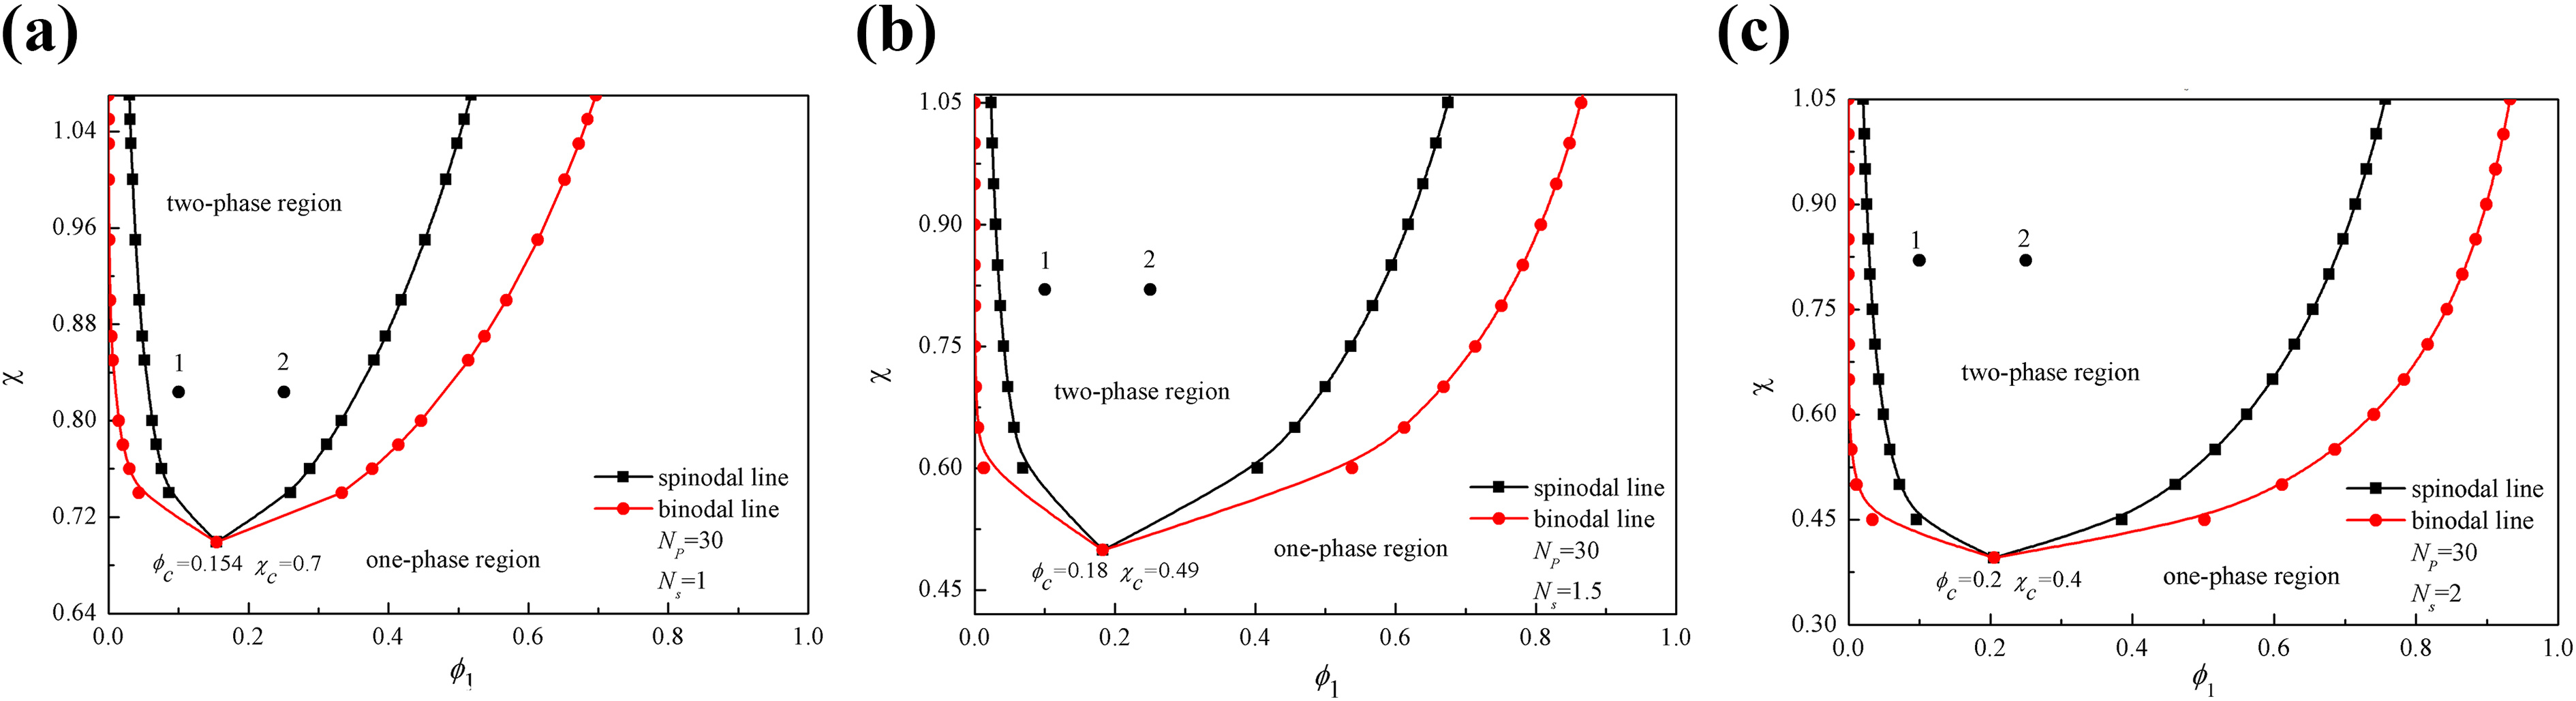
Phase diagrams with different chain length of epoxy resin: (a) Ns = 1, (b) Ns = 1.5, and (c) Ns = 2.
Ignoring the curing reaction of TS resin, N s is deemed as a constant with the value of 1, and two cases with different initial volume fractions of PEK-C polymer are studied. Figure 6 shows the phase evolution process over time during curing. It is observed that there is not any phase-separated structure in the blends regardless of the initial volume fraction of PEK-C. It is because that when the initial volume fraction of TP resin is located closer to boundaries of the spinodal decomposition region (Figure 5(a)), then the mixture is closer to the metastable state, the driving force of phase separation becomes smaller and the lag time before the decomposition decreases with N s.

Evolution process of phase morphologies when ignoring epoxy resin curing reaction: (a)
Influence of curing temperature on phase morphologies
The influences of curing temperature on the phase separation process are as follows: on the one hand, the curing rate is accelerated with the increasing temperature, and then the duration time of phase separation process will be reduced at the higher temperature; on the other hand, the PEK-C/DGEBA/DDS mixture belongs to lower critical solution temperature system, and the Flory–Huggins interaction parameter χ is proportional to curing temperature, then the driving force of phase separation increases with temperature in terms of thermodynamics, and that makes the phase separation process being expedited at the higher temperature.
In this section, the simulations are implemented at curing temperatures of 170°C and 190°C, respectively, and the parameters concerning the curing kinetic and interaction parameter χ should be updated accordingly. The results are illustrated in Figure 7 for 15 and 25 vol.% PEK-C in the initial mixture, it can be seen that in the commonly-used curing temperature range for the DGEBA/DDS resin, the mechanism of phase separation of blends system hardly alters with curing temperature, while the phase size changes. It is also well understood that if the temperature is too low to make the corresponding χ less than χc at the critical solution point, the mixture will enter into a homogeneous state (Figure 5), and the phase separation process may not exist.

Effect of curing temperature on phase morphologies evolution process: (a)
Conclusions
In this study, the models were developed to investigate the mechanism of PIPS process in TP/TS blends system. Based on this model, we studied phase morphology evolution process in the PEK-C/DGEBA/DDS blends system, and the comparisons between the numerical results with the experimental data confirmed the feasibility of numerical method. The major conclusions were drawn as follows: The phase separation in the mixtures followed the spinodal decomposition mechanism. The final phase morphology of the cured epoxy/PEK-C exhibited island (PEK-C)-sea (epoxy) structure at the relatively low initial PEK-C concentration, and with the increase of initial PEK-C volume fraction, the phase morphology would gradually transform to the bi-continuous structure, and finally to the phase-inverted structure. The network structure of the minority slow-polymer-rich phase could be formed in the phase separation process. By further increasing the bulk modulus of PEK-C, the bi-continuous structure and the phase-inverted structure could be obtained with less content of PEK-C. With the curing reaction going on, the driving force of phase separation enhances and the lag time before the decomposition decreased. The curing reaction was the critical factor for the appearance of separated structure in the PEK-C/epoxy blends system. The final phase morphology was the coupling result of curing reaction kinetics and phase separation dynamics, and in the commonly used curing temperature range for the DGEBA/DDS resin, the alternation of curing temperature only affected the phase size, without affecting the characteristic of phase structure.
Footnotes
Declaration of conflicting interests
The author(s) declared no potential conflicts of interest with respect to the research, authorship, and/or publication of this article.
Funding
The author(s) disclosed receipt of the following financial support for the research, authorship, and/or publication of this article: This work was supported by Doctoral Scientific Foundation of University of Jinan [XBS1533] and Natural Science Foundation of Shandong Province [ZR2014EMQ014].