
Abstract
In this article, the effectiveness of the co-mixing processing technique and surface modification of zinc oxide (ZnO) filler on the characteristics of the developed high-density polyethylene (HDPE)/ZnO was investigated. ZnO was treated and co-mixed with stearic acid (SA) at a ratio of 50/50 wt% using kitchen coffee grinder and the mixture was then added to the HDPE matrix in a Brabender plastograph with various ZnO contents of 0.5, 1 and 2 wt%. The morphology of the nanocomposites was characterized using scanning electron microscopy (SEM). The micrographs showed well and uniform dispersion of both treated and untreated ZnO nanofiller; however, the treated ZnO particles showed better dispersion. The nanocomposite containing 1 wt% ZnO nanoparticles was found to have the optimal properties. The results of the SEM were supported by the atomic force microscopic technique. The uniform dispersion of ZnO was further investigated through X-ray diffraction spectra. The minor peaks of ZnO in the HDPE/treated and untreated ZnO nanocomposites are considered as an evidence for the presence of uniform and well-dispersed ZnO. The electrical conductivity of the nanocomposite samples is higher than that of neat HDPE due to the semiconducting nature of ZnO and increases with ZnO content. The results of this work proved that dispersibility can be achieved through the addition of SA and conductivity of the nanocomposite depends on the ZnO content. Moreover, co-mixing technique and the surface modification of the nanofillers are very effective in producing the HDPE/ZnO nanocomposites that have many potential industrial applications such as food packaging, drug and pharmaceutical bottles.
Introduction
Polyethylene (PE) is widely used material in many applications such as drug and food packaging and it is expected to be exposed to various environmental factors such as solar radiation, humidity, pollutants and microbial flora. 1 –5 High-density polyethylene (HDPE) is a semi-crystalline polymer with relatively good mechanical and physical properties. 5 –9 It is commonly used in many applications. The characteristics of HDPE can be enhanced by incorporating micron sized or nanosized fillers such as titanium dioxide, zinc oxide (ZnO) into it. 10,11
ZnO is an inorganic compound and is commonly used as a filler in many materials and products. It is a wide band gap semiconductor with a band gap of 3.37 eV or 375 nm at room temperature. Therefore, it has potential applications in laser diodes and light emitting diodes. It is a relatively soft material with approximate hardness of 4.5 on the Mohs’ scale. 12 For materials science applications, it has high thermal conductivity, high refractive index, antibacterial and UV protection properties. Micron sized and nanoscale ZnO provide strong protection against UVA and UVB ultraviolet radiation Therefore, it is incorporated into materials and products (e.g. plastics, rubber, foods, batteries, lubricants, first-aid tapes, fire retardants, etc.). Several studies have been conducted on incorporating inorganic particles to organic polymer composites, such as mechanical characteristics, thermal stability, electrical properties so on. 13
ZnO nanoparticles can be dispersed into plastics to protect them from microbial flora and the effect of exposure to UV rays. 14 ZnO is a bio-safe material with attractive antibacterial properties; but usually, the compatibility between polyolefins and polar materials is poor because PE does not have any polar groups in its backbone to interact with the ZnO surface for good dispersion into the polymeric matrix. 15 Abou-Kandil et al. 16 investigated the HDPE/ZnO nanocomposite for ultraviolet radiation shielding (i.e. absorption properties). For the production of ZnO/PE nanocomposite, the melt mixing method was firstly used where the molten HDPE pellets and treated nano-ZnO filler are mixed using a twin-screw extruder. The nanocomposites were shown to have good spectral and mechanical properties which make them a candidate for applications where UV absorption is essential, for example, food packing, UV shields and many other applications.
Inorganic nanoparticles always have hydrophilic characteristics, which lead to a phase segregation between the polymer matrix and the filler. In the other hand, the high surface-to-volume ratio of nanoparticles typically results in small inter-particle distances, which makes van der Waals and electrostatic forces of major importance. Consequently, nanoparticles are inclined to form agglomerates which can be extremely difficult to break up into individual species and to disperse uniformly inside the polymer matrix. 17 The presence of such agglomerates impedes the efficient transfer of the beneficial properties of the filler related to its nanoscopic dimension to the host polymer, leading to nanofilled materials with properties comparable to traditional microcomposites. 18 Many approaches have been proposed to manufacture well-dispersed inorganic nanoparticles-based polymer nanocomposites. Chemical modification of the nanoparticle surface, polymer-particle compatibilizing agents, in situ inorganic nanoparticle synthesis and/or polymerization are examples of possible strategies which have revealed to be effective in attaining a homogeneous filler dispersion. 19 To prevent the agglomeration in polymers, the combination of inorganic particles with polymers is usually accomplished by surface modification. 20 –22 of the filler particulates. These surface modifications can improve the dispersion stability of ZnO and increase interfacial adhesion between the polymers and ZnO nanoparticles 20 –23
The nanomaterials surfaces are usually modified with some organic functionalities. 24,25 Nanomaterials surface functionalization is carried out with many organic functional groups such as alcohols, thiols, sulfonic, carboxylic acids and amines. The employed methods are based on (i) copolymerization of functional organosilanes, macromonomers and metal alkoxides; (ii) functionalization of organic components within sol–gel-derived silica or metallic oxides; and (iii) organic functionalization of nanotubes, nanoclays or other compounds with lamellar structures. 26 Various recent investigations of functionalization of metal oxide fillers to improve their compatibility with polymers were conducted. In order to minimize interface energies between particles and polymer matrix, several surface modification/functionalization and stabilization techniques have been developed that are mainly used in chemical methods. 22
Electrical behaviour of HDPE/ZnO nanocomposites was investigated by Sie and Guodong. 27 The composites were prepared by melt compounding. ZnO powders reinforcing filler with sizes of approximately 200 nm and approximately 2 μm were used. The influence of the size and ZnO content as well as annealing treatment on the dielectric and conducting properties of the HDPE/ZnO composites were investigated. The results showed that the dielectric constant of HDPE/ZnO composites increased gradually with an increase of the ZnO content. Zhang et al. 28 successfully modified the surface of ZnO nanoparticles with methyl methacrylate acetate and developed ZnO/poly(methyl methacrylate) (ZnO/PMMA) nanocomposite films via free-radical polymerization. Many researchers used stearic acid (SA), which acts as a lubricant for certain polymers, facilitates the compatibility and dispersion of the ZnO particles into the HDPE matrix. Hana et al. 29 improved the lipophilicity of graphene by the addition of SA. They incorporated steric acid-modified graphene into a low-density polyethylene (LDPE) matrix and studied its thermal and mechanical properties. Lin et al. 30 modified graphene platelets with stearic and oleic acid and used this as an additive for the lubricant oil. Mahdi et al. 31 used SA to modify the surface of calcium carbonate (CaCO3) nanoparticles and obtained good dispersion of CaCO3 in polypropylene (PP) matrix. Similarly, industrial lime sludge (LS) was surface modified by SA to reinforce HDPE composites. 32 Fourier transform infrared (FTIR) spectroscopy showed successful grafting of SA onto LS particles and scanning electron microscopic (SEM) morphology revealed that SA coating hinders the agglomeration of the fillers in the HDPE matrix at higher filler contents. Mechanical properties improved significantly for SA-coated LS composites because of the uniform particle dispersion and effective filler–matrix interfacial interaction. The SA coating raised the entanglement at the filler–matrix interface and hence increased the temperature of thermal decomposition of the coated composites from 500°C to 600°C. Thus, SA evidenced to be an effective surface modifier for LS in producing HDPE/LS composites with a low cost and outstanding characteristics.
There are three common methods used to process nanocomposites: (1) solution method, 33 –39 (2) in situ or interlamellar polymerization technique 40 –45 and (3) melt processing. 46 –51 The last one is the most commonly used method due to, sometimes, the lack of solvents. In the melt processing, the nanocomposite filler is incorporated into a molten polymer to produce the final nanocomposite material. 52
Salzano de Luna et al. 53 introduced and studied the efficiency of a template-based approach to disperse hydrophilic ZnO nanoparticles into hydrophobic HDPE metrics to form HDPE/ZnO nanocomposites. Melt- and solid-state viscoelastic measurements reveal a good quality of the filler dispersion despite the uneven distribution on micro-scale. However, the above-mentioned methods are very much complex and slow processes. We opted co-mixing technique for the fabrication of HDPE/ZnO nanocomposites because it is fast and one-step process without any chemical by-products. Abdulyazied et al. 54 have used co-mixing technique with SA surface modification for the preparation of HDPE/ZnO composites. They have obtained well dispersion of nanofillers in the HDPE matrix. Similar studies have been performed by Li et al. 55 using coupling agents and proved the well dispersion of ZnO in the HDPE matrix. The technique has been used by Céline 56 in order to prepare polyvinyl acetate matrix/calcium carbonate filler composites. The co-mixing can be used in many applications, including the synthesis of stable particulate systems, which would be sensitive to segregation during manufacturing by simple mixing. Also, there is possibility of increasing the contact area between two solid constituents to increase the yield of a reaction.
The current work was conducted with the main objectives of investigating the effect of the surface modification/treatment of the ZnO nanoparticles on their dispersion into HDPE matrix. Moreover, efficiency of using the low cost co-mixing processing technique and the effect of these two parameters on the characteristics of the developed HDPE/ZnO nanocomposites were investigated.
Experiment
Materials
In this work, HDPE (HYA 600) with a density of 0.95 g/cm3 and a melt flow index of 4.2 g/10 min (230°C, 7 kg) was used. It is produced by Exxon Mobile Group, Texas (USA) and provided in a granular form. The ZnO nanoparticles powder (5.6 g/cm3), with particles size <5 μm, is produced and supplied by Aldrich Company, Taufkirchen (Germany). The used SA (CH3–(CH2)16–COOH) is a long-chain fatty acid (organic acid) with bulk density of 400–500 kg/m3 and produced by Merck, Taufkirchen (Germany).
Mechanical treatment of ZnO and nanocomposites preparation
The ZnO filler was first dry grinded at room temperature using coffee maker to reduce its size. Then SA (organic compound), in powder form, was added to mechanically treated (or surface-modified) ZnO particles (inorganic compound) using the co-mixing method to improve its compatibility with HDPE matrix. In fact, stearic organic acid has low melting temperature (69.5°C) and the heat rise due to the high shear force effects in the coffee maker will be sufficient to melt it and coat the surface of the ZnO particles. This method is expected to well disperse the ZnO nanofiller into the HDPE polymeric matrix in the next step using the Brabender plastograph. Figure 1 shows schematic of the whole process of producing the HDPE/ZnO nanocomposites.

Schematic of the basic steps of the co-mixing-based approach for the preparation of the HDPE/ZnO nanocomposites.
Two series of HDPE/ZnO nanocomposites (i.e. with treated and untreated ZnO filler) with different filler contents were prepared. The ZnO nanofillers were mixed with the HDPE in the proportions of 0.5, 1 and 2 wt% by using a Brabender plastograph (Figure 1). The working conditions were: speed of rotation = 50 r/min and temperature = 200°C. The total working time was 10 min. The first 3 min was for the HDPE only in order to reduce its viscosity, followed by 7 min after the incorporation of the ZnO particles in the HDPE matrix. The untreated and treated ZnO nanocomposites are designated by HUZ and HTZ. The prepared samples are shown in Table 1.
Different compositions of HDPE/ZnO nanocomposites.

HDPE: high-density polyethylene; ZnO: zinc oxide.
Characterization
Morphology and topography
The microstructure of the neat HDPE and HDPE/ZnO nanocomposites samples was investigated through SEM (XL 30 ESEM). The samples were analysed without the metallization of their surfaces. The atomic force microscopy (AFM), AXIOSCOP 40 microscope (Carl Zeiss Microscopy, New York, USA) with a frequency of 1 Hz and at a scale of 50 μm, was used in order to evaluate the effectiveness of coating the ZnO particles surfaces by SA and get quantitative topographic images of the surface of ZnO particles. The RMS roughness (root-mean-square average of the profile height deviations from the mean line of the surface) of the samples was obtained directly from the AFM analysis software.
FTIR spectrometer
The infrared (IR) spectra of the neat HDPE, ZnO as well as the treated and untreated HDPE/ZnO nanocomposites were obtained using FTIR spectroscopy. FTIR spectra were obtained within the wave number range from 400 to 4000 cm−1.
Wide angle X-ray diffraction
Wide angle X-ray scattering (WAXS) experiments were performed using a Philips X’Pert MPD diffractometer (Malvern Panalytical Ltd., Royston, UK) equipped with a CuKα1 (λ = 1.5405 nm) monochromator in the reflection mode. The following conditions were employed: 45 kV, 40 mA and angular range (2θ) 5°–60°. The degree of crystallinity αWAXS of all samples was derived from the ratio of the area corresponding to the crystalline peaks to the total area of the diffractogram.
Dielectric properties
The dielectric measurements were carried out using Hioki 3532 Hi-Tester (T-Equipments, New Jersey, USA) and using the four-point method.
Results and discussion
Atomic force microscopy
Figures 2 and 3 represent the AFM topographic images (in 2D and 3D) of the untreated and treated ZnO, respectively. It is observed that the RMS roughness value decreased from 190 nm for neat ZnO to185 nm for treated one which indicates that the SA melted and effectively coated the ZnO particles and reduced the surface irregularities. This may ensure an effective dispersion of the treated filler into the matrix. This is called the ‘kinetic roughness phenomenon’: the surface morphology is a function of the surface kinetics. 57 Similar observations have been reported by Kharchi. 58

AFM topographic images in (a) two dimensions and (b) three dimensions of the untreated ZnO.

AFM topographic images in (a) two dimensions and (b) three dimensions of the treated ZnO.
HDPE/ZnO nanocomposites morphological properties
The morphology of HDPE/ZnO nanocomposites was examined by SEM analysis. Figure 4 shows the SEM micrographs of the prepared nanocomposites. Figure 4(a) and (b) presents the images of HDPE/untreated ZnO and HDPE/treated ZnO with 1% ZnO content. Figure 4(a) shows that ZnO particles (represented by the white spots) are homogenously distributed in the HDPE matrix. In the other side, Figure 4(b) shows the effect of SA surface treatment on the nanocomposite. ZnO particles are well dispersed in the matrix due to good interaction between the filler particles and the polymer matrix.

SEM morphology of HDPE/ZnO nanocomposites. (a) HUZ1 and (b) HTZ1.
The nature of nanoparticle surface is an important parameter for the nanoparticle dispersion in the matrix. Hence, changing the ZnO particles surface characteristics from inorganic into organic by surface treatment decreases the surface tension of the particle. This is important to produce a well and uniform dispersion of the ZnO nanoparticles in the PE matrix. 59
From Figure 4(b), it can be seen that the treated ZnO particles are well dispersed in the PE matrix as the number of white spots on the surface of the sample is much less than that on the surface of the untreated ZnO/PE nanocomposite sample. Such particles dispersion in the PE matrix reflects particles lesser attraction, the enthalpy gain, occurred by the adsorption of polymer segments and the particle surface, is sufficient to oppose particles aggregation of to a far extent. This observation is supported by the results of the AFM.
Fourier transform infrared spectrometer
The IR analysis is based on the excitation of the molecular bonds of a sample with IR radiation in the frequency range between 400 and 4000 cm−1. The main vibrations of virgin HDPE are summarized in Table 2. The characteristic peak for neat ZnO can be seen around wave number 500 cm−1, which represents the vibrations of the Zn-O bond. 59
The main vibrations of neat HDPE.
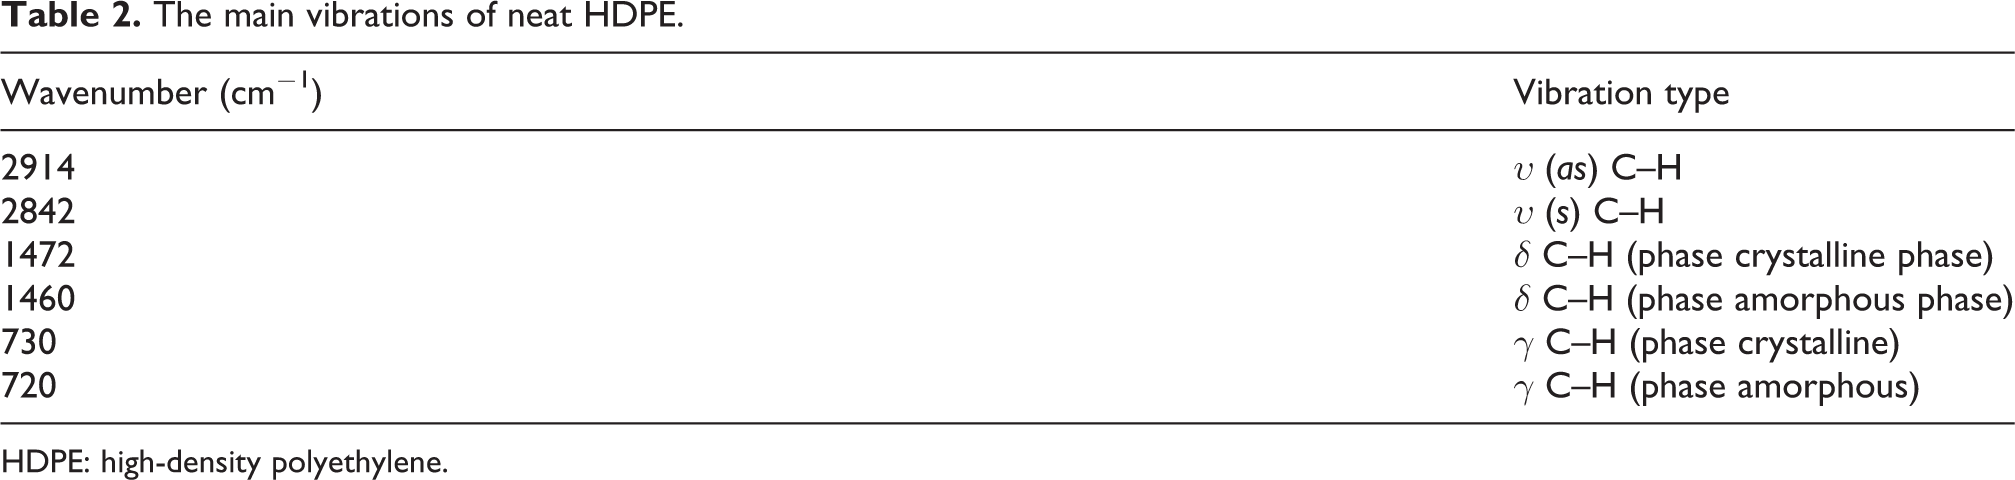
HDPE: high-density polyethylene.
Figure 5 shows functional groups of the untreated samples. It depicts the FTIR spectra of HDPE/ZnO nanocomposites with filler contents of 0.5, 1 and 2 wt% of untreated ZnO. The results show that the addition of ZnO has not affected the chemistry and bonding in HDPE. Also, the peaks for the ZnO are very minute indicating the good dispersion of the filler in the polymeric matrix and amplitude of the peak increases as the percentage of ZnO filler increases in the composite. This observed dispersion of the untreated ZnO into the HDPE matrix is an indication for the effectiveness of the used processing method of producing HDPE/untreated ZnO nanocomposites.
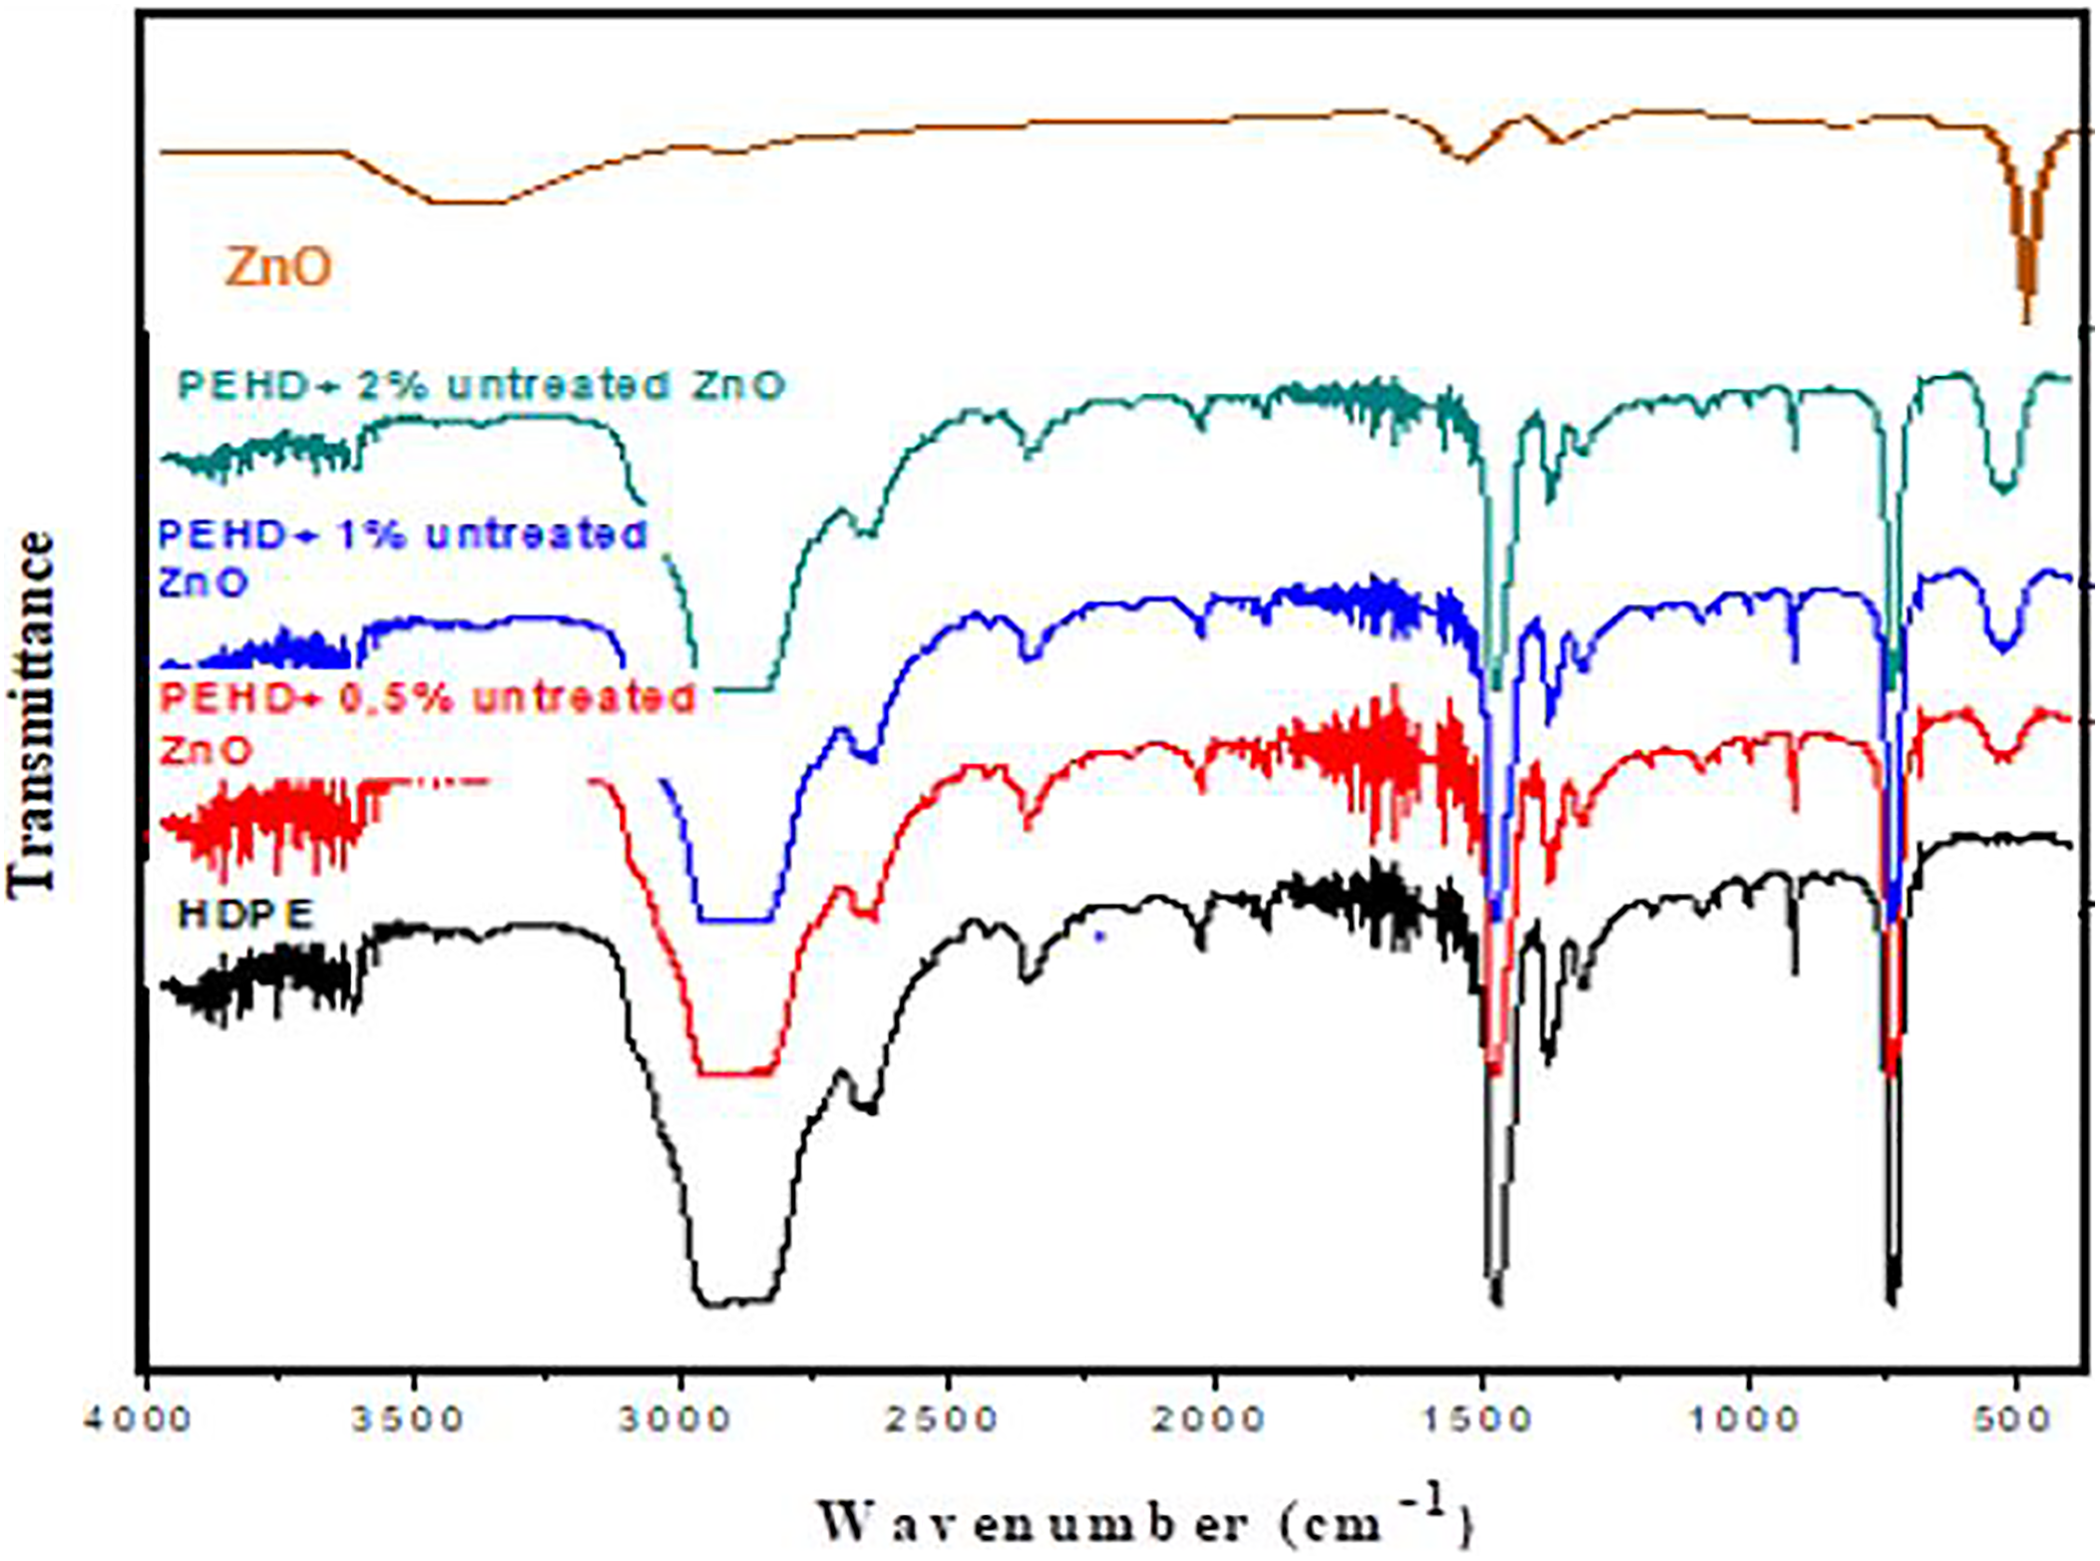
Variation of the transmittance (%) of pure HDPE and HDPE/untreated ZnO nanocomposites as a function of the wave number (cm−1).
The FTIR spectra of HDPE/treated ZnO nanocomposites with 5, 1 and 2 wt% ZnO contents are demonstrated in Figure 6. The figure shows the similar characteristics as the untreated sample; however, the peak amplitude around 500 cm−1 is found less that untreated sample which proves the well dispersion of ZnO in the treated composite samples.
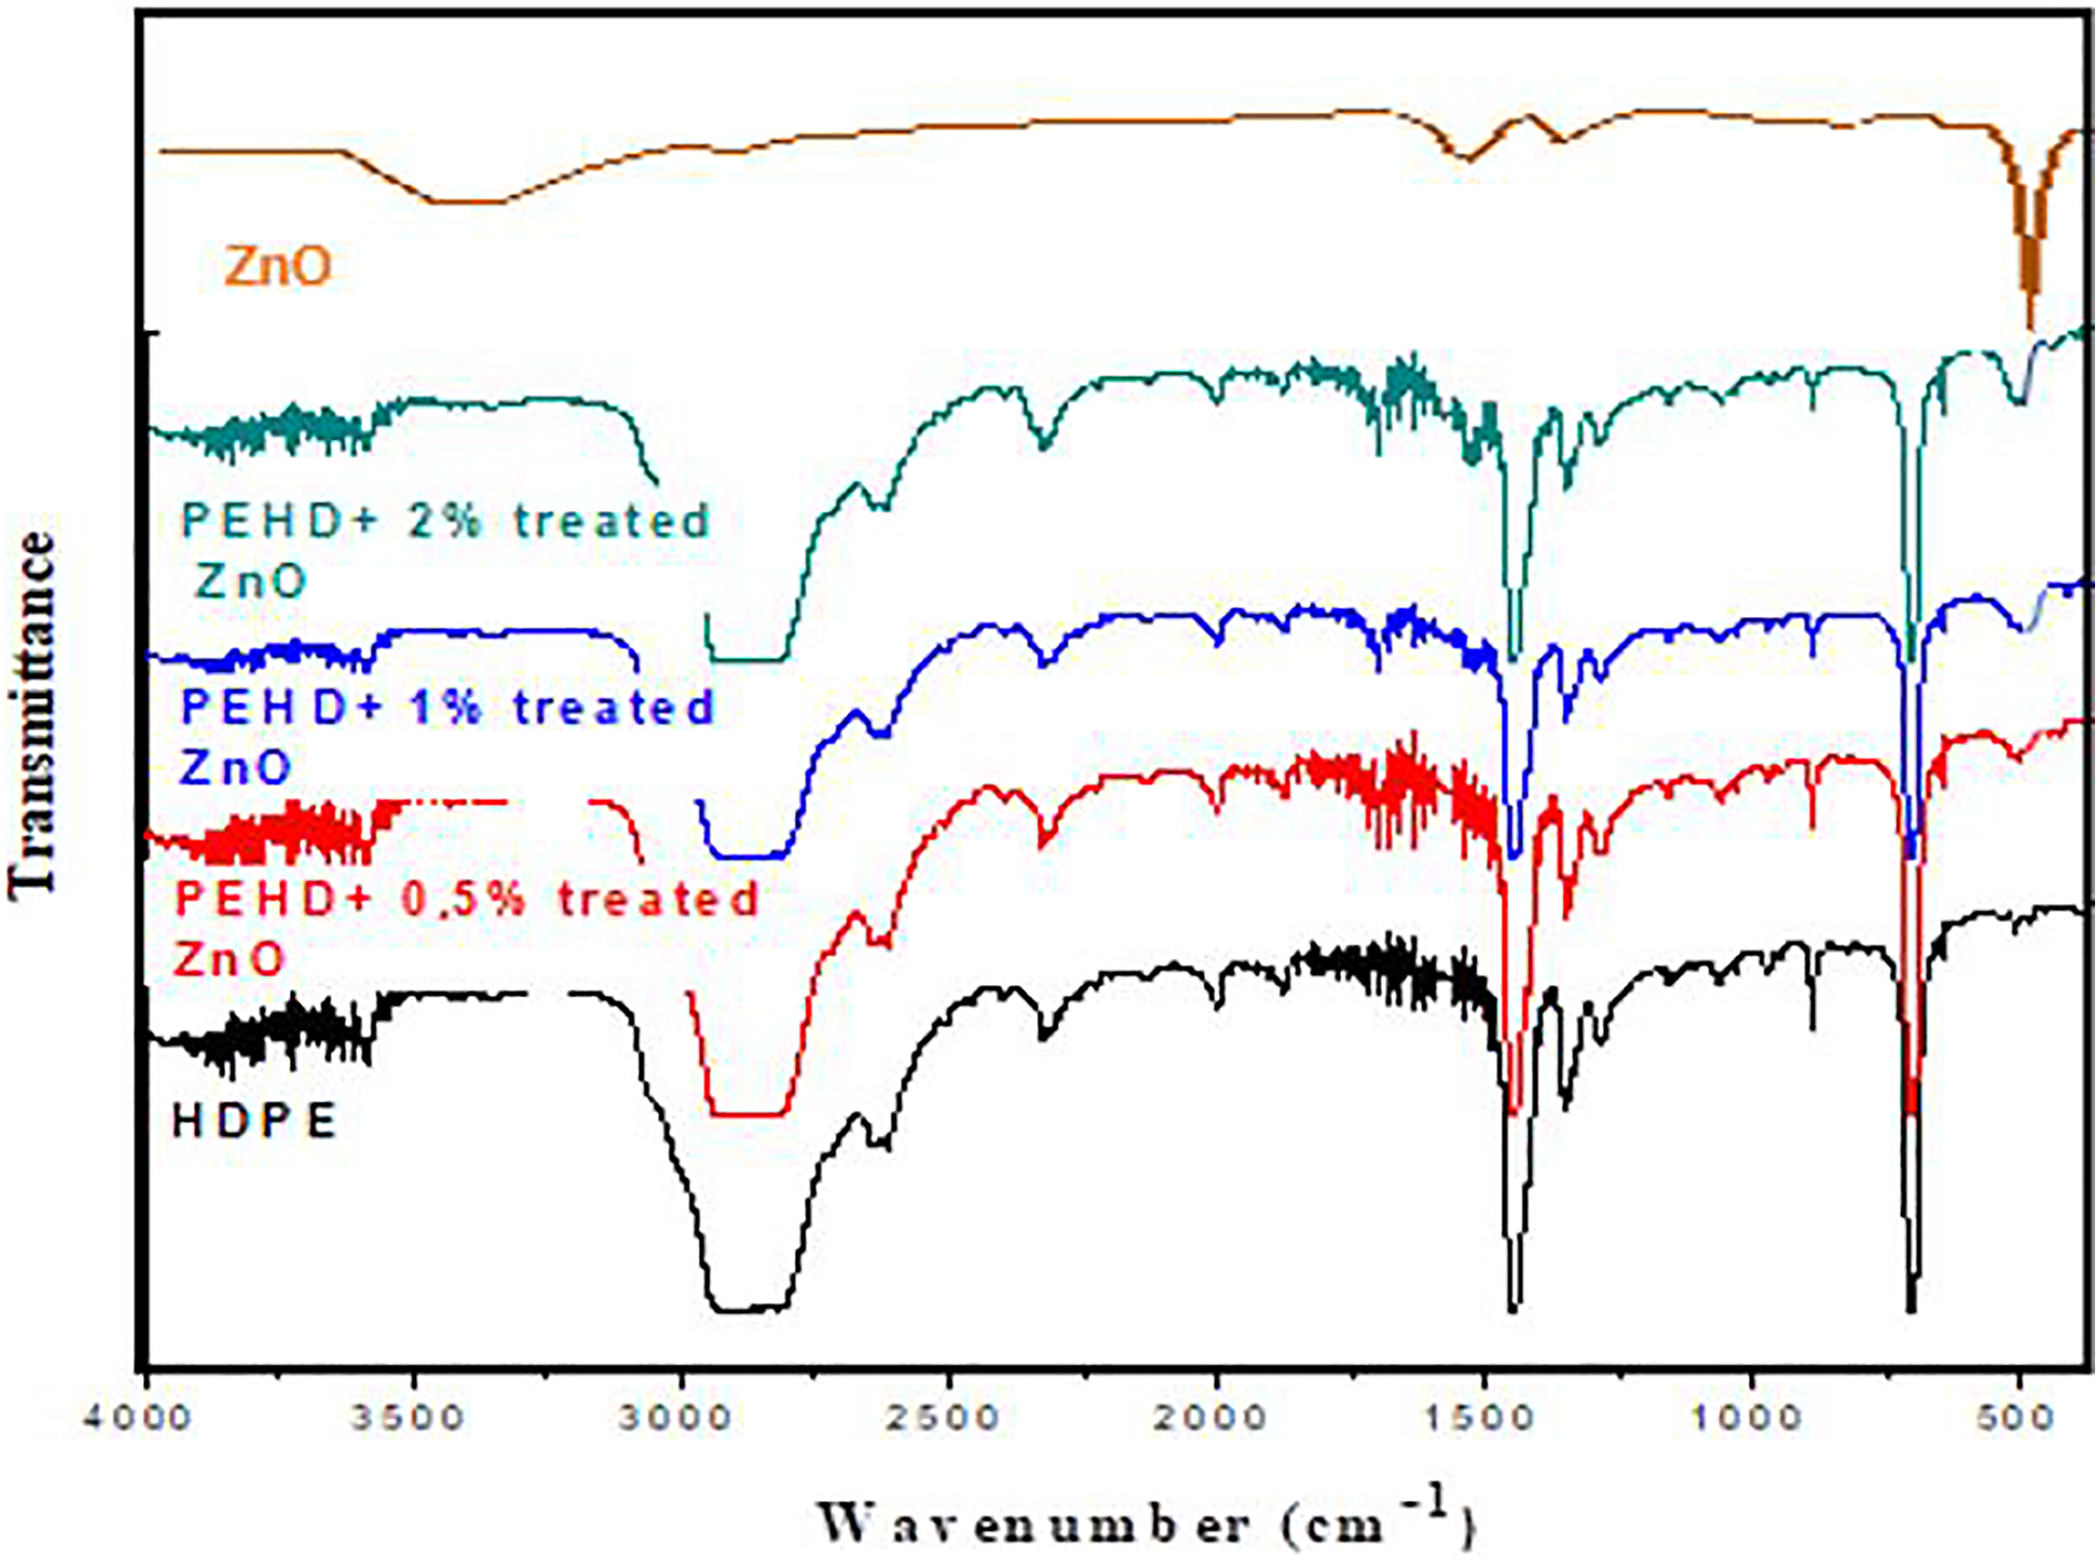
Variation of the transmittance (%) of pure HDPE and HDPE/treated ZnO nanocomposites as a function of the wave number (cm−1).
Wide angle X-ray diffraction
X-ray diffraction (XRD) technique is a powerful method that can be used to get the structure of the prepared HDPE/ZnO nanocomposites The XRD pattern for HDPE sample is shown in Figure 7. The XRD pattern shows two strong (distinct) (110) and (200) reflection peaks appearing at 2θ = 21.5° and 2θ = 23.9°. Another moderately strong peaks appearing at 2θ = 30° and 2θ = 36.2°. 60 The peaks at 2θ = 21.5°, 23.9° and 30° correspond to the inter planner spacing of 4.132, 3.707 and 2.481 Å, respectively, which correspond to the (110), (200) and (020) lattice planes. This structure indicates that HDPE used in this investigation has orthorhombic structure. 61 Some other small peaks appear also at angles 2θ larger than 40° indicating the semi-crystalline nature of HDPE (i.e. presence of crystalline and amorphous regions) A broad shoulder located at 2θ approximately 19.3° is also observed next to the (110) peak. The crystalline peaks of HDPE can be distinguished from the amorphous region by the deconvolution profile fitting. The XRD pattern of shows that used HDPE is pure and without any impurities.

XRD pattern of pure HDPE.
Figure 8 presents the XRD pattern for pure ZnO sample. These peaks appearing at scattering angles 2θ = 31.68°, 34.4°, 36.16°, 47.52°, 56.48°, 62.88°, 66.24°, 67.84°, 68.96°, 72.48° and 76.8° correspond to reflections from the crystal planes 100, 002, 101, 102, 110, 103, 200, 112, 201, 004 and 202. 62 This ensures the formation of the as prepared ZnO in a pure single hexagonal phase.

XRD pattern of pure ZnO.
The X-ray diffraction patterns for HDPE/ZnO nanocomposite films (for 1 wt% modified and unmodified ZnO) are shown in Figure 9. XRD patterns of all HDPE/ZnO nanocomposite films showed the characteristic peaks of HDPE at 21.5°, and 23.9° and other peaks. Also, the minor or very small diffraction (compared to that of HDPE) peaks of ZnO present at 31.68°, 34.4° and 36.16° confirms the presence of ZnO and the formation of HDPE/ZnO nanocomposite. Furthermore, the reduced amplitude of the ZnO peaks reflects the effective dispersion of the filler in the polymeric matrix and due to the low concentration of ZnO. The produced nanocomposite consists only of two phases namely HDPE and ZnO and no other phases were detected which assure its successful preparation. Also, a scattering peak appears at 2θ = 19.3°, stands for the amorphous portion. With the addition of ZnO, the intensities of the crystal peaks decreased slightly, indicating a mild reduction in the crystallinity. 63

XRD pattern of pure HDPE and the HDPE/treated and untreated ZnO nanocomposites.
Dielectric properties
Figure 10 shows the dielectric constant of the HDPE/ZnO nanocomposites. It is noticed that the conductivity of untreated sample is more than treated sample. This is due to the presence of SA coating over the ZnO nanoparticles which makes the nanocomposite less conductive. Also, as the concentration of ZnO increases, conductivity of HDPE matrix also increases due to the generation of free electrons and follows the additivity rule. Similar observation has been reported by Hanemann and Szabó, 20 where the electrical resistivity of HDPE nanocomposites reduces with the increasing concentration of ZnO. The nanocomposite samples achieve the electrical percolation threshold at 1 wt% concentration of ZnO, after which there is no significant changes in the electrical conductivity of both treated and untreated nanocomposites. Similar reports have been presented by Chen et al. 64 in MWCNTs-filled PP/PMMA composites were electrical percolation threshold is achieved at a concentration of 1 wt% MWCNT, thereafter electrical conductivity has only minute effect on the increasing concentration of Multi walled carbon nanotubes (MWCNT).

Measured electric conductivity as a function of ZnO concentrations.
Conclusions
HDPE/ZnO nanocomposites with SA-surface-modified and unmodified ZnO nanoparticles were successfully fabricated using co-mixing-based approach. The ZnO particles surface modification has been done using the coffee grinder and the plastograph was used for preparing HDPE/ZnO nanocomposites. The SEM and AFM results showed that, the SA has reached its melting point and coated the ZnO nanoparticles ensuring an effective dispersion of the ZnO particles into the HDPE polymeric matrix. The FTIR and XRD analysis of the HDPE/ZnO nanocomposites showed minor peaks of the ZnO in the nanocomposite. This is an evidence for the efficient dispersion and distribution of the ZnO particles. The dielectric properties measurements showed that the conductivity of HDPE matrix enhanced with incorporating ZnO nanoparticles due to its free electrons, and concentration of 1 wt% has the highest value. However, due to SA treatment, the conductivity of treated samples are found less than untreated samples. Generally, the results of this work revealed that, the SA surface modifier and the used co-mixing (plastograph) techniques are effective in the preparation of the HDPE/ZnO nanocomposites.
Footnotes
Declaration of conflicting interests
The author(s) declared no potential conflicts of interest with respect to the research, authorship, and/or publication of this article.
Funding
The author(s) received no financial support for the research, authorship, and/or publication of this article.