
Abstract
Organically modified layered double hydroxide (OM-LDH) was synthesized via anion exchange reaction and potassium monolauryl phosphate (MAPK) was used as an intercalator. The OM-LDH nanofillers were embedded into low-density polyethylene/ethylene–vinyl acetate (LDPE/EVA) via melt blending process which provided LDPE/EVA/OM-LDH nanocomposites. The structure and properties of the fabricated samples were characterized through Fourier transform infrared spectroscopy, X-ray diffraction techniques, scanning electron microscopy, thermogravimetric analysis, differential scanning calorimetry, and tensile testing. The results showed that the organic anion was intercalated into the interlayer region of LDH and enlarged the interlayer distance. The TGA results of the nanocomposites showed significantly improved thermal stability at a higher temperature when containing 6 wt% OM-LDH due to the good dispersion of OM-LDH in the matrix. The DSC data indicated that the degree of crystallinity was increased obviously due to the incorporation of OM-LDH in the matrix. The formation of organic side chains on the OM-LDH surface also contributed to an improvement in the interfacial adhesion, resulting in enhanced tensile strength and elongation at break compared with LDH.
Keywords
Introduction
Layered double hydroxide (LDH) as an inorganic layered material with unique nanostructure is considered as a novel promising nanoscale material.
1,2
LDH has unique structures and wide applications. The structure of LDH is closely related to the layered structure of mineral brucite, but replacement of some of the divalent metal ions with trivalent metal ions results in a net positive charge in each of the layers.
3
The positive charge in the layers can be balanced by the interlayer anions. Its general formula can be expressed as
As an important material, LDH has been widely used as catalysis, flame retardants, adsorbents, photochemistry, controlled release of medicine and thermal stabilizers, and so on. 10 -13 For example, Wang et al. 14 synthesized zinc (Zn)-doped magnesium aluminium (MgAl)-layered double hydroxide nanoparticles (NPs) with different molar ratio of Mg/Zn and used as polyvinyl chloride (PVC) heat stabilizer. From the research achievements, it was found that the participation of Zn element improved the thermal stability of PVC, and LDH with Mg/Zn = 1.0 had the best thermal stabilizing effect. Wang and his co-authors 15 prepared silver (Ag) NPs supported on layered double hydroxide by chemical reduction. In addition, the Ag/LDH was used as a catalyst for epoxidation of styrene. The results indicated that the Ag/LDH catalyst exhibited a better catalytic performance and enhanced conversion of styrene in comparison with the supported gold NPs catalysts.
To attract more interest and increase the impact, the effects of LDH on the versatile applications of polymer composites have been reported widely, such as mechanical property of polymer nanocomposite hydrogels, 16 polymer thermal stability, 17 and polymer UV light shielding. 18 However, because of the stronger interaction derived from higher charge density, it becomes much more difficult for LDH to disperse homogeneous in the polymer matrix and may also lead to poor compatibility with the polymer matrix. 19,20 In order to improve the dispersion and compatibility between LDH and polymer matrix, an organo-modification treatment is usually necessary. Anion exchange with surfactants or other functional anions is the most common method used for modification. 21 Because the LDH is hydrophilic and the polymer is hydrophobic, the organic modifications are used to convert LDH surface from hydrophilic to organophilic which can enhance the affinity between LDH and polymer matrix. 22
Several researches have reported the influence of the organically modified layered double hydroxide (OM-LDH) on the properties of polymer matrix. In the work of Kakati et al., 23 SDS was used as modifier to synthesize the modified LDH by a regeneration method, and the nanocomposites were prepared via melt intercalation technique. After being modified, the d-value was increased from 0.77 nm to 1.37 nm, and the modified LDH was exfoliated in polypropylene (PP) matrix which provided better thermal stability and mechanical properties. Purohit et al. 24 studied the structure–property relationships of PP/LDH nanocomposites and the LDH has been modified by SDBS. Dinari and Mallakpour 25 also prepared a diacid named chiral diacid of N-trimellitylimido-L-valine intercalated LDH via a coprecipitation reaction under ultrasonic irradiation. The composites with this novel chiral diacid intercalated LDH and polyvinylpyrrolidone showed good dispersion and significantly improved thermal stability.
For the past few years, polyethylene (PE) has been widely used in many fields due to its excellent mechanical properties, insulating properties, and other advantages. Different approaches have been investigated for preparing PE/LDH nanocomposites with the aim of improving the compatibility between the matrix and fillers. 26 Ethylene–vinyl acetate (EVA), a copolymer of ethylene and vinyl acetate, is a polar polymer which can be used to improve the compatibility between LDH and nonpolar PE. 27 The blending of PE with EVA has attracted great attention for use as wire and cable insulating materials. There are some publications dealing with the various characteristics of PE/EVA blends. 28 -30
The potassium monolauryl phosphate (MAPK), as an anionic surfactant, can increase the interlayer distance and weaken the interlayer force. To our knowledge, the use of MAPK which is used as an organic modifier to obtain the OM-LDH is rarely reported in the literatures. The aim of this work is to successfully synthesize the OM-LDH and fabricate the low-density polyethylene/ethylene–vinyl acetate (LDPE/EVA)/OM-LDH nanocomposites with the improved mechanical properties. OM-LDH is characterized by Fourier transform infrared (FTIR) spectroscopy, X-ray diffraction (XRD) techniques, scanning electron microscopy (SEM), and thermogravimetric analysis (TGA). In addition, the produced nanocomposites are also evaluated using FTIR, XRD, SEM, TGA/DTG, differential scanning calorimetry (DSC), and tensile testing. Due to the presence of functional groups in LDH, it is dispersed well in the matrix and the interfacial adhesion between polymer and LDH is improved which can also enhance the properties of the composites.
Experimental
Raw materials
Low-density polyethylene (LDPE, 2102TN00) was purchased from Qilu Petrochemical Company (China). Ethylene–vinyl acetate (VA) copolymers (EVA, containing 15 wt% VA) were supplied by Formosa Plastics Corporation (Taiwan, China). MAPK (C12H25OPO3K2) was obtained from Qingdao Usolf Chemical Technology Company (China). MgAl-LDH (Mg0.68 Al0.32(OH)2] (CO3)0.16·0.7H2O) (CO3)0.16·0.7H2O)”] with an average diameter of 2 μm was acquired from Xiangfan Petrochemical Equipment Company (China). Hydrochloric acid (HCl) (AR) and ethanol were provided by Chengdu Kelong Chemical Reagent Company (China).
Preparation of the OM-LDH
Anion exchange method was used for the preparation of OM-LDH with an MAPK/LDH molar ratio of 3:1. Firstly, the pristine MgAl-LDH (LDH; 0.01 mol) was added to the aqueous solution and stirred for 1 h at 70°C to obtain the homogeneously dispersed solution A. Then, a desired amount of the MAPK (0.03 mol) aqueous solution was added into the solution A and the mixture was vigorously stirred at 70°C for 7 h. During the synthesis process, the pH value was maintained at 4 ± 0.2 by adding suitable amount of HCl solution. Finally, the product was filtered and washed several times, and then dried in vacuum to give the OM-LDH nanolayer. The generalized scheme for organic modification of LDH is shown in Figure 1.

Proposed model for the OM-LDH product with MAPK. OM-LDH: organically modified layered double hydroxide; MAPK: potassium monolauryl phosphate.
Preparation of the LDPE/EVA/OM-LDH nanocomposites
LDPE/EVA/OM-LDH nanocomposites were prepared by melt mixing method. The LDPE to EVA weight ratio was kept constant (80:20) for all compositions. LDPE, EVA, LDH, and OM-LDH were dried before used. Then all the materials were melting compounded using HNZ-1 Torque rheometer with 60 r min−1 rotor speed at 140°C for 10 min. The amounts of OM-LDH in the LDPE/EVA/OM-LDH nanocomposites were 2, 4, 6, and 8 wt%. For comparison, LDPE/EVA with 6 wt% LDH was also prepared using the abovementioned method. After being dried, the nanocomposites were pressed into standard sheets for the following tests and characterization.
Measurements and characterization
FTIR spectroscopy
A Thermo Nicolet 6700 FTIR spectrometer was applied to monitor the FTIR spectra of the samples in the range of 4000–400 cm−1. The LDH and OM-LDH samples were mixed with dry KBr and pressed in the form of pellets for the measurement. The standard sheets of nanocomposites were used for FTIR analyses.
X-ray diffraction
Interlayer spacing d was measured by X-ray diffractometer (X’pert PRO, made by the PANalytical company, Netherlands) with Cu-Kα radiation (λ = 0.154 nm) at 40 kV and 40 mA. The diffraction patterns were collected at 2θ between 1.5° and 30° at a scanning rate of 0.02°·min−1. The d-spacing of the samples was analyzed using Bragg’s equation (nλ = 2d sinθ), where n is an integer, λ is the wavelength, θ is the glancing angle of incidence, and d is the interlayer spacing of the crystal.
Scanning electron microscopy
The cryogenically fractured morphology of the nanocomposites was carried out using a SEM (model JSM-7500F, JEOL, Japan). The specimens were gold-coated to avoid accumulation of charges and analyzed at an accelerating voltage of 20 kV.
Thermogravimetric analysis
TGA was performed on a Q50 (PerkinElmer company, Massachusets, USA) thermogravimetric analyzer at a heating rate of 10°C·min−1. In each case, about 8 mg of the samples were examined under nitrogen atmosphere with a flow rate of 30 mL·min−1 at temperatures ranging from room temperature to 700°C.
Differential scanning calorimetry
DSC thermograms were obtained with a STA 449C Jupiter (Germany) differential scanning calorimeter. About 8–10 mg specimens were heated from room temperature to 190°C at the rate of 10°C·min−1, maintained at 190°C for 5 min to erase the thermal history. The samples after premelting were cooled to room temperature at a cooling rate of 10°C·min−1, and then subsequently reheated to 190°C at a rate of 10°C·min−1 and the DSC curves were recorded. All the tests were conducted under nitrogen atmosphere.
The crystallinity (Xc) of the nanocomposites is calculated using the equation Xc = ΔHm/(wi × ΔH0) × 100%, where ΔHm is the DSC measured value of fusion enthalpy and wi is the mass fraction of matrix in the composites. ΔH0 is the enthalpy of fusion of 100% crystalline PE and is taken as 293 J·g−1. 31
Tensile properties tests
Tensile tests were carried out on a tensile tester AGS-J (Autograph SHIMADZU, Shimadzu Co. Ltd., Japan) with a crosshead speed of 50 mm·min−1 according to GB 1040-92 (Chinese). At least five samples were tested in each composite and the average values were reported. All these tests were carried out at a temperature of 25°C.
Results and discussion
Characterization of LDH and OM-LDH
The FTIR spectra of LDH and OM-LDH are presented in Figure 2. For LDH, the broad band centered at about 3400 cm−1 can be ascribed to the O–H stretching vibration of the metal hydroxide layer and interlayer water molecules. The strong peak at 1355 cm−1 is attributed to the symmetric stretching vibration of interlayer carbonate anion. In the low-frequency region, the bands observed are associated with M–O and M–O–M (M represents Mg or Al) in the LDH sheets.
32
In the FTIR spectrum of OM-LDH, the band at 1216 cm−1 is attributed to P=O stretching vibration. The two peaks at 2919 and 2850 cm−1 are assigned to the asymmetric and symmetric stretching of C–H, and the band at 1083 cm−1 is assigned to P–O–C stretching vibration. The results of FTIR confirm the presence of MAPK in OM-LDH. Moreover, the

FTIR spectra of the LDH and OM-LDH. FTIR: Fourier transform infrared; OM-LDH: organically modified layered double hydroxide; LDH: layered double hydroxide.
The XRD patterns of LDH and OM-LDH in the 2θ range of 1.5°−20° are displayed in Figure 3. Before organic treatment, LDH exhibits the characteristic reflection of (003) plane with sharp intense which is in good agreement with the previous literature. 34 The position of the basal peak indicates the distance between two adjacent metal hydroxide sheets (d003). The characteristic reflection of (003) is observed at 2θ = 11.84°, and the corresponding basal spacing of pristine LDH is 0.74 nm (d003). After being modified by MAPK, the XRD pattern of OM-LDH shows the basal spacing is 3.68 nm and the 2θ shifts to 2.4°. This result reveals that the MAPK anion is successfully intercalated into the LDH interlayer galleries, which is consistent with the above FTIR results and the basal spacing d003 is expanded obviously. The 2θ values of (006) and (009) crystal planes appear at 4.8° and 7.14° and the corresponding interlayer distances are 1.84 nm (d006) and 1.23 nm (d009) which are calculated by the Bragg’s law. The basal spacing values of (003), (006), and (009) have a good multiple relationship (d003 = 2d006 = 3d009), which indicates the synthesized OM-LDH has a good crystalline-layered structure.
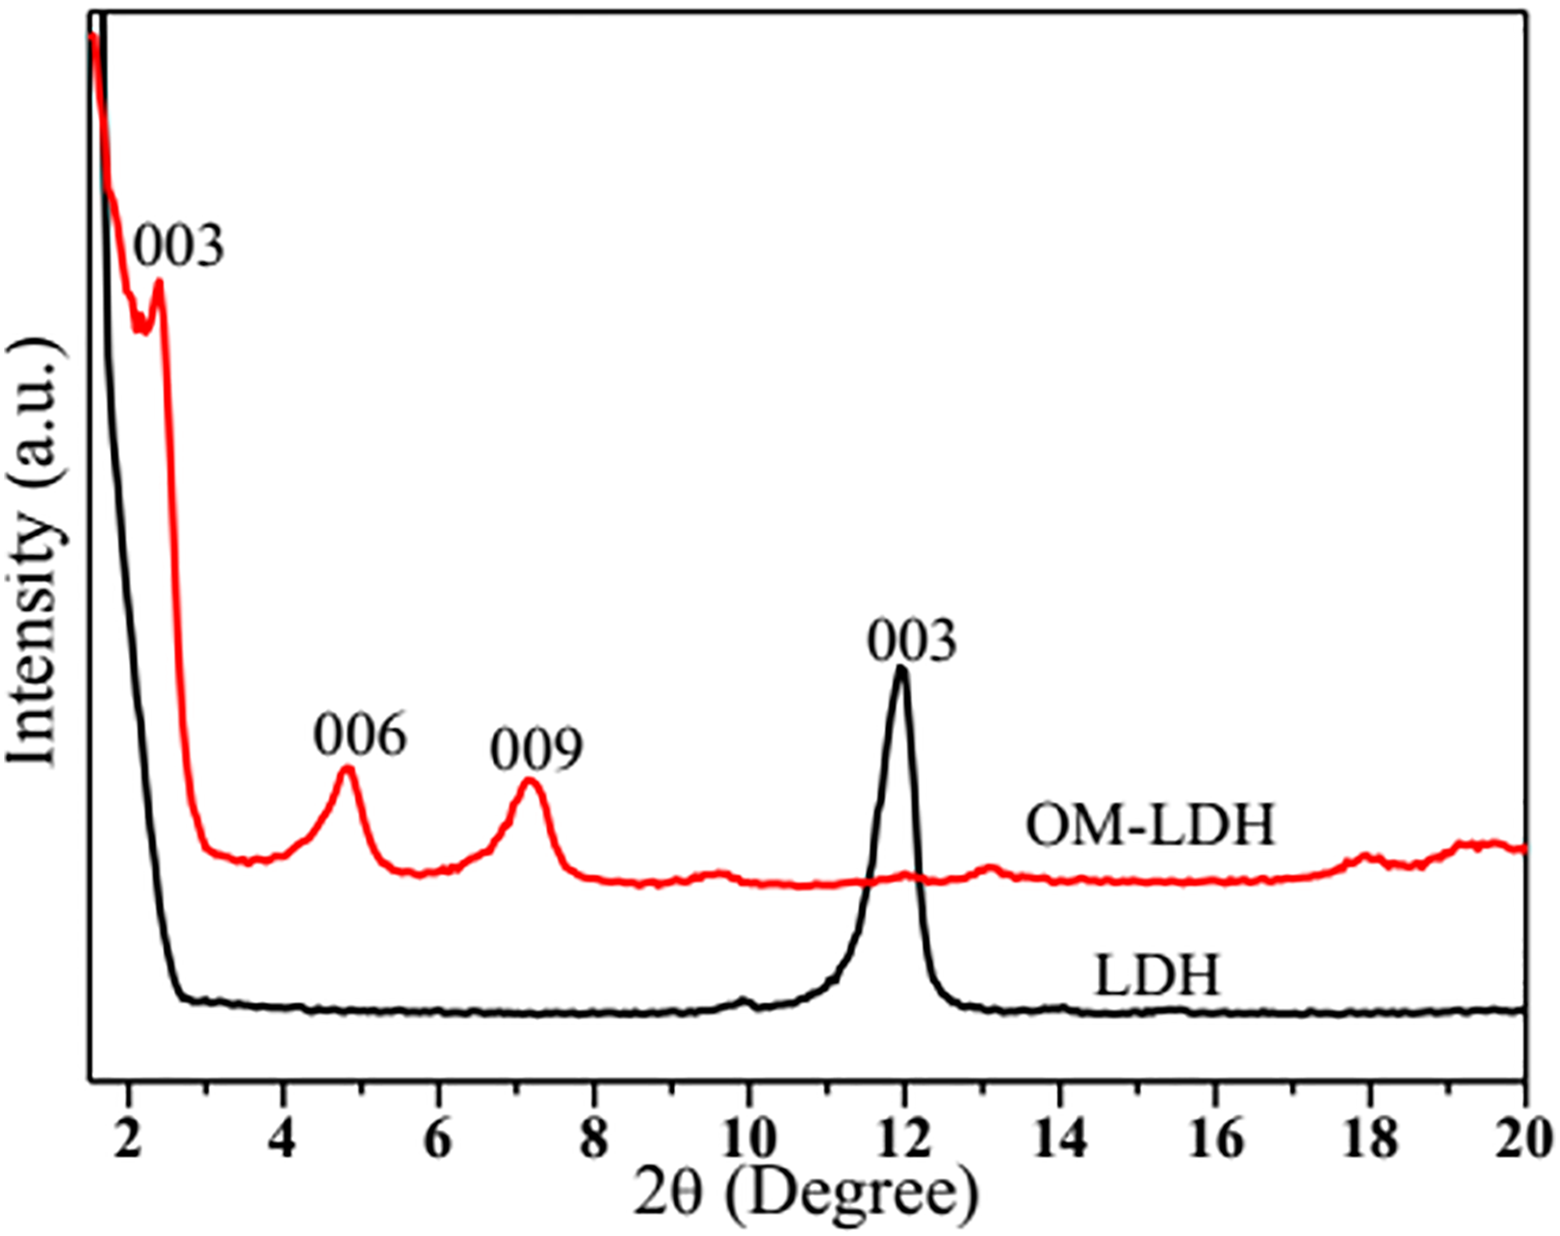
XRD traces for LDH and OM-LDH. OM-LDH: organically modified layered double hydroxide; LDH: layered double hydroxide; XRD: X-ray diffraction.
To investigate the changes in the morphology of LDH and OM-LDH, SEM images of the powder samples were carried out. Figure 4 presents the morphologies of LDH and OM-LDH as revealed by SEM. The image of unmodified LDH shows hexagonal plate-like NPs with flat surface, as commonly observed for the typical inorganic anionic intercalated LDH compounds. In comparison, it is observed that OM-LDH loses their ordered stacking structure (Figure 4(c) and (d)). In addition, the rough surface and irregular crystal size are seen for OM-LDH, which is caused by the organic intercalation and the long reaction time in the LDH layers. This also indicates that LDH has been successfully organo-modified. Based on the analyses by XRD, FTIR, and SEM, it can be concluded that MAPK is intercalated into the LDH layers already, resulting in the exfoliated LDH. Similar results were found in other investigations. 22,35 One main aim of this study is to prepare the OM-LDH with MAPK anion in order to yield intercalated or exfoliated structure. The intercalation of MAPK into the LDH layers decreases the hydrophilic character. As a result, this will enhance the characteristics of interface between organic and inorganic phases. 36 This can allow polymeric molecules and the hydrophobic materials to diffuse between the LDH layers more easily.

SEM micrographs of LDH (a, b) and OM-LDH (c, d). SEM: scanning electron microscopy; OM-LDH: organically modified layered double hydroxide; LDH: layered double hydroxide.
The comparison of the TGA curves of OM-LDH with that of LDH gives an indication of how the interlayer surfactant anions influence the decomposition of the host material. As shown in Figure 5, the TGA curve of LDH suggests a three-stage decomposition process. The first weight loss below 200°C accounting for 12% total mass loss is related to the removal of absorbed water molecules and interlayer water molecules. The second stage between 200°C and 350°C accounting for 12% of total mass loss is correlated with the dehydroxylation of the metal hydroxide layer. The third mass loss between 370°C and 500°C contributing 21% of the total mass loss is assigned to the removal of interlayer carbonate ions and the simultaneous dehydroxylation. In this step, the layered structure of hydrotalcite is destroyed and formed mixed oxide structure. But the organic modification of LDH changes its thermal decomposition behavior in comparison to LDH. The TGA curve of OM-LDH shows a two-stage decomposition process. The first weight loss stage below 200°C is related to the loss of absorbed water molecules and interlayer water molecules. The lower weight loss suggests that OM-LDH is hydrophobic after organic modification. At the second stage, a large mass loss is related to the decomposition of interlayer anions and the dehydroxylation of the metal hydroxide layer. Compared with LDH, the residual mass percent of OM-LDH decreases because a large number of organic groups reduce the thermal stability of the hydrotalcite. In addition, the larger mass loss step for OM-LDH compared to LDH confirms the presence of MAPK in LDH layers.

TGA curves of LDH and OM-LDH. TGA: thermogravimetric analysis; OM-LDH: organically modified layered double hydroxide; LDH: layered double hydroxide.
Characterization of the nanocomposites
Figure 6 shows the FTIR spectra of LDPE/EVA, LDPE/EVA/LDH (6 wt%) and LDPE/EVA/OM-LDH (6 wt%). It can be observed that all the spectra are very similar and show the same bands, which is attributed to the low concentration of LDH and OM-LDH. In comparison with the spectrum of LDPE/EVA, the formation of new absorption band at 1355 cm−1 is attributed to the

FTIR spectra of the nanocomposites: (a) LDPE/EVA, (b) LDPE/EVA/LDH (6 wt%), and (c) LDPE/EVA/OM-LDH (6 wt%). FTIR: Fourier transform infrared; OM-LDH: organically modified layered double hydroxide; LDH: layered double hydroxide; LDPE/EVA: low-density polyethylene/ethylene–vinyl acetate.
One of the complementary techniques to characterize the extent of intercalation and delamination of the nanofiller which has layered structure is XRD analysis. The XRD patterns of the nanocomposites are shown in Figure 7. For LDPE/EVA, two characteristic reflections at 21.7° and 23.9° corresponding to the (110) and (200) planes are observed. In addition, the XRD patterns of LDPE/EVA/OM-LDH nanocomposites show similar patterns found in LDPE/EVA between 20° and 25° in 2θ. After the addition of fillers, it is found that the characteristic peaks for LDH and OM-LDH in small angle range demonstrate the existence of layered structured, indicating that LDH and OM-LDH are hardly delaminated in LDPE/EVA by melt blending method. In addition, the basal reflections of OM-LDH show almost no shift in LDPE/EVA/OM-LDH nanocomposites. For LDPE/EVA/OM-LDH nanocomposites, with increasing OM-LDH loading, the intensity of the (003) reflection correspondingly increases. These results indicate that OM-LDH has been successfully introduced into the polymer matrix.

XRD patterns of the LDPE/EVA/OM-LDH nanocomposites are approximately in the range of 2θ = 1.5°–30°: (a) LDPE/EVA, (b) LDPE/EVA/LDH (6 wt%), (c) LDPE/EVA/OM-LDH (2 wt%), (d) LDPE/EVA/OM-LDH (4 wt%), (e) LDPE/EVA/OM-LDH (6 wt%), and (f) LDPE/EVA/OM-LDH (8 wt%). XRD: X-ray diffraction; OM-LDH: organically modified layered double hydroxide; LDH: layered double hydroxide; LDPE/EVA: low-density polyethylene/ethylene–vinyl acetate.
The SEM analyses of cryo-fractured surfaces of LDPE/EVA/LDH (6 wt%) and LDPE/EVA/OM-LDH (6 wt%) nanocomposites are shown in Figure 8. It is clearly seen from Figure 8(a) and (b) that LDPE/EVA is a compatible blend. The fillers in both LDPE/EVA/LDH (6 wt%) and LDPE/EVA/OM-LDH (6 wt%) samples disperse well, as shown in Figure 8(c) and (e). The fracture surface of LDPE/EVA/LDH (6 wt%) displays a smooth surface between the matrix and the fillers, and some fillers pullout is observed. However, for LDPE/EVA/OM-LDH (6 wt%), the sample evidences the presence of a comparably rough surface, and the interface between the fillers and matrix is blurred. Furthermore, compared with LDH, the organic modification of LDH provides a better binding force between the substrate and the fillers and also enhances the compatibility between OM-LDH and polymer matrix.

SEM micrographs of (a, b) LDPE/EVA, (c, d) LDPE/EVA/LDH (6 wt%), and (e, f) LDPE/EVA/OM-LDH (6 wt%). SEM: scanning electron microscopy; OM-LDH: organically modified layered double hydroxide; LDH: layered double hydroxide; LDPE/EVA: low-density polyethylene/ethylene–vinyl acetate.
Thermal stability of the nanocomposites
Figure 9 shows the TGA and Deriv. Thermogravimetric (DTG) profiles for LDPE/EVA, LDPE/EVA/LDH (6 wt%) and LDPE/EVA/OM-LDH (6 wt%). The relative temperatures at which 5% (Tonset), 10% (T10%), and 50% (T50%) weight loss occur and the temperature at maximum mass loss rate (Tmax) are presented in Table 1. LDPE/EVA is observed to begin to decompose at around 444.31°C under N2 atmosphere. From 450°C to around 520°C, LDPE/EVA experiences a fast degradation till only very little residue is left and the Tmax is 493.55°C. The initial decomposition temperatures of LDPE/EVA/LDH (6 wt%) and LDPE/EVA/OM-LDH (6 wt%) nanocomposites are lower than that of LDPE/EVA, which probably attributes to the earlier decomposition of the additives. Compared with LDPE/EVA/LDH (6 wt%), the Tonset of LDPE/EVA/OM-LDH (6 wt%) decreases due to a lower thermal stability of MAPK. From the DTG curves, a new but very small peak appears at lower temperatures (Tpeak = 325 ± 2°C), which might be due to the presence of MAPK in the nanocomposites. The P–O bond of low molecular organo-phosphorus compound attributes to the loss at lower temperatures. 37 However, the Tmax and T50% of LDPE/EVA/OM-LDH (6 wt%) is higher than that of LDPE/EVA/LDH (6 wt%). The result reflects that the composites with OM-LDH exhibit higher thermal stability than the composites with LDH at higher temperature.

TGA and DTG curves of LDPE/EVA, LDPE/EVA/LDH (6 wt%), and LDPE/EVA/OM-LDH (6 wt%) nanocomposites. TGA: thermogravimetric analysis; OM-LDH: organically modified layered double hydroxide; LDH: layered double hydroxide; LDPE/EVA: low-density polyethylene/ethylene–vinyl acetate.
TGA data of LDPE/EVA/OM-LDH nanocomposites.

TGA: thermogravimetric analysis; OM-LDH: organically modified layered double hydroxide; LDPE/EVA: low-density polyethylene/ethylene–vinyl acetate; LDH: layered double hydroxide. Tonset: mass loss 5% rate of the temperature; T10%: mass loss 10% rate of the temperature; T50%: mass loss 50% rate of the temperature; Tmax: maximum mass loss rate of temperature.
Figure 10 shows TGA and DTG curves of the LDPE/EVA/OM-LDH composites containing 0 wt%, 4 wt%, 6 wt%, and 8 wt% OM-LDH. The corresponding data are also summarized in Table 1. As shown in Figure 10, the LDPE/EVA/OM-LDH nanocomposites start to decompose at a lower temperature compared with LDPE/EVA, which is due to the earlier decomposition of OM-LDH. In addition, the Tmax and T50% values of the nanocomposites shift to higher temperatures with increasing content of OM-LDH and then slightly decrease when it contains 8 wt% OM-LDH, which may be due to the increase of OM-LDH aggregation. Compared with LDPE/EVA, the addition of 4 and 8 wt% of OM-LDH doesn’t improve the thermal stability of the polymer matrix. However, LDPE/EVA/OM-LDH nanocomposites containing 6 wt% OM-LDH show a better thermal stability than that of LDPE/EVA at high temperatures. These results reveal that the thermal property will be enhanced if an appropriate content of OM-LDH is incorporated into the LDPE/EVA matrix.

TGA and DTG curves of LDPE/EVA/OM-LDH nanocomposites with different contents of OM-LDH. TGA: thermogravimetric analysis; OM-LDH: organically modified layered double hydroxide; LDPE/EVA: low-density polyethylene/ethylene–vinyl acetate.
Crystallization and melting behaviors of the nanocomposites
The crystallization and melting processes of LDPE/EVA, LDPE/EVA/LDH (6 wt%) and LDPE/EVA/OM-LDH (6 wt%) are investigated by DSC, and the results are shown in Figure 11. The relative Xc values are also presented in Table 2. The melting temperature (Tm) and the crystallization temperature (Tc) for LDPE/EVA are found to be 93.9°C and 107.5°C, respectively. The Tm and Tc values of the nanocomposites are very close to that of LDPE/EVA. As shown in Table 2, the Xc of LDPE/EVA is 35.9%. The Xc decreases to 28.9% for LDPE/EVA/LDH (6 wt%) nanocomposites, while the Xc increases to 43.4% for LDPE/EVA/OM-LDH (6 wt%) nanocomposites.

DSC crystallization and melting curves of LDPE/EVA, LDPE/EVA/LDH (6 wt%), and LDPE/EVA/OM-LDH (6 wt%) nanocomposites. DSC: differential scanning calorimetry; OM-LDH: organically modified layered double hydroxide; LDH: layered double hydroxide; LDPE/EVA: low-density polyethylene/ethylene–vinyl acetate.
DSC results for LDPE/EVA/OM-LDH nanocomposites.

DSC: differential scanning calorimetry; OM-LDH: organically modified layered double hydroxide; LDPE/EVA: low-density polyethylene/ethylene–vinyl acetate; LDH: layered double hydroxide.
Figure 12 presents the DSC curves for LDPE/EVA/OM-LDH nanocomposites with different contents of OM-LDH and the detailed data are also listed in Table 2. In theory, there exist two different peaks both in the crystallization and melting curves for each sample: one for LDPE and another for EVA. But in our work, the percent of EVA is much less than that of LDPE, so the crystallization and melting behaviors of LDPE are the focus of our research. It is clearly observed that the Tm and Tc values of the nanocomposites are found to be almost the same with that of LDPE/EVA. Moreover, the Xc of the nanocomposites increases gradually with increasing content of LDH and then slightly decreases when the OM-LDH content is 8 wt%, but still higher than that of LDPE/EVA. The DSC results suggest that small amounts of OM-LDH increase the crystallization degree of the matrix, in agreement with previous reports, can be explained by the heterogeneous nucleation effect of OM-LDH layers in the polymer matrix. 38
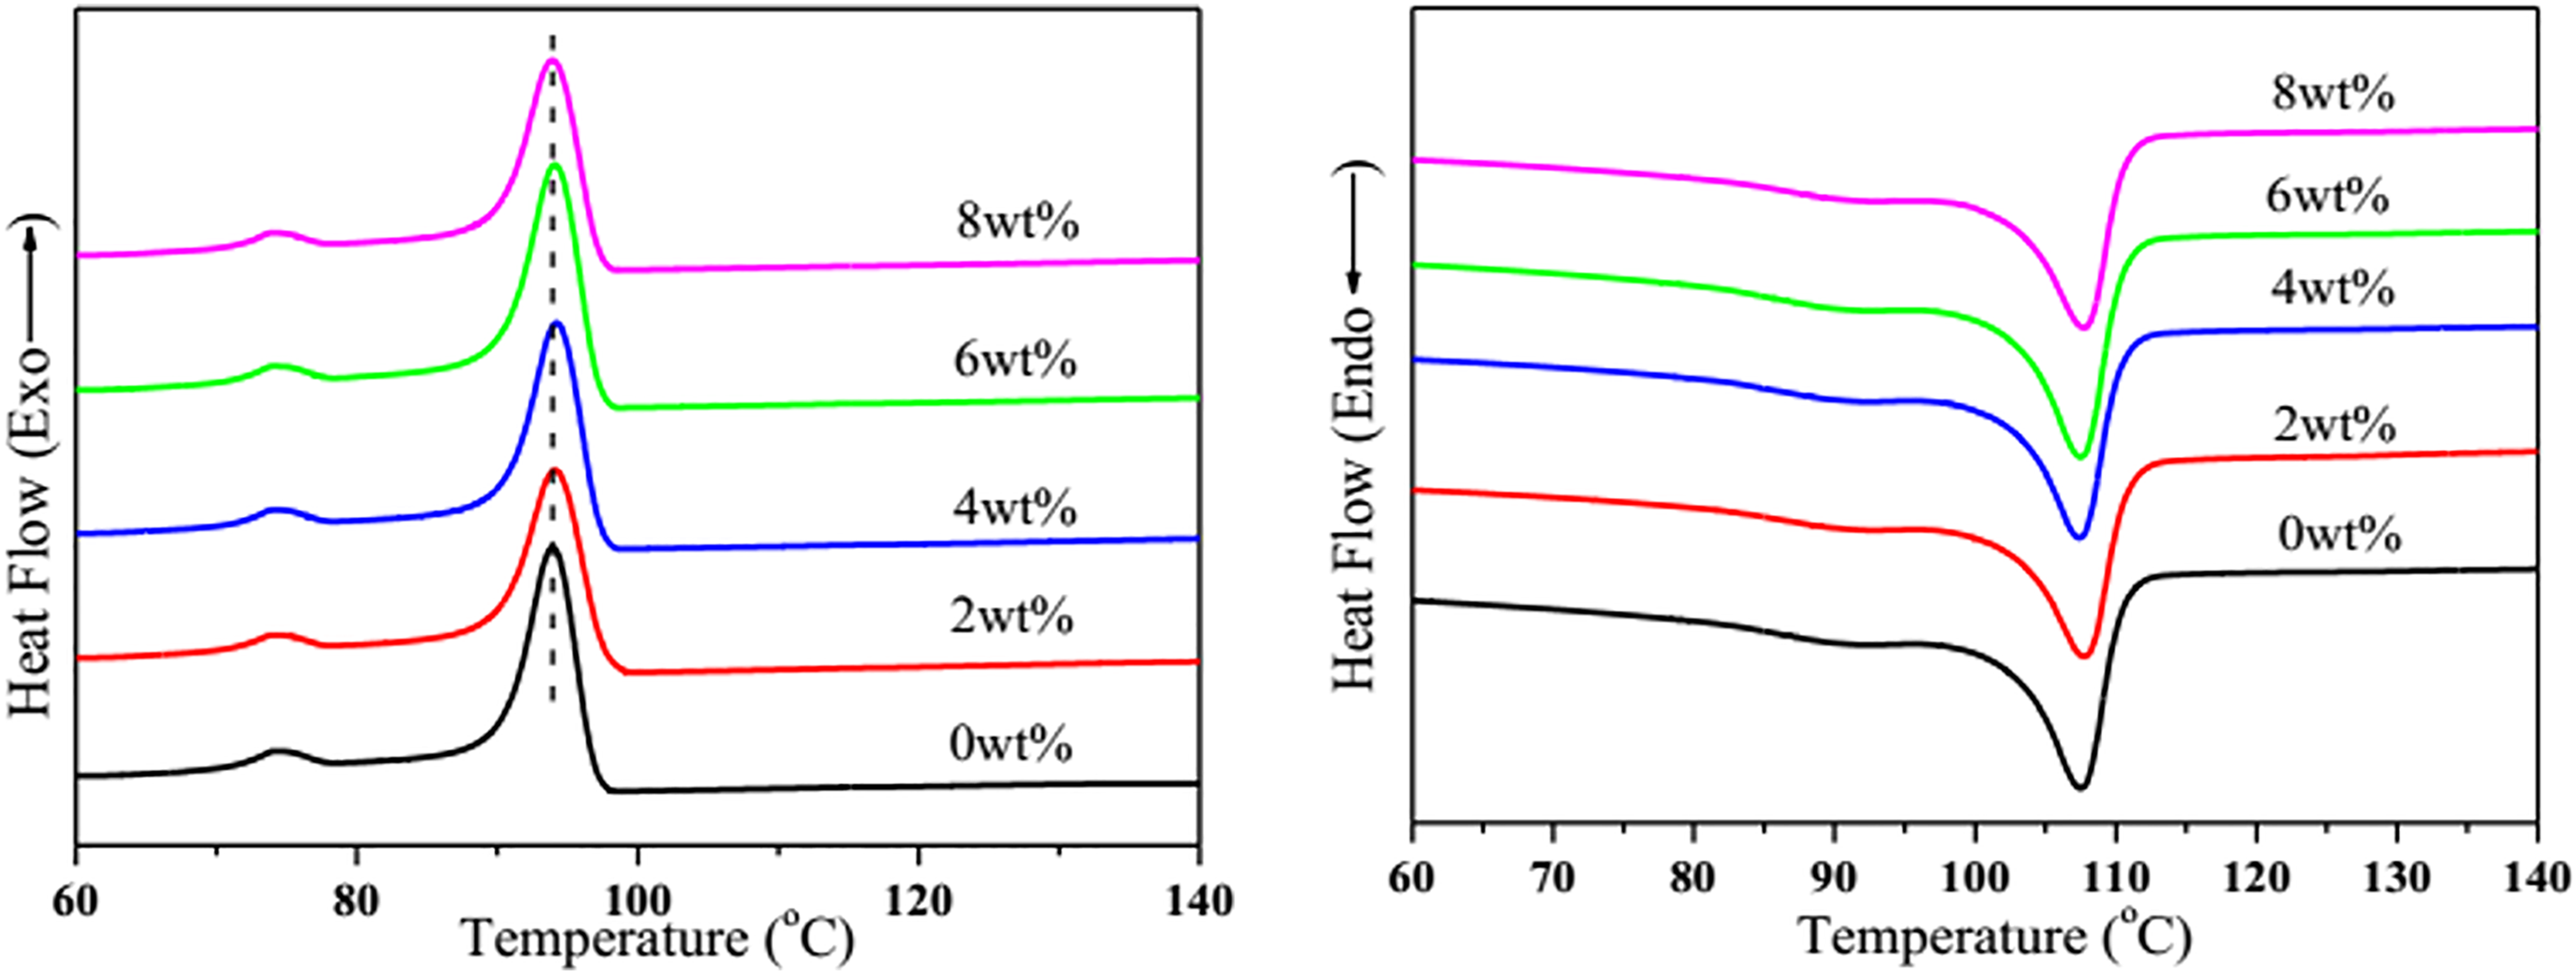
DSC crystallization and melting curves of LDPE/EVA/OM-LDH nanocomposites with different contents of OM-LDH. DSC: differential scanning calorimetry; OM-LDH: organically modified layered double hydroxide; LDPE/EVA: low-density polyethylene/ethylene–vinyl acetate.
Tensile property of the nanocomposites
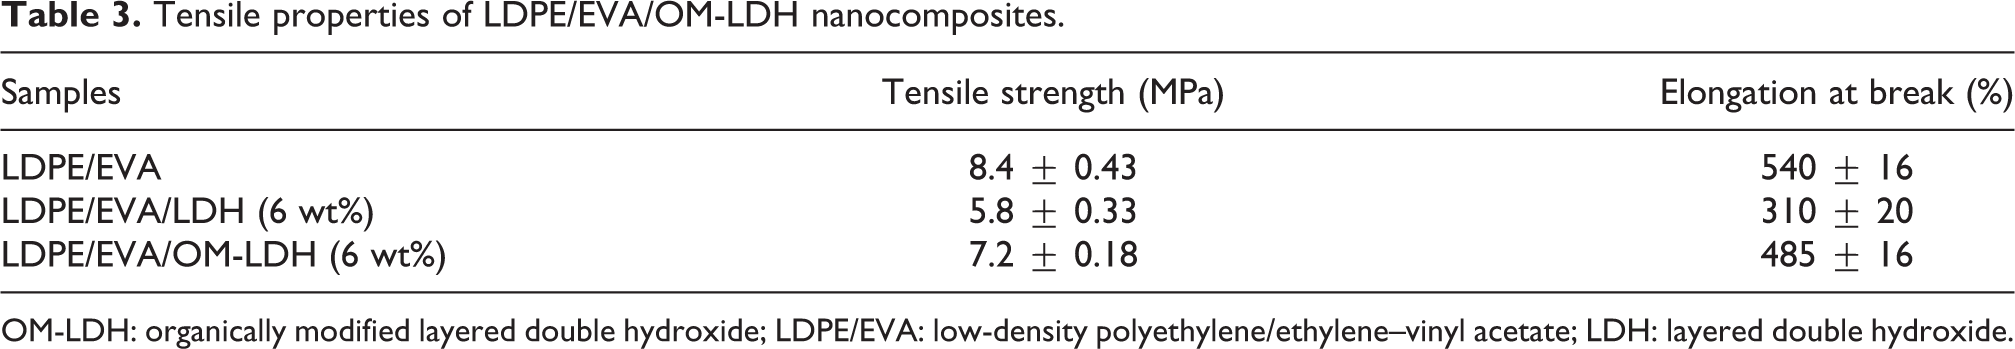
The tensile stress–strain curves of LDPE/EVA, LDPE/EVA/LDH (6 wt%) and LDPE/EVA/OM-LDH (6 wt%) nanocomposites are evaluated and shown in Figure 13, and the detailed data are presented in Table 3. It is obviously observed from Figure 13 and Table 3 that the clays do not cause any mechanical reinforcement compared to LDPE/EVA. It is found that both the tensile strength and elongation at break show a decreasing trend with the addition of LDH or OM-LDH. Fortunately, the tensile strength and the elongation at break of LDPE/EVA/OM-LDH (6 wt%) are 7.2 MPa and 485%, which are increased by 24.1% and 56.5%, respectively, compared to that of LDPE/EVA/LDH (6 wt%). The enhancement of mechanical properties might be attributed to the better additive–matrix compatibility and good interfacial adhesion between the matrix and OM-LDH, which also can be seen in the SEM micrographs (shown in Figure 8). Obviously, the good mechanical performances greatly increase the commercial values and extend the application fields of the nanocomposites.
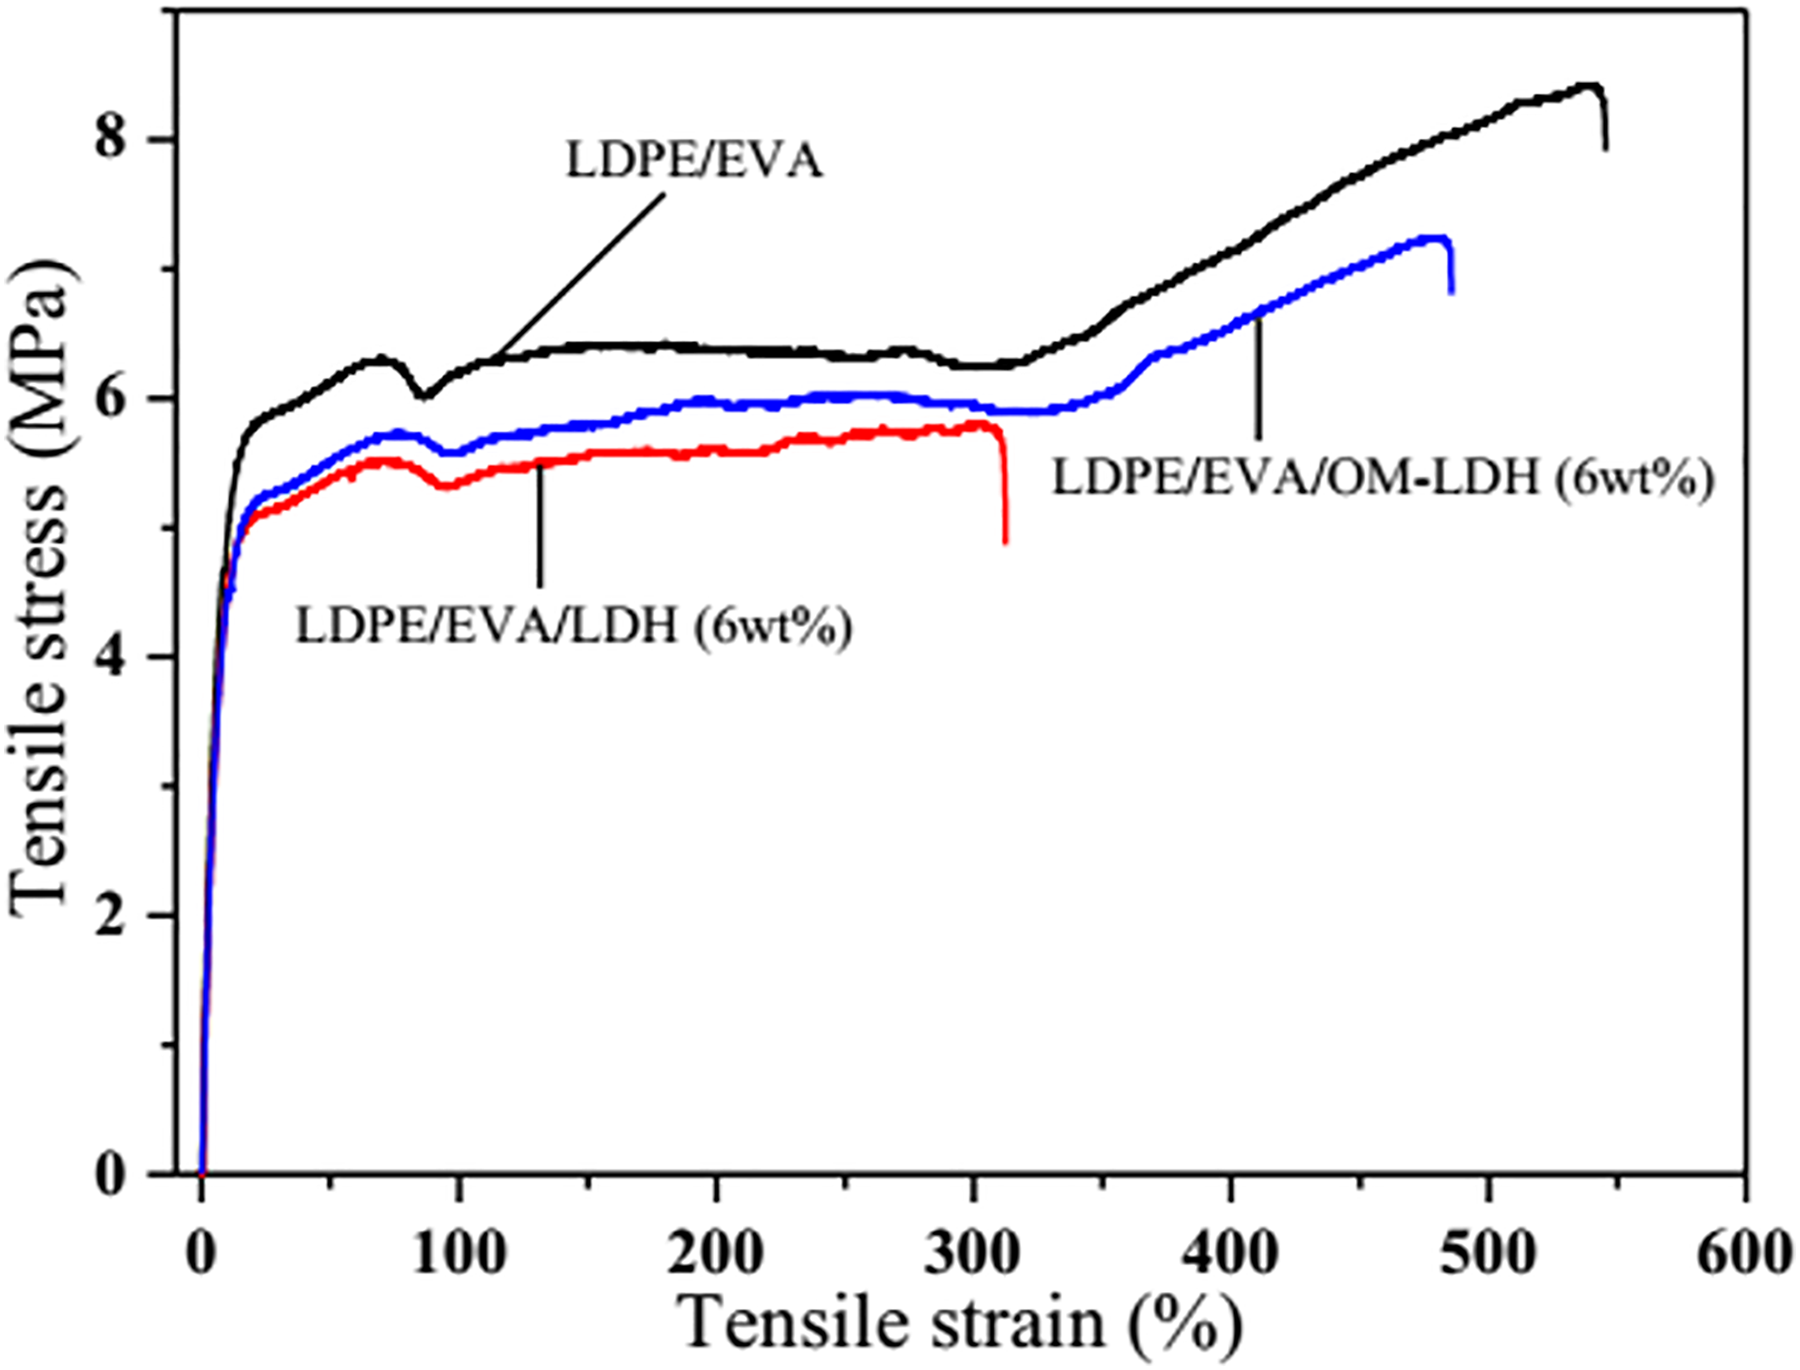
Comparison of tensile behaviors of LDPE/EVA, LDPE/EVA/LDH (6 wt%), and LDPE/EVA/OM-LDH (6 wt%) nanocomposites. OM-LDH: organically modified layered double hydroxide; LDPE/EVA: low-density polyethylene/ethylene–vinyl acetate; LDH: layered double hydroxide.
Tensile properties of LDPE/EVA/OM-LDH nanocomposites.
OM-LDH: organically modified layered double hydroxide; LDPE/EVA: low-density polyethylene/ethylene–vinyl acetate; LDH: layered double hydroxide.
Conclusions
In this contribution, MAPK is used for the preparation of OM-LDH by ion-exchange reaction. The XRD and FTIR results confirm that MAPK is intercalated into the interlayer region of MgAl-LDH and enlarged the interlayer distance, which means OM-LDH has been modified successfully. The LDPE/EVA/OM-LDH nanocomposites are fabricated by melt blending process. The incorporation of either LDH or OM-LDH within LDPE/EVA matrix is confirmed by the XRD and FTIR results, which revealed an existence of intercalated LDH and OM-LDH in polymer matrix. It is found that LDPE/EVA/OM-LDH nanocomposites show higher thermal stability than LDPE/EVA/LDH (6 wt%) at a higher temperature due to the better dispersion and compatibility of OM-LDH in the polymer matrix. The DSC results of LDPE/EVA/OM-LDH exhibit an increase in Xc compared to LDPE/EVA. In addition, the tensile strength and elongation at break of LDPE/EVA/OM-LDH (6 wt%) nanocomposites are much higher than that of LDPE/EVA/LDH (6 wt%) nanocomposites.
Footnotes
Authors’ note
MT is co-first author.
Declaration of conflicting interests
The author(s) declared no potential conflicts of interest with respect to the research, authorship, and/or publication of this article.
Funding
The author(s) disclosed receipt of the following financial support for the research, authorship, and/or publication of this article: This work was financially supported by the National Natural Science Foundation of China (51763002), Opening Project of State Key Laboratory of Polymer Materials Engineering (Sichuan University) (2017-4-02), International Science and Technology Cooperation Project of Chengdu City (2017-GH02-00051-HZ, 2015-GH02-00034-HZ), Guizhou Province Science and Technology Project Foundation ([2017]5788), and National 863 Project Foundation of China (2015AA034202).