
Abstract
The entitled technical subject in its comprehensive and broadly viewed study is presented by stating that the prevailing glass fiber–reinforced plastic composites play a vital role in replacing the metallic structures in automotive, aerospace, and marine applications and their more usage necessitates the better understanding of such structure’s damage and effective repair practices of the same. In the course of repairing the composite structures, optimum usage of patch material helps to maintain the original strength, eliminate “over design,” and reduce contribution to the substantial performance change of original structure. Optimum usage of repair material brings down the significant percentage of mass and repair cost. In order to apply the concept of optimum patch shapes over actual structures, it is important to design such effective shapes which are equivalent to the conventionally proven repair designs in strength perspective. This technical paper describes one of such ways to design the optimum patch shape using finite element analysis (FEA) tool and in comparison with one of the conventional repair practices, like circular patching, used circular, rectangular, square, elliptical and trapezoidal patch shapes, each of which has its own merits and demerits when compared to the other. But, none of them was arrived at in the perspective to use the minimum material to repair the damage. The object of this work is carried out in order to arrive at the optimum patch shape (minimum material in its in-plane direction) in repairing the damaged structure and it has been demonstrated using π/4 quasi-isotropic E-glass/epoxy specimen with hole using FEA. Moreover, the effectiveness of optimum patch shape design in “strength” and “load transfer efficiency” perspectives is experimentally proven and highlighted by the scope of repair material saving (36%) in repair practice by the usage of this optimized approach, as well.
Introduction
The composite repair practices are well established. 1 -18 Despite the availability of so many books and technical papers for different patch designs of polymer composites, only a few papers are published in optimizing the patch designs for which the reason is provided that the “conservative approach” yields some extent of factor of safety around damage zones to avoid unnecessary complications. But today, everyone across the globe has the responsibility to make possible contribution in reducing the carbon footprint and pollution control, in order to sustain healthy environment. Considering this point, new patch shape (optimized) design is made with the help of finite element analysis (FEA) tool (OptiStruct). This design attempt, certainly, will pave the way for significant mass reduction of the repair patch. Prior to detailing the present work, the reading across the past of optimization activities on patch designs will justify the attempt of this design work.
With the optimum profiles of the adherends, lap joints can be made where shear stress in the adhesive layer is constant which increases the load carrying capability of the adhesive. 19 Optimization procedure, in order to arrive at the optimum notches in three-dimensional (3-D) elasticity problems, is recommended by the application of fade-away law. 20 Through-thickness shape optimization method is presented to minimize the elastic stress concentration in adhesive lap joints. The intention is to arrive at the constant shear stress in the outer part of the adhesive. With the arrival of optimized patch shapes, peel stresses are well below the shear stresses. 21 Structural shape optimization, based on the mechanism of biological growth, behavior of tree, it has been developed to reduce the local notch stress magnitudes in 2-D and 3-D elastic structures. 22 Through-thickness shape optimization on single lap joint, double lap joint, double strap joint, and console. The work is focused to optimize the stresses in the whole adhesive layer. 23 An iterative gradient-less optimization of hole shapes in flat specimens and bonded double lap joints is done to minimize the stress magnitudes and retain the effectiveness of reinforcement. 24 Through-thickness shape optimization (sensitivity-based finite element method) of bonded repairs and lap joints. It is used to optimize both the adhesive layer and repair material. 25 A numerical method to structural shape and topology optimization demonstrates the ability to handle the topology changes, reliability of boundary definition, and certain extent of automation, compared with boundary variation or homogenization methods. 26 Through-thickness shape optimization of typical double lap joints in view of cyclic and static loading. 27 Through-thickness shape optimization of typical double lap, metal to metal bonded repair joints subject to fatigue loadings. It is understood that taper angle strongly contributes on fatigue performance of repair patch. 28 Design of experiments (DOEs) method is used to investigate the effect of parameters such as size, patch, properties of adhesive and the specimen so as to obtain an optimization of the repair operation. 29 The optimization methods such as gradient-based, direct search, heuristic, and specialized techniques are used to obtain the constant stiffness design (uniform optimal stacking sequence for the entire structure) in composites. 30 The similar optimization algorithms are used to accomplish the variable stiffness design (the structure carries multiple substructures and each of them has a different stacking sequence) in composites. 31
So far, optimization techniques are used to achieve the through-thickness optimization (shape optimization) of adherends, adhesives, optimum profiles to bring down the stress magnitudes, general topology optimization boundaries, and optimum stacking sequence to achieve constant and variable stiffness designs in composites. Henceforth, the usage of FEA and optimization tools, on optimizing the in-plane patch designs, are presented.
Though, it is not full-fledged optimization process, 3-D FEA is used to study the performance of rectangular and trapezoidal patch shapes in airplane designs. The use of trapezoidal patch design brings down the stress intensity factor (SIF) and mass of the patch. In turn, it reduces the repair cost. 32 Using numerical analysis, it is presented that the performance of the rectangular patching over MODE-I crack can be improved by using an “H” shape patch design. Further transformation of “H” shape toward arrow design also improves the performance by bringing down the mass of the patch. 33 The optimization DOEs finds the most contributing parameter on the repair performance. The increase of the patch dimensions significantly brings down the J integral at the crack tip. 34 The different patch shapes such as circle, rectangle, square, ellipse, octagon, and extended octagon are considered to repair the inclined center cracked composite panel as a movement toward optimization of patch shape. Also, it is noticed that extended octagonal patch shape offers better performance in reducing SIF. 35 A genetic algorithm approach in combination of FEA is used for understanding the optimum ready patch geometries and adhesive thickness to achieve higher repair performance on quasi-isotropic carbon fiber reinforced plastic (CFRP) panels. 36 Optimum patch design is characterized by strength ratio. The experimental and analytical procedure, followed in minimizing the maximum strength ratio, is presented using quasi-isotropic CFRP composite specimens. 37
After studying all these optimization works, it is evident that optimum taper profile at the end of adherend has been successfully arrived at by using optimization (shape optimization) tool. Likewise, in patch repair practice, till now, in-plane optimum profile is not arrived yet. Most of the works were carried out in understanding the readily available patch shapes and performance improvement of the same. Recently, optimum patch shape design has been arrived at by using FEA tool and the mass saving of 36% has been achieved while compared to circular patch design. Also, the strength and stiffness characteristics were maintained similar to original undamaged structure. 38
Algorithm for the topology optimization has been proposed and implemented in MATLAB to achieve the different patch shape. 39
Present work is the self-research work which includes the experimental validation. In this work, attempt has been made for more clarity to arrive at in-plane optimum patch design using topology optimization tool (OptiStruct) and also the established design relations for optimum patch design. This work is demonstrated using π/4 quasi-isotropic E-glass/epoxy laminate specimens evaluation of the design by getting carried out experimentally.
Present work
Tensile properties study of π/4 quasi-isotropic E-glass/epoxy laminate
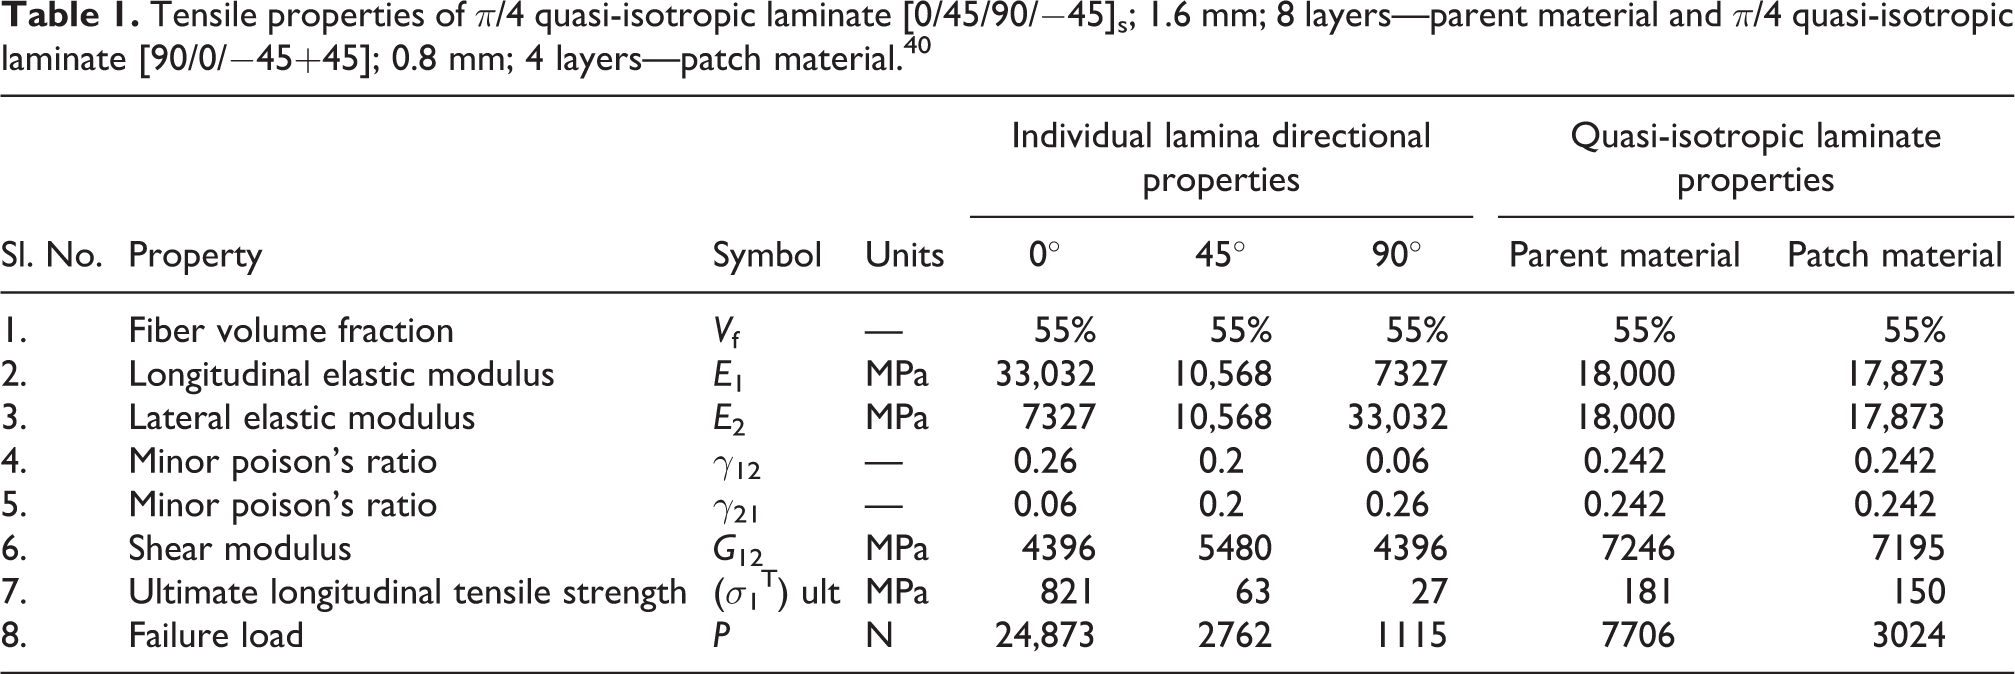
Before carrying out any design activity, it is important to have the material properties. Hence, firstly, tensile properties of π/4 quasi-isotropic E-glass/epoxy laminates (specimens with parent and patch laminates) are established using conventional universal testing machine (UTM). For this work, each five specimens on parent and patch laminates is considered with the size of 1.6 × 25 × 250 mm3 and 0.8 × 25 × 250 mm3, respectively. The observation, in results, is recorded in the Table 1. The properties which arrived at tensile testing are used in FEA to derive the optimized patch shape. The specimen photographs and failure analysis of the specimens which were used to understand the tensile properties are not detailed in this article. But, the work of Gopalakrishnan et al. 40 offers very good picture of the same.
Tensile properties of π/4 quasi-isotropic laminate [0/45/90/−45]s; 1.6 mm; 8 layers—parent material and π/4 quasi-isotropic laminate [90/0/−45+45]; 0.8 mm; 4 layers—patch material. 40
Novel patch shape design using topology optimization technique
The optimum patch shape design is obtained using FEA tool (OptiStruct). This optimum patch shape is arrived at in such a way that it retains the same stiffness of undamaged structure (specimen without hole). The deflection pattern observed on the circumference of diameter 10 mm at the center of specimen without hole is maintained while arriving at the optimized patch for specimen with hole. This work offers the optimum material distribution required (patch shape) to repair the specimen with hole kind of problem under uniaxial tensile loading condition. This patch shape can be used on quasi-isotropic and isotropic material models. The detailed step-by-step procedure (design variable, constraints, and objective), is used in arriving at the optimum patch shape, is demonstrated below.
Design relations for optimum patch shape
The design procedure for optimum patch shape is detailed below. Further, design relations are generated in this work to arrive at the optimum patch shape which are established using one of the CAD tools (AutoCAD). The optimum patch shape, arrived at in this work, is used to repair the π/4 quasi-isotropic E-glass/epoxy laminate specimens with circular hole.
Strength study of π/4 quasi-isotropic E-glass/epoxy laminate repaired using optimum patch design
After the successful design process, it is mandatory to validate the design. Hence, study has been carried out to understand the strength of specimen with hole repaired using optimized patch design. This study is carried out on actual π/4 quasi-isotropic E-glass/epoxy laminate specimens. Moreover, the strength of specimen repaired using optimized patch is compared with specimen repaired using conventional circular patch, specimen without hole, and specimen with hole.
Load transfer efficiency study of π/4 quasi-isotropic E-glass/epoxy laminate repaired using optimum patch design
Load transfer efficiency is another critical aspect that has to be studied in composite repair practices. It is a measure of effectiveness of load transfer from input end to output end. Following to strength study, load transfer efficiency study is extended on all the following four categories of specimens: (1) specimen repaired using optimized patch, (2) specimen repaired using conventional circular patch, (3) specimen without hole, and (4) specimen with hole.
Novel patch shape design
Patch shape design process includes the study of damaged structure, patch shape design for damaged structure, study the damaged structure repaired using newly designed patch shape, and establish design relations to arrive at the patch shape. In the abovementioned four stages of design process, first three stages are accomplished using FEA tool.
Specimen’s response study prior to patch shape design using optimization
Few FEA analyses are required in advance to understand the stress and deflection responses around the damage to successfully design the optimum patch shape using FEA. Linear static structural analyses are carried out on the following specimens: (1) specimen without circular hole damage, (2) specimen with circular hole damage, (3) specimen with circular hole damage repaired using conventional circular patch, to understand the stress and deflection responses prior to diving in to patch-shape optimization. The stress and deflection response of specimen without circular hole damage gives the idea of target responses to be maintained by the optimized patch shape, if it is used to repair the specimen with circular hole damage. The response of specimen with circular hole damage is made to realize the change in SIF due to the damage. The response of specimen with circular hole damage repaired using conventional circular patch gives the idea of typical values in the repaired structures. These responses on the abovementioned specimens which will pave the way to verify the design sufficiency of optimized patch shape to be arrived at.
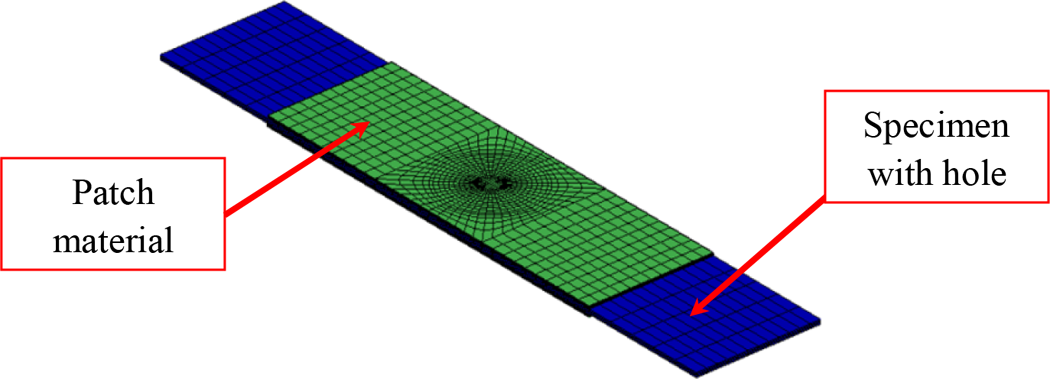
Finite element modeling
The complete preprocessing activities were carried out in HyperMesh and solving (topology optimization) was carried out by using OptiStruct. Also, postprocessing activities were accomplished using HyperView. The same mesh configuration was extended to all the repaired configurations (Figures 1 to 4) analyzed here. The quasi-isotropic material model was considered for parent and patch materials of specimens (Table 1). Quasi-isotropic laminates exhibit isotropic (i.e. independent of direction) in-plane response but are not restricted to isotropic in out-of-plane (bending) response. As this analysis accounts only in-plane direction loading, free-shape optimization of patch and quasi-isotropic assumptions was made. The adhesive bond-line was also simulated as isotropic (Table 2). As the objective of this work is more focused on demonstrating the optimization process, the above said simple material models were considered. The whole specimen is modeled without end tab configuration as it is not required in FEA modeling.
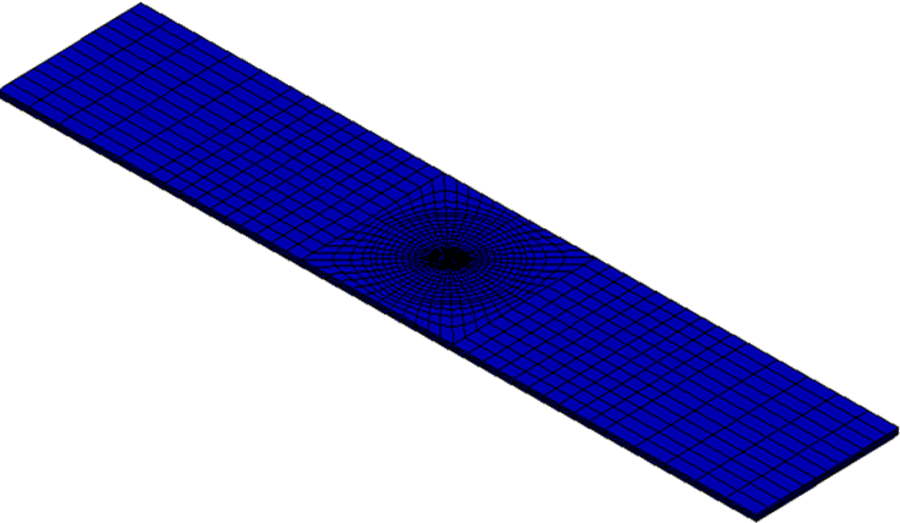
FEA model: Specimen without hole. FEA: finite element analysis.

FEA model: Specimen with hole. FEA: finite element analysis.

FEA model: Specimen with hole repaired using circular patch. FEA: finite element analysis.

FEA model: Specimen with hole repaired using circular patch (detailed view of patch). FEA: finite element analysis.
Mechanical properties of adhesive (manufacturer data). 37

Loads and boundary conditions
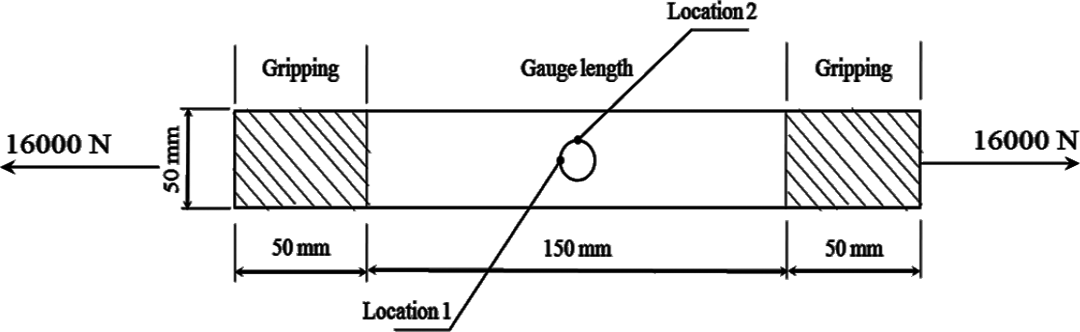
In course of defining loads and boundary conditions, one end of the specimen is “fixed in all directions” and an axial tensile load of 16,000 N is applied at the other end. The load of 16,000 N is approximately the failure load of specimen without hole.
Meshed models
Figures 1 to 4 are the discretized models of specimens considered in this work.
Stress plots
Figures 5 to 7 are stress responses of specimens to understand them prior to enter to patch-shape optimization.

Stress: Specimen without hole.
Stress: Specimen with hole.

Stress: Specimen with hole repaired using circular patch.
Deflection plots
Figures 8 to 10 are deflection responses of specimens to understand them prior to enter to patch-shape optimization.

Axial deflection: Specimen without hole.

Axial deflection: Specimen with hole.

Axial deflection: Specimen with hole repaired using circular patch.
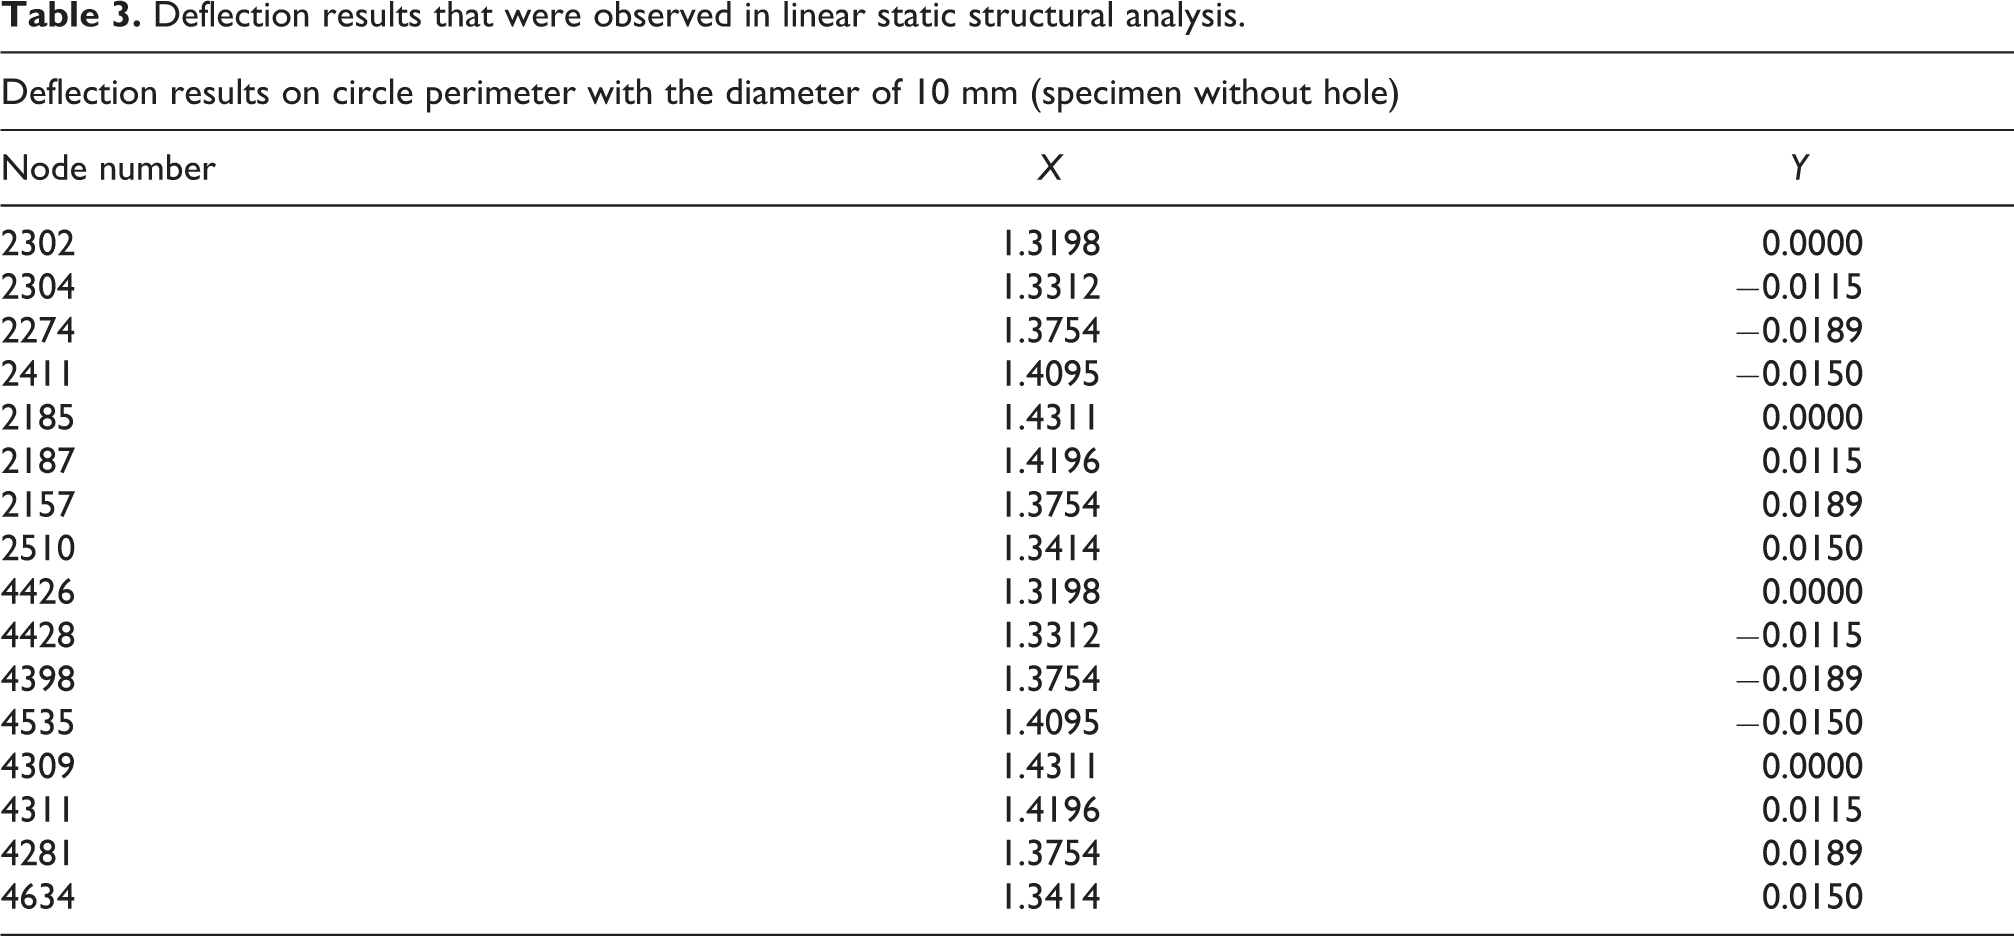
In the process of arriving at the optimized patch, deflections on circle perimeter (diameter of 10 mm) on specimen without hole were recorded, and the same was used as constraints in topology optimization (Table 3).
Deflection results that were observed in linear static structural analysis.
Design of optimized patch shape using topology optimization technique
Optimization approach
OptiStruct is a response-based tool. Responses are of any quantities in the analysis run which can be used as constraints or optimizing parameter. The basic procedure of the optimization problem is as follows:
(1) Define design variables, (2) define design responses, (3) apply constraints to responses, (4) select constraints in subcase information, and (5) select objective in subcase information.
Design variables
The vital role in optimization process is to define the design variables precisely. The unknown shape of the patch, adhesive, and the known shape of the parent materials are defined as design variables. Parent material of the specimen (specimen without hole) is defined as nondesign volume. Patch and adhesive materials are defined as design volume. “Design volume” is the one which will be varied in course of solving different iterations of problem. But, “nondesign volume” will not vary while solving the optimization problem. For this problem, damaged structure (specimen with hole) is defined as nondesign volume and the bulk patch material is defined as design volume.
Design responses
There are three kinds of responses that can be defined in OptiStruct. The first one is analysis results, the second is combinations of analysis results, design variables, constants, grid locations, property relations, and the third is external responses. For this subject problem, volume (patch and adhesive) and deflections (on the hole perimeter) are defined as design responses.
Constraints
Once the responses are successfully defined, suitable responses can be constrained. The Table 3 shows the node number details, on which constraints (deflection) are defined. The deflection values observed are set as constraints to achieve the optimized patch. The nodes 2302, 2304, 2274, 2411, 2185, 2187, 2157, 2510 are nodes over the top of the parent material and the nodes 4426, 4428, 4398, 4535, 4309, 4311, 4281, 4634 are the nodes that lie at the bottom of the parent material. Totally, 16 number of nodes are used to define the displacement constraints in X and Y directions (radial). Of these 16 nodes, 8 nodes on one side and rest of 8 are in the other side in the same sequence. Please refer Figure 11.

Nodes numbers on which deflection responses were observed and constraints imposed during FEA prior to optimization process. FEA: finite element analysis.
Objective function
In OptiStruct, there are three methods to mention an objective. Firstly, a single response can be minimized or maximized. Secondly, it is possible to minimize the maximum value, and thirdly, maximize the minimum value of a number of responses. In this particular problem, minimizing the volume of patch and adhesive (in-plane direction) is defined as an objective. So, it will use optimum material distribution for patch around the damage zone.
Solving method
This particular topology optimization problem is solved by using density method. In topology optimization, material density of each element varies between 0 and 1. It symbolizes the state of void and solid. In this method, the density of each element is used as design variable. Here, the stiffness of the material is understood to be linearly dependent on the density. Considering the efficiency and general suitability, density method is used in this problem. It is the only method capable of applying manufacturing constraints (draw direction, extrusion, pattern grouping, and pattern repetition). This present study has used “pattern grouping concept” to achieve the symmetrical repair patch.
Evolution of optimized model
This topic shows how the optimized patch shape is evolved during the design process. It is demonstrated with three different stages.
The above Figure 12 shows the large patch material (design volume) used prior to optimization process. From this large patch material, optimized patch is arrived at. The amount of shape and size of design volume to be used depends on the boundary that is surrounded by optimized structure, manufacturing feasibility, creativeness of the designer, and the solving capability of computer.
Stage I: Model used to arrive optimized patch (prior to optimization process).
The above Figure 13 shows the element density plot delivered by optimization tool. The boundary that resembles butterfly is an optimum material distribution profile required for the objective and constraints that are specified by the designer. The above optimized design need not be the final one. It can be shaped to suit our requirement, that is, considering the manufacturing feasibility and safety factors in view of further strengthening.
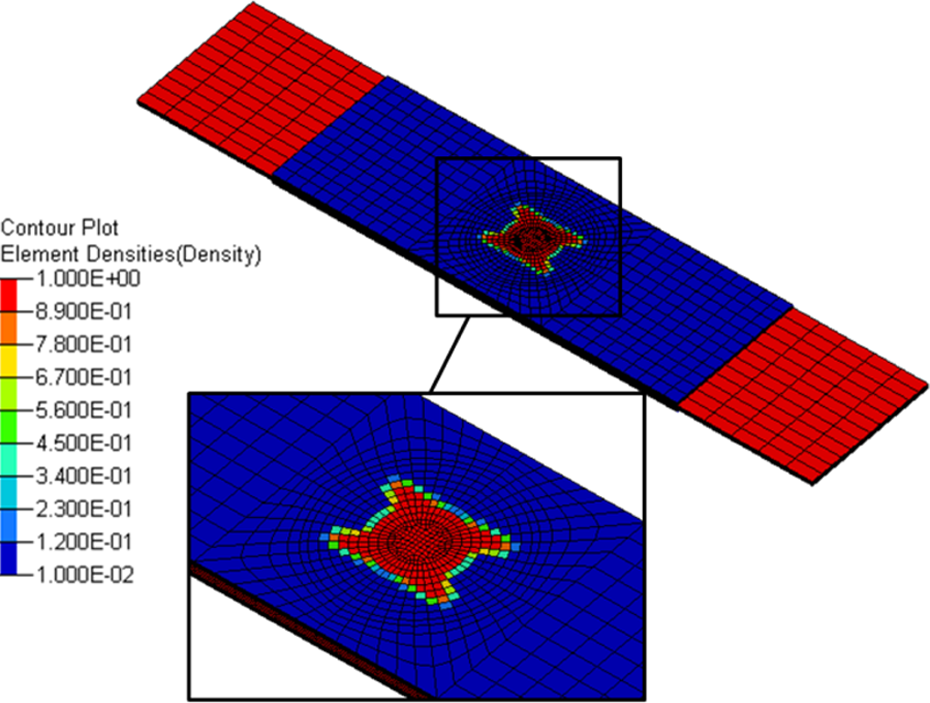
Stage II: Optimization results (element density plot).
Table 4 values are recorded after the optimization run. At the end of optimization process, the solution successfully converged and all constraints defined were met, as evident from Table 4.
Deflection results after optimization process.
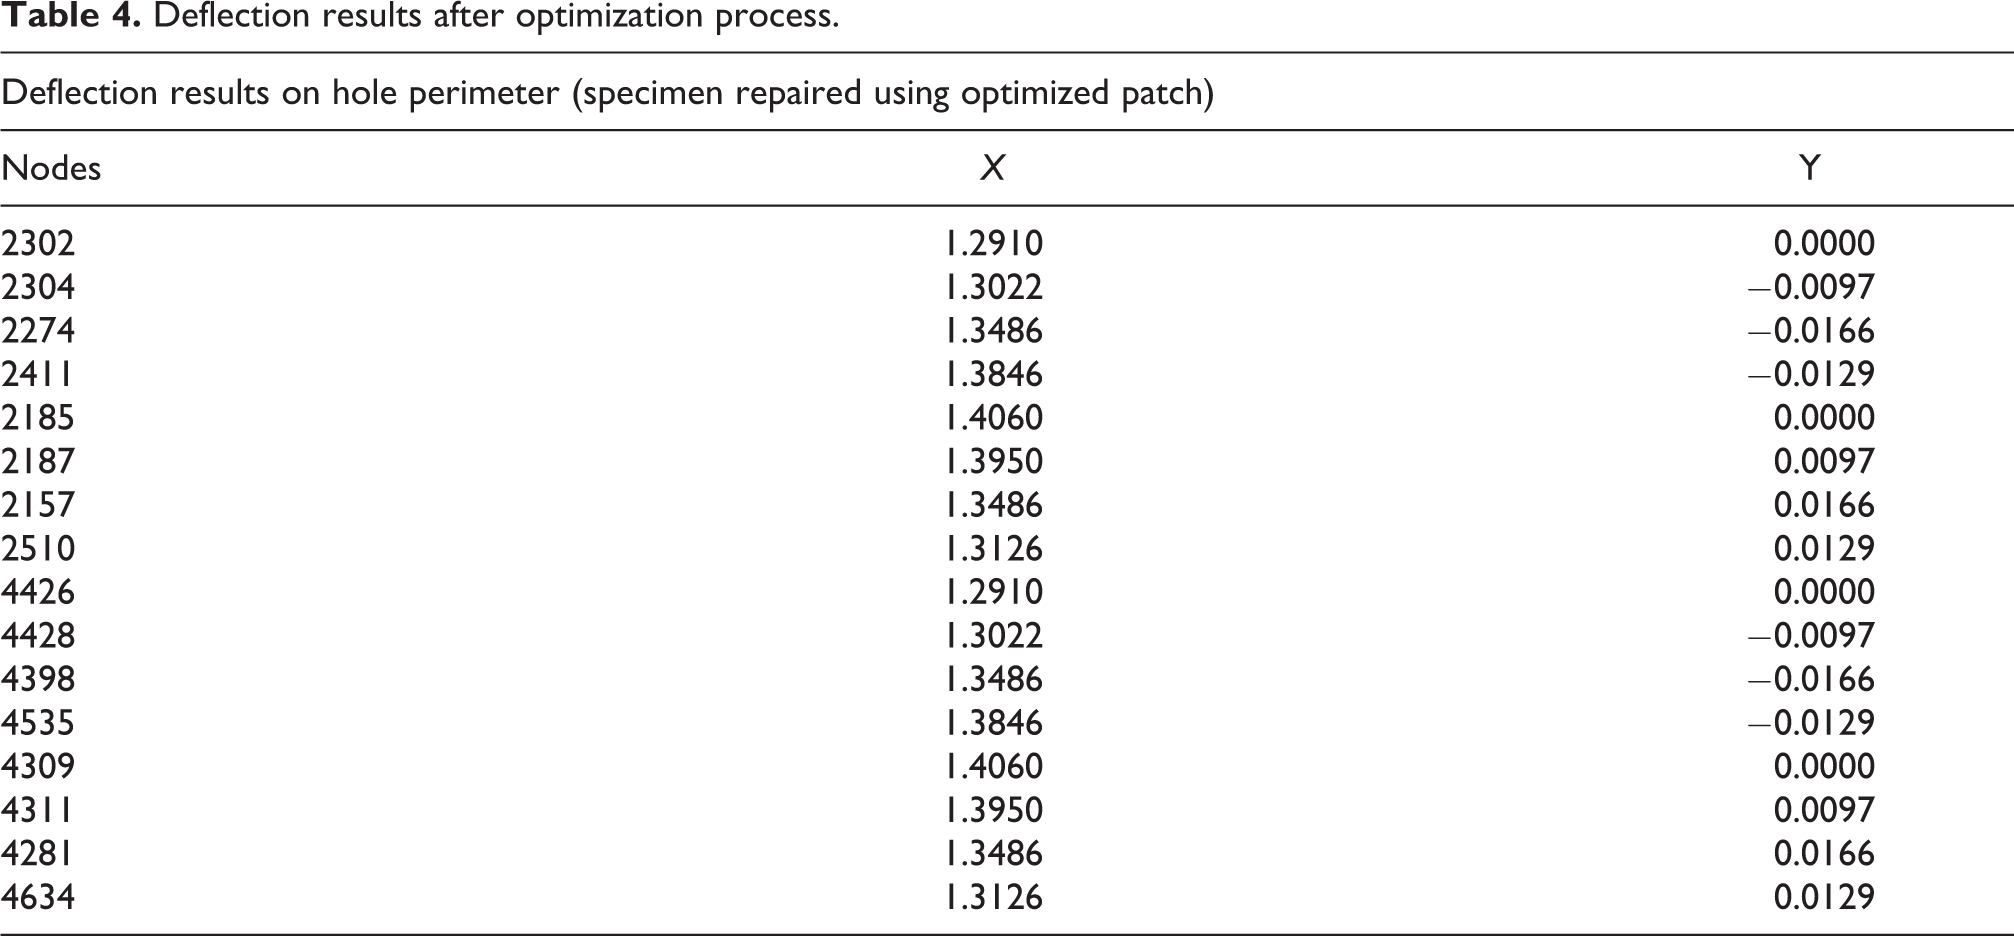
Figure 14 shows the final optimized shape, arrived after a few linear static structural analyses following to the optimization run, which meets the required structural integrity.
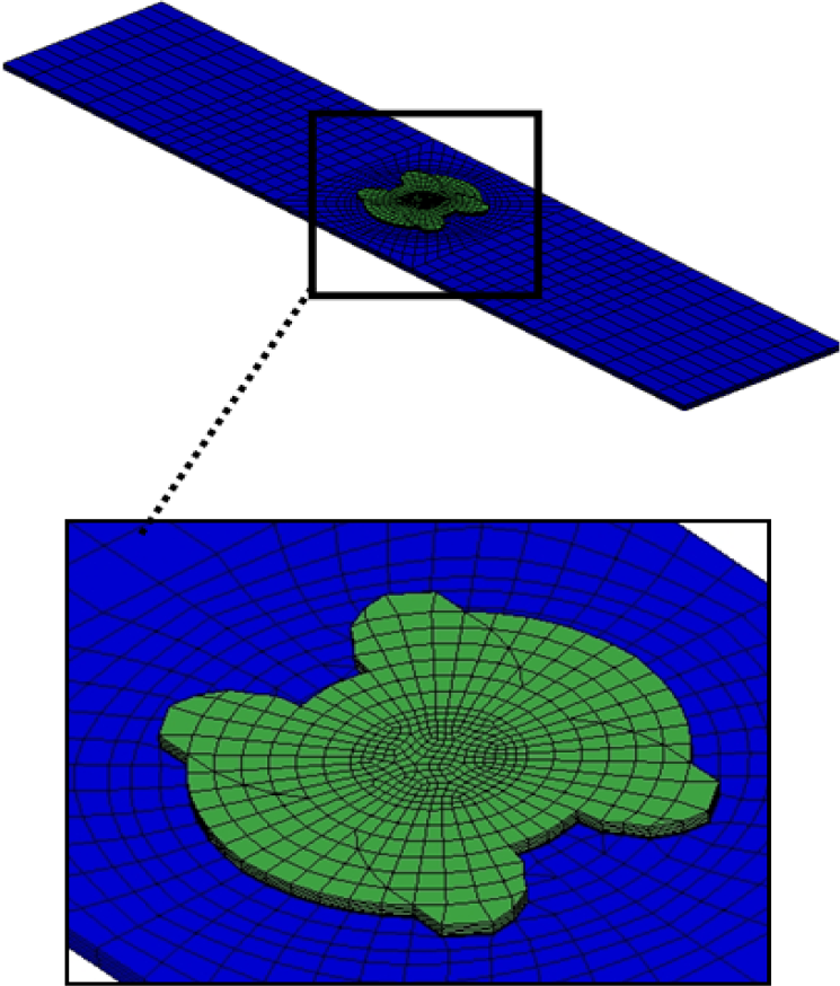
Stage III: Optimized patch which is arrived after different runs at the end of optimization run.
Specimen’s response study after optimization
Figures 15 to 16 show the stress deflection plots of specimen with hole repaired using optimized patch. Table 5 shows the FEA results of various specimens in the study. The axial load of 16,000 N is considered to demonstrate the stress and deflection pattern in all kinds of specimens. Adhesive is modeled with linear material model and required care has been taken in FEA modeling.
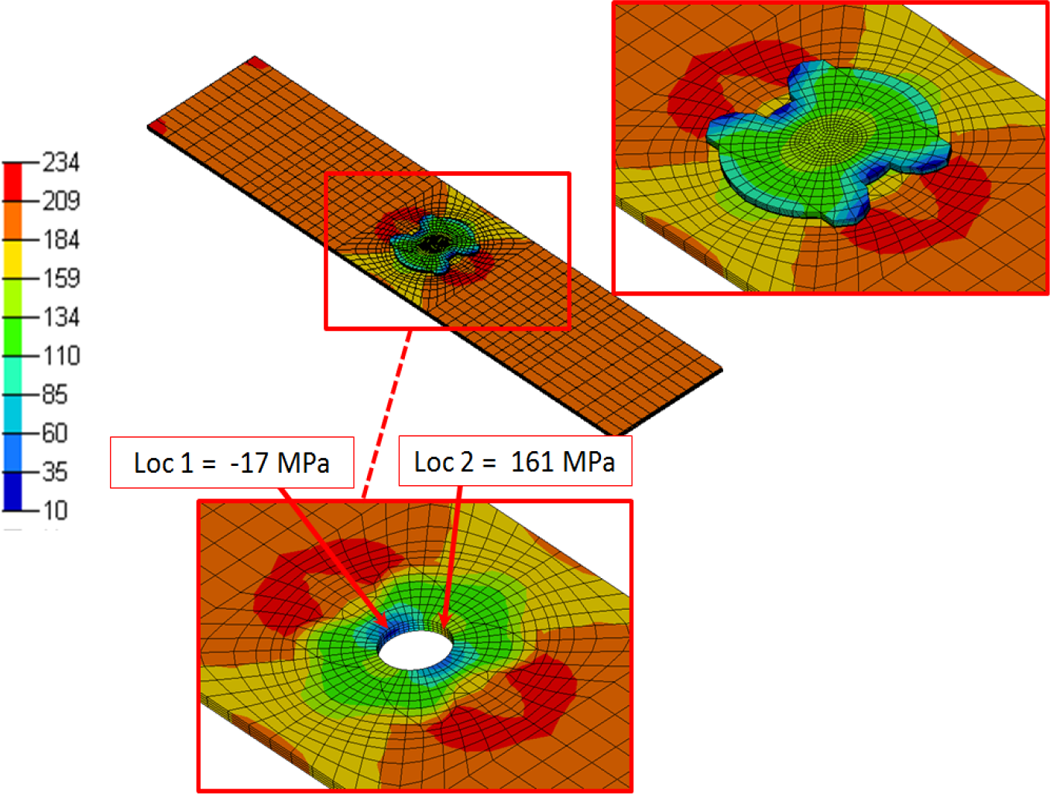
Stress: Specimen with hole repaired using optimized patch.
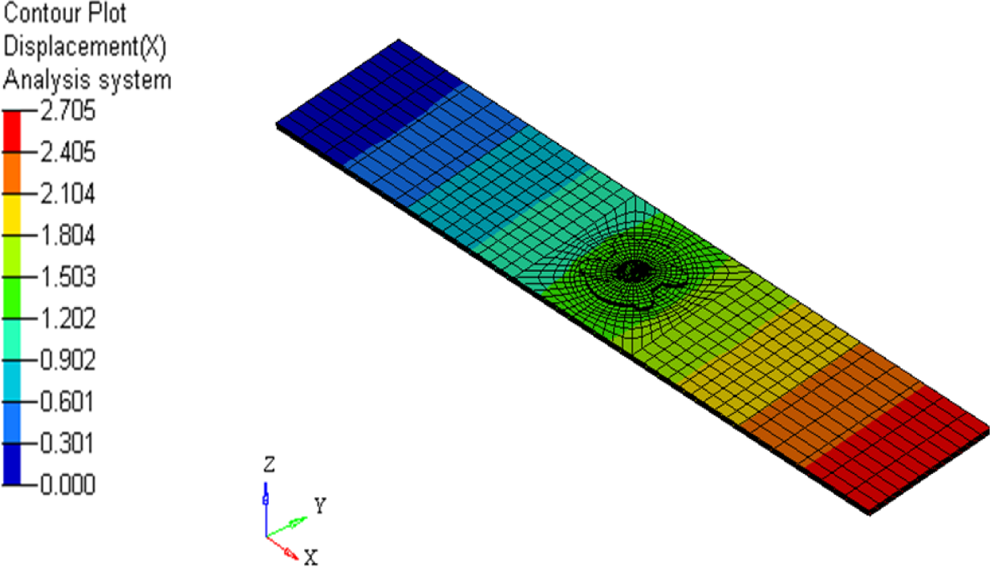
Axial deflection: Specimen with hole repaired using optimized patch.
FEA results of various π/4 quasi-isotropic E-glass/epoxy laminate specimens.

FEA: finite element analysis.
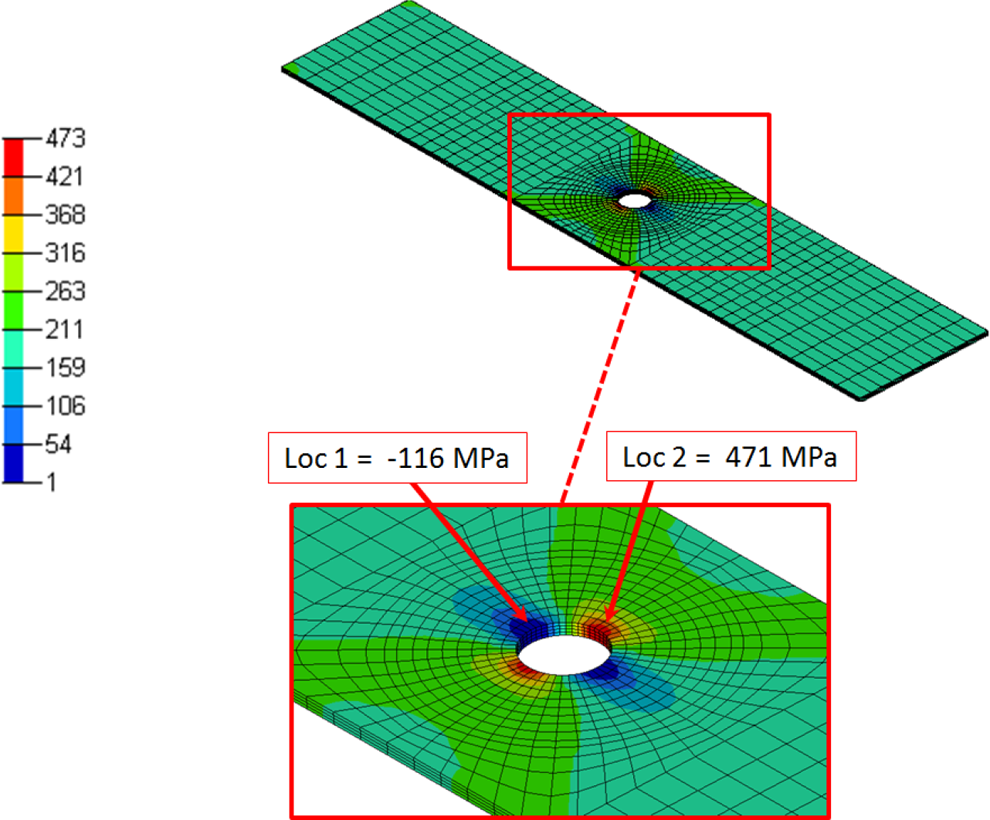
The maximum tensile stress observed in specimen without hole is 200 MPa at the locations 1 and 2 (Figure 17). And, the specimen with hole carries the tensile stress of 471 MPa and compressive stress of −116 MPa, at the same locations 1 and 2 (Figure 17). In the specimen with hole, the maximum and minimum stresses are orthogonal around the hole (Figure 17).
Specimen plot to understand the FEA results presented in Table 3. FEA: finite element analysis.
Then, specimen with hole repaired using conventional circular patch is analyzed and it is observed that maximum and minimum stresses in the structure were 158 and −21 MPa, respectively (Table 5). The maximum stress of 158 MPa is 21% less while compared to specimen without hole. Indeed, it makes worth that repaired structure has less stress while compared to original structure. These sort of safety factors are important while studying the composite structures and it carries most probable property variations on the same kind of structures that are made in different batches. Now, the question arises as “Does the circular patch used to repair the damaged structure, has optimum material distribution?”
In order to respond the above question, various shapes of patches should be prepared and tested experimentally to understand which one is optimum in design. If such studies are carried out, it not only increases the repair time and cost, but also will be very difficult to survive in the market that is encircled by competitors. Hence, it is very important to have powerful FEA tools like OptiStruct which is capable of not only to arrive at the optimized structure but also to maintain the strength of the original one. Using tools like this, optimization of structure can be done to any extent in no time. It is meant that optimized repair patch can be arrived at in such a way that it maintains the same stresses and deflection present in the original structure. As it is difficult to maintain the consistency in composite material properties, it is better to account for some safety factors present in the specimen with hole repaired using circular patch. In this study, attempt has been made to maintain the same safety factor of circular patch.
Finally, linear static structural analysis is carried out on specimen with hole repaired using optimized patch. This analysis is carried out to ensure whether optimized patch offers the same stiffness and strength that offered by original strength of the structure and it is also to compare with circular patch design. Specimen with hole repaired using optimized patch has the maximum and minimum stresses in the structure as 161 and −17 MPa, respectively (Table 5). The maximum stress of 161 MPa is 20% less while compared to specimen without hole. When it is compared with specimen with hole repaired using circular patch, it is 2% more, which is marginal.
It is evident from Table 5 that optimized patch design has brought down the repair material usage by 36% without compromising the stiffness and strength of the original structure (specimen without hole).
Patch design geometry relations
Circular patch design
This design is conventional one and predominantly used to repair the structures that have circular hole and undergoes uniaxial tensile loading condition. If the π/4 quasi-isotropic laminate (parent material) has the hole radius of “R,” then the radius of the patch required to repair the structure is “3.5R” and the thickness of patch is half of the parent material to be repaired. These relations have been presented in the technical papers by Soutis and Hu, 7 Kashfuddoja and Ramji, 36 Gong et al., 37 and Cheng et al. 41,42 This circular patch design is analyzed here to make one-to-one comparison with the optimized patch design which is arrived from the FEA tool (OptiStruct), in the perspective of strength, load transfer efficiency, and failure mode. Figure 18 shows the “typical circular patch design with relations” which is used to repair the specimens with circular hole. Figure 19 shows the actual π/4 quasi-isotropic E-glass/epoxy patch used to repair the specimens (46–50) with circular hole.
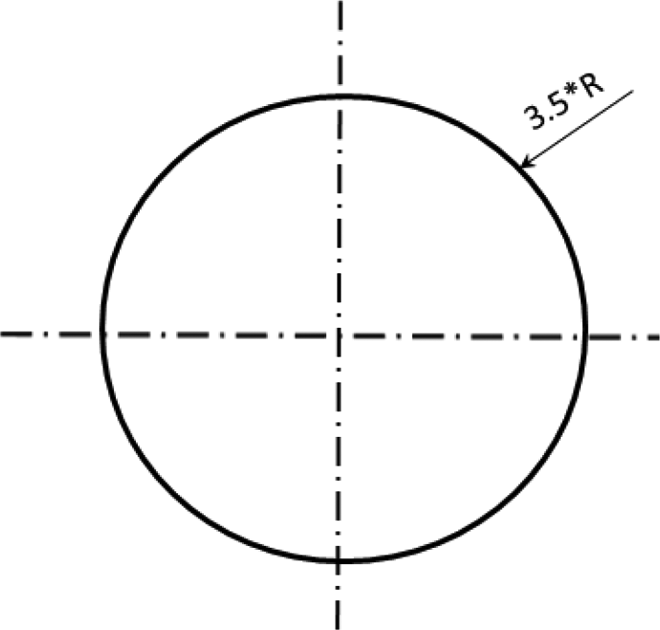
Conventional circular patch design and its relation. Hole radius on the parent material is “R.”

E-glass/epoxy circular patch [90/0/−45/45] used to repair quasi-isotropic laminate [0/45/90/−45]S; 1.6 mm thick; specimens (46–50).
Possible end tapering is carried out on the actual patches to significantly bring down the stress concentration at the end of patches.
Optimized patch design
This optimized patch design is obtained from FEA tool (OptiStruct) considering π/4 quasi-isotropic E-glass/epoxy laminate properties. The objective is to arrive at the patch shape with minimum material distribution (optimum) and maintain the same stiffness of the undamaged structure (specimen without hole) under uniaxial tensile loading condition. In order to achieve the optimized design, topology optimization technique is followed. The same practice is extended to π/4 quasi-isotropic E-glass/epoxy laminate and the optimized shape is brought out. The approach followed in designing the optimized patch shape is clearly detailed in this chapter.
The optimized geometry model from the FEA tool is exported to AutoCAD and established the relations with fine features as shown in Figure 20. The optimized patch profile and conventional circular patch profiles are superimposed (Figure 21) to show the excess material that is used with circular patch design. However, the intension of optimized patch shape is to possess the same stiffness characteristics of undamaged structure (specimen without hole). Figure 22 shows the actual π/4 quasi-isotropic E-glass/epoxy patch that is used to repair the specimens (66–70) with circular hole.

Optimized patch design arrived from FEA tool and its relations. Hole radius on the parent material is “R.” FEA: finite element analysis.

Optimized patch design arrived from FEA tool superimposed with conventional circular patch design. FEA: finite element analysis.
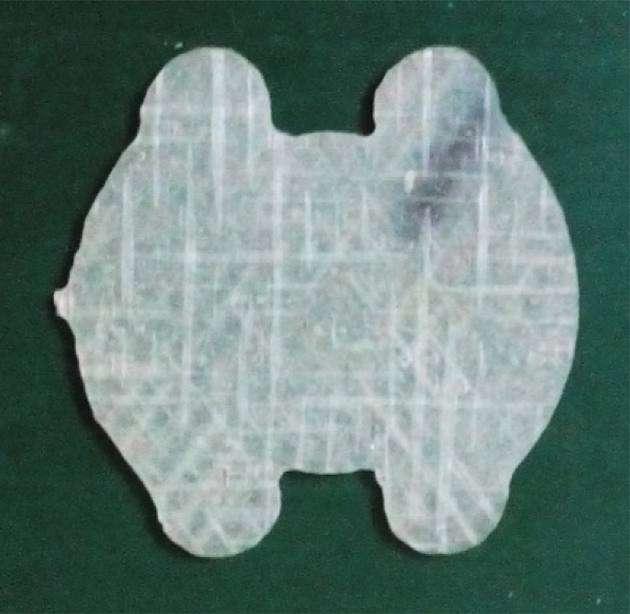
E-glass/epoxy optimized patch [90/0/−45/45] used to repair quasi-isotropic laminate [0/45/90/−45]S; 1.6 mm thick; specimens (66–70).
Experimental work
The E-glass/epoxy was utilized in preparing the laminates (parent and patch materials) for this study. The E-glass uni-directional fiber and LY556 epoxy resin were used to make the laminates. The LY556 epoxy resin was utilized along with hardener HY 951. The resin to hardener proportion was maintained as 100:10.
Wet layup method was followed in preparing the laminates for this study. The laminates for parent material; [0/45/90/−45]S; with the size of 300 × 300 mm2 are shaped as specimens for the dimensions of 25 × 250 mm2 and 50 × 250 mm2. The size of 25 × 250 mm2 (5 nos) was used for understanding the tensile properties and the size of 50 × 250 mm2 was used for understanding the strength characteristics of repair specimens. The size of 50 × 250 mm2 is appropriate for introducing circular damage and repairing the same. 36,37 The design of repair specimens are as per references. 36,37 Similarly, the laminates for patch material; [90/0/−45/45]; with the size of 300 × 300 mm2 were shaped as patches (circular and optimized) according to the dimensions mentioned under the topic of patch design. Using abrasive water jet cutting, the required number of specimens and patches were prepared from the laminates. The optimum velocity of the abrasive water jet was established on trial and error basis, for parent material laminate and patch laminates in order to avoid the delamination problem.
Four types of π/4 quasi-isotropic E-glass/epoxy specimens were made as follows: (1) specimen without hole (5 nos), (2) specimen with hole (5 nos), (3) specimen with hole repaired using circular patch (5 nos), and (4) specimen with hole repaired using optimized patch (5 nos). The detailed information of above specimens is listed in the Table 6. For this study, 20 number of specimens were considered.
Specimen identification and details for repair study.

The dimensions of the abovementioned specimens have been used according to the Figures 23 to 26. The surface preparation for the gripping zones of specimens was carried out with the help of T460 Silicon Carbide abrasive paper (#80). Subsequently, acetone was used to clean the gripping zone. Scratched aluminum sheet (thickness of 2 mm) was used as gripping material for end tabbing. The combination of Araldite AW 106 and hardener HV 953 IN (mixing ratio of 50:50 is maintained) was used to bond the specimen and end tab material.
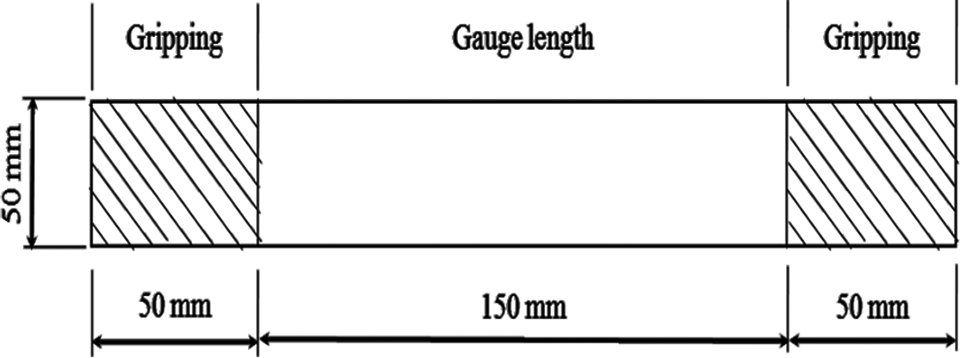
Specimen without hole (6–10).

Specimen with circular hole (26–30). 37

Specimen with hole repaired using circular patch on both sides (46–50). 37
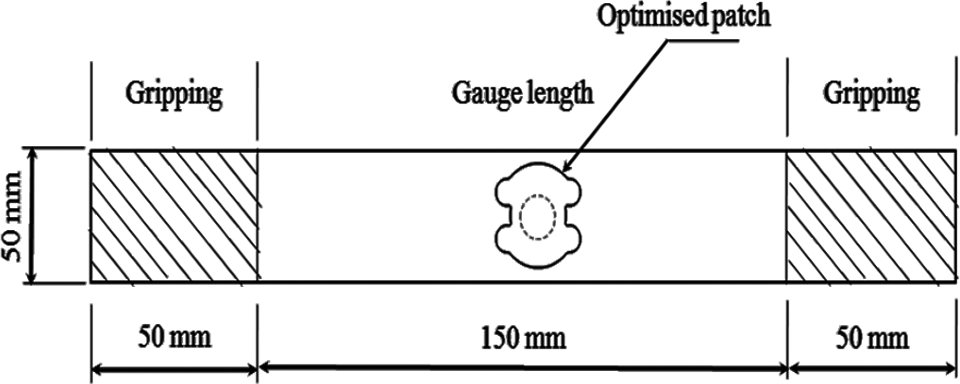
Specimen with hole repaired using optimized patch on both sides (66–70).
The adhesive of MASTER BOND ESP 110 was used to repair the specimen with hole using circular and optimized patches. The subject adhesive is epoxy based (toughened single part). The bond-line thickness of 0.2 mm was used in bonding the patch shapes (circular and optimized) with parent material. The suitable selection of adhesive is depends upon parent material, patch material, and structural loads. 43 But, this work has used the same adhesive that was used in the references. 36,37
Tensile testing has been carried out according to American Society for Testing and Materials (ASTM) D 3039/D3039 M-00 “Standard Test Method for Tensile Properties of Polymer Matrix Composite Materials,” tension tests have been completed using UTMs with wedge-type mechanical grips. The 100 kN Instron UTM machine has been used to study the strength and load transfer efficiency of the specimens. The rate of loading of 2 mm/min has been maintained on all the specimens.
Specimen photographs
Figures 27 to 30 are the actual specimens fabricated for this work.

Quasi-isotropic laminate [0/45/90/−45]S; 1.6 mm thick; specimens without hole for strength and load transfer efficiency study.

Quasi-isotropic laminate [0/45/90/−45]S; 1.6 mm thick; specimens with hole for strength and load transfer efficiency study.

Quasi-isotropic laminate [0/45/90/−45]S; 1.6 mm thick; specimen with hole repaired using circular patch for strength and load transfer efficiency study.

Quasi-isotropic laminate [0/45/90/−45]S; 1.6 mm thick; specimen with hole repaired using optimized patch for strength and load transfer efficiency study.
Experimental data
Tables 7 to 10 gives the consolidated and statistical data of tested specimens considered for this work.
Tensile strength of π/4 quasi-isotropic laminate [0/45/90/−45]S; 1.6 mm thick; specimens without hole.

SD: standard deviation; CV: coefficient of variation.
Tensile strength of π/4 quasi-isotropic laminate [0/45/90/−45]S; 1.6 mm thick; specimens with hole.

SD: standard deviation; CV: coefficient of variation.
Tensile strength of π/4 quasi-isotropic laminate [0/45/90/−45]S; 1.6 mm thick; specimens with hole repaired using circular patch [90/0/−45/45].

SD: standard deviation; CV: coefficient of variation.
Tensile strength of π/4 quasi-isotropic laminate [0/45/90/−45]S; 1.6 mm thick; specimens with hole repaired using optimized patch [90/0/−45/45].

SD: standard deviation; CV: coefficient of variation.
Load versus Deflection curves of tested specimens: To understand the strength
Figures 31 to 34 shows the pattern of load versus deflection curves of different tested specimens considered for this work”. These figures are helpful to understand the failure strength of different specimens.
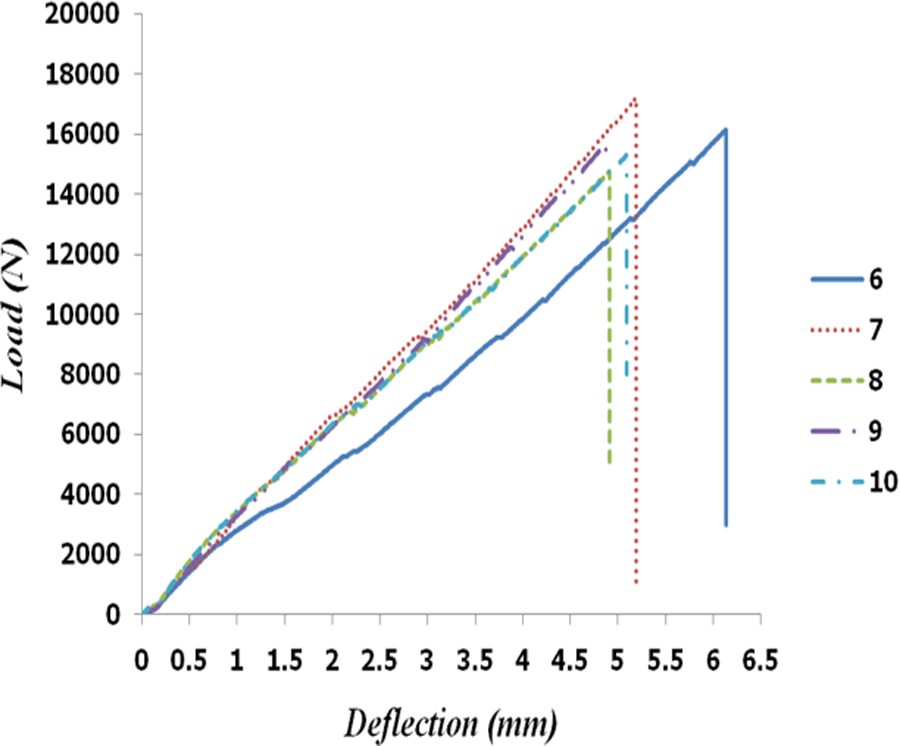
Quasi-isotropic laminate [0/45/90/−45]S; 1.6 mm thick; specimens without hole for strength study (6–10).

Quasi-isotropic laminate [0/45/90/−45]S; 1.6 mm thick; specimens with hole for strength study (26–30).

Quasi-isotropic laminate [0/45/90/−45]S; 1.6 mm thick; specimens repaired using circular patch [90/0/−45/45] for strength study (46–50).
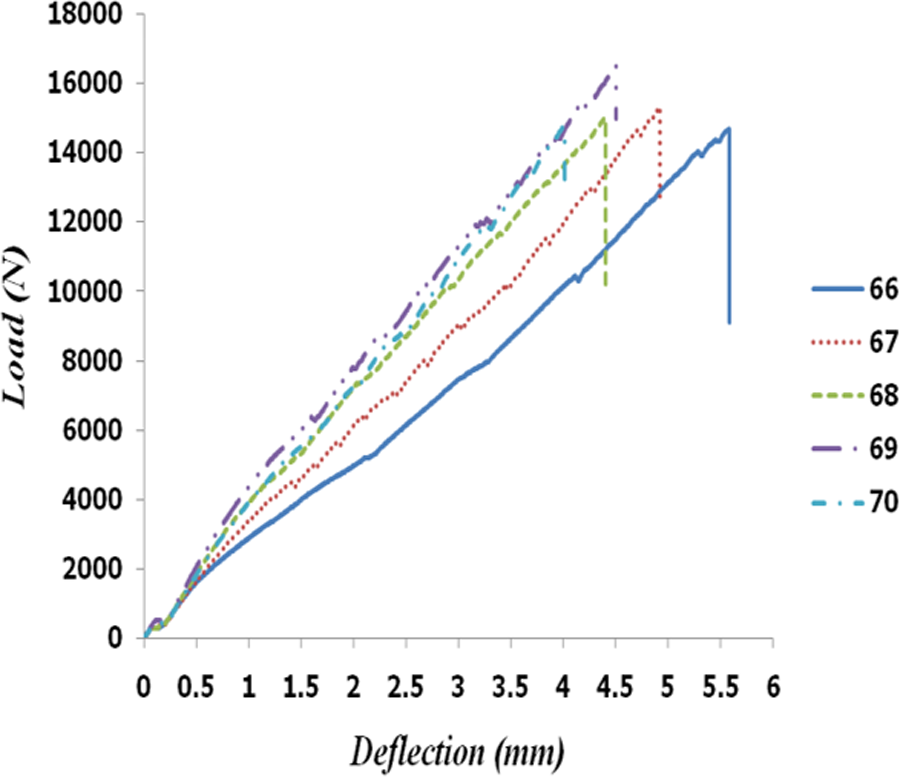
Quasi-isotropic laminate [0/45/90/−45]S; 1.6 mm thick; specimens repaired using optimized patch [90/0/−45/45] for strength study (66–70).
Load versus time curves of tested specimens: To understand the load transfer efficiency
Figures 35 to 37 shows the pattern of load versus time curves of different tested specimens considered for this work”. These figures have been presented with the intension to understand the load transfer efficiency of different specimens.

Quasi-isotropic laminate [0/45/90/−45]S; 1.6 mm thick; specimen without hole (9) and specimen with hole (29) superimposed for comparative study of load transfer efficiency.

Quasi-isotropic laminate [0/45/90/−45]S; 1.6 mm thick; specimen without hole (9) and specimen repaired using circular patch (47) superimposed for comparative study of load transfer efficiency.
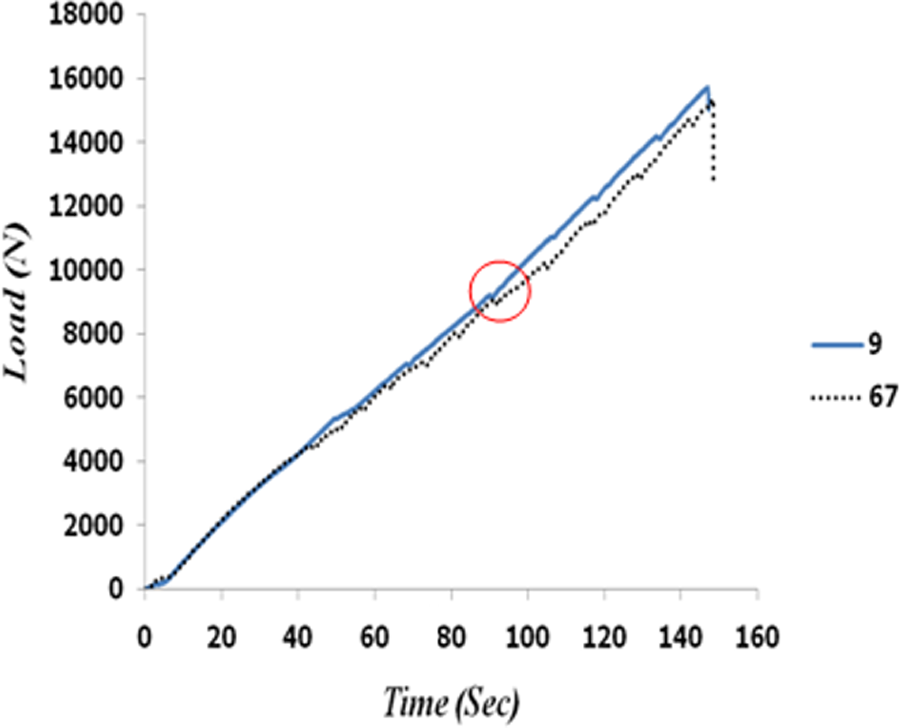
Quasi-isotropic laminate [0/45/90/−45]S; 1.6 mm thick; specimen without hole (9) and specimen repaired using optimized patch (67) superimposed for comparative study of load transfer efficiency.
Figure 36 shows the superimposed “load versus time curves” of specimen without hole and specimen with hole repaired using circular patch. In this figure, it is observed that there is no reduction in slope till the 75% of its failure load (11,513 N at 115 s). It shows that load transfer efficiency of specimen with hole repaired using circular patch is similar to specimen without hole till the 75% of its failure load.
Figure 37 shows the superimposed “load versus time curves” of specimen without hole and specimen with hole repaired using optimized patch. In this figure, it is understood that there is no reduction in slope till the 65% of its failure load (9971 N at 102 s). It shows that load transfer efficiency of specimen with hole repaired using optimized patch is same as that of specimen without hole till the 65% of its failure load.
Load versus Deflection curves of tested specimens: For failure investigation
Figures 38 to 40 shows the pattern of load versus deflection curves of different tested specimens considered for this work”. These figures have been presented to show the possible failure investigation of different specimens.

Quasi-isotropic laminate [0/45/90/−45]S; 1.6 mm thick; specimen without hole (9) and specimen with hole (29) superimposed for comparative study on damage progression.

Quasi-isotropic laminate [0/45/90/−45]S; 1.6 mm thick; specimen without hole (9) and specimen repaired using circular patch (47) superimposed for comparative study of damage progression.

Quasi-isotropic laminate [0/45/90/−45]S; 1.6 mm thick; specimen without hole (9) and specimen repaired using optimized patch (67) superimposed for comparative study of load transfer efficiency.
The Figure 39 shows the comparison of damage progression between specimen without hole and specimen with hole repaired using circular patch. Of these, load versus deflection curve of specimen without hole exhibit 5 dips before catastrophic failure, whereas specimen with hole repaired using circular patch exhibit 8 dips before catastrophic failure. The additional 3 dips are occurred due to adhesive failure.
Results and discussion
Failure photographs
Figures 41 to 48 are the different failure photographs of specimens considered in this work.

Quasi-isotropic laminate [0/45/90/−45]S; 1.6 mm thick; specimens without hole for strength study (6–10)—front side.

Quasi-isotropic laminate [0/45/90/−45]S; 1.6 mm thick; specimens without hole for strength study (6–10)—back side.
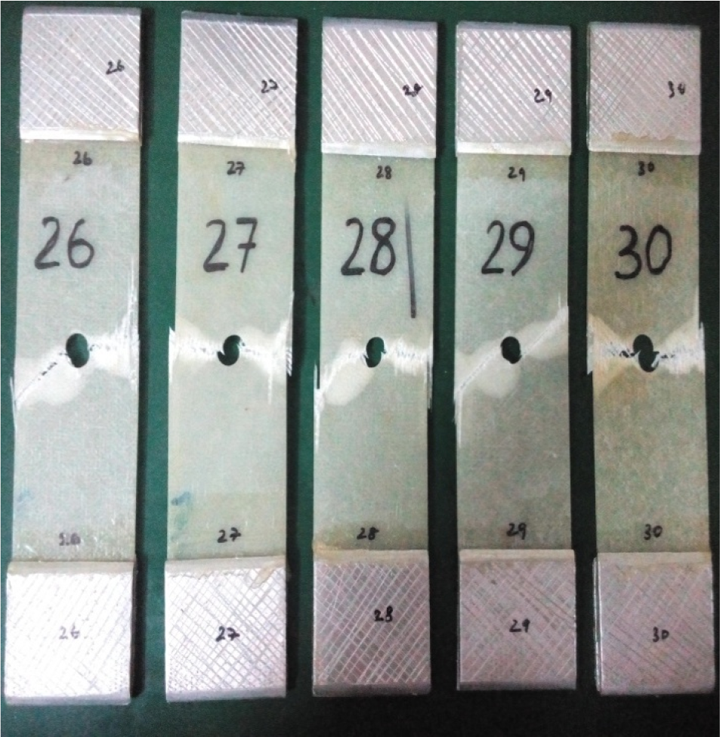
Quasi-isotropic laminate [0/45/90/−45]S; 1.6 mm thick; specimens with hole for strength study (26–30)—front side.
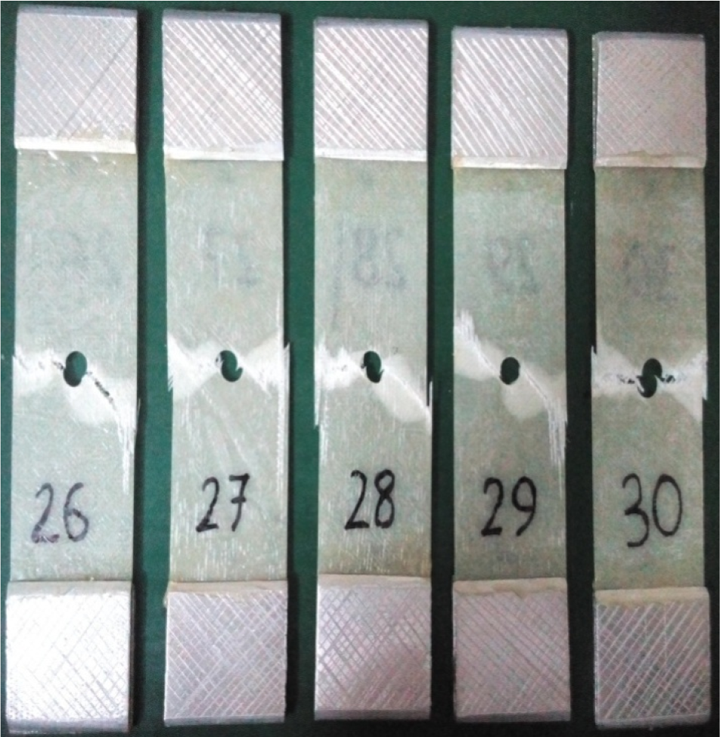
Quasi-isotropic laminate [0/45/90/−45]S; 1.6 mm thick; specimens with hole for strength study (26–30)—back side.

Quasi-isotropic laminate [0/45/90/−45]S; 1.6 mm thick; specimens with hole repaired using circular patch for strength study (46–50)—front side.

Quasi-isotropic laminate [0/45/90/−45]S; 1.6 mm thick; specimens with hole repaired using circular patch for strength study (46–50)—back side.
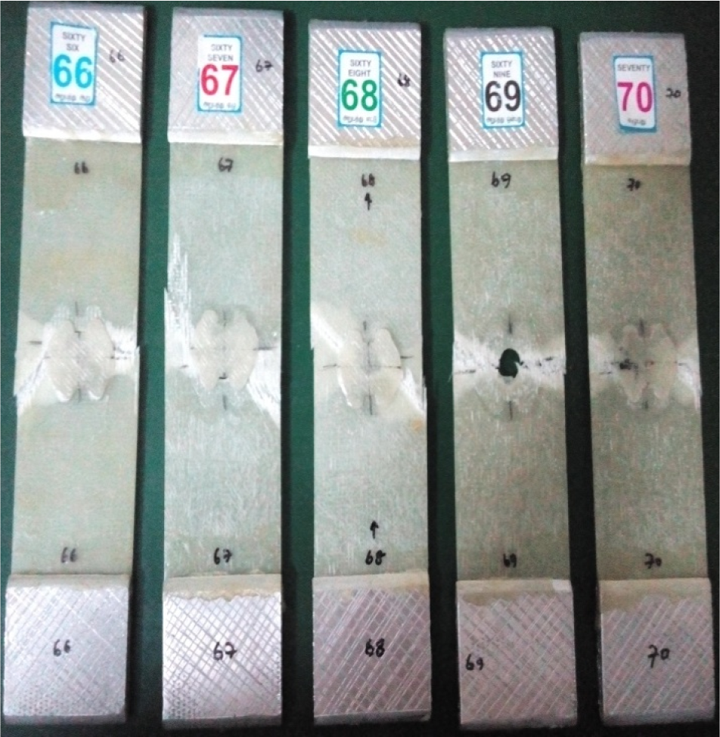
Quasi-isotropic laminate [0/45/90/−45]S; 1.6 mm thick; specimens with hole repaired using optimized patch for strength study (66–70)—front side.

Quasi-isotropic laminate [0/45/90/−45]S; 1.6 mm thick; specimens with hole repaired using optimized patch for strength study (66–70)—back side.
FEA results
Table 5 shows the FEA results of various specimens are considered to study. The axial load of 16,000 N was considered to demonstrate the stress and deflection pattern in all kinds of specimens. Adhesive was modeled with linear material model. The required care has been taken in FEA modeling. The optimized patch design has brought down the repair material usage of 36%. Also, the stress concentration factor rise, due to optimized patch, is insignificant while compared to conventional circular patching.
Strength analysis
The strengths of different specimens are recorded and plotted in Tables 7 to 10 and load versus deflection curves (Figures 31 to 34), respectively. The abovementioned tables and load versus deflection curves show that specimens without hole have higher strength than all other specimens. Conventional repair practice of circular patching offers equivalent strength (2% less) while compared to the specimens without hole. This extent of equivalent strength is achieved with significant addition (9.5%) of repair material while compared to specimen without hole. The new method of optimized patching also offers the equivalent strength (3.5% less) while compared to the specimens without hole. However, it is achieved with significant mass reduction (36%) in repair material while compared to conventional circular patching. Though, optimized patching repair technique offers the marginally lower strength (1.5% less) while compared to the circular patching technique and it is understood that they are comparable.
Load transfer efficiency analysis
In course of doing repair practices, it is important to account the load transfer efficiency of the structure. Load transfer efficiency is about swift transfer of same load from one end to other. Certainly, load transfer efficiency will not be same till the failure. It will change. If the structure is designed for the factor of safety of 2, till the 50% of it’s failure load, load transfer efficiency has to be same. In order to have good load transfer efficiency, the stiffness of the structure has to remain constant with respect to time. In this work, to understand the load transfer efficiency of different specimens, load versus time curve is used.
Figure 35 shows the superimposed “load versus time curves” of specimen without hole and specimen with hole. In this figure, the reduction in slope due to the presence of hole is observed. It shows that load transfer efficiency of specimen with hole is less while compared to specimen without hole.
Failure analysis on load versus deflection curves of tested specimens
All the specimens tested (size of 1.6 × 50 × 250 mm3) in this study are evident for progressive failure pattern that occurs on π/4 quasi-isotropic E-glass/epoxy laminate specimens. This type of progressive failure pattern is not noticed, when the same π/4 quasi-isotropic E-glass/epoxy specimens are tested as per ASTM specification D 3039/D3039
The damage progression is very clear on all types of specimens (Figures 38 to 40). The Figure 38 shows the comparison of damage progression between specimen without hole and specimen with hole. Both load versus deflection curves exhibit 5 dips before catastrophic failure. These 5 dips involve delamination, resin and fiber failures over specimens. The failure order in these specimens are, firstly, the stronger lamina (0°) delamination from adjacent laminas, then resin failure of 90° lamina, afterwards resin and fiber failure of ±45° laminas and finally the rupture.
The Figure 40 shows the comparison of damage progression between specimen without hole and specimen with hole repaired using optimized patch. Of these, load versus deflection curve of specimen without hole exhibits 5 dips before catastrophic failure, whereas specimen with hole repaired using circular patch exhibits 10 dips before catastrophic failure. Additional 2 dips have occurred while compared to circular patching. It is due to reduction in adhesive area because of optimized patch shape.
As this study is very much focused on new design of patch, it’s strength and load transfer efficiency, the details of order of failure are not discussed precisely. It will be discussed in the following technical paper.
Failure analysis of tested specimens
Specimen without hole
Of the specimens 6–10 (5 nos), specimens 6, 9, and 10 failed at gauge length. The rest of 7 and 8 failed little closer to end tabs. It is very clear in the Figures 41 and 42. Both sides of the failed specimens are displayed to understand the failure behavior better. The failure order in these specimens are, firstly, the stronger lamina (0°) delamination from adjacent laminas, then resin failure of 90° lamina, afterwards resin and fiber failure of ±45° laminas and finally the rupture.
Specimen with hole
Of the specimens 26–30 (5 nos), all have failed at gauge length. It is very clear in the Figures 43 and 44. All the specimens exhibited same failure pattern as Specimen without hole. But, strength is less while compared to Specimen without hole due to the presence of hole. This hole creates more stress concentration, in turn earlier de-lamination and subsequent progressive failures.
Specimen with hole repaired using circular patch
Of the specimens 46–50 (5 nos), all have failed at gauge length. It is very clear in the Figures 45 and 46. In these specimens, firstly, adhesive failure of patch is occurred and specimen failure subsequently. Even this adhesive failure has happened just before the catastrophic failure. In course of adhesive failure of patch, single or both side of patches are popped out. In some cases 100% of patch remains in the one half of the specimen. But, in all the cases, adhesive failure is only observed and patch failure didn’t happen. The usage of higher strength adhesive than that used here may lead to patch failure.
Specimen with hole repaired using optimized patch
Of the specimens 66–70 (5 nos), all have failed at gauge length. It is very clear in the Figures 47 and 48. The patch and specimen failure pattern of these specimens are same as Specimen with hole repaired using circular patch.
Conclusions
Tensile properties of the π/4 quasi-isotropic E-glass/epoxy laminates have been successfully carried out. Progressive failure pattern is observed with the specimen size of 1.6 × 50 × 250 mm3. But, it was not observed with the specimen size of 1.6 × 25 × 250 mm3. This observation coincides with the statement recorded in the paper. 42
“Novel patch shape” has been effectively designed in order to repair the π/4 quasi-isotropic E-glass/epoxy specimen with circular hole damage. The detailed procedure to design the optimum patch shape is given under the heading of novel patch shape design. Also, the design relations to arrive the optimized patch shape to repair the specimen with circular hole kind of problem under uniaxial tensile loading condition has been given.
Optimized patch shape design brings down 36% of repair material while compared to conventional circular patching. Also, the axial stiffness behavior of specimen with hole repaired using optimized patch is better while compared to specimen without hole. It can be understood from deflection responses that are recorded in the Tables 3 to 5.
Strength study proves the effectiveness of optimized patch shape design and it is evident from the Table 10. As per Tables 9 and 10, specimen with hole repaired using optimized patch has 1.5% less strength while compared to specimen repaired using circular patch. Certainly, overdesign will have less stress while compared to optimized design. Hence, specimen with hole repaired using circular patch has better strength. Using higher strength adhesive than the one used in this work will improve the strength of specimen repaired using optimized patch more while compared to specimen with hole repaired using circular patch.
Load transfer efficiency study also proves its effectiveness and equivalent stiffness behavior of specimen repaired using optimized patch.
Future scope of work
It is planned to test same specimens using acoustic emission technique for detailed failure investigation. This will help to understand the progressive failure pattern of π/4 quasi-isotropic E-glass/epoxy specimens and sequence of failure between bonding and progressive failures.
Footnotes
Declaration of conflicting interests
The author(s) declared no potential conflicts of interest with respect to the research, authorship, and/or publication of this article.
Funding
The author(s) received no financial support for the research, authorship, and/or publication of this article.