
Abstract
Over the last few decades, a significant amount of research has been focused on the use of natural fibres as reinforcement in polymers, due to their intrinsic properties such as sustainability, easy availability and processing, biodegradability and moderate mechanical strength. Among natural fibres, coir is a low-cost fibre extracted from coconut palm which is extensively produced in Brazil. A full factorial design was carried out to investigate the effects of the manufacturing and composition parameters on the mechanical and physical properties of short coir fibre–reinforced composites (SCoirFRCs). The random short fibres were mixed with epoxy polymer and compacted by uniaxial pressure. The physical and mechanical responses, namely, apparent density, impact resistance, flexural strength and modulus, were investigated under a design of experiment approach. SCoirFRCs fabricated with 35% of fibre volume fraction, 375 g/m2 of fibre grammage and HY956 epoxy hardener type achieved higher flexural modulus and impact resistance, while those consisting of 30 vol% of coir fibres, HY956 type and 300 g/m2 of grammage revealed higher flexural strength. The findings revealed that the mechanical properties of SCoirFRCs are substantially dominated by the properties of the matrix phase and fibre wettability.
Keywords
Introduction
Natural fibres have been widely investigated as an alternative reinforcement in polymeric composites over synthetic fibres due to their advantages such as low density and cost, reduced processing energy consumption, recyclability, biodegradability and considerable toughness. 1 -7 Natural fibres include flax, hemp, jute, sisal, kenaf, coir, banana, pineapple, henequen and many others. 8 -11 Coir is an abundant, versatile, renewable, inexpensive and biodegradable lignocellulosic fibre used in many industrial applications. 12 -16 This fibre is derived from coconut husks, the fruit of coconut palm (Cocos nucifera), which is extensively cultivated in the tropical regions, such as India, Brazil, Sri Lanka and Southeast Asia. 17 -19 Although 55 billion of coconuts have been harvested annually in the world, just a small fraction of the fibres has been recovered for use. Most husks have been disposed of, causing environmental pollution. 20 -22 Very limited studies have been carried out in the field of coir fibre composites in comparison with other natural fibre composites. Natural fibre–reinforced composites have been investigated for possible use in aeronautics, leisure, construction, sport, packaging and automotive industries. 3,23,24 Even though many factors are prone to affect the mechanical performance of such composites, much attention has been devoted to the fibre microstructure, fibre matrix compatibility, fibre volume fraction, the amount of filler and manufacturing techniques. 3,25
Tran et al. 26 have investigated the tensile properties of coir fibres to be used in composite materials. Coir is a framework of plenty of elementary fibres (200–300) mounted around a central lacuna. The elementary fibre is composed of two main cell walls consisting of bundles of microfibrils with a large misorientation with respect to the fibre longitudinal axis. Coir fibre appears to have high porosity at 22–30%. The high microfibrillar angle and reorientation of the microfibrils under tensile loadings have led to reduced stiffness in the fibre direction and increased elongation to failure. Jayavani et al., 27 in a recent review on coir fibre composites, have reported that, despite the fibre–matrix interaction improvement obtained by fibre treatments as sodium hydroxide and sodium lauryl sulphate, these composites exhibit sensitively lower tensile, flexural and impact strength relatively to glass fibre composites. The impact resistance of coir fibre/polyester composites made with different thickness (2–6 mm) and fibre volume fractions (10–30%) has been tested by Easwara Prasad et al. 28 Higher impact resistance has been achieved when the experimental factors were considered at 6 mm and 30%. Monteiro et al. 17 have evaluated the effect of uniaxial pressure (2.6 and 5.2 MPa) and amount of coir fibre (10–80 wt%) on the flexural strength of randomly oriented coir fibre/polyester composites. Even though the coir fibres have not contributed to reinforce the material, composites with up to 50 wt% fibre volume ratio exhibited reasonable flexural strength of 10 MPa or higher. The authors, therefore, regarded such composites as valid non-structural alternatives to conventional materials used in the building industry. Coir-epoxy composites have also been considered as materials for acoustic insulation. 29
The fibre–matrix interfacial adhesion strongly affects the mechanical properties of composite materials. Due to their high porosity, compaction is often explored to fabricate short natural fibre composites to enhance infiltration of the matrix phase. 17,26 -28 The panel thickness depends not only on the fibre volume fraction but also on the compacting pressure level used. Higher composite thickness increases the area moment of inertia, consequently affecting the structural rigidity of the panel. The present work was designed based on a constant panel thickness to avoid the geometrical effect on the mechanical performance of the composites. Moreover, the viscosity effect of the matrix phase at the interface was also evaluated using two different epoxy hardeners. Due to the high degree of variability inherent in natural fibres, a robust statistical analysis, based on a design of experiment (DoE), was conducted to identify not only the effect of individual factors but also interactions on response variables. A full factorial design (23) was conducted to verify the effect of the fibre volume fraction; weight of fibre per layer (fibre grammage); and type of epoxy hardener on the apparent density, flexural strength and stiffness and impact resistance of short coir fibre–reinforced composites (SCoirFRCs).
Materials and methods
The composites were fabricated using short coir fibres supplied by Deflor Bioengenharia (Belo Horizonte, Brazil) and a matrix phase consisted of epoxy resin (Renlam M) mixed with two hardener types (Aradur HY951 or HY956) supplied by Huntsman, Brazil.
The factors and levels investigated in the experiment were set based on preliminary tests. A full factorial design (23) was established (Table 1) to investigate the effect of the factors, namely, fibre volume fraction (35 and 30 vol%), type of hardener (HY956 and HY951) and fibre grammage (300 and 375 g/m2) on the apparent density, flexural strength, flexural modulus and Charpy impact resistance of the composites. The statistical software Minitab v.16 was used to perform the DoE and analysis of variance (ANOVA) techniques. The constant factors in the experiment were type of matrix (epoxy resin), number of fibre layers per composite plates (three layers), cold-pressing time (22 h) and curing time (21 days).
Full factorial design (23).

The fabrication of the composite materials was carried out via hand lay-up technique and cold uniaxial compaction. Coir fibres in pristine condition were manually cleaned for the complete removal of plant debris (Figure 1(a)). Subsequently, the fibres were weighted (according to the required grammage) and randomly distributed inside a wood mould with dimensions of 200 × 200 mm2, which was used to compact the samples. A preliminary uniaxial cold pressing of 1 MPa was applied for 2 min to obtain a randomly oriented coir fibre fabric (Figure 1(b)). Three fabric layers were assembled inside the wooden mould and subsequently, the epoxy resin was uniformly spread over the fibres (Figure 1(c)). Two levels of pressure were considered to obtain the same sample thickness for both fibre volume fractions (30 and 35 vol%). The pressure levels of 1 MPa were used for composites made with fibre fraction of 35 vol%, while 0.87 MPa for those made with 30 vol% (Figure 1(d)). After 22 h under pressure, the material was removed from the mould (Figure 1(e)) and placed into a plastic container to avoid moisture absorption during 21 curing days. Finally, the composite plates were cut to obtain the specimens based on the recommendations of ASTM D790-15 30 and D6110-10 31 (Figure 1(f)). Sample sizes of approximately 60.8 × 12.7 × 3 mm3 and 80 × 10 × 3 mm3 were used for flexural and impact tests, respectively.
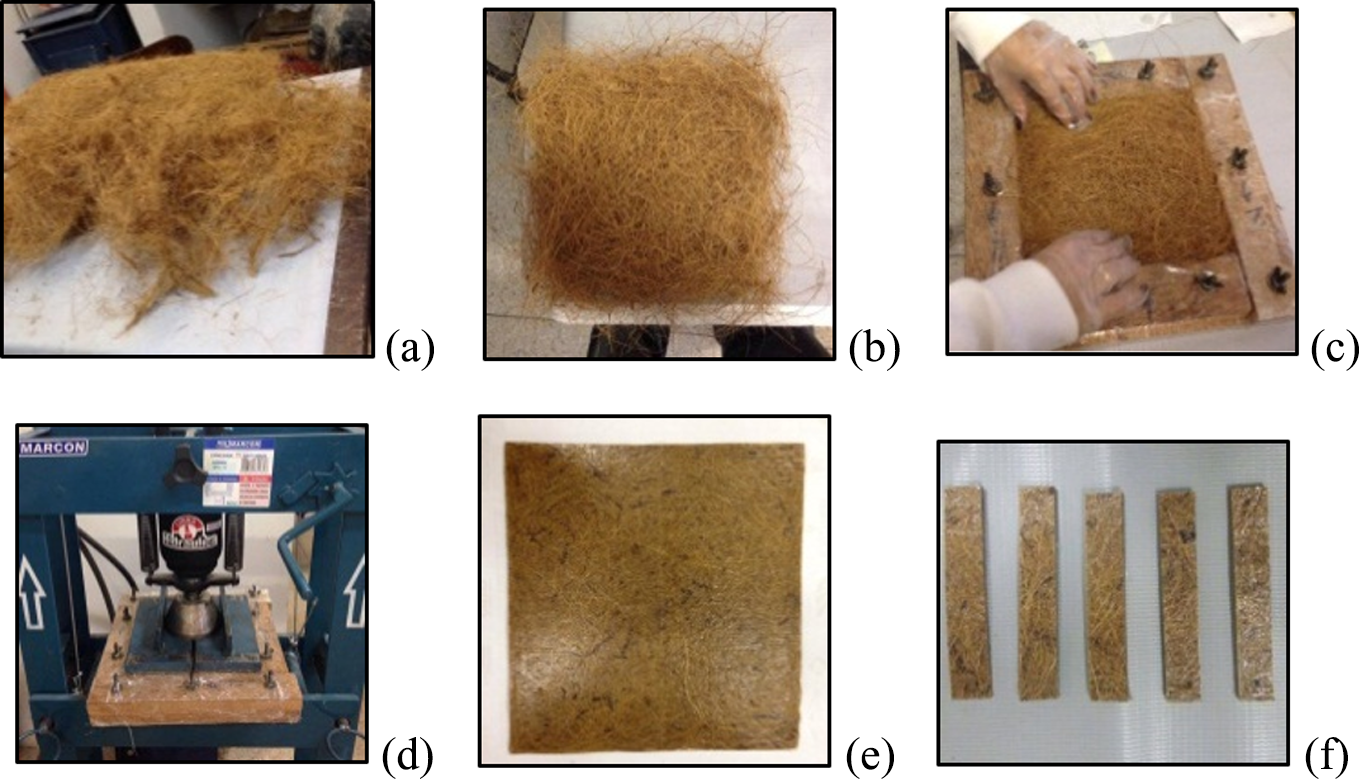
Fabrication process of the composites: (a) coir fibres in pristine condition, (b) fabric of random coir fibres, (c) fabric arranged inside the mould, (d) cold pressing, (e) composite plate and (f) flexural specimens.
Three-point bending tests were performed to determine the flexural strength and modulus of the composites based on the recommendations of ASTM D790-15. 30 A Shimadzu AG-X Plus testing machine equipped with a 100-kN capacity load cell was used to perform the tests at a crosshead speed of 2 mm/min. Impact tests were carried out on a Charpy Impact Tester XJJ Series, following the recommendations of ASTM D6110-10. 30 The apparent density was obtained via Archimedes principle following the recommendations of ASTM D792. 32 The apparent density was calculated by the dry mass–volume ratio of the impervious portion. The volume of the impervious portion is determined subtracting from the dry mass the suspended wet mass impregnated by immersion under vacuum for 12 h. Fifteen specimens (five for bending, five for density and five for impact testing) were fabricated for each experimental condition (Table 1). Two replicates were considered in the experiment running a total of 240 specimens. The replicate is required to estimate the error associated with the individual response by repeating the experimental condition. A randomization procedure was also adopted during the fabrication of the samples, making the process more robust against variables that are unknown to the experiment, but may impact on the responses. 33 In order to better assess the mechanical properties of the SCoirFRCs, the matrix phase containing HY956 or HY 951 hardener was characterized via tensile test according to ASTM D638. 34 Five samples were fabricated for each experimental condition.
The results were analysed via ANOVA, a statistical technique to determine the degree of difference (or similarity) between two or more groups of data. To determine whether any of the differences between the means are statistically significant, the P-Value is compared to the significance level to assess the null hypothesis. The null hypothesis (H0) states that the population means are all equal, and non-equivalence is the alternative hypothesis (H1). A significance level of 0.05 indicates a 5% risk of concluding that a difference exists when there is no actual difference. A P-Value equal or lower than 0.05 implies that the factor significantly affects the response (rejection of H0). 33 The results are presented via main effect and interaction plots, which represent the means for each value of a categorical factor. The main effect of a factor should be interpreted individually only if there is no other evidence that the factor interacts with others. When one or more interaction effects of superior order are significant, the factors that interact can be considered jointly. 33
The ANOVA can be validated by the Anderson–Darling test, which determines whether the data are normally distributed. Such test considers a normal distribution as null hypothesis and non-normality as alternative hypothesis. A P-Value superior to the significance level (0.05) implies accepting the null hypothesis and rejecting it otherwise. 33
Results and discussion
Table 2 shows the response mean values and the standard deviations for the experimental conditions in replicates 1 and 2.
Descriptive statistics.

Table 3 shows the ANOVA results for the DoE responses. P-Values lower than 0.05 are underlined in Table 3, and those highlighted in bold letters will be interpreted via effect plots. The R 2 value exhibited in the ANOVA indicates whether the adjustment of the model is satisfactory. R 2 values close to 1 (or 100%) suggest models of greater predictive ability. 33 R 2 values ranging from 79.66% to 92.84% can be considered acceptable for the ANOVA (see Table 2).
ANOVA and Anderson–Darling test.

ANOVA: analysis of variance; FVF: fibre volume fraction; HT: hardener type; FG: fibre grammage.
The ANOVA can be validated when the residuals are well distributed along the straight line and P-Values for Anderson–Darling normality test is higher or equal to 0.05 (see Table 3), which implies that the data follow a normal distribution. 33
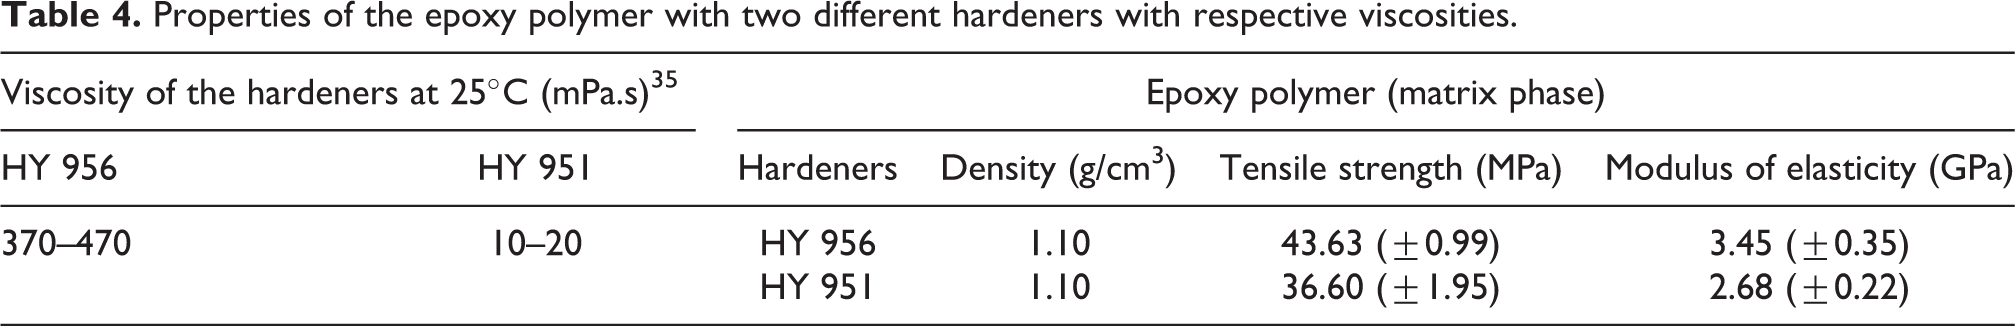
Table 4 shows the physical and mechanical properties of the epoxy polymer (Renlam M) mixed with HY956 and HY951 hardeners with their respective viscosities. 35 Ten tensile specimens for each polymer were manufactured and tested to obtain the strength and elastic modulus. The epoxy polymer with (more viscous) HY956 achieved higher strength (43.63 MPa) and stiffness (3.45 GPa) in comparison to HY951 hardener (Table 4).
Properties of the epoxy polymer with two different hardeners with respective viscosities.
The apparent density data varied from 0.968 (±0.028) g/cm3 to 1.062 (±0.010) g/cm3. The main factors such as fibre volume fraction and fibre grammage and the interaction between hardener type and fibre volume fraction were significant, showing P-Values of 0.002, 0.000 and 0.001, respectively (see Table 3). In this case, the main factor fibre grammage (Figure 2(a)) and the second-order interaction (Figure 2(b)) will be discussed. 33 The density of the composites increases nearly at 3.5% when the fibre grammage changes from 300 g/m2 to 375 g/m2 (Figure 2(a)). Figure 2(b) shows the interaction effect plot for the mean apparent density response. A slight variation (4.64%) in density was revealed between the fibre volume fraction levels only when HY956 hardener is used. The viscosity of HY956 is higher than HY951 (see Table 4), affecting the wettability of the fibres, which implies the occurrence of more voids when the more viscous hardener was used at a higher fibre volume fraction. In general, the composites made with a lower amount of fibres (30 vol%) reached superior density values, since the density of the fibres (approximately 0.86 g/cm3) 11,36 is lower than the matrix phase (1.10 g/cm3).

Main (a) and interaction (b) effect plots for the mean apparent density.
The flexural strength of the SCoirFRCs ranged from 26.70 (±2.99) MPa to 36.56 (±2.29) MPa (Table 2). Second-order interactions significantly affected the flexural strength (see Table 3). Figure 3 shows the interaction effect plots for the mean flexural strength. A significant reduction in strength (16.03%) was observed when a larger amount of fibres (35 vol%) and HY951 hardener type were considered (Figure 3(a)), which can be jointly attributed to the lower resin content of matrix phase and its lower mechanical performance when HY951 hardener was used. The tensile strength of the epoxy polymer consisted of HY956 is nearly 19% higher than HY951 hardener (see Table 4). Figure 3(b) reveals the interaction effect between the fibre volume fraction and fibre grammage factors. The fibre volume fraction factor significantly affected the strength, mainly when the fibre grammage is lower (300 g/m2). This behaviour implies that the amount of matrix phase plays an important role on the strength of SCoirFRCs. Figure 3(c) shows the effect of fibre grammage and hardener type factors on the flexural strength of the composites. The high level of fibre grammage led to reduced strength in composites made with HY951 hardener, implying reduced fibre wettability on the denser fabric. These findings reveal that the strength of SCoirFRCs is more affected by the viscosity and mechanical performance of the epoxy matrix phase rather than by the fibre-reinforcing phase. It is in fact well known that the strength is directly related to the fibre orientation and interfacial adhesion. In SCoirFRCs, the strength is further dominated by the matrix phase property, since the fibres are randomly distributed and misaligned with the load direction.
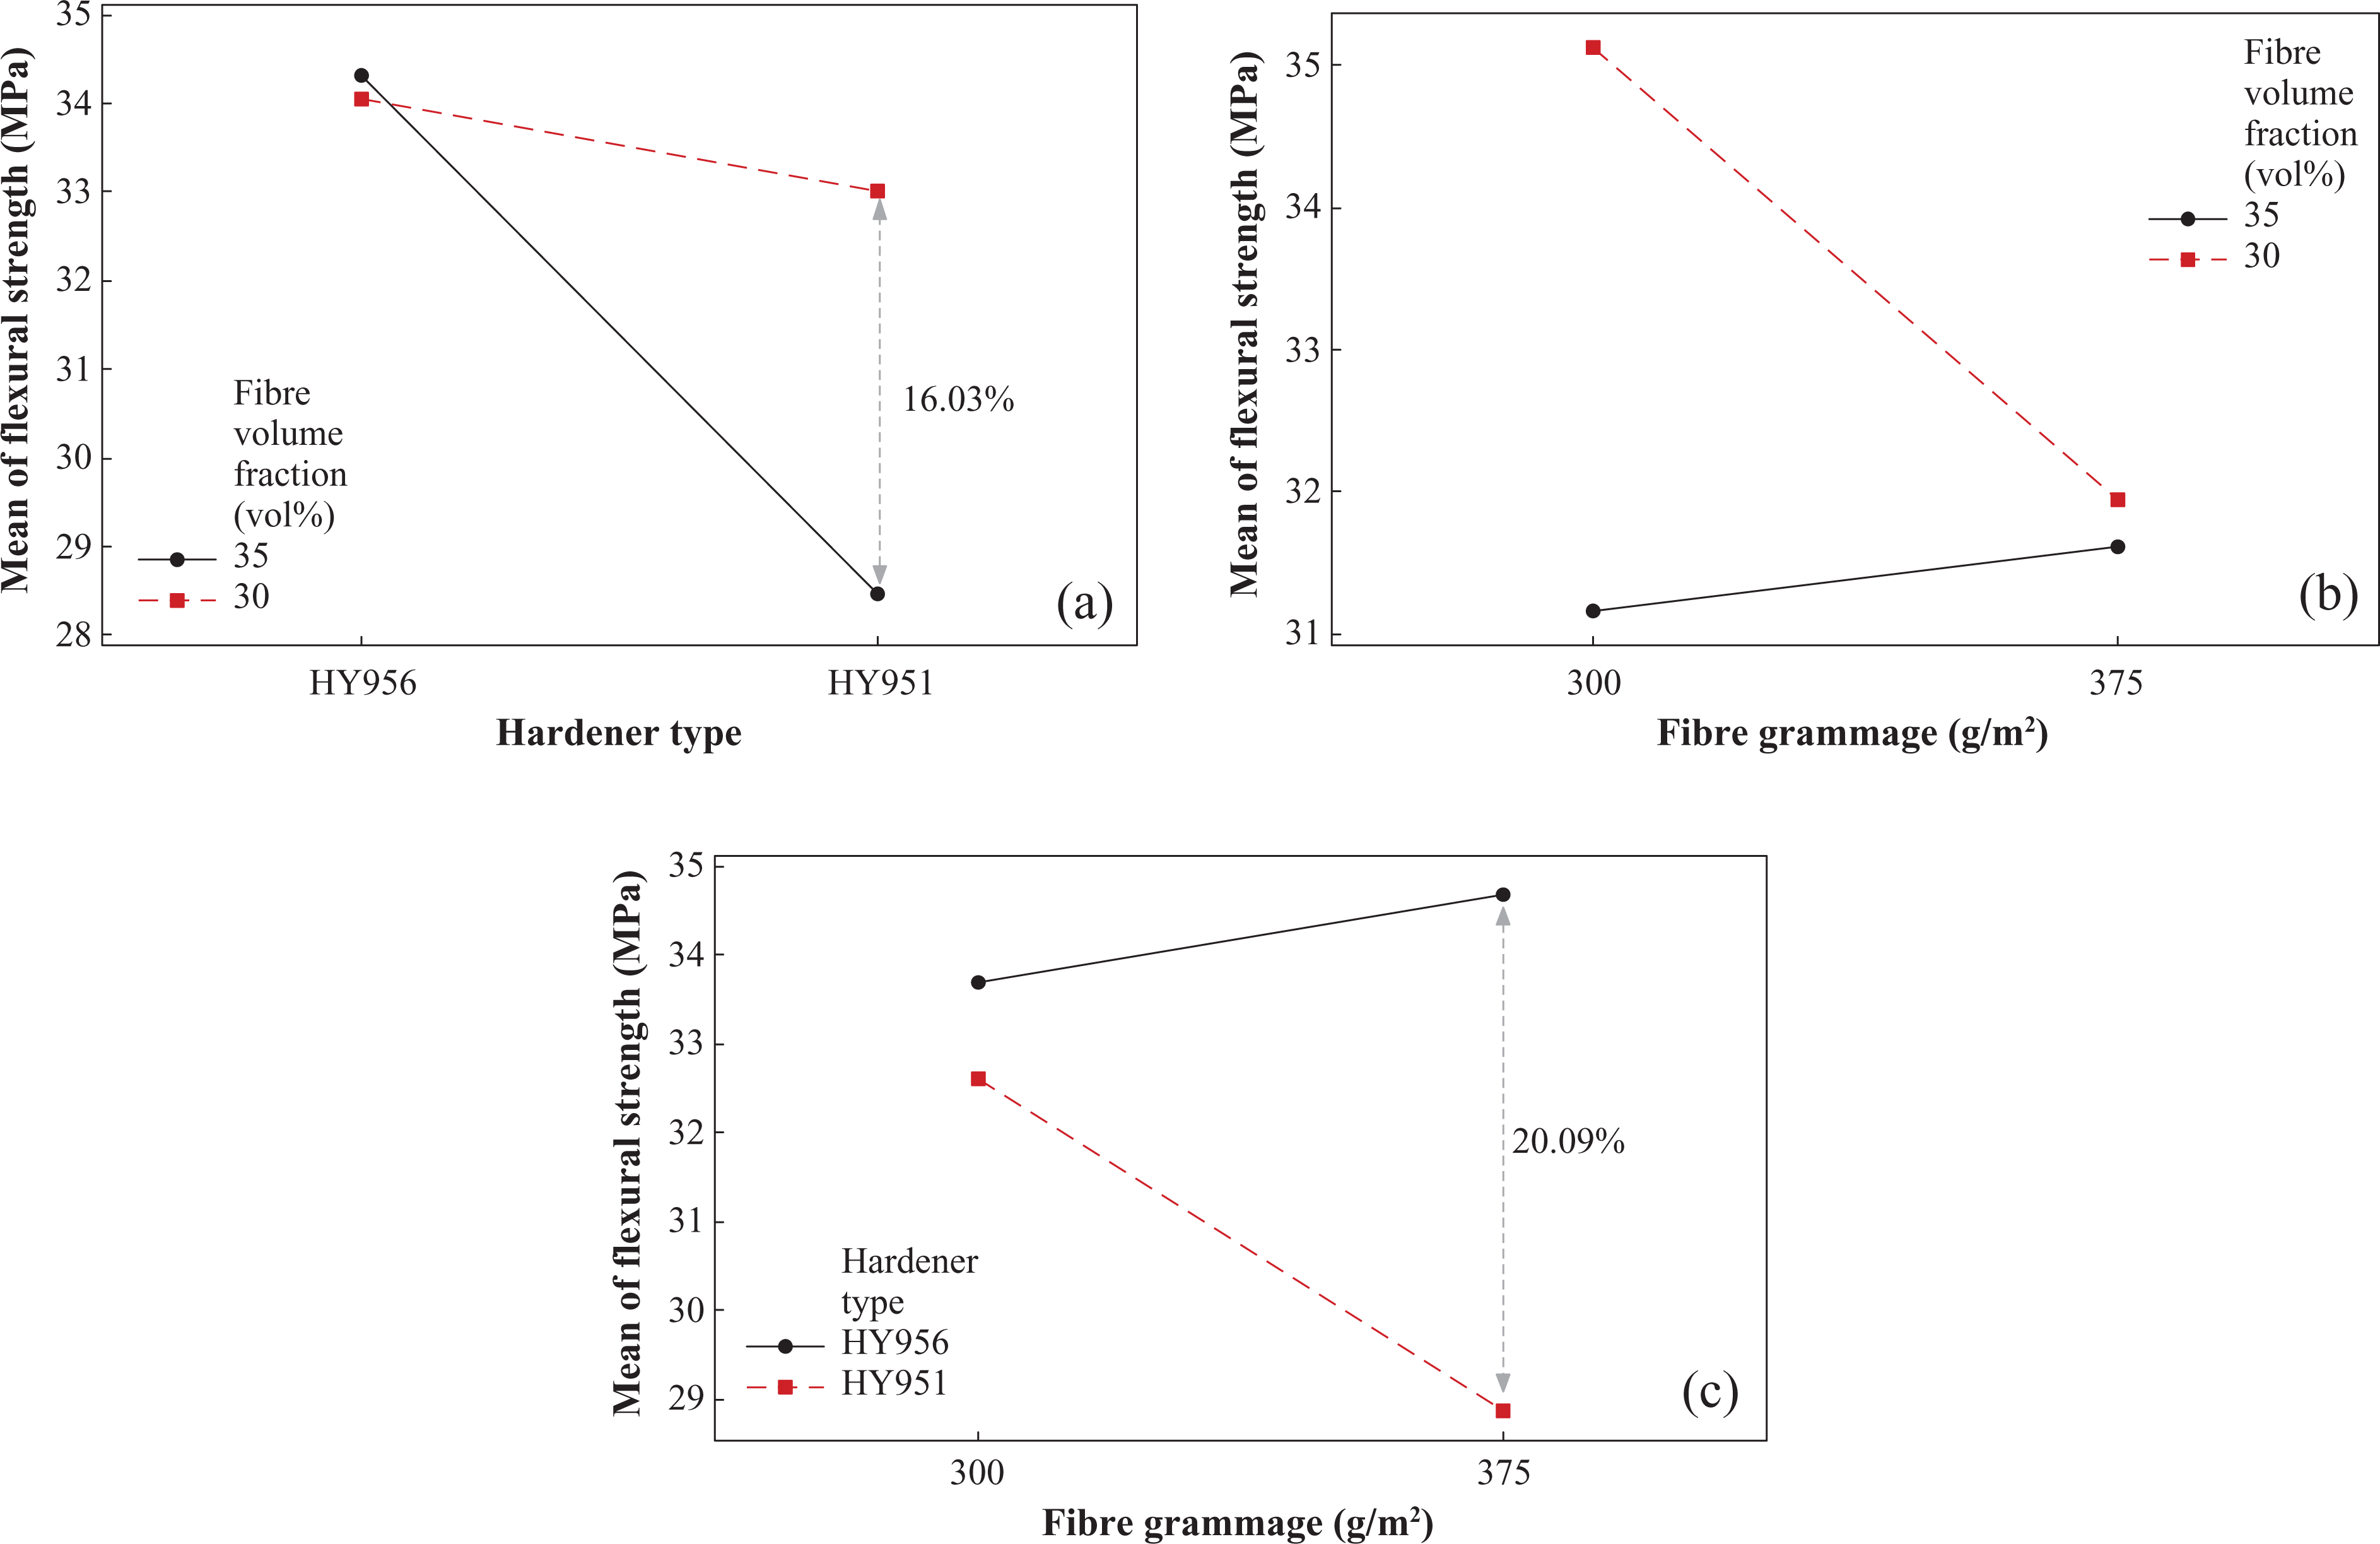
Interaction effect plots for the mean flexural strength: (a) hardener type and fibre volume fraction, (b) fibre grammage and fibre volume fraction and (c) fibre grammage and hardener type.
The flexural modulus of SCoirFRCs varied from 1.14 (±0.05) GPa to 1.85 (±0.02) GPa (Table 2). Figure 4 shows the third-order interaction effect plot for the mean flexural modulus. Similar effects were achieved when compared to the flexural strength response (Figure 3). The use of HY951 hardener decreased the stiffness of the composites manufactured with both fibre volume fractions. A significant reduction of 27.90% in modulus was reached when the fibre volume fraction was changed from 30 vol% to 35 vol% at the HY951 level (Figure 4(a)). The increase in fibre grammage from 300 g/m2 to 375 g/m2 enhanced the modulus of elasticity only when 35 vol% of fibre fraction (Figure 4(b)) and HY956 hardener type (Figure 4(c)) were considered. Although the stiffness for coir fibres is higher than for the matrix phase, the rule of mixture cannot be considered in this case, since the short fibres are not entirely oriented on the load direction. The highest stiffness can be achieved when SCoirFRCs are fabricated with 35 vol% fibre fraction, 375 g/m2 fibre grammage and HY956 hardener type.

Third-order interaction effect plot for the mean flexural modulus.
The impact resistance data varied from 5.36 (±0.47) kJ/m2 to 8.12 (±0.26) kJ/m2 (Table 2). A third-order interaction was significant, exhibiting a P-Value of 0.012 (see Table 3). Figure 5 shows the interaction effect plot for the mean impact resistance response. In general, higher amount of fibres (35 vol%) and fibre grammage (375 g/m2) with HY956 hardener, as shown in Figure 5(b) and (c), led to higher impact resistance of SCoirFRCs. The failure mode under dynamic loadings is quite affected by the fibre content, instead of the matrix phase features, as previously discussed for flexural strength and modulus. In fact, impact energy dissipation through friction due to fibre pull-out is a very important mechanism to enhance impact resistance. 37 Such mechanism may play an important role to explain these results, which will be further investigated by future fractographic analysis. A similar behaviour has also been attributed to the high strain to failure property of the coir fibre. 9 It is noted that there is a relevant interaction between the hardener type against the fibre volume fraction (Figure 5(a)) and fibre grammage (Figure 5(c)). The results imply that the fibre–matrix interfacial adhesion is largely affected by the viscosity and strength of the polymer. It is worth noting that higher impact resistance (50 kJ/m2) has been obtained for woven coir–polyester composites by Jayabal et al. 38 ; however, similar values for flexural strength have been obtained.

Third-order interaction effect plot for the mean impact resistance.
Conclusions
A full factorial design was carried out to investigate the effects of the manufacturing setup and composition on the mechanical and physical properties of SCoirFRCs. A second-order interaction effect between fibre volume fraction and hardener type significantly affected the apparent density of the composites, being attributed to polymer viscosity and fibre wettability. The lowest density was achieved when 35 vol% of coir fibres and HY956 hardener type were considered. Second-order interactions affected the flexural strength response. The flexural strength of SCoirFRCs is dominated by the epoxy matrix phase characteristics, rather than the fibre-reinforcing phase. Higher strength values can be achieved by different setup conditions; however, composites consisted of 30 vol% of coir fibres, HY956 type and 300 g/m2 grammage revealed superior flexural strength. A third-order interaction effect significantly affected the flexural modulus and impact resistance of SCoirFRCs. The highest stiffness and impact resistance values were achieved when SCoirFRCs were fabricated with 35 vol% of fibre fraction, 375 g/m2 of fibre grammage and HY956 hardener type. The mechanical performance of SCoirFRCs under impact loading is substantially dominated by the fibre content, instead of the matrix phase features. A microstructural analysis and durability evaluation will be the scope of future investigations.
Footnotes
Acknowledgement
The authors would like to thank CAPES, CNPq and FAPEMIG.
Declaration of conflicting interests
The author(s) declared no potential conflicts of interest with respect to the research, authorship, and/or publication of this article.
Funding
The author(s) disclosed receipt of the following financial support for the research, authorship, and/or publication of this article: This work was supported by CNPq (PDE-205255/2017-5) and FAPEMIG (PPM-00075-17) and CAPES (MSc scholarship).