
Abstract
In this article, a kind of tubular sandwiched engine mount (TSEM) was first used in the trackless rubber-tyred vehicles (TRTVs). TRTV have been playing an important role in underground mining. However, during the working of TRTV, the vibrations are always violent and these vibrations are very harmful. Therefore, reducing the vibration of TRTV has become an urgent and important matter. The TSEM was made of three layers, that is, the external layer, the internal layer and the middle layer. The finite element analysis (FEA) was carried out to find out whether the deformation of TSEM could meet the design requirements. To grasp the vibration isolation feature of the TSEM, the tests were performed under two working conditions of TRTVs. The results show that the rear engine mounts could always get good vibration-reducing performance, whereas the performance of the front mounts is sometimes poor in a certain direction, that is, perhaps owing to the vibration energy coupling in different directions. In addition, the vibration of the seat was measured. The test results show that the vertical acceleration is reduced when the vehicle is installed with the TSEM, compared with that of the seat when the vehicle is equipped with the existing old mounts. The results in this article could provide a good reference for the application of the tubular sandwiched structure in different rubber-tyred vehicles.
Introduction
Trackless rubber-tyred vehicles (TRTVs) have been widely introduced in many coal mines, owing to their full production efficiency. 1 However, their working environment is always poor, and vibration and shock are inevitable, which mainly arise from the uneven road and the working engine. Moreover, rubber-tyred vehicles used in the underground become larger to fulfill the requirements of construction, so the vibration problems also get more salient. As is well known, the vibration could affect the driver’s health and reduce the working efficiency, and on the other hand, the service life of the vehicles’ parts will also be reduced. 2,3 So reducing the vibration of TRTV becomes an urgent task.
To obtain the better vibration-reducing method, it is very necessary to find out the vibration sources at first. The engine is one of the major vibration sources because unbalanced disturbing forces may occur when it works. 4 People have used different kinds of mounts to isolate the engine-induced vibration from the chassis of the vehicles 5 -7 and there are passive, semi-active and active control technologies which have been applied into engine mounts for many years. Passive technology is continuously expanding to meet various demands. For example, passive hydraulic engine mounts were used to obtain the better damping effect. 8,9 Semi-active and active techniques could achieve better control performance by the use of sensors. 10 -12 Through the careful comparison among the above three control methods, it may be found that the semi-active and active methods will cause some problems such as additional system weight, high cost and so on. 13 So, passive technology is used all the time by many construction vehicles. In addition, although the vibration-reducing methods have been developing for a long time, their applications are still limited only to the automotive, marine and aircraft sectors. 14,15 From the above analysis, it is clear that an effective engine mount is essential and necessary for these rubber-tyred vehicles.
The schematic diagram of TRTV is given in Figure 1. At present, an engine mount installed in the TRTV could only isolate the vertical direction vibration. More importantly, these mounts began to tear and failed to work normally during their service time; this would not only result in a deteriorating riding experience but also has a risk to destroy the other components of the vehicles. So it is necessary and vital to find a new kind of engine mount. To this end, a kind of tubular sandwiched engine mount (TSEM) was designed and first used in the TRTV. The authors tried to make these engine mounts buffer the vibration in more directions. The finite element analysis (FEA) was carried out and the related real vehicle tests were performed to check the vibration-reducing effects of the new engine mounts. The research in this article is helpful to improve the comfort of the underground TRTVs.

Schematic diagram of TRTV.
Design of TSEM
Vibration of diesel engine
The TRTVs are installed with a diesel engine as their power source. Their total mass is 550 kg, and the output power is 92 kW, the normal speed range is between 1500 and 2300 r/min. There are many factors that are related to engine’s vibration, 16 but through the analysis of the vibration, it is easy to discover that the crankshaft torsion vibration is the major factor. When the crankshaft rotates during the operation of the engine, the piston goes through four different strokes. Thus, speed fluctuations and the periodic variation in pulse torque output of crankshaft could exist. As a result, it will cause the periodic torsion vibration. In addition, it should be pointed out that the unbalanced inertial force and torque can be better balanced.
Tubular sandwiched engine mount
Structure of TSEM
The structure of TSEM is shown in Figure 2. From Figure 2, it can be found that the TSEM consists of three layers. The external and internal layers are made of 45# steel and the middle layer is made of natural rubber (NR) due to its good compressive performance. Three layers are bonded together through vulcanisation technology. It is clear that NR’s stiffness is relatively low, and therefore, the vibrational energy of the engine is mainly dissipated through the deformation and hysteresis of NR to achieve the design requirements. 17,18

Tubular sandwiched structure.
The vulcanisation technology has become more and more mature and for the TSEM, its production mould is also simple, so its manufacture cost is always low. At the same time, because of the symmetric characteristic of the TSEM structure, it can better attenuate the engine vibration in the axial and radial directions. Based on these advantages, the TSEM is chosen for engine mounts of TRTV and its basic parameters are given as: the inner diameter of the whole engine mount is 45 mm, the total length is 80 mm and the thicknesses of the external, middle and internal layers are 3, 14 and 3 mm, respectively.
Connecting device between the engine and TSEM
When the TSEM was installed in the TRTVs, its inner layer was connected with the connecting shaft and its outside layer was assembled with the supporting device, which could be seen in Figure 3. Here, the connecting shaft was fixed with the engine by four bolts; four bolt holes can be seen in Figure 3(b) and the supporting device was connected with the chassis of the TRTV. Several shims were used to adjust the gap between the two parts of the supporting device of engine mount. Here, four TSEMs were installed at each corner of the engine. The concrete layout of TSEM is shown in Figure 4.
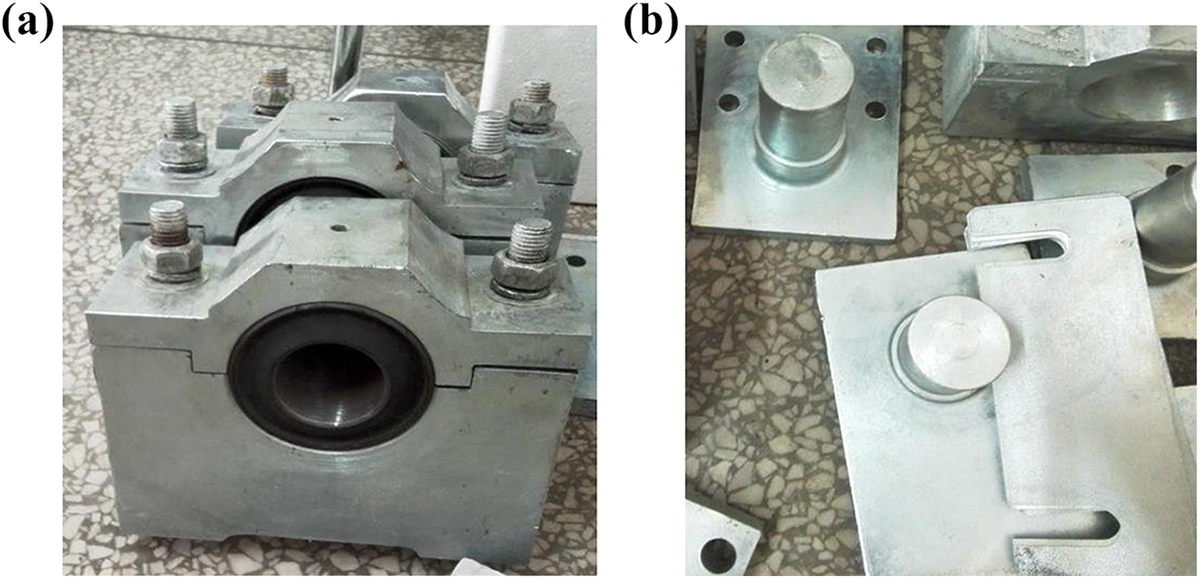
Connecting devices: (a) supporting device of engine mount and (b) connecting shaft and shim.
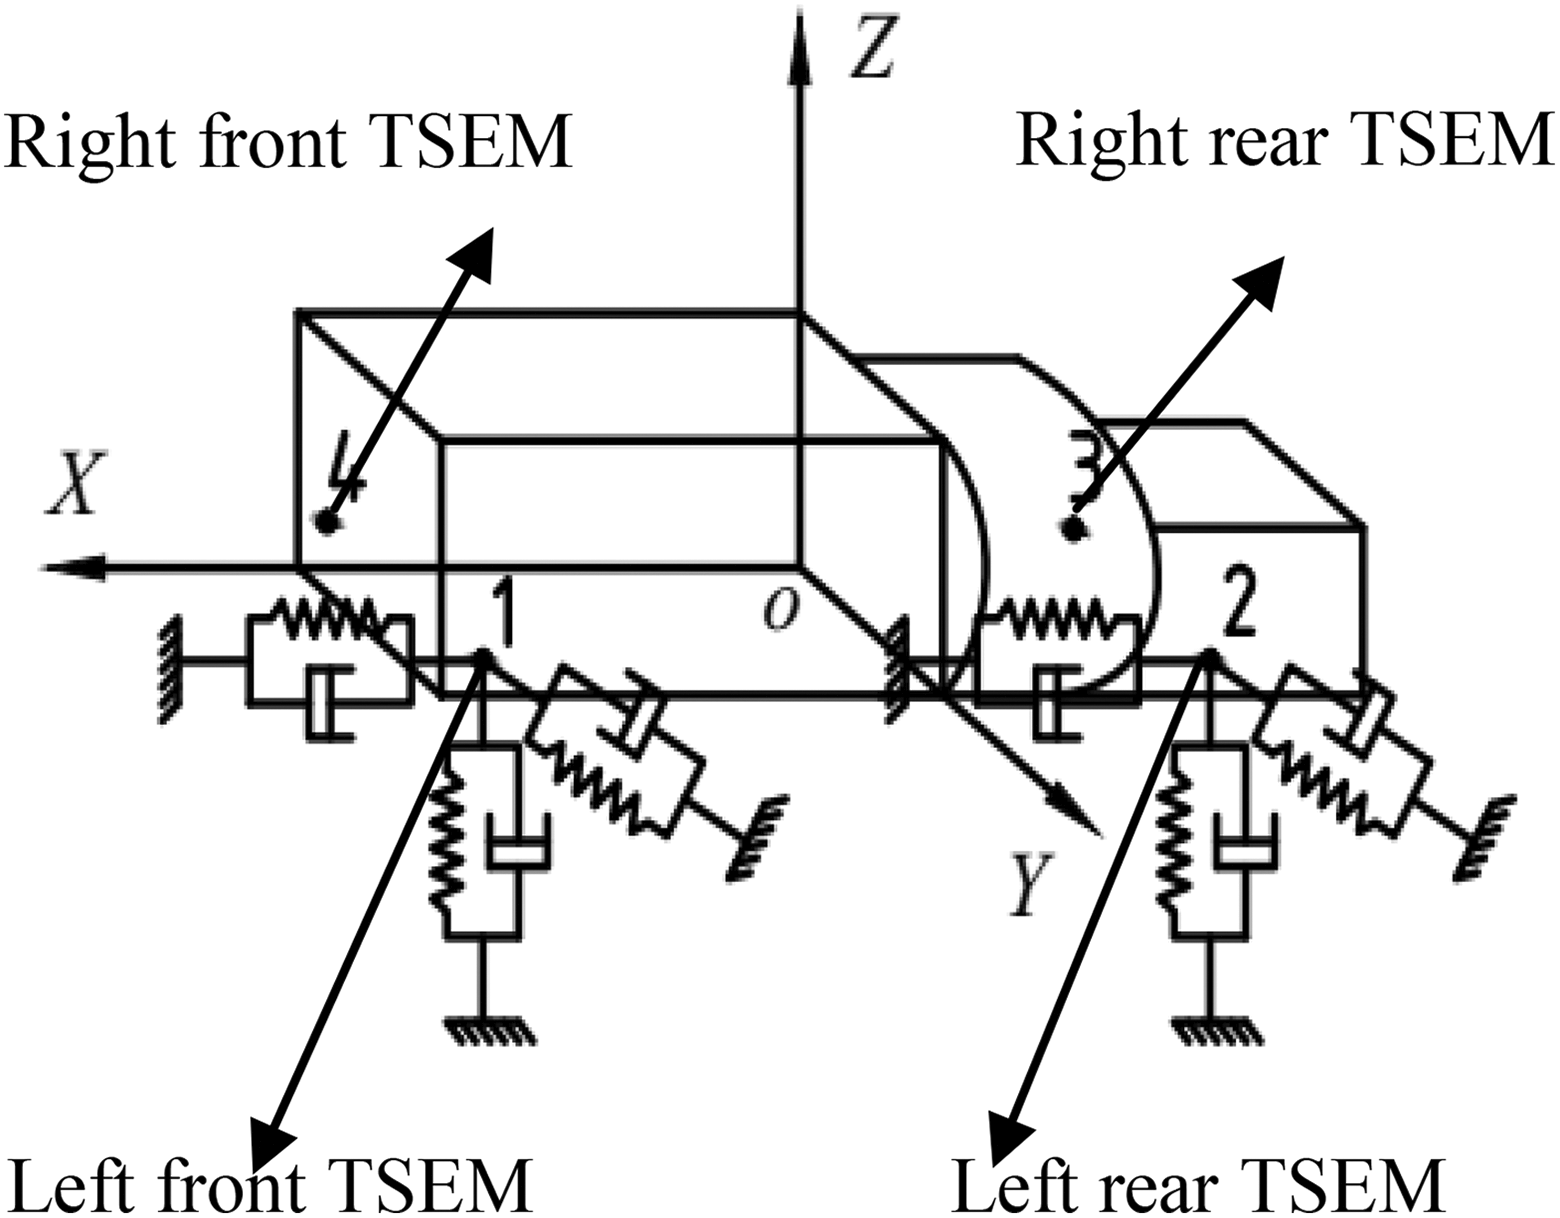
The layout of TSEM.
Finite element analysis
Here, it should be noted that the vibrational energy of the engine is mainly dissipated through the deformation and hysteresis of the middle layer. However, larger deformations would affect the service life of the NR. Usually, the maximum allowable deformation of the NR is 20–40%. 19 Next, FEA is used to find out whether the deformation of a TSEM could meet the deformation requirement. In this article, the deformations are gotten using ANSYS software. Most parts of the TSEM are made of 45# steel except for the middle layer. Therefore, the material parameters are given as follows: for the steel parts, their elastic modulus is 2.1 × 10⁵ MPa, Poisson ratio is 0.3 and the density is 7.8 × 10³ kg/m3. For the middle layer, NR is often considered to be isotropic, incompressible and hyper-elastic in FEA. Therefore, the Mooney-Rivlin material model is used to describe the mechanical properties of NR, and its two parameters C10 and C01 could be gotten according to the following expression.

where E is the elastic modulus, G denotes the shear modulus of the NR and G can be obtained according to the following equation.

Equation (2) may be further expressed as

where HA is the Shore A hardness of NR. The relationship between G and HA is given in Figure 5. 20 In this article, HA = 60, C01/C10 = 0.05; therefore, two Mooney-Rivlin parameters are obtained as C10 = 0.618 MPa and C01 = 0.03 MPa. At the same time, the Poisson ratio is 0.499 and the density is 1.3 × 10³ kg/m3.

The relationship between H4 and G.
Next, in the ANSYS software, the finite element model of engine mount system could be built, which is given in Figure 6, and its mesh generation model is shown in Figure 7 using a free division method. During the modelling, Solid 186 element is used to model the NR, and the 45# steel is modelled as Solid 185 element. In addition, because the outside layer of TSEM is assembled with the supporting device, all of its degrees of freedom are limited, that is, the outside layer is subject to a fixed constraint. Here, the mass of the engine is 550 kg, and considering the practical experience, a random load (impact force) of 1.32 × 10⁴ N is applied to four bolt holes, so that the load on each bolt hole is 3.3 × 10³ N.

A model of the engine mount system.

The mesh generation of the engine mount system.
When above parameters are all defined successfully, the FEA of TSEM could be carried out. At last, the concerned output results (equivalent strain) are shown in Figure 8. From Figure 8, it is clear that the maximum strain occurs at the center of the middle layer, and its value is 13.06%.

The strain graph of TSEM system.
Vibrating isolation analysis
Test equipment
The vibration test schematic of engine mounts is given in Figure 9, from which it can be seen that the DH311E-type accelerometers, charge amplifier and a computer with DH5927 dynamic signal analysis system were used to collect engine vibration signals in the time domain. Four accelerometers were installed under the engine assembly, and the other four accelerometers were fixed on the vehicle chassis. Thus, the vibrational signals from the engine were captured by the up accelerometers. Simultaneously, the other down accelerometers were used to receive vibrational signals of the vehicle chassis. Through comparison of two sets of signals, the performance of the mounts could be known. In addition, the charge amplifiers were used to further magnify the small vibration signals and then these signals entered into the dynamic signal analysis system.

Vibration response test schematic.
For the TRTV, there are different working conditions, such as start-up, acceleration, braking and so on. In this article, only two typical working conditions were taken into account: one was the normal driving with a speed of 20 km/h and the other was under idle conditions with an engine speed of 600 r/min.
The test results
Here, the vibration acceleration signals in the time domain were measured according to Figure 9. The DH311E-type accelerometers could capture X, Y and Z-direction vibration simultaneously. Each measurement direction was shown in Figure 4. The X direction stands for the direction of the vehicle traveling. The data for the right engine mounts at normal driving are shown in Table 1, and the corresponding data for the left mounts are given in Table 2. In Tables 1 and 2, the root mean square (RMS) values of the vibration acceleration could be obtained according to the following equation.

where aRMS refers to the value of RMS of a set of N acceleration measurement signal (m/s2) and ai stands for the ith acceleration signal component.
Vibrational acceleration data of right mounts at normal driving speed (m/s2).

RMS: root mean square.
Vibrational acceleration data of left mounts at normal driving speed (m/s2).
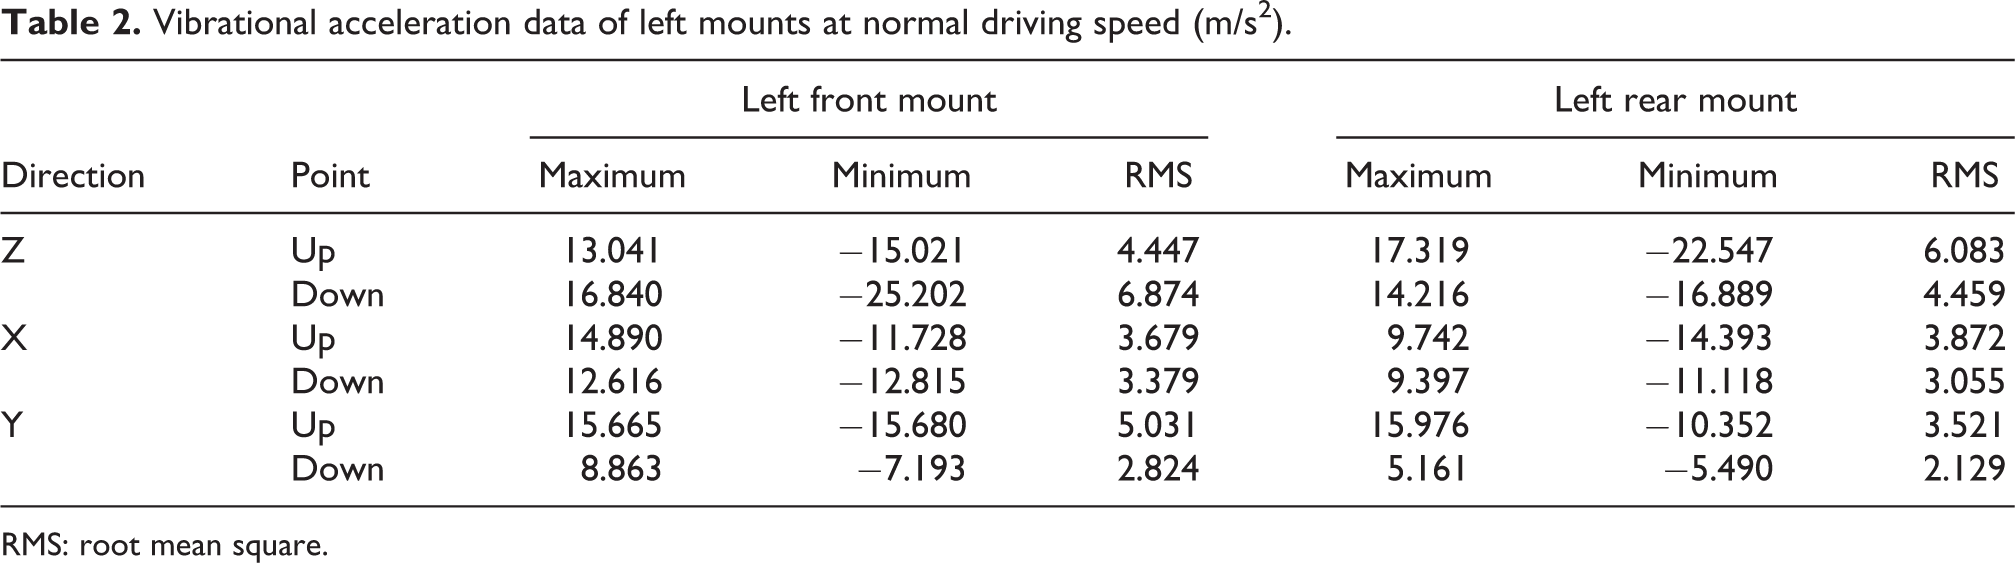
RMS: root mean square.
From Tables 1 and 2, it is obvious that the vibration accelerations of the right and left rear mounts decreased in three directions. For the right rear mounts, the RMS in the Z direction changes from 6.018 to 3.883 m/s2, the RMS value in the X direction reduces from 3.523 to 2.802 m/s2 and the RMS value in the Y direction drops from 3.307 to 1.904 m/s2. It is easy to determine that the relative reductions for Z, X and Y directions are 35.5%, 20.5% and 42.4%, respectively. For the left rear mounts, its RMS value in the Z direction transforms from 6.083 to 4.459 m/s2, the RMS values in the X direction are 3.872 and 3.055 m/s2 and the RMS values in the Y direction are 3.521 and 2.129 m/s2. Its relative reductions in the Z, X and Y directions are 26.7%, 21.1% and 39.5%, respectively. In sum, the vibrational isolation effect of the two rear mounts in Y direction is better than that of the other two directions.
However, for the right front mount, the RMS value of Z direction reduces from 3.927 to 2.927 m/s2, so its relative reduction is 25.5%. Its Y direction values also decline from 4.566 to 2.447 m/s2. But its X-direction RMS values do not decrease; they increase from 2.841 to 3.726 m/s2. This phenomenon is produced because of the vibration energy coupling in different directions. At the same time, Figure 10 gives the accelerations in the three directions for the right front mount during normal driving. From Figure 10, it can be discovered that although the X-direction vibration could not be reduced, the whole vibration-reducing performance is satisfactory.
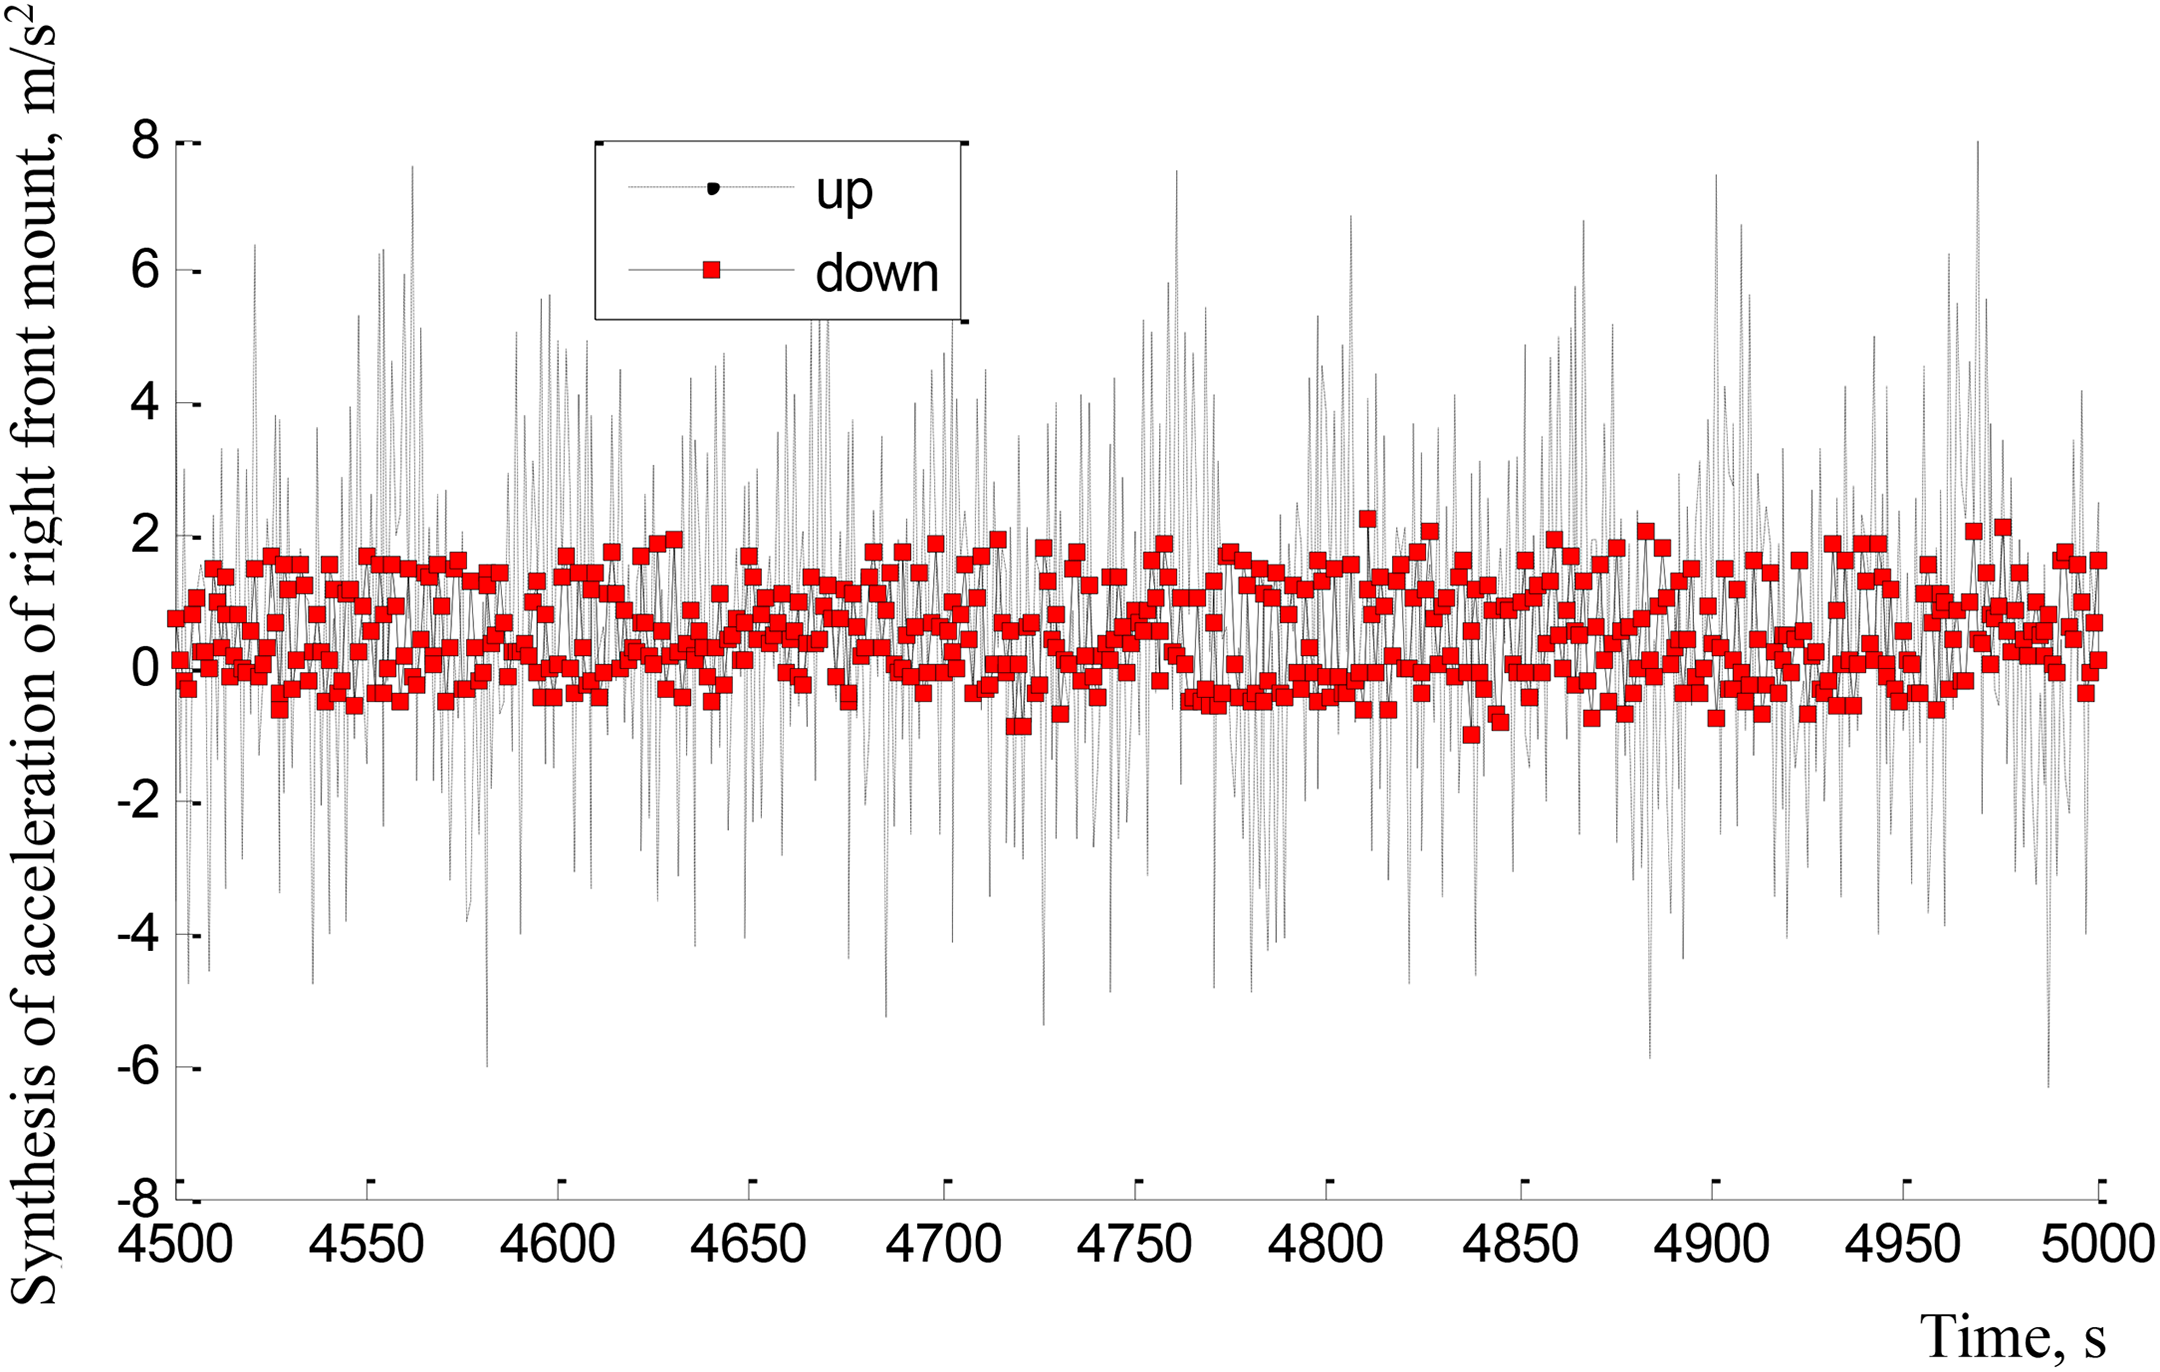
Synthesis of acceleration in three directions of right front mount under normal driving conditions.
For the left front mount, when the vehicle is working during the normal driving, the X and Y-direction accelerations drop, while the acceleration in the Z direction rises; the reason is the same as that for the right front mount.
Next, the test was carried out when the engine was running at idle. The results are shown in Tables 3 and 4, respectively. At this time, the engine becomes the only vibration source. From Tables 3 and 4, the acceleration values of the down test point were less than those of the up test point for the two rear mounts. The relative reductions in the Z, X and Y directions for the right rear mount are 39.5%, 27.9% and 35.8%, respectively. For the left rear mount, their relative reductions are 32.7%, 22.3% and 38.9%, respectively. For the two front mounts, the vibration-isolating effects in some directions are not good. For example, the maximum value of acceleration in the X direction for the right front mount goes from 7.871 to 11.451 m/s2. These results are similar to those for the left front mount. Therefore, it is urgent for the next research to optimize the structural parameters of the designed TSEM.
Vibrational acceleration data of right mounts up and down test point while idling (m/s2).
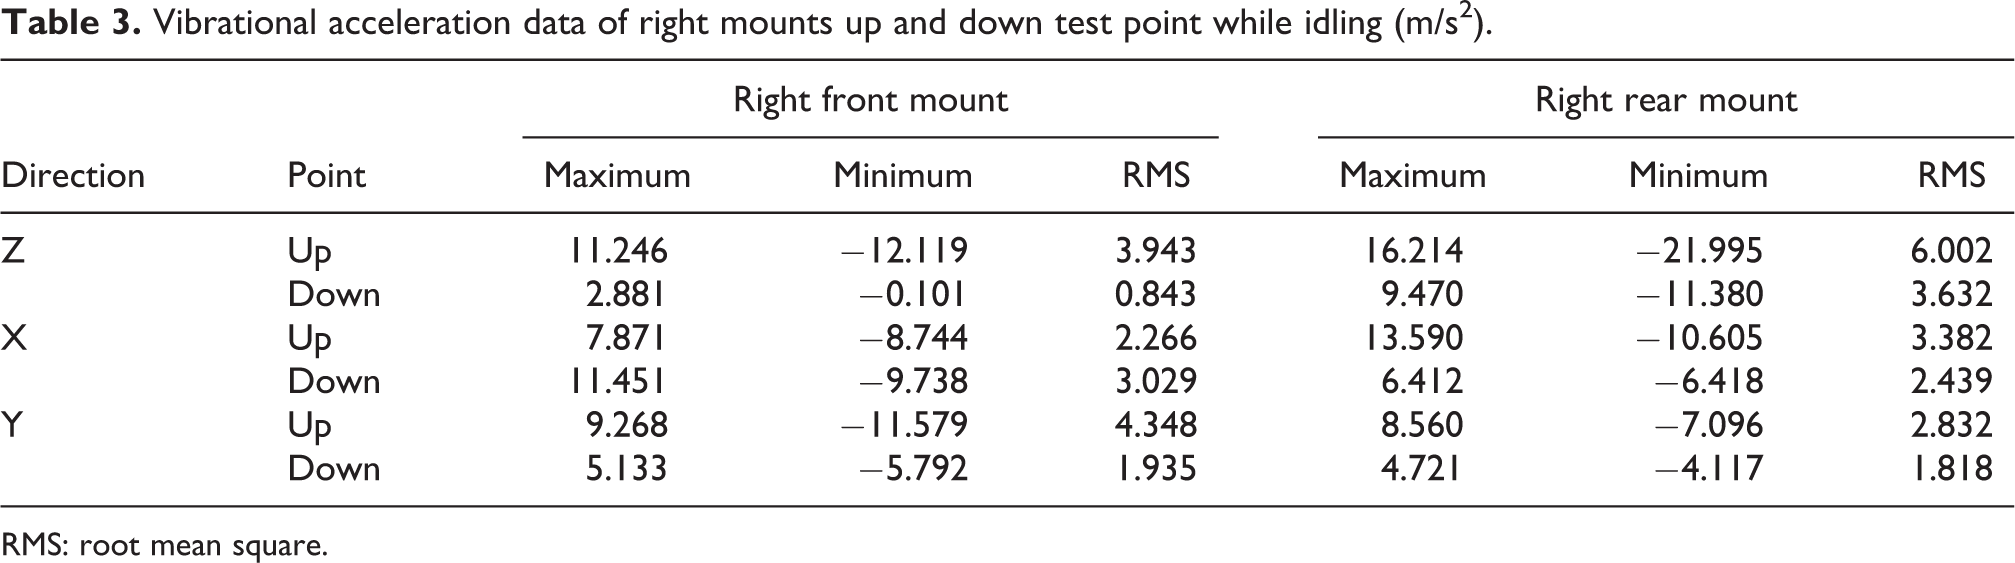
RMS: root mean square.
Vibrational acceleration data of left mounts up and down test point at idle (m/s2).

RMS: root mean square.
Next, to illustrate the better vibration isolation performance of the TSEM than the existing old engine mounts used for the underground rubber-tyred vehicles, the seat accelerations are tested when the vehicle is operated during the normal driving with a speed of 20 km/h. Of course, it should be noted that the acceleration is always theoretically taken as one of the evaluation standards of seat comfort. 21,22 Figure 11 gives the vertical vibrational acceleration of seat when the rubber-tyred vehicle is installed with the existing engine mounts, it could be known from Figure 11 that the acceleration range is between 11 and −14 m/s2 during the sampling time of 5 s. When the time is equal to 26.63 s, the acceleration value is 10.59 m/s2, and when the time changes to 28.19 s, the acceleration at this time becomes 13.25 m/s2 towards the contrary direction. The RMS value for the seat under this condition is 3.21 m/s2.

Vertical acceleration of seat when vehicle is installed with the existing old engine mounts.
At the same time, the vertical vibrational acceleration of the seat when a vehicle is installed with the TSEM is shown in Figure 12. It is clear that the vibration is reduced obviously. During the sampling time of 10 s, the acceleration of the seat changes about from 3 to −3.5 m/s2. When the time is 103.2 s, the acceleration is −3.306 m/s2, and when the time reaches 103.6 s, the acceleration is 2.741 m/s2. At this time, the RMS value for the seat decreases and becomes equals to 1.14 m/s2, so its relative change is 64.3%. Therefore, by comparison of Figures 11 and 12, it is obvious that the comfort performance of the seat is raised when a vehicle is installed with the TSEMs.
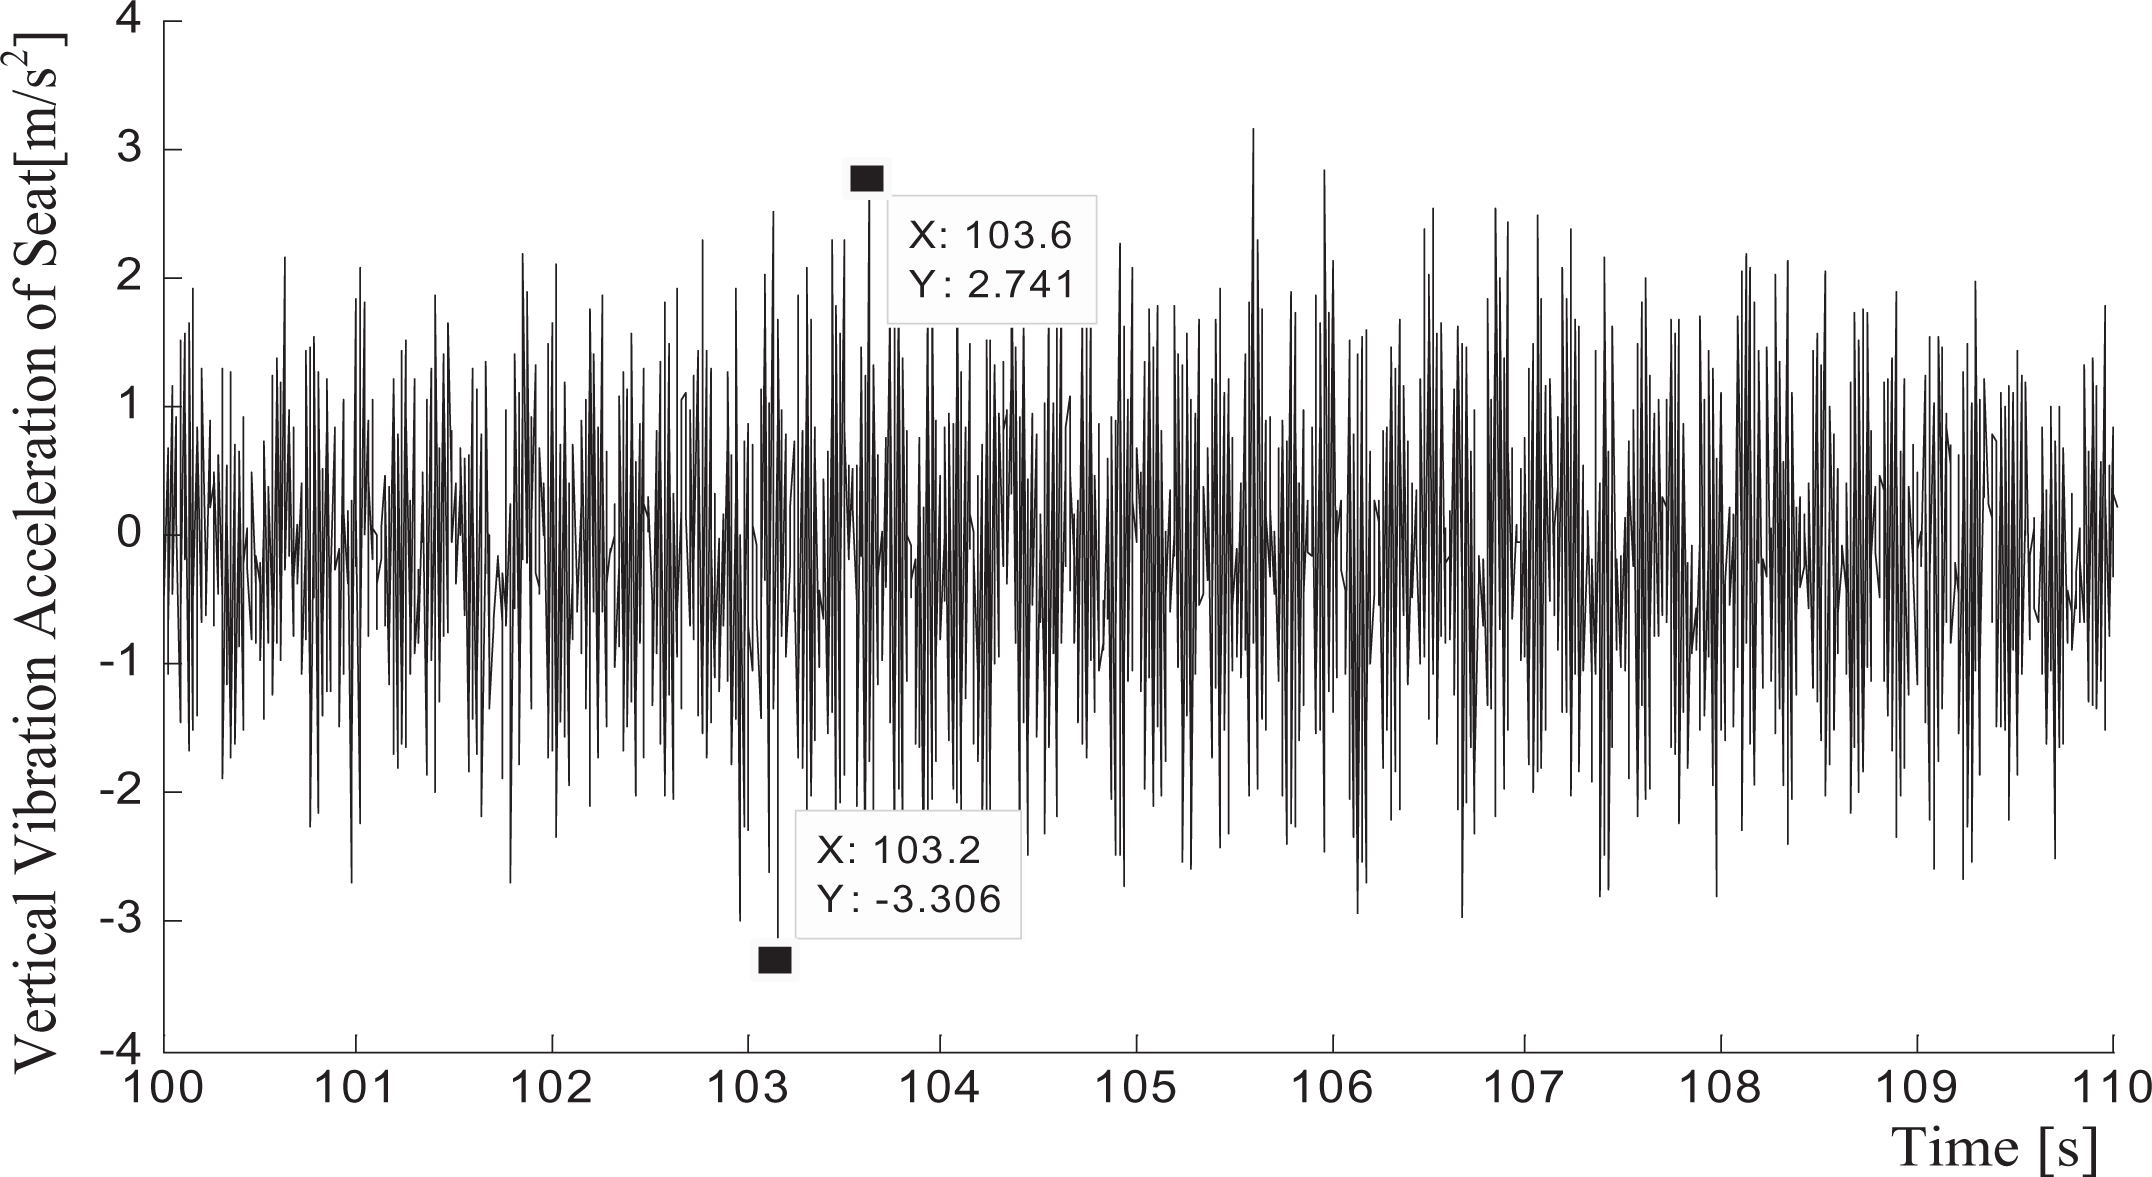
Vertical vibrational acceleration of seat when the vehicle is installed with TSEM. TSEM: tubular sandwiched engine mount.
Conclusions
A type of tubular sandwiched damping structure was used for the first time in the engine mounting of an underground TRTV. The deformation of TSEM was obtained using ANSYS software, and analysis showed that the maximal deformation occurs at the centre of the middle layer, its value being 13.06%, which meets the requirement of the design of TSEM.
Through real vehicle testing, vibrational acceleration data in the time domain for the mounts during the normal driving and at idle have been given. When the vehicle was operated during normal driving, the relative reductions in RMS for the right rear mount in Z, X and Y direction were 35.5%, 20.5% and 42.4%, and those for the left rear mount are 26.7%, 21.1% and 39.5%, respectively. When the vehicle was idling, the relative reductions in RMS for right rear mount in the Z, X and Y directions were 39.5%, 27.9% and 35.8%; the RMS absolute reductions in the Z, X and Y directions for the left rear mount were 1.967, 0.774 and 1.234 m/s2; and their relative reductions were 32.7%, 22.3% and 38.9%, respectively. The vibration level of the seat was also reduced obviously when the vehicle was installed with this kind of TSEM. The results in this article are useful for the further study of other damping structures and their applications in engineering.
Footnotes
Acknowledgement
This research project was supported by National Natural Science Foundation of China (grant no. 51405323).