
Abstract
Selective detection of toxic volatile organics in the gas-phase is required for many applications. Here we report a novel optical waveguide for near infrared (NIR) spectroscopy for quantitative detection of volatile organic compounds (VOCs), enabling sensitive and selective measurements of multiple VOCs simultaneously. The adsorption of the VOC molecules inside the nanopores allows detection at a much lower concentration compared to traditional gas-cell detection, where infrared light propagates through the gaseous molecules in the free space. Results show that a 10 mm long porous core waveguide offers a significant enhancement in signal of 1800x per millimeter pathlength compared to a 400 mm long conventional gas-cell. Moreover, lowering the temperature of the waveguide facilitates increased adsorption of molecules inside the pores and maximizes the signal as demonstrated for gaseous toluene at four different concentrations. An increase in signal by a factor of 10 is observed as the temperature decreases from 70 to 10°C. At 10°C waveguide temperature, the limit of detection for toluene is 2.5 ppm. Additionally, we measured a binary mixture of toluene and 1-octene at different temperatures, showing the selectivity of the method. The combined effect of nanopore adsorption and temperature-assisted condensation allows for selective and sensitive on-chip detection of volatile organics. The proposed waveguide sensor technology has promising potential for industrial gas leak detection, air quality monitoring, and medical applications.
Introduction
Volatile organic compounds (VOCs) are among the most common indoor and outdoor air contaminants. Not only do they aid and accelerate phenomena such as global warming and ozone layer depletion, they are also toxic for humans. 1 Prolonged exposure to these pollutants has been linked to cancer, central nervous system damage, hematological problems, and respiratory illness. 2 VOC detection is imperative in occupational settings to ensure compliance with permissible exposure limits and safeguard worker health. Additionally, precise monitoring aids in environmental protection by regulating emissions and mitigating potential adverse effects on air quality and human well-being. To regulate and prevent long-term exposure to these toxic gaseous compounds, a wide range of detectors spanning from handheld portable devices to lab-grade analytical tools have been developed and made commercially available. Currently, commercially available portable VOC sensor technologies include metal oxide detectors, 3 photoionization detectors,4,5 and electrochemical sensors. 6 These devices are capable of online and remote environmental monitoring, however, still have many limitations, such as inadequate selectivity, high limits of detection, drift, and interference.
Optical waveguide is a well-known sensing component that harnesses the principles of guided light propagation to detect and analyze changes in their surrounding environment. Optical waveguide-based gas sensors that rely on refractive index change can be highly sensitive but are not selective in real environments when multiple compounds are present.7–11
Infrared spectroscopy-based waveguide sensors have selectivity, but lack adequate sensitivity for low gas concentrations.8,12 These waveguide sensors span both the near infrared (NIR) and mid-infrared (MIR) spectral regions. MIR spectroscopy (2.5–25 µm) identifies fundamental vibrational transitions, whereas NIR spectroscopy (0.75–25 µm) captures overtone and combination bands that are inherently more complex to interpret due to their weaker and overlapping spectral features. 13 While it is easy to quantify different compounds using MIR spectroscopy, there are also several drawbacks. MIR systems often require specialized sources and detectors, for example, narrow-bandgap MIR photodetectors typically need cryogenic cooling to suppress thermal noise, which adds bulk and cost. 14 In contrast, NIR-based sensing can leverage readily available, low-cost instrumentation: robust silica fiber optics, uncooled detectors, and compact light sources. 15 These waveguide sensors rely on evanescent field for detection and allow real-time measurement of multiple VOCs, but achieving high sensitivity and low limits of detection is challenging because gas is a low-density matrix and there are not many molecules present in the vicinity of the evanescent field. Photonic crystal waveguides have been reported for detection of gaseous analytes.16–18 Such waveguides leverage periodic dielectric structures to manipulate light propagation, enabling enhanced light-matter interaction, and detect gas species by monitoring spectral shifts or intensity changes induced by analyte-specific light absorption. However, such waveguides are designed to operate at a specific wavelength and thus can only detect analytes that adsorbs that wavelength, 19 limiting multianalyte detection ability.
A way of improving the sensitivity of waveguide sensors, is to create a very thin slot along the core, which increases the interaction of light with the molecules without affecting the light propagation in the waveguide,20–23 and when coupled with infrared spectroscopy, can be both selective and sensitive to low gas concentrations. 24 Another common way of improving sensitivity is to preconcentrate the target gas molecules inside an adsorbent material, followed by rapid thermal desorption onto a sensor. This method has been successfully demonstrated for various types of sensors, preconcentrator materials, and gases.25–31
We report a novel method for quantitative detection of VOCs using near infrared (NIR) spectroscopy using a multi-mode nanoporous waveguide. The nanoporous core acts both as a medium for light propagation as well as a preconcentratorthat absorbs gas molecules. Here, all the light that propagates in the core directly interacts with the molecules, resulting in highly sensitive detection. The features of the porous matrix are much smaller than the wavelength of light, thus light propagation is the same as for any dielectric waveguide. The core and the cladding of the waveguide are made from porous silica, which is transparent from 1.2 µm to 2.4 µm wavelength, allowing one to either use a broadband light source or to select a desired set of discrete wavelengths based on the unique spectral peak of the gases, thus offering high degree of selectivity. Moreover, controlling and modulating the temperature of the waveguide has a significant effect on the adsorption of gaseous molecules in the waveguide core, thus adding further capability to improve selectivity and sensitivity of detection. In our previous work, we have demonstrated that the mesoporous silica waveguide is capable of measuring different volatile organic gases and compared the NIR spectral features of the gases absorbed inside the waveguide-pores with their respective gaseous and liquid spectra. 26 This preliminary work paved the way for further exploring the waveguide technology as a sensor for toxic volatile organic gases.
To demonstrate the sensing capability of the nanoporous silica waveguide sensor, two characteristic VOCs, toluene and 1-octene, were tested at different concentrations and temperatures. Toluene is commonly used in industrial processes and products such as paints, coatings, adhesives, and as solvent in chemical reactions. Due to its harmful impact on human health and its widespread industrial use, its monitoring is crucial in occupational settings where workers may be exposed to it. 32 The adsorption of the toluene molecules inside the nanoporous core allows detection at a much lower concentration compared to traditional gas-cell detection, where infrared light propagates through the gaseous molecules in the free space. Moreover, lowering the waveguide temperature facilitates increased adsorption and condensation of molecules inside the nanopores and maximizes the infrared absorbance signal. To showcase the waveguide’s multiple analyte detection capability, a binary mixture of toluene and 1-octene, was measured at different waveguide temperatures.
Experimental methods
Device fabrication
For the fabrication of a porous silica waveguide, boron-doped p-type 0.01–0.02 Ω cm resistivity, and <100> orientation silicon wafer samples were cut into 25 × 25 × 0.525 mm samples and were electrochemically etched in a 1:1 mixture of 48% hydrofluoric (HF) acid and ethanol. To create a porous core layer on top of a porous cladding layer, two different current densities 120 mA cm−2 and 130 mA cm−2 were used, respectively. For the light to be guided in the core, refractive index (n) of the core must be higher than the cladding (ncore>ncladding). Therefore, the cladding was fabricated to have higher porosity compared to the core, so that the cladding has lower refractive index. The porosity of the core layer is approximately 65%. The resulting double-layered porous silicon area has, a diameter of 15 mm, 200 µm thick core, and 30 µm thick cladding. Following that, standard lithography process and reactive ion etching were used to create a slab of 200 µm wide waveguide. The opposite sides perpendicular to the slab were cut using silicon dicer to create a waveguide of 10 mm. Finally, thermal oxidation was carried out at 900°C for 9 hours to convert the porous silicon to porous silica. The schematic of the waveguide structure is shown in Figure 1. Schematic of the waveguide structure.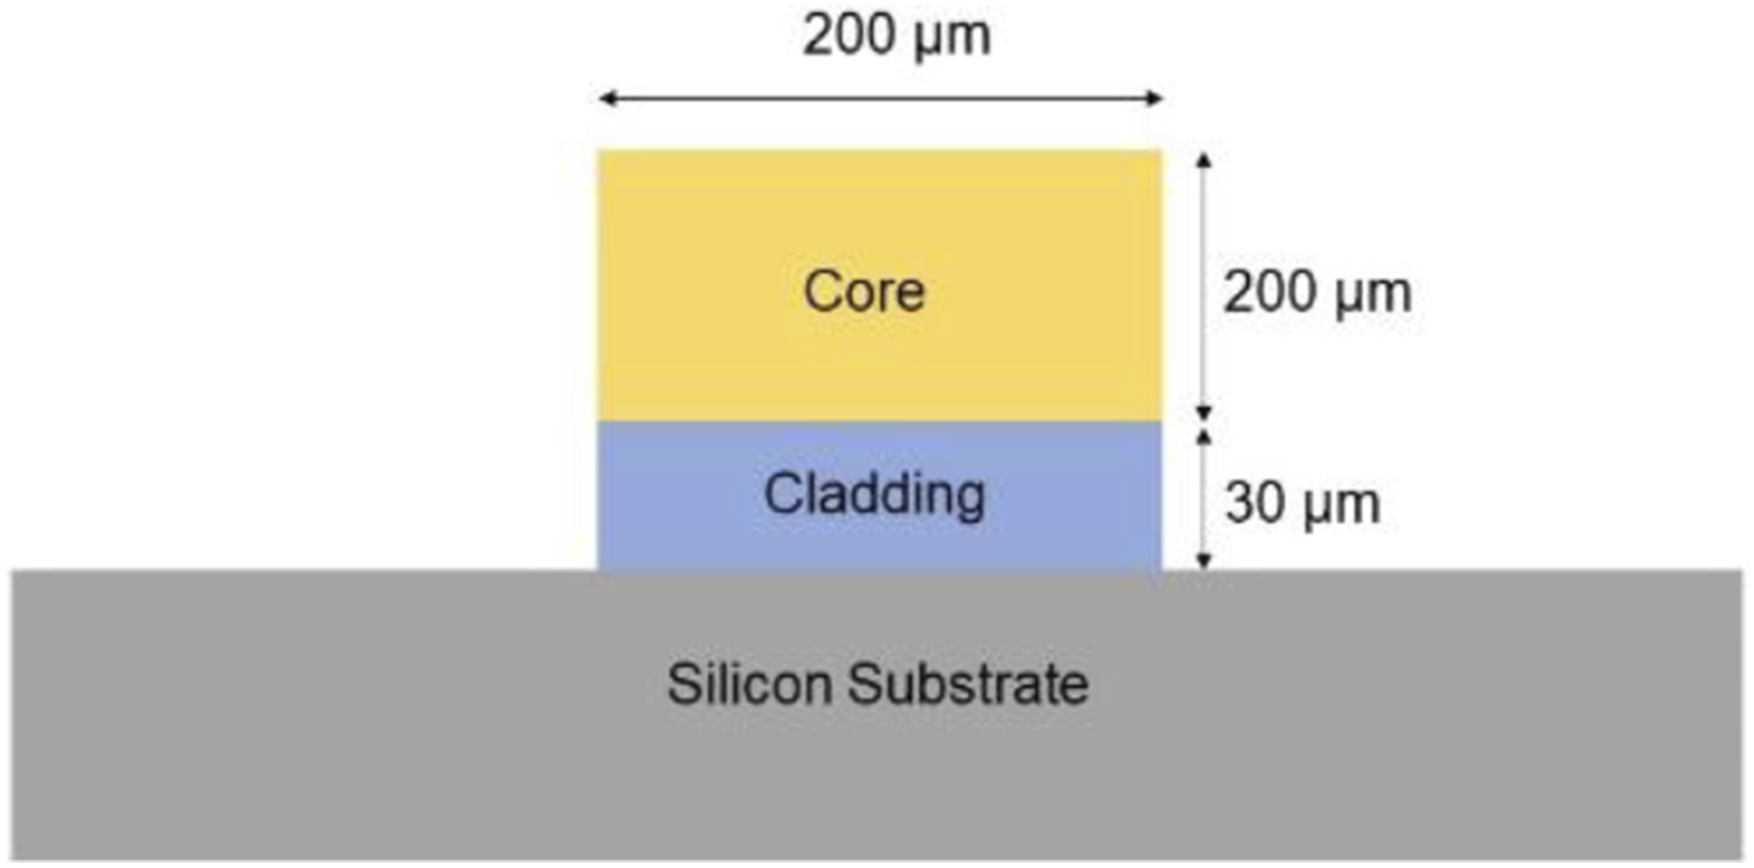
The fabricated porous silica waveguide was then aligned with cleaved optical fibers (200 µm core, FT030, Thorlabs, Newton, NJ, USA) to couple light into and out of the waveguide. The waveguide and optical fiber combination were then placed into a homemade flow-cell containing a Peltier element (sized 2 cm by 2 cm), a heat sink, and thermocouple to control and measure the temperature of the waveguide.
Testing setup
Toluene (Fisher Chemical, Waltham, WA, USA, 98%) and 1-octene (Sigma Aldrich, St. Louis, MO, USA 98%) were selected as the test analytes for spectroscopic evaluation of the porous silica waveguide, and a commercially available 400 mm pathlength gas-cell (SN 0150022, Wavelength References Inc. Corvallis, OR, USA) was used for comparison. Different toluene and 1-octene concentrations in the gas phase (50–1000 ppm) were generated using an Owlstone V-OVG vapor generator (Owlstone Inc, Darien, CT, USA). A fiber-coupled Fourier-transform near infrared spectrometer (Antaris™ MX FT-NIR, Thermo Scientific™) was used to acquire the near infrared absorbance spectra between 11 111 and 4 000 cm-1 (900 and 2500 nm) with 200 scans at 2 cm−1 resolution. Silica optical fibers of 600 µm core (M29L01, Thorlabs) were used to deliver light to and from the conventional gas-cell (M29L01 600 µm 0.39 NA, Thorlabs)). Figure 2 shows the schematic of the experimental setup used in this study. Schematic of the experimental setup showing the porous silica waveguide assembled into a flow-cell with peltier element for temperature modulation and connected to a NIR analyser.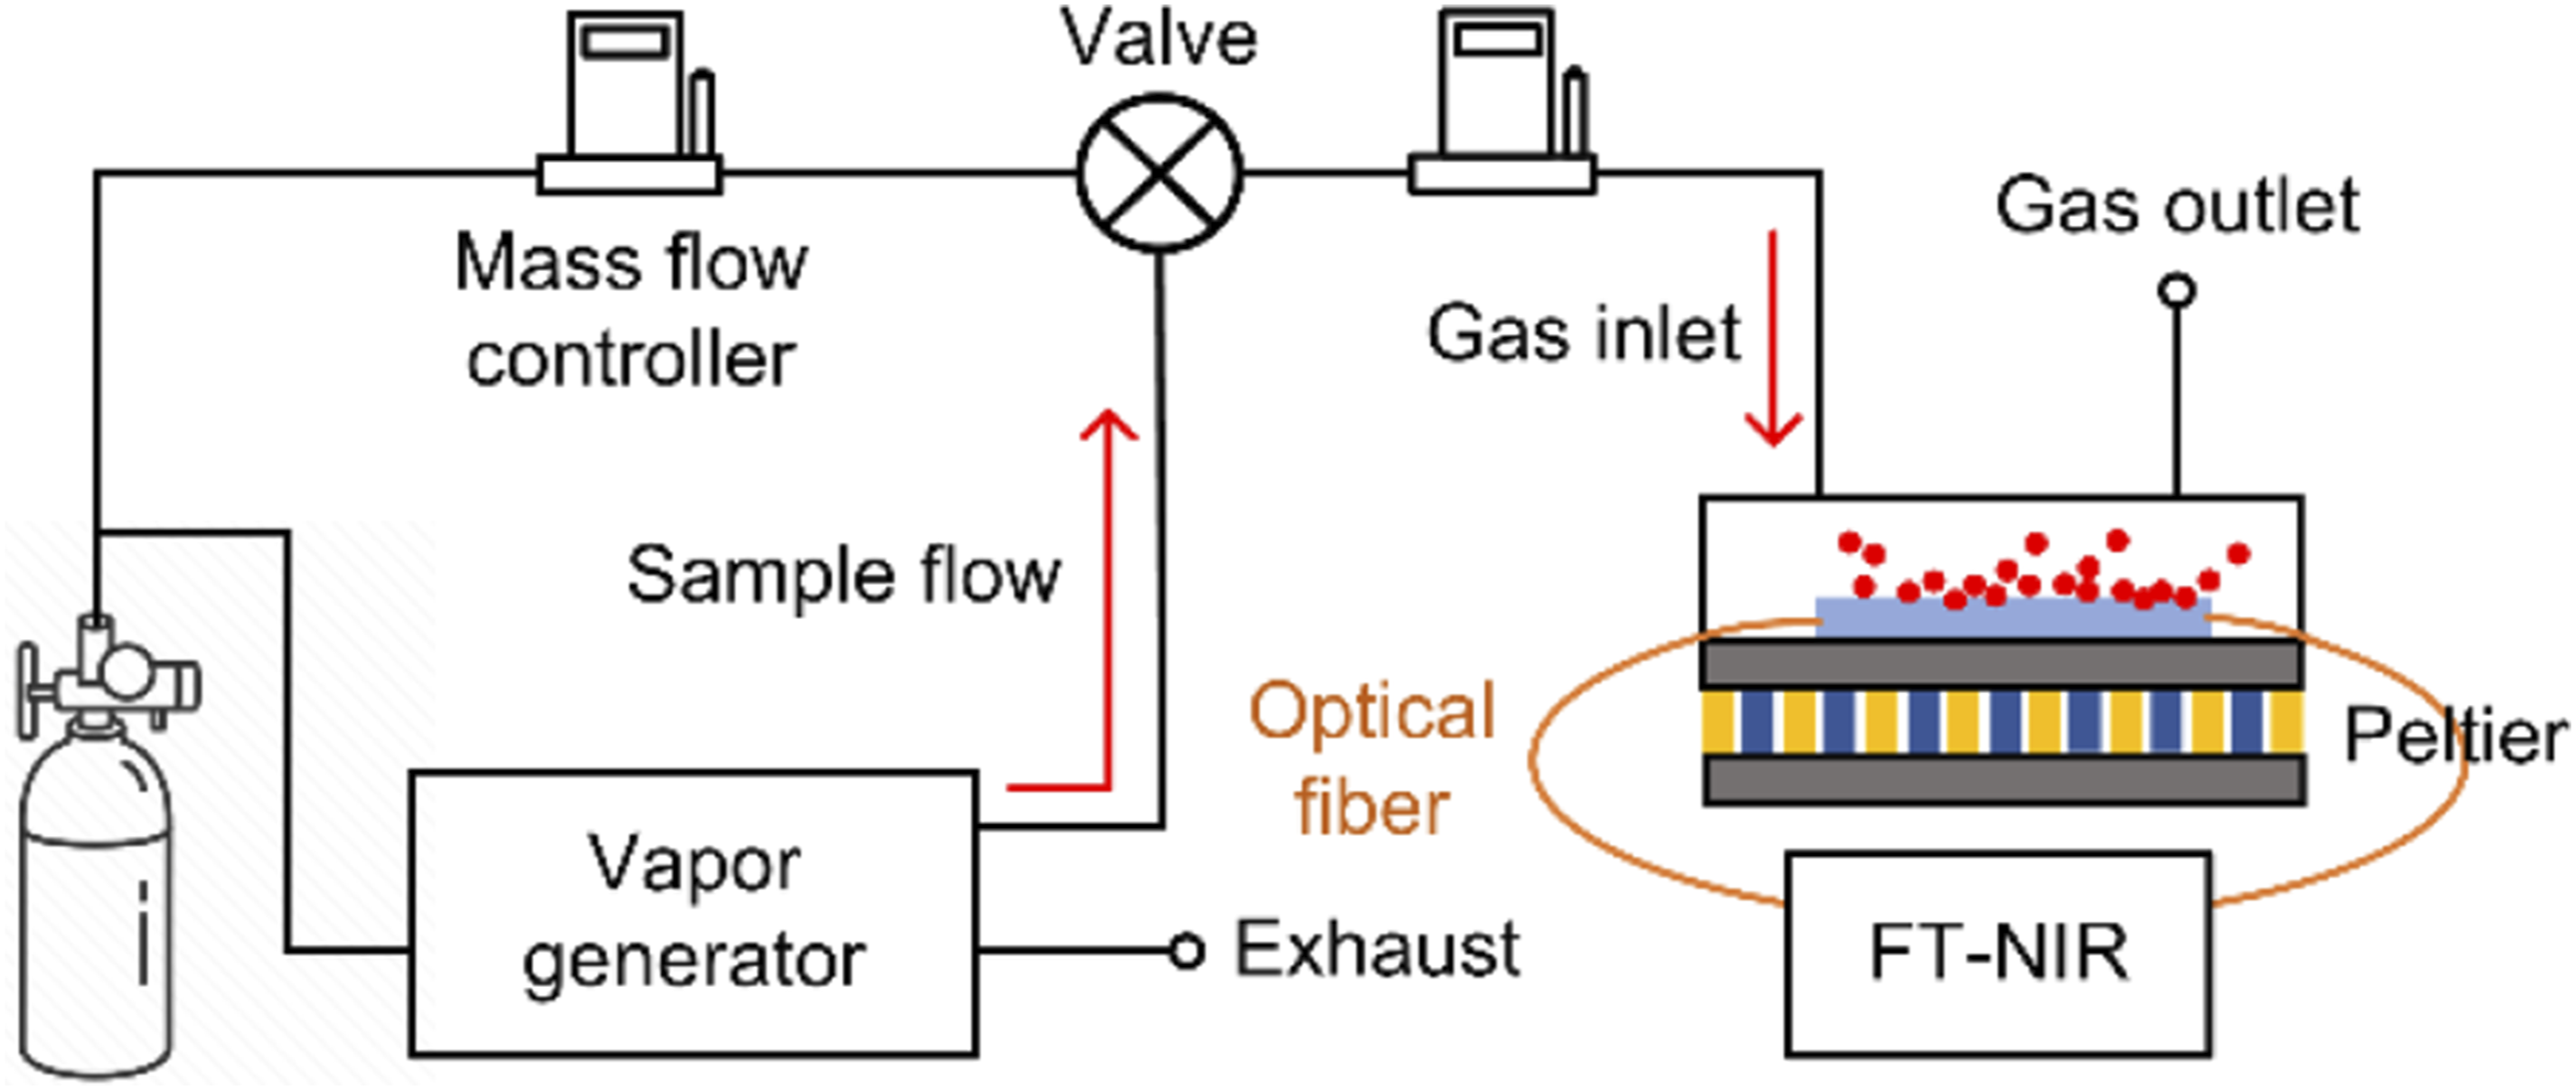
Results and discussions
Waveguide characterization
Scanning electron microscopy (SEM) image of the porous waveguide core was obtained using ZEISS Neon 40 and is shown in Figure 3. Figure 3(a) shows the cross section at 100kx magnification that reveals the complex interconnected structure of the porous network. The top view of the porous surface in Figure 3(b) shows the spatial arrangements of the pores. From the top view, it is also noticeable that the pores are below 50 nm in diameter. Nitrogen adsorption analysis of the porous silicon layer showed the pore diameter distribution between 5 and 15 nm with a mean value of 7.5 nm, confirming the dominance of mesopores. The calculated Brunauer-Emmett-Teller (BET) surface area of the porous waveguide is 159 m2 g−1. Detailed pore characterization of the porous layer can be found in our previous work.
33
Scanning electron microscopy (SEM) images of nanoporous silicon waveguide: (a) cross-section at 100,000x (b) top-view at 100,000x magnification. Both images were acquired at 5.00 kV acceleration voltage.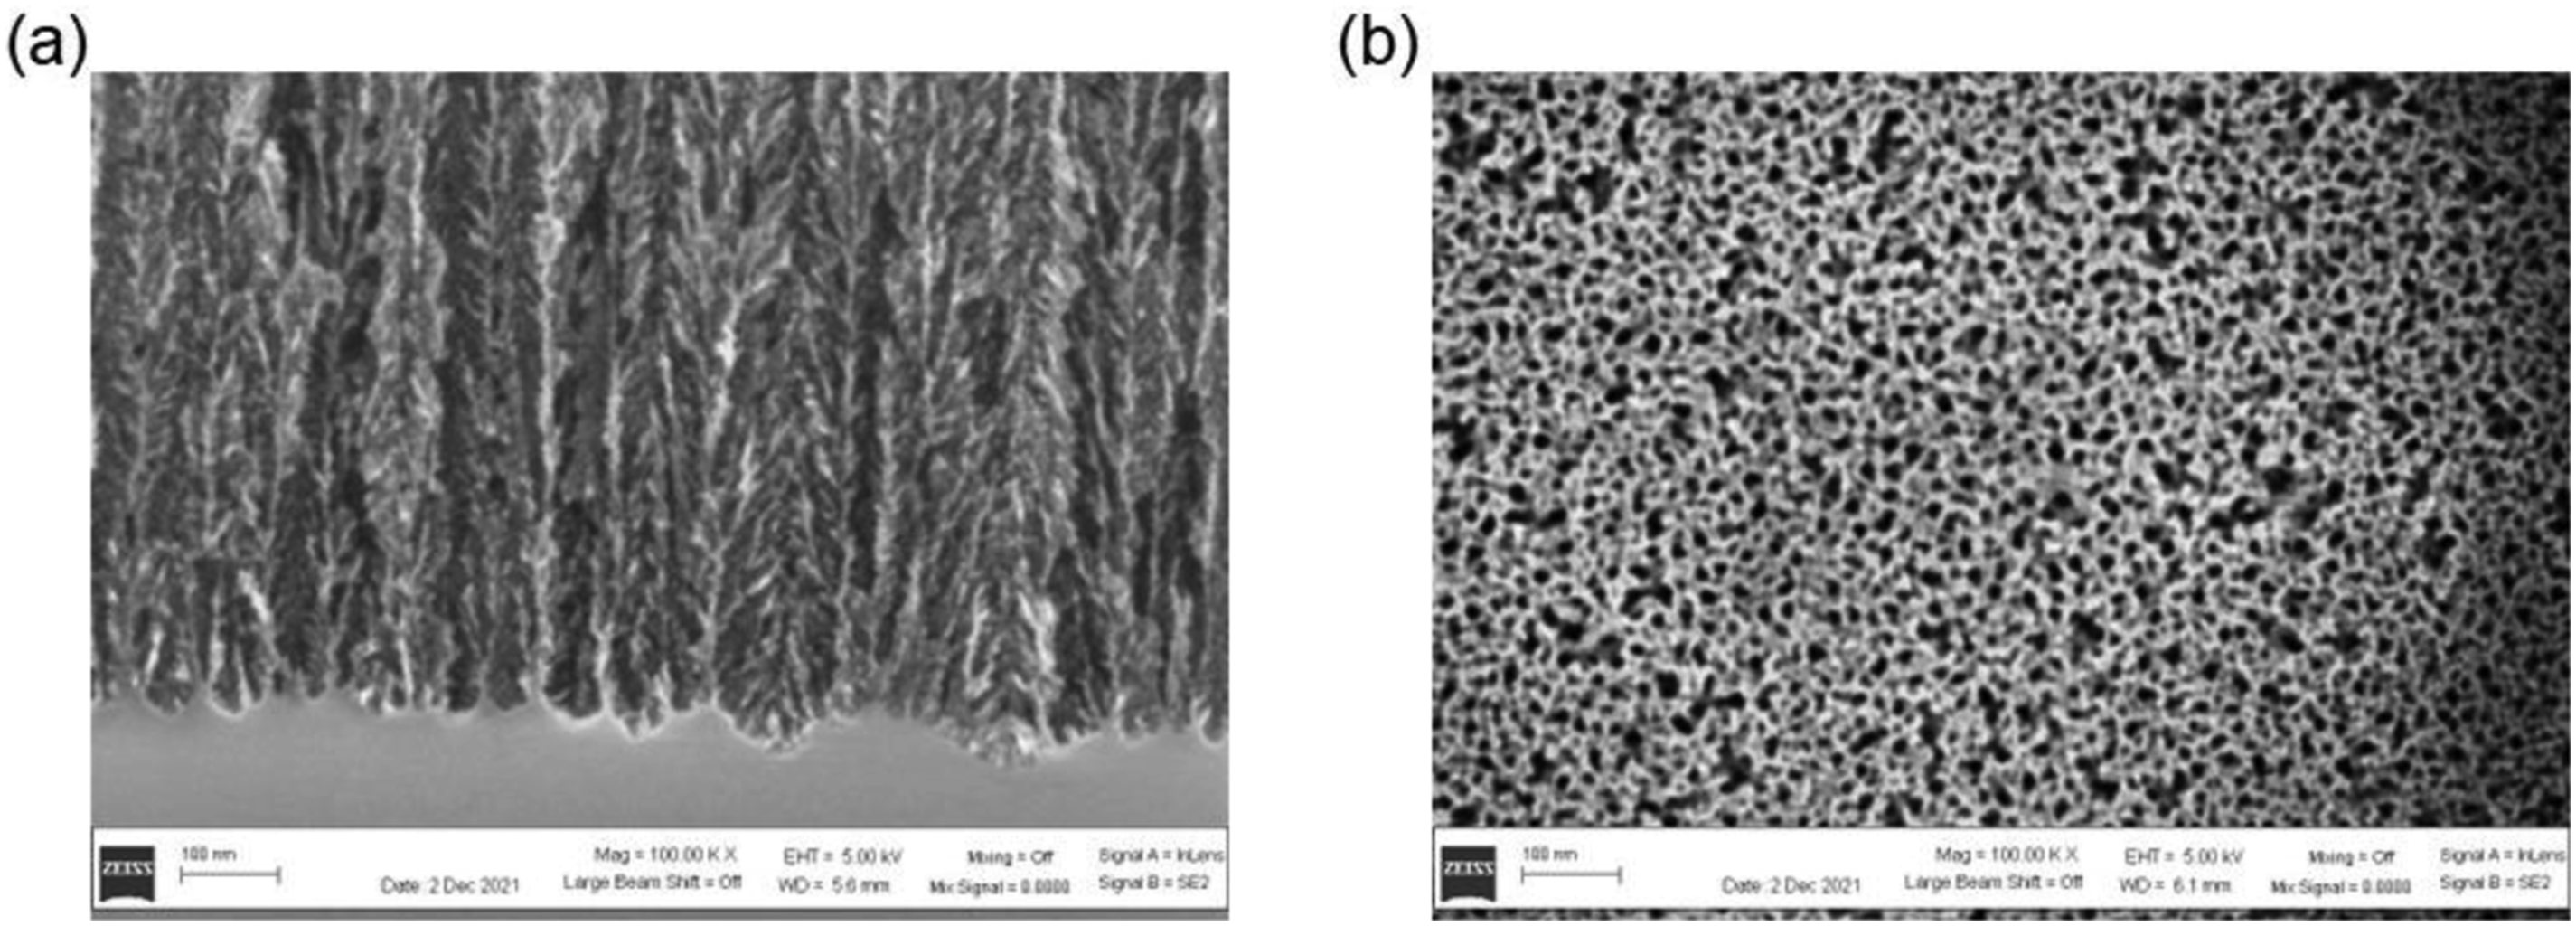
On-chip waveguide detection versus free-space gas-cell
In order to determine the degree of signal improvement that nanoporous silica waveguide offers, we compared NIR absorbance with conventional free-space measurement where light interacts with molecules in a gas cell. The length of the waveguide is 1 cm, while the optical interaction length of the gas-cell is 40 cm. Figure 4 shows the NIR spectra of toluene at 930 ppm concentration using the porous silica waveguide (black curve) and the gas-cell (red curve). This concentration of toluene was chosen for this comparison because lower concentrations of tens of ppm did not yield a measurable signal with the gas-cell. In the wavelength region between 1600 and 1700 nm the first overtone peak for methyl group is observed. The peak at 1675 nm and a peak shoulder around 1700 nm correspond to the symmetric and asymmetric stretching of the methyl group, respectively.
34
Near infrared spectra of toluene at 930 ppm collected using a 1 cm long porous silica waveguide (black curve) and a 40 cm long gas-cell (red curve). The inset shows zoomed in spectrum collected using the gas-cell.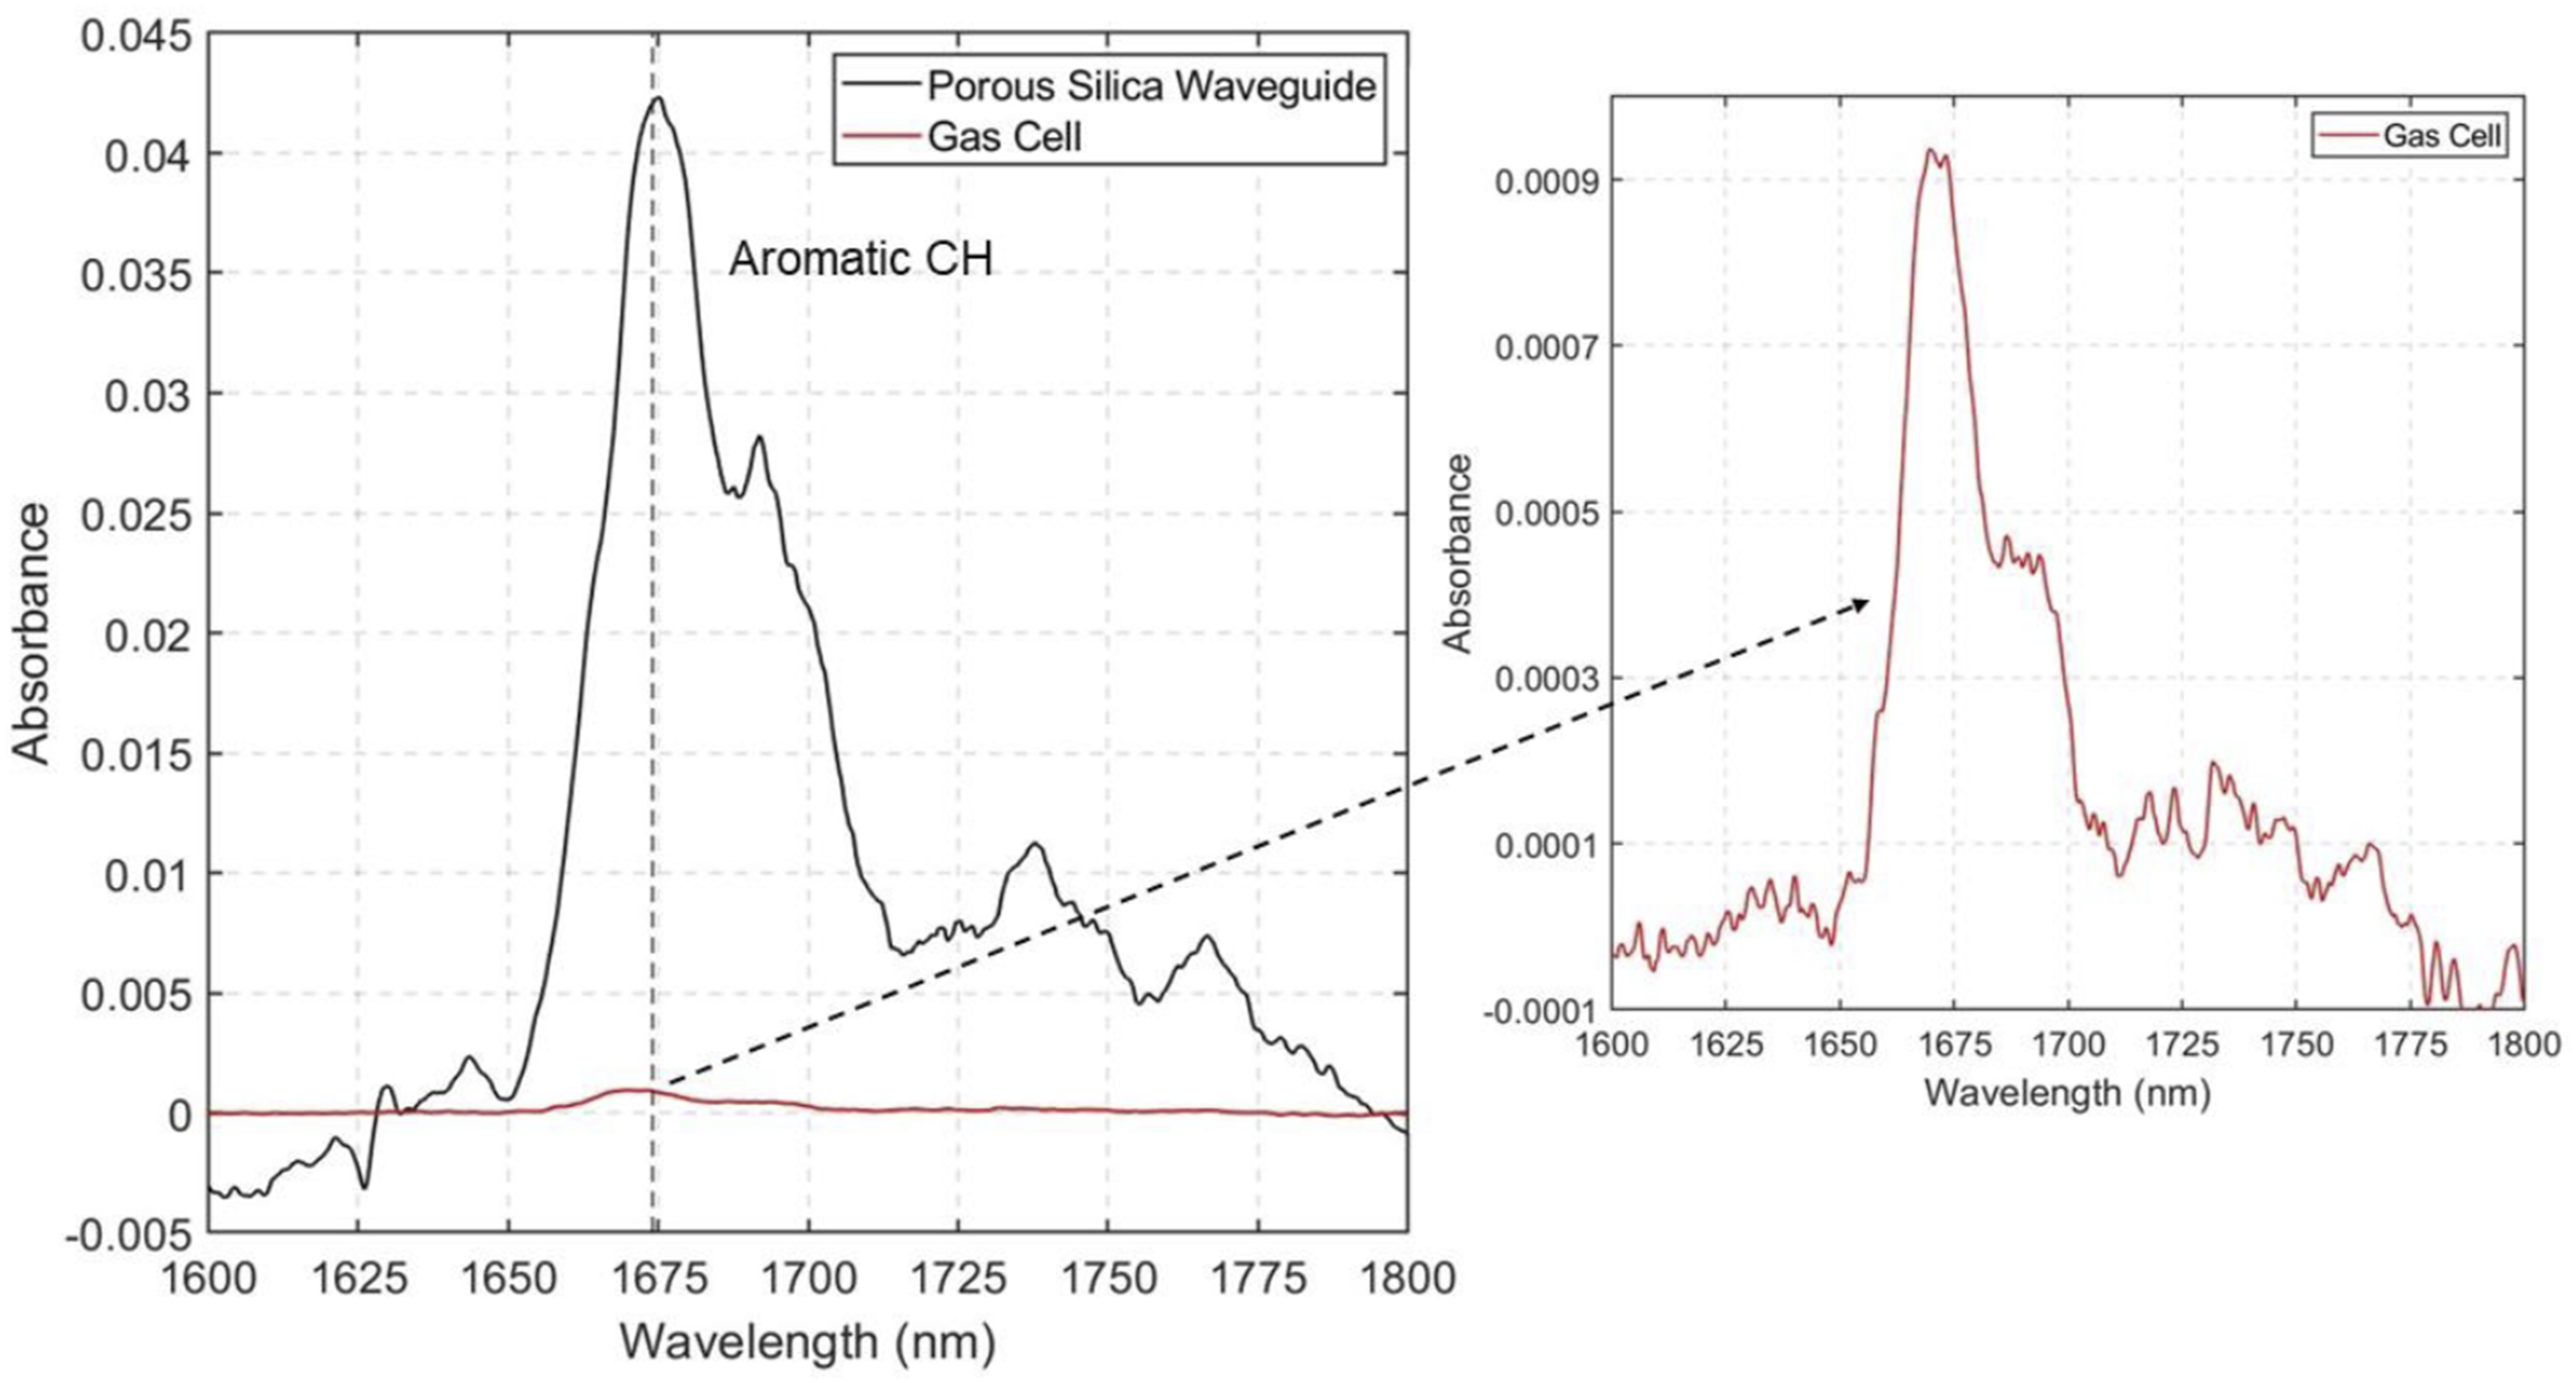
In Figure 4, the absorbance spectrum for toluene collected with the gas-cell does not show the distinct toluene peaks when plotted next to the spectrum collected using the porous silica waveguide at the same concentration. The inset shows a zoomed in figure for the gas-cell measurement for wavelengths between 1600 and 1800 nm, where the toluene peaks can be seen. The absorbance intensity of the main peak at 1675 nm is 0.0415 for the porous waveguide, and only 0.00094 (see figure inset) for the gas-cell, even though the interaction pathlength of the gas cell is 40 times longer. This two orders of magnitude increase in absorbance signal with the waveguide is remarkable given the significantly shorter pathlength compared to the gas-cell. This clearly demonstrates the improved signal of the porous silica waveguide compared to the conventional gas sensing method using a free space gas-cell.
To quantify signal enhancement of the waveguide per mm pathlength, the following equation is proposed:
This calculation reveals that the signal enhancement per mm pathlength when using the waveguide is 1840-times higher than for the gas-cell. This enhancement in the absorbance signal for the waveguide is achieved due to the adsorption of molecules inside the nanopores. In a conventional gas cell, the light interacts with the molecules in free space. On the other hand, in the porous silica waveguide, gas molecules adsorb inside the pores, increasing their concentration in a small volume inside the waveguide core. As a result, when light passes through the waveguide, it interacts with more molecules than it would in free space at similar gas concentration. This increased light-molecule interaction enhances the absorbance signal and hence improves the sensitivity of the waveguide.
It is important to note that the infrared spectra of a compound in gas-phase can be different from the infrared spectra of same compound in liquid-phase, especially for small molecules like water or ammonia. When such molecules adsorb in the nanopores, they interact with the surface of the pores, and thus no longer display same spectral features as they would in the gas-phase where they don’t interact with anything. In our previous work, we compared the NIR spectral features of different VOCs in surface-adsorbed state measured using a nanoporous waveguide with gas-phase and liquid-phase spectra, which showed that the spectra collected with the waveguide carry more resemblance with the liquid-phase spectra. 33 However, for organic molecules, such as toluene, there is not much difference in the spectral features between toluene vapor adsorbed in the nanoporous waveguide and gas phase toluene, 33 which is again confirmed by the spectral comparison in Figure 4.
Effect of waveguide temperature on sensitivity
To evaluate the effect of temperature on the sensing performance of the waveguide, absorbance peaks of toluene were studied at different waveguide temperatures ranging between 10 and 70°C for four different toluene concentrations: 215, 150, 100 and 50 ppm. For each measurement, the background was collected with respective waveguide temperature while flowing dry air over the waveguide. Between each sample measurement, the waveguide was purged with dry air for approximately 3 minutes to clean the pores of any residual gas molecules. Figure 5(a) presents the absorbance spectra of toluene at 150 ppm at four different waveguide temperatures. The absorbance signal is highest at the lowest waveguide temperature, 10°C, and decreases with increasing temperature. Figure 5(b) presents the absorbance spectra for four different concentrations while the waveguide temperature was fixed at 20°C. As expected, the absorbance peak height decreases with decreasing concentration. (a) Absorbance spectra of 150 ppm toluene at four different waveguide temperatures (Twg). (b) Absorbance spectra of four different toluene gas concentrations at 20 C waveguide temperature. (c) Absorbance peak height of toluene at different waveguide temperatures, error bars calculated from the standard deviation from three repeats. (d) Absorbance peak height for different toluene gas concentration, error bars calculated from the standard deviation from three repeats.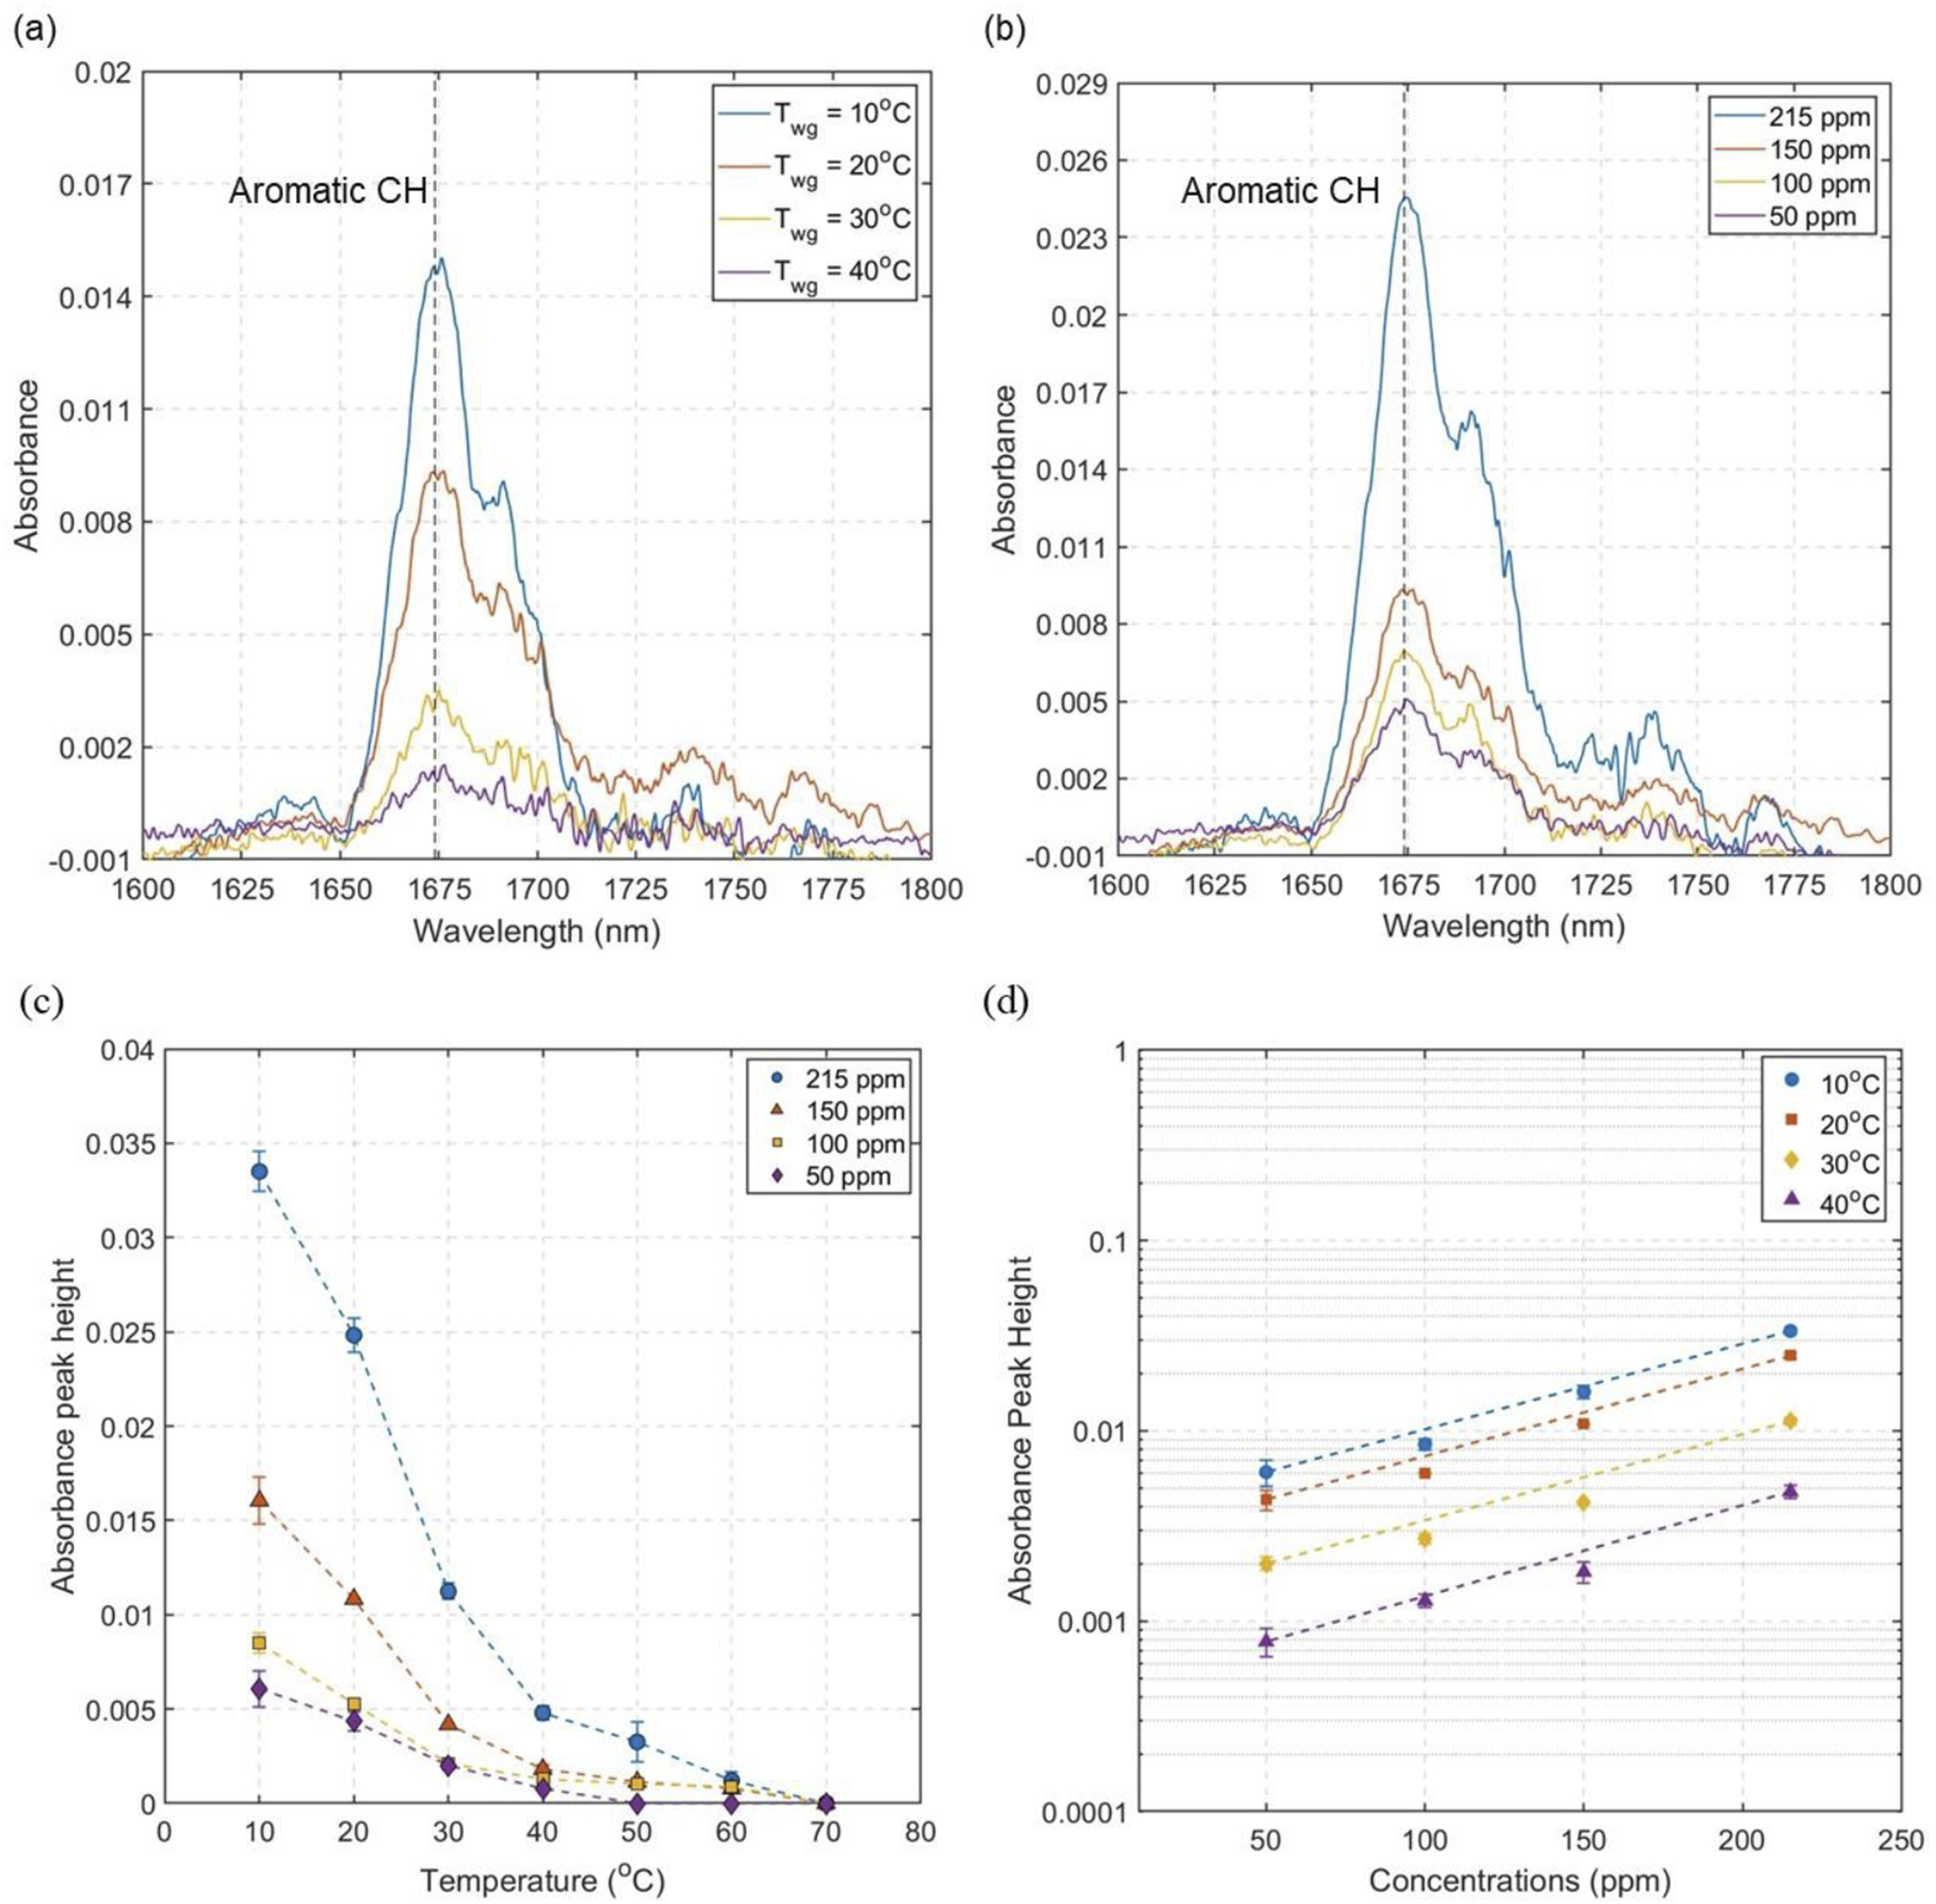
Figure 5(c) shows the absorbance peak height for the four different concentrations at seven different waveguide temperatures. At the highest waveguide temperature of 70°C there is no measurable absorbance signal even for the highest concentration studied (215 ppm). This is expected since high porous core temperature does not facilitate the adsorption of gas molecules inside the nanopores. The absorbance peak increases with the cooling of the waveguide, indicating a larger number of adsorbed molecules as the temperature decreases. At 20°C, high absorbance signal is observed for all the four concentrations studied, but these peak signals increase further as the waveguide is cooled down below room temperature to 10°C. This shows that the absorbance signal is maximized with the combined effect of nanopore adsorption and condensation of the gas molecules. Figure 5(d) shows the effect of waveguide temperature for different toluene gas concentrations. The absorbance peak height exhibits linear increase with increasing toluene concentrations.
To evaluate the sensing performance of the waveguide, 5 different toluene concentrations of 40, 30, 25, 15, 10, and 5 ppm were tested for a waveguide temperature of 10°C. Each of these tests was repeated three times to achieve a reliable quantitative analysis of sensitivity and limits of detection (LOD). Figure 6 shows a linear relationship between the absorbance peak height at 1675 nm and the concentrations between 5 and 40 ppm. Waveguide sensitivity for toluene can be calculated from the slope of Figure 6. In this context, sensitivity (S) is quantified as the increase in absolute absorbance unit per ppm concentration change. From Figure 6 the calculated sensitivity for toluene for the 5-50 ppm concentration range is 1.29E-04 ± 4.02E-06 ppm. The LOD of the waveguide sensor for toluene is calculated using the following equation: Linear response of the waveguide for toluene concentrations between 5 and 40 ppm range at 10°C waveguide temperature, error bars calculated from the standard deviation from three repeats.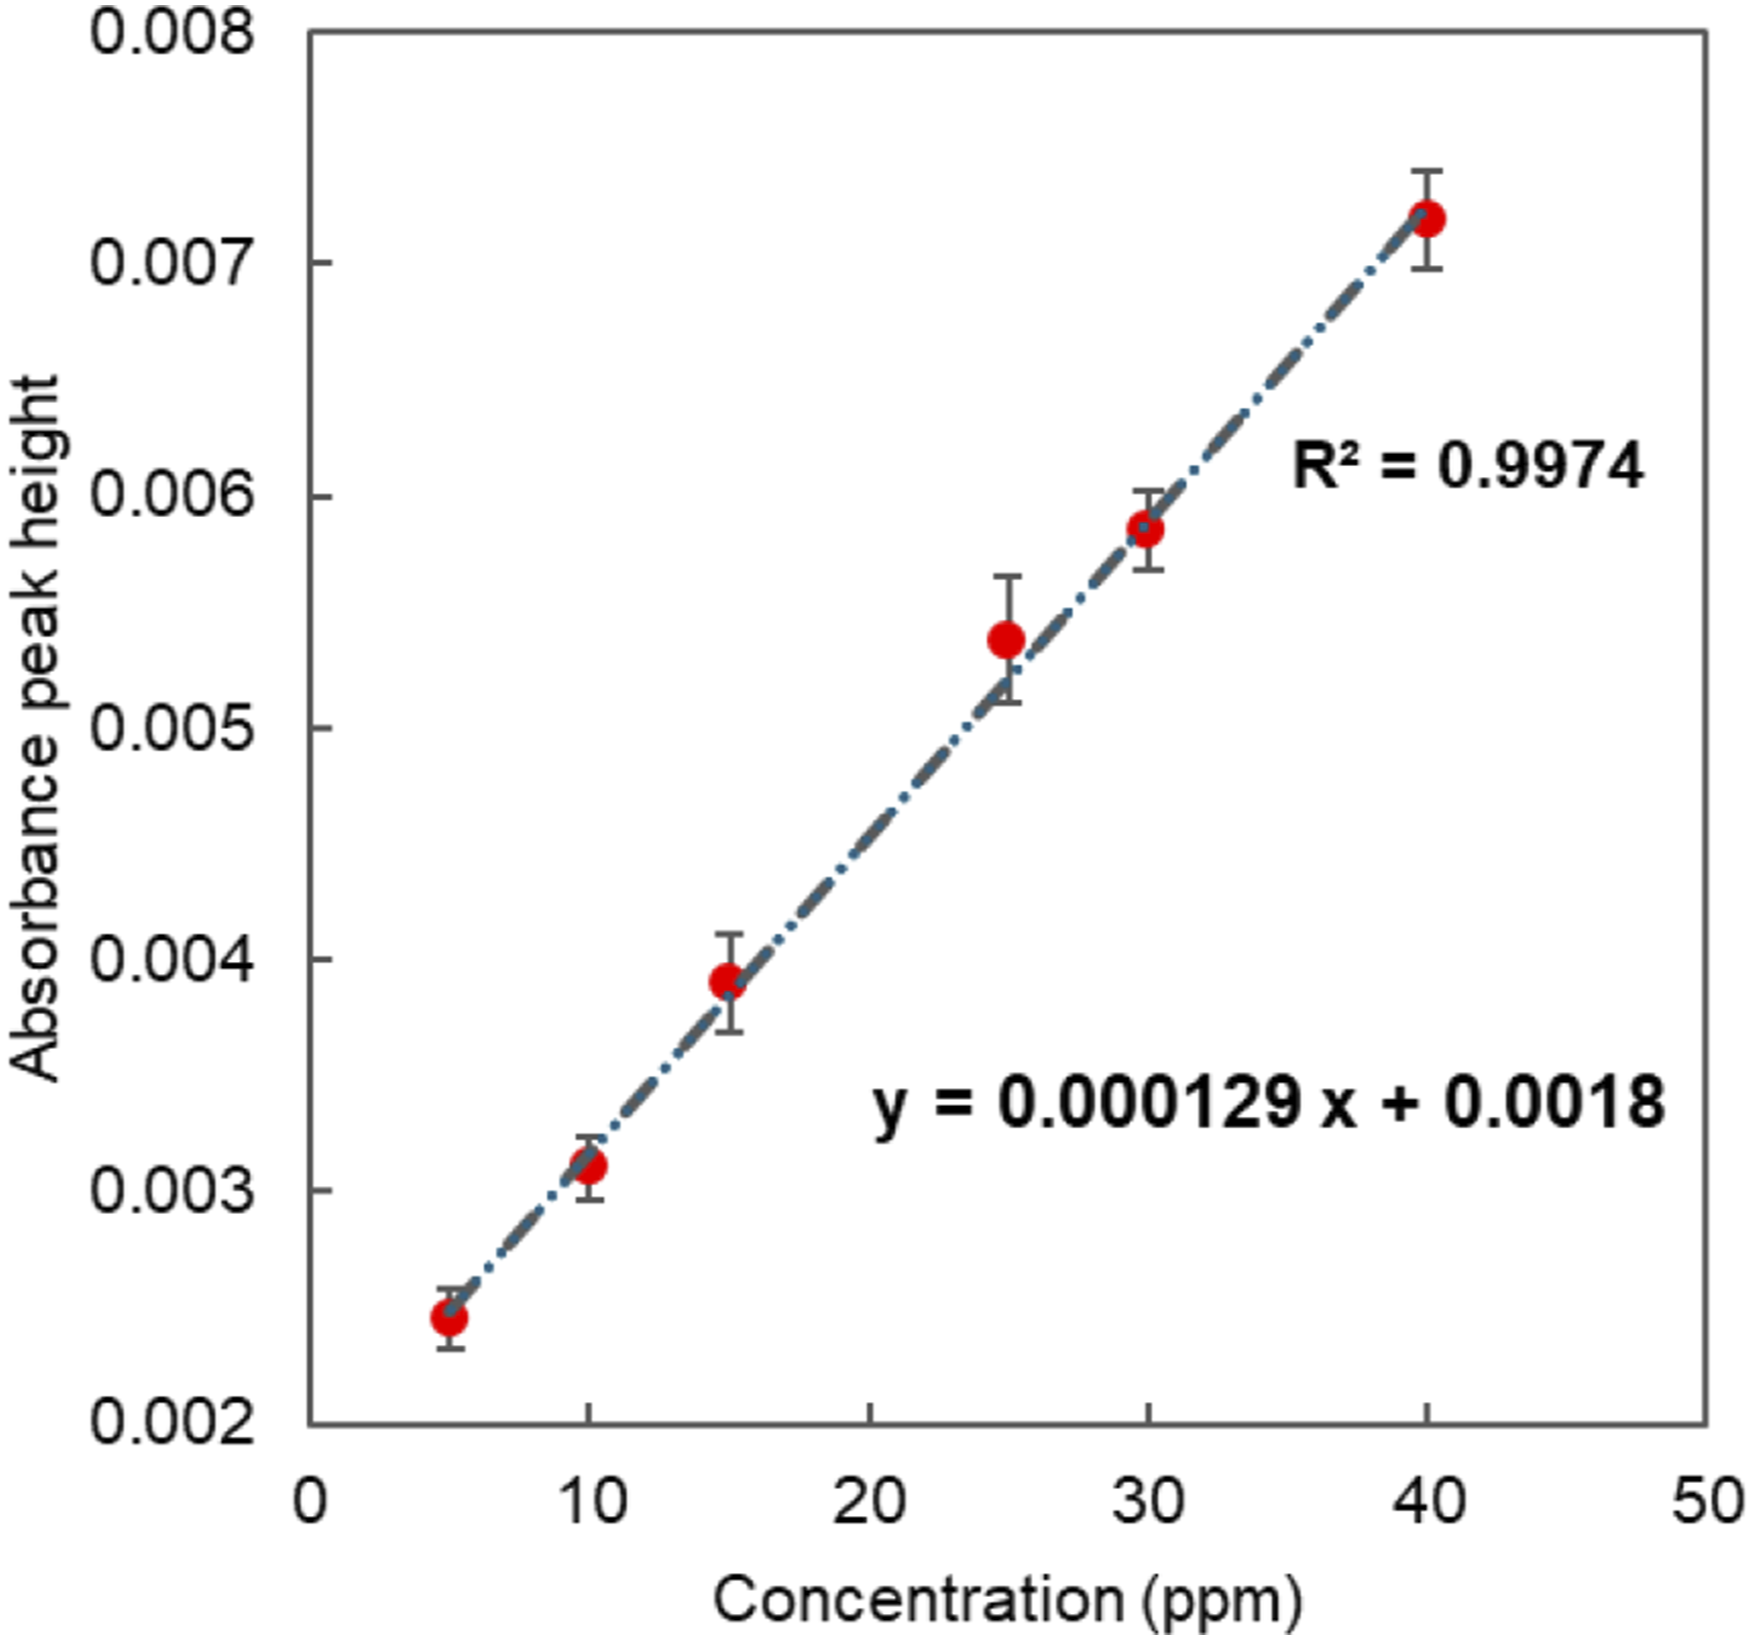

Nie et al. used a metal-cladding slab waveguide with Teflon polymer as the guiding layer and achieved 9.5 ppm LOD for toluene by measuring the spatial shift in reflected light. This shift is induced by the refractive index change of the light guiding polymer layer due to vapor polymer interaction. 35 While Nie’s proposed waveguide enables sensitive toluene and benzene detection, it cannot selectively detect VOC molecules. Liu et al. reported an infrared (6–14 μm) photonic platform using a suspended silicon waveguide that achieved a LOD of 75 ppm toluene by taking advantage of the interaction between the evanescent field and the toluene molecules. 36 Tao et al. reported a ZIF-8 MOF coated silicon nitride microring resonator operating near 1.5 μm that can detect toluene at 76 ppb by measuring the resonance shift as the gas molecules adsorb onto the MOF layer. 37 However, resonance shift was also measured for other VOCs, therefore, this sensor is not selective. Our integration of porous silica waveguide with near infrared spectroscopy for toluene detection demonstrates competitive performance compared to existing waveguide-based sensing platforms.
Multicomponent VOC detection
To exhibit the waveguide’s performance for multicomponent VOC detection, a binary mixture of 2:1 toluene and 1-octene were studied at 10, 20 and 30°C waveguide temperatures. Figure 7(a) and (b) show the absorbance spectra of toluene and 1-octene at three different waveguide temperatures, respectively. For 1-octene, spectral overtone regions of methyl appear between 1660 and 1750 nm similar to other aliphatic hydrocarbons. However, a strong and distinct peak for the double bond methylene group of 1-octene appears at 1635 nm, which is considered a characteristic peak for linear alkenes. (a) Absorbance spectra of 1956 ppm toluene at three different waveguide temperatures (Twg). (b) Absorbance spectra of 798 ppm 1-octene at three different waveguide temperatures. (c) Absorbance spectra of toluene and 1-octene mixture (2:1 ratio) at three different waveguide temperature.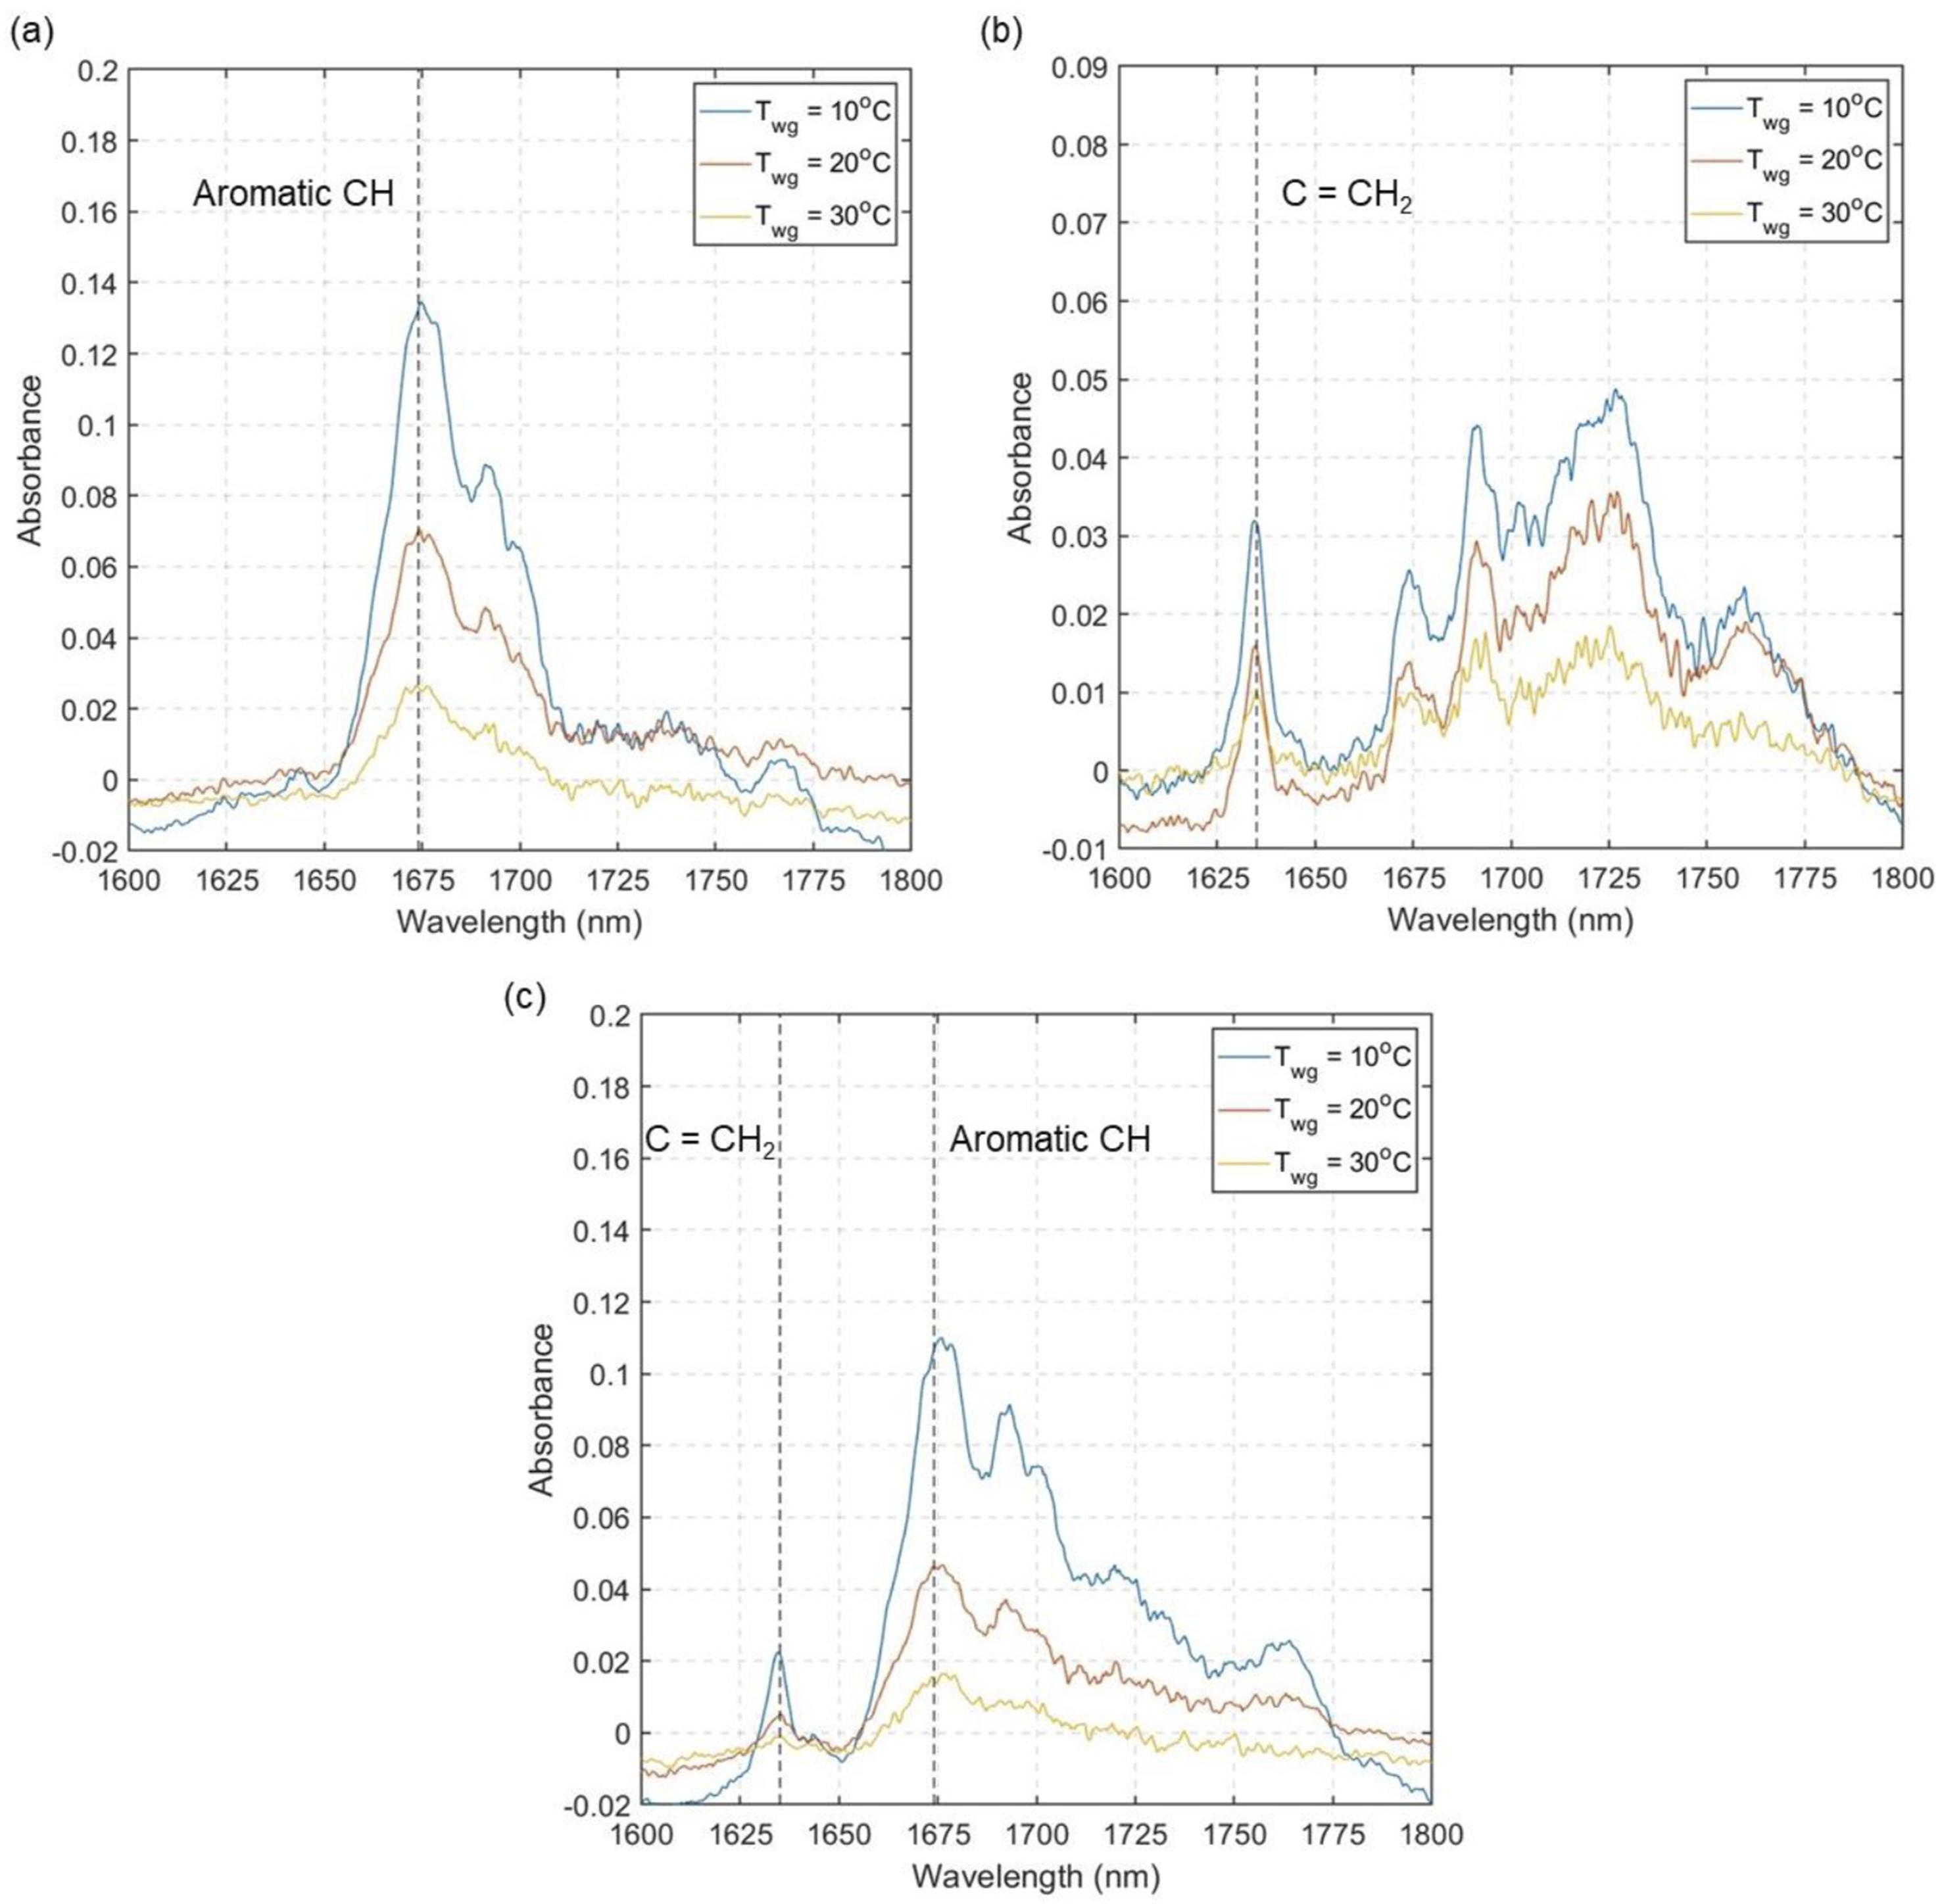
Figure 7(c) shows the absorbance spectra of the binary mixture of toluene and 1-octene at 2:1 ratio at three different waveguide temperatures. The characteristic spectral peaks of each compound can be clearly seen - aromatic C-H for toluene at 1674 nm and methylene peak for 1-octene at 1635 nm, demonstrating the capability of waveguide for distinguishing a targeted VOC from a mixture of VOCs. The absorbance intensity of each component in a mixture increases with decreasing waveguide temperatures, as seen for single component. The ability to selectively measure each compound enables us to study in-situ adsorption-desorption behaviour of multicomponent VOC mixtures inside the pores and understand the effect of molecule-pore wall interaction on such behaviour. It must be noted that, for this study compounds with distinct spectral features were chosen for proving the concept. Future work will involve using VOCs with similar spectral features and applying advanced data analytics for distinguishing the peaks. This section highlights the capability of the waveguide for measuring toluene and 1-octene in a binary mixture due to their different characteristics peak at different wavelengths. One could design a simpler sensor that only utilizes a single wavelength laser and a photodetector to target single gas measurement. Similarly, for the measurement of two compounds, a dual wavelength sensing system can be constructed.
This study focused on toluene and 1-octene to demonstrate the principle of multi-component detection using a porous waveguide sensor, as these analytes exhibit distinct spectral features that simplify validation of the waveguide’s core functionality. Structurally similar compounds (e.g., benzene, toluene, ethylbenzene, and xylene, [BTEX]) with overlapping absorption bands require advanced chemometric methods such as partial least squares (PLS) regression for accurate evaluation of the multicomponent sensing performance. While the current work establishes the waveguide’s baseline performance for resolvable spectra for multicomponent mixtures, further studies are required to address chemically analogous mixtures. In ongoing work, we are integrating PLS and principal component analysis (PCA) to quantify overlapping spectral contributions, and we aim to investigate BTEX mixtures to further validate the multicomponent detection capability.
Multicomponent adsorption-desorption kinetics
In this section temperature-dependent adsorption-desorption of single components and of binary mixture of toluene and 1-octene are studied. Figure 8 shows the kinetics of adsorption and desorption of 1956 ppm toluene (blue curve), 798 ppm 1-octene at (red curve), toluene in 2:1 binary mixture (yellow curve) and 1-octene in 2:1 binary mixture (purple curve). For this experiment, the waveguide was purged for 10 minutes at 70°C for 10 minutes to get rid of any residual VOC molecules. After purging, the waveguide was cooled to 30°C, and dry air was blown for 15 minutes. After 15 minutes the air flow was switched to VOC flow, and waveguide temperature was decreased to 20°C and finally to 10°C. After reaching 10°C, the waveguide temperature was then subsequently increased to 20°C and then 30°C. After 15 minutes hold at 30°C, the VOC flow was cut off and switched to dry air flow to completely purge the waveguide. Kinetics of adsorption and desorption for different waveguide temperatures 1956 ppm toluene (blue curve), 798 ppm 1-octene (red curve), and each compound in 2:1 toluene and 1-octene binary mixture (yellow and purple curve).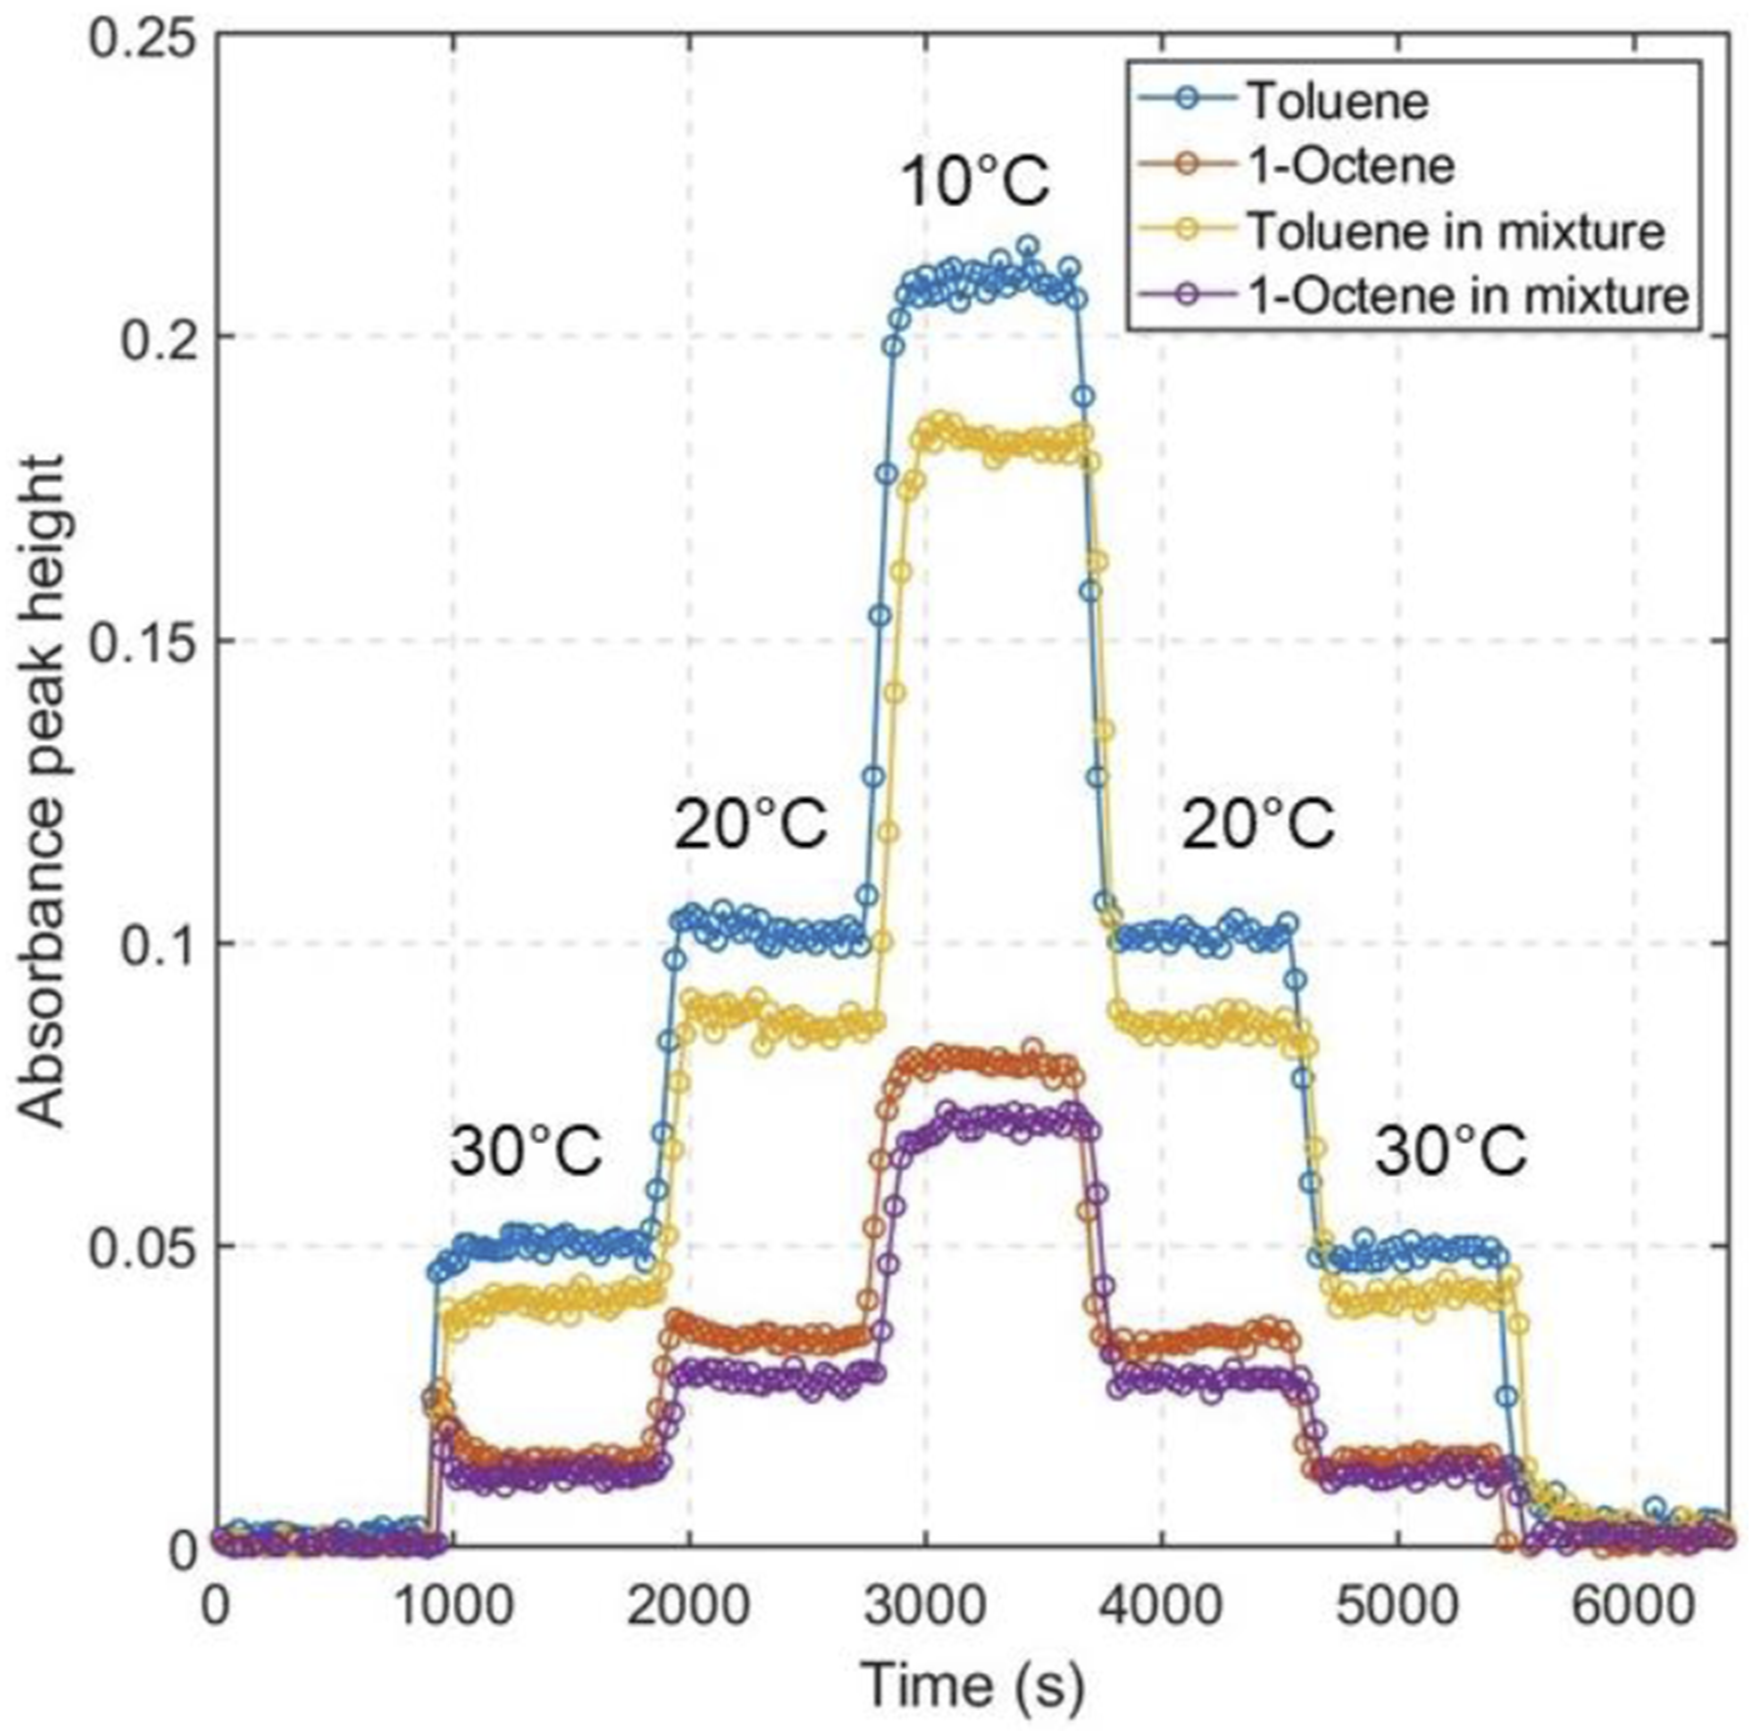
All the curves at 30°C waveguide temperature show that when VOC flow starts the absorbance signal rapidly increases and reaches a plateau within 35 to 40 seconds. The plateau here signifies that an equilibrium was reached between the molecules in gas phase and adsorbed phase. Once this equilibrium is reached, the signal wouldn’t change any further without external interference. When the waveguide temperature is decreased to 20°C and subsequently to 10°C the signal again rapidly increases. For colder waveguide temperature the absorbance signal reaches plateau within 276 seconds for 20°C and 362 seconds for 10°C. This longer response time to reach steady signal at lower temperatures is due to increasing adsorption and condensation of molecules inside the VOC.
When the waveguide temperature was increased from 10°C to 20°C, some of the VOC molecule desorbed and again the peak signal reached a plateau. Important to note, that the absorption signal is similar for both adsorption and desorption phase which signifies that the amount of molecule adsorbed during each adsorption cycle is equal to the molecules that are being desorbed during the desorption cycle. This lack of hysteresis is very important for real-time sensing applications. The desorption signal decreases further when the waveguide temperature was increased to 30°C. Finally, when the VOC flow was switched to air flow, all the adsorbed toluene molecules desorbs and the peak returns to the zero baseline after 600 seconds. For both single component toluene and 1-octene, the response time for the nanoporous silica waveguide is around 19 seconds. It must be noted that, all the spectra for this experiment were collected at 200 scans per average which translates to 14 seconds scan time for each spectrum. It is possible that the waveguide response time is lower than 19 seconds but that couldn’t be demonstrated due to scan time duration.
From Figure 8, it is evident that toluene and 1-octene in 2:1 binary mixture (yellow and purple curve) has similar adsorption-desorption behaviour as that of single component toluene and 1-octene. When compared between single component toluene (blue curve) and toluene in mixture (yellow curve), the peak signal for the toluene in mixture is lower than that of single component. This is because the 1-octene of the mixture is occupying the spaces inside the pores which results in less toluene molecules to be adsorbed. Similarly for 1-octene the signal for 1-octene in mixture is slightly lower than that of single component. Our future work will involve studying mixtures of VOCs with different properties (i.e., polarity) to explore if the VOC molecules would compete with each other for space inside the pores.
Conclusions
A novel gas sensing technology has been developed that allows on-chip infrared detection of volatile organics at increased sensitivity compared to conventional free-space gas measurements. The nanoporous silica waveguide core has large surface area and optical transparency in the NIR spectral regions. The wide spectral optical transparency of the multi-mode waveguide from 1200 to 2400 nm allows the integration with a broadband light source for multiple analyte detection. The waveguide is capable of quantitative in situ monitoring of VOCs. The unique combination of large surface area and optical transparency in the NIR region facilitates the NIR spectroscopic detection of gaseous molecules adsorbed in the core of the waveguide itself as opposed to commonly used evanescent-field sensing. The spectroscopic evaluation of the porous waveguide using gaseous toluene demonstrates a significant increase (∼1800x per mm path length) in absorbance signal compared to a conventional gas-cell. Furthermore, temperature modulation of the waveguide reveals its capability of sensing VOC molecules at much lower concentrations and significantly surpassing the VOC sensing performance of a conventional gas-cell. To showcase the sensing capability, the response of the waveguide to different toluene vapor concentrations was studied at for four different waveguide temperatures. An LOD of 2.5 ppm for toluene at 10°C waveguide temperature was achieved. The combination of porous silica waveguide with NIR spectroscopy enables selective detection of VOC molecules in a binary mixture, demonstrated for toluene and 1-octene in this work. Thus exhibiting excellent potential as a highly selective and sensitive sensor for the detection of VOCs in real environmental conditions. The multicomponent detection capability also opens the door for in-situ monitoring of VOC adsorption-desorption inside silica nanopores to gather deeper understanding of the pore-molecule and molecule-molecule interactions.
Commercially available sensors, such as photoionization detector, can measure different VOCs at ppb levels but cannot detect VOCs selectively. 25 Electrochemical sensors 38 and metal oxide sensors 3 are designed to detect a single VOC at ppb concentration and cannot be used to selectively detect multiple VOCs. Analytical systems such as micro gas chromatography mass spectrometry (GC-MS) offer specificity and high sensitivity, but these systems are complex and bulky.39,40 The waveguide sensor in this work combines broadband NIR spectral selectivity, which allows detection of VOCs based on their NIR spectral features. The nanoporous surface of the waveguide leverages capillary and temperature-assisted condensation of gas molecules into the pores to achieve sensitive detection of VOCs. Our ongoing work is focused on quantification of sensitivity and limits of detection for different VOCs, demonstration of multicomponent selectivity and sensitivity using VOC mixtures, and demonstration of technology for specific industrial, environmental, and medical applications.
Footnotes
Acknowledgements
We thank Tse-Ang Lee, from The University of Texas at Austin for his help with the schematic drawing of the testing setup.
Author contributions
Nirmalay Barua: Investigation, Validation, Formal analysis, Data Curation, Writing – original draft, Writing – review & editing. Lexi K. Menges: Investigation William T. Winter: Methodology, Investigation. Serrita McAuley: Methodology, Investigation. Joshua Prestage: Investigation. Andrew R. Salmon: Investigation. Paul T. Clarkson: Methodology, Investigation. Tanya Hutter: Conceptualization, Methodology, Formal analysis, Writing – review & editing, Supervision, Project administration, Funding acquisition.
Declaration of conflicting interests
The author(s) declared the following potential conflicts of interest with respect to the research, authorship, and/or publication of this article: The authors W.T.W, S.M, J.P, A.R.S. and T.H, are shareholders in, and/or employees of SensorHut Ltd
Funding
The author(s) received no financial support for the research, authorship, and/or publication of this article.