
Abstract
Cork stoppers are vital for wine bottle packaging, allowing the sealing of the wine in the bottle. Cork stoppers are coated with a treatment to increase impermeability and lubrication, ensuring the quality and longevity of bottled wines. This coating, typically made of hydrophobic polymers, is applied during the final stages of cork production. The application of the coating material to the cork surface takes place in a drum and can be applied using two methods, a stationary or a mobile pneumatic pistol. In this study, cork coating homogeneity is evaluated using hyperspectral imaging to investigate which coating application method, a stationary pneumatic pistol, or a mobile pneumatic pistol, gives higher coating homogeneity on the cork surface. Partial least squares-discriminant analysis on hyperspectral images and texture analysis algorithms showed that there is more coating homogeneity when coating is applied with the mobile pneumatic pistol method than when coating is applied with the stationary pneumatic pistol method. This result is advantageous for industry as they can potentially optimize coating methods and choose the coating application method which achieves greater coating homogeneity on their cork samples.
Introduction
Cork stoppers, a natural product made from plant tissue from the outer bark of trees, have been an essential component of packaging for the past 2000 years. The tree mainly used for cork production is the Quercus suber, with a bark thickness of around 3 cm needed for cork production. 1 Quercus suber L. mainly exists in the Western Mediterranean. 2
There are many reasons for cork stoppers being suitable for wine packaging, for example allowing adequate oxygen transfer and not changing the sensorial characteristics of wine. The chemical inertness of cork means that it does not contaminate the wine with breakdown products. 1
Cork has a high coefficient of friction in contact with the glass wall. To prevent this issue, which might cause the stopper to break when it is removed from the bottle, manufacturers apply surface coatings onto cork stoppers to moderate the force necessary to insert or remove them from the bottleneck.3,4 The coating materials are usually a lubricant mixture, composed of paraffin and silicone. 5 Paraffin is an effective barrier to oxygen, avoiding oxidation and silicone reducing the friction index. 6
The coating serves several functions on the cork stopper as an element of the packaging by improving the impermeability due to the hydrophobic properties, 7 reducing the flow of liquid between the stopper and the bottleneck 8 and regulating the oxygen transfer rate (OTR) at the glass-cork interface.4,6 Consequently, the homogeneity of the polymer distribution on the body of the cork is crucial for a good performance of the coating.
During the final step of cork stopper production, hydrophobic polymers are coated onto the stoppers using a batch operation coating pan, which is essentially a large, rotating drum. The coating solution is sprayed onto the corks as the drum rotates. This rotation ensures that the coating is applied across all corks, and the temperature and airflow rate are carefully regulated to ensure that the coating dries uniformly. The spray application uses two different methods: a fixed pneumatic pistol and a mobile pneumatic pistol. As the name suggests, the mobile pneumatic pistol consists of a pistol that has a swinging movement, that can have multiple angles and patterns. On the other hand, the fixed pistol is a static application.
Hyperspectral imaging (HSI) was originally used for remote sensing applications 9 but is now often used for measuring features in many fields, including food and agriculture. 10 Hyperspectral images are made up of two spatial dimensions and one spectral dimension, 11 and can generally obtain spectral information from more than 100 wavebands. Every pixel contains a spectrum that represents the light absorbing and/or scattering properties of the spatial region represented by that pixel (although this could be affected by neighbouring pixels due to optical, instrumental and background effects). 9
The integration of non-destructive sensors, such as HSI sensors, into monitoring systems is important for maintaining quality control in industrial settings, since they are rapid and do not require contact with the sample, unlike analytical chemistry methods which are destructive and time-consuming. 12 Thus, HSI can offer a solution for ensuring the homogeneity and thickness of cork coatings without the need for intrusive testing that damages the product.
The cork industry believes that mobile pneumatic pistols apply coating material more uniformly than stationary pistols. To our knowledge, no method has been developed to date that enables the comparison of the application types. The objective of this work was to use HSI to understand if there were significant differences in coating homogeneity according to the application method (fixed pneumatic pistol vs mobile pneumatic pistol).
In this study, corks were coated using the two application methods and with two different coating materials based on two commercially-available elastomers, CAF and Bopsil. These samples were measured using HSI and processed using partial least squares-discriminant analysis PLS-DA to convert them into a grayscale image that shows the coating material on the surface of the cork. Texture analysis using gray-level co-occurrence matrix (GLCM) was performed to calculate the homogeneity of the coating on the cork stopper. Finally, a Kruskal–Wallis test was used, to validate if there are significant differences between using mobile and fixed pneumatic pistols on the coating homogeneity.
M ethodology
Cork stopper samples
For this study, two different coating treatments were used: SILBIONE CAF 72,589 (Elkem Silicones, France) and Bopsil (C2M AUROCHS Industrie, France). CAF and Bopsil are composed of methyltriacetoxysilane, octamethylcyclotetrasiloxane, dodecamethylcyclohexasiloxane and decametilcyclopentasiloxane.
Technical cork stoppers composed of ∼72% granulated cork (particles size of 3-7 mm), ∼24% binder, and ∼2% microspheres, with a diameter of 24 mm and length of 44 mm, were provided by Cork Supply Portugal (Porto, Portugal). CAF and Bopsil coatings were applied with both a stationary pneumatic pistol and a mobile pneumatic pistol, projecting the coating on the moving corks inside of an industrial stainless-steel drum.
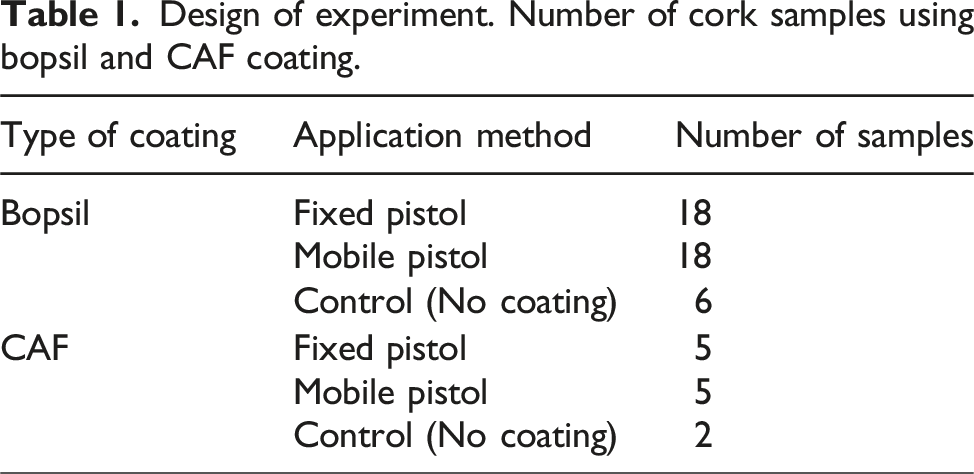
Design of experiment. Number of cork samples using bopsil and CAF coating.
Short-Wave Infrared (SWIR) hyperspectral image acquisition
For each coating material (Bopsil and CAF), sets of corks were placed on the hyperspectral conveyor system. For Bopsil, samples were divided into three sets due to space restrictions on the hyperspectral conveyor system. The Bopsil sets consisted of two control corks, six corks coated with the fixed pistol and six corks coated with the mobile pistol. All sets were processed under the same conditions and can be considered as a single experimental group. CAF samples consisted of a single set composed of two control corks, five corks coated with the fixed pistol and five corks coated with the mobile pistol. For each set, a 50% Spectralon (SphereOptics, Herrsching, Germany) diffuse reflectance reference was incorporated to standardize spectra.
Each set of corks was scanned with a setup the same as Xu et al. (2022). 13 This consisted of a HySpex SWIR-384 camera (NEO Ltd, Oslo, Norway) with a spectral range of 951-2496 nm and nominal spatial resolution of 730 μm × 730 μm per pixel. Two Hyspex lamps that provide illumination between 400 and 2500 nm, operating at 12 V DC and 150W, were positioned symmetrically at 14 cm from the point-of-view of the camera, with a height of 30 cm and an angle of 45° to the vertical axes.
Each image was scanned with an integration time of 6300 μs, frame period of 6500 μs and a recording speed of 3.80 cm/s. For each line of corks, three instrumental replicas were taken. Finally, the set of corks was rotated approximately 90° and scanned again. This procedure was repeated until the corks had completed a 360° rotation.
Data analysis
Pre-processing
The data pre-processing was computed using MATLAB (R2023b, The MathWorks, Inc., Natick, MA, USA), including the Image Processing Toolbox.
The pre-processing stage starts by averaging all the instrumental replicas. Then, true reflectance values were calculated using a Spectralon white reference, placed alongside the samples in each image. The raw radiance images obtained from the image acquisition software were first normalized to account for illumination variations along the scanning line of the pushbroom system. This normalization was performed by calculating relative reflectance for each pixel, dividing the pixel values of each row along the scanning line by the average radiance values of the white Spectralon at that same row.
Once relative reflectance was determined, true reflectance was computed by multiplying each pixel’s relative reflectance by the reference spectra of the Spectralon, as provided by the supplier. This step ensures that the true reflectance spectra of the sample are independent of the specific illumination system used in the imaging setup.
Finally, the images were cropped to remove as much background as possible, trying to include only the region of interest, that is, the cork stoppers.
Classification model
The classification model development and the statistical analysis were performed using Python 3.8.10, including the following packages: NumPy (1.24.4), Scikit-Learn (1.3.2) and SciPy (1.10.1).
Hyperparameters used during the grid-search algorithm.
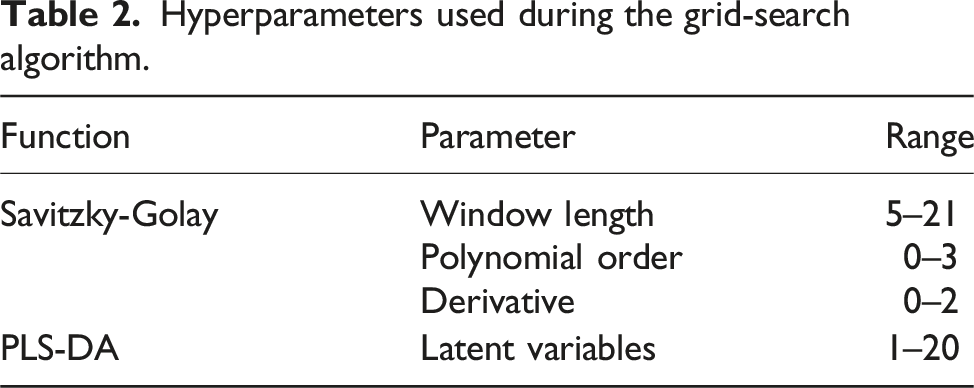
Image analysis
According to the coating type the appropriate model was selected and the remaining images were predicted using the model. The raw output of the PLS-DA is 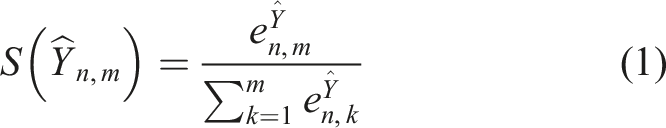
Equation (1): Softmax function where
Each hyperspectral image was converted to a grayscale image, where the grey level corresponds to the probability of the class being “coated”. The brightest tones correspond to values close to one and the darker tones correspond to values close to zero.
Statistical analysis
Each image was scaled to integer values between 0 and 255, corresponding to 256 grey levels. Since each image contains multiple corks, sub-images were extracted corresponding to each cork area. This processing resulted in 216 cork sub-images (54 corks, each with four rotations of 90° increments). For each cork sub-image, a GLCM with distances of 5, 10, 15 and angles of 0,
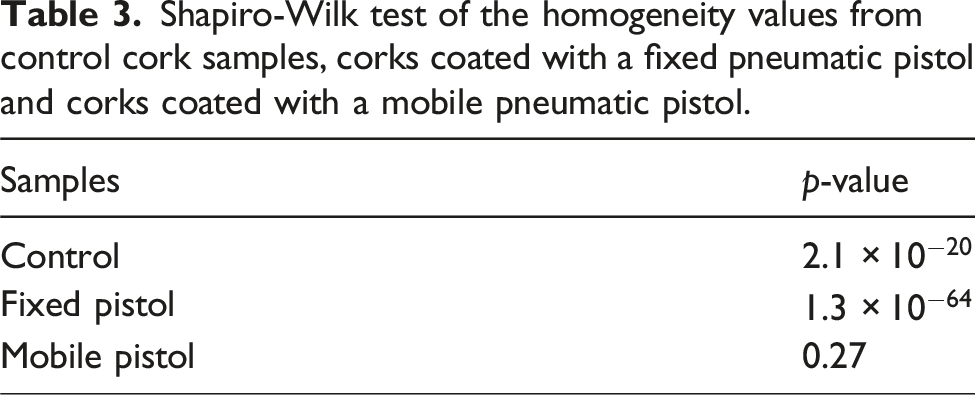
Each resultant GLCM output has a size of [256 × 256 × 3 × 4], where the first two dimensions correspond to the grey levels, and the last two dimensions correspond to the number of distances and angles. Next, the “homogeneity” of the GLCM matrices were calculated as described by Haralick et al. (1973). 16 The resulting output is a 2D matrix of shape [d × a], where d represents the distances and a represents the angles. In this case, the output matrix has a shape of [3 × 4]. These matrices were flattened to produce a single vector of homogeneity values for each cork subimage. The flattened homogeneity vectors were concatenated into 3 separate vectors, one for each cork type (non-coated, fixed, and mobile pneumatic pistol). A Shapiro-Wilk test was performed to test the normality of the data. Finally, a Kruskal–Wallis test was used to determine if there was any statistical difference between the two coating application methods (fixed and mobile pneumatic pistol).
Results and discussion
Interpretation of SWIR spectra
The Savitzky-Golay second derivative of the mean reflectance SWIR spectra for image background, non-coated and coated (CAF and Bopsil) corks are shown in Figure 1. (a) Raw spectra, (b) pseudo absorbance (c) second order Savitzky-Golay derivative with a window of 11 points and a second order polynomial, of the mean spectra of background, non-coated cork, and cork coated with Bopsil and CAF. Background mean spectra were removed from plots (b) and (c) for better interpretation.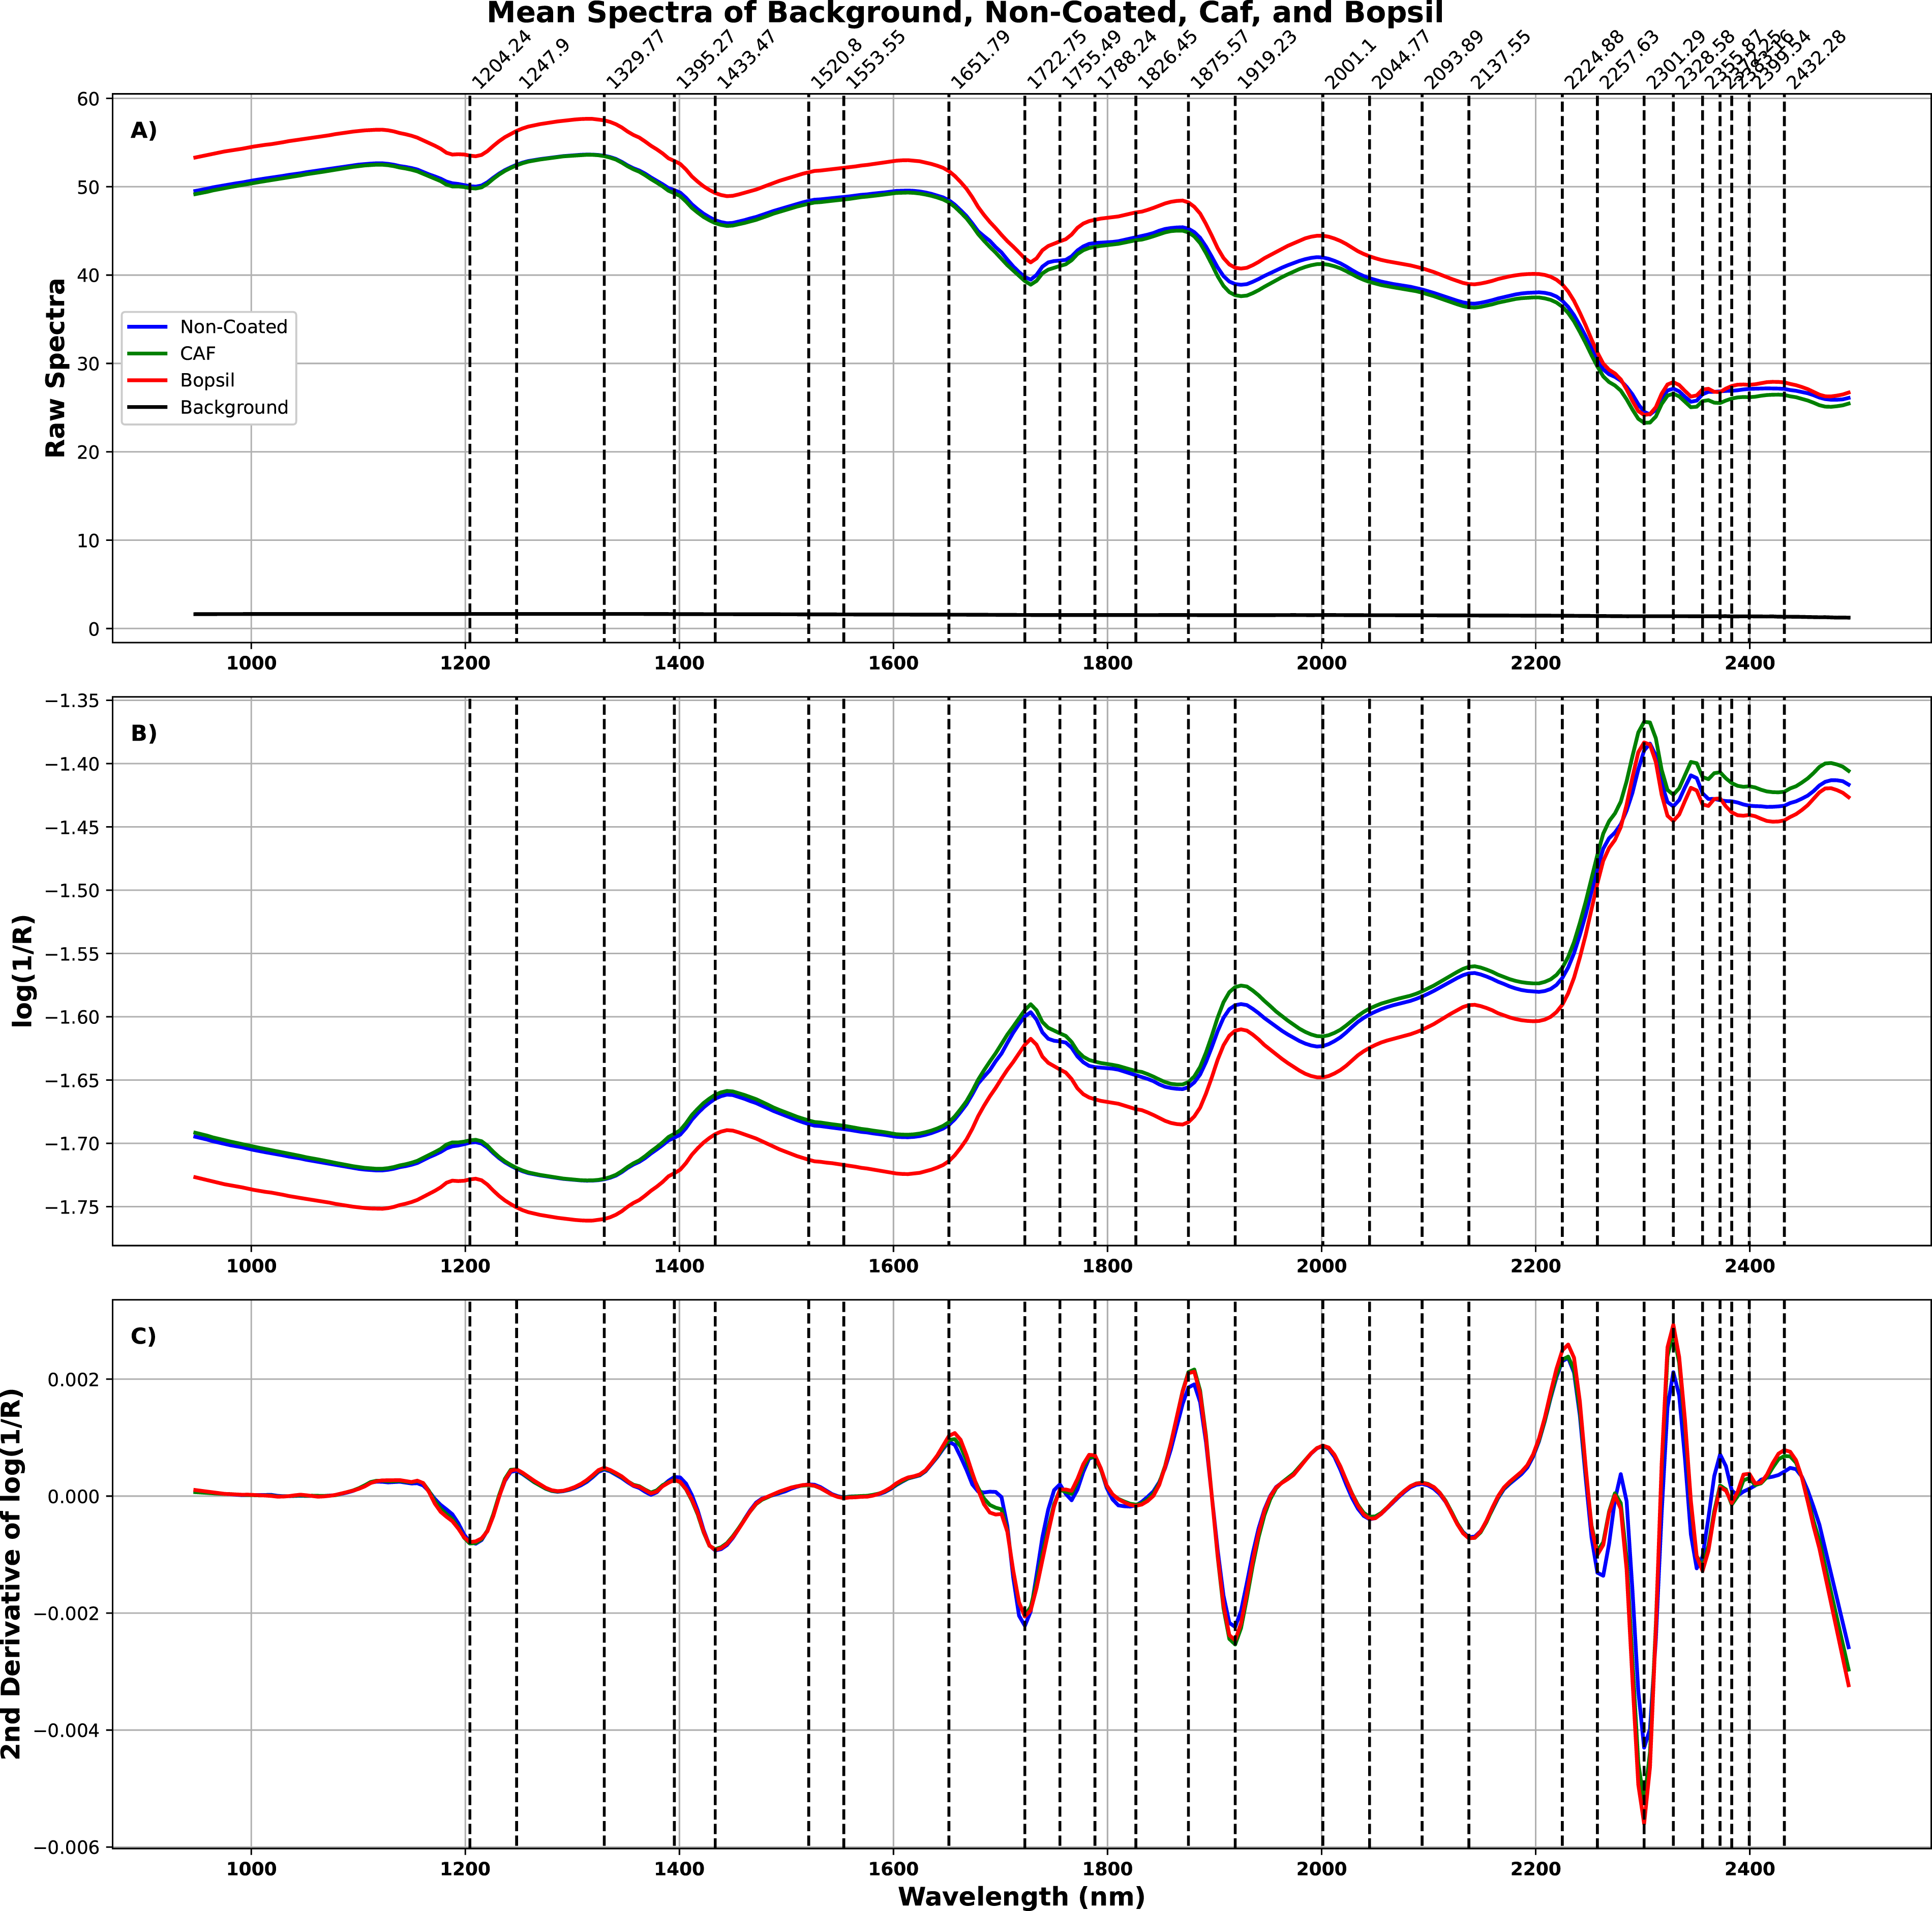
The background spectrum is a constant line with reflectance values close to 0, this is because the stage is a black metal material, absorbing almost all the light. The cork spectrum has a prominent peak at around 1225 nm, corresponding to the second overtone of C-H stretching, due to the CH and CH2 groups highly present in cellulose and suberin. 17 The negative peaks at 1430 and 1920 nm correspond to the water region. 18 The peak around 1390 nm corresponds to the C-H bonds of linear aliphatic groups that are present in lignin and suberin. 18 The peak at 1720 nm belongs to the first overtone of C-H bonds, mainly present in cellulose, hemicellulose, and lignin.18,19 This first-overtone is also visible at 1788 nm, but this time due to semi-crystalline or crystalline regions in cellulose and xylan. 17 The sharp peak at 2137 nm belongs to acetyl groups.18,19 These groups occur often in hemicelluloses. 19 The sharp and highest peak at 2300 nm corresponds to the methylene group, associated with branched aliphatics. 19 These bonds are present in suberin. 19 Characteristic bands of polysaccharides are found as the 2nd overtone of the CH2 bending vibration near 2350 nm.18,19 The main difference between the coated and non-coated first derivative spectrum is a small peak around 2380 and 2400 nm. This corresponds to the C-H and C-C stretching combination bands, highly present in lipids. 18
Classification model
A PLS-DA model was fitted to discriminate between background, coated and uncoated cork stoppers. This model consists of a second order Savitzky–Golay filter derivative with a window size of 11 points and a third polynomial order, followed by a PLS-DA with five latent variables, achieving an accuracy on the validation set of 99.9%.
The PLS-DA loadings provided important information about the chemical bands responsible for the difference between the samples. Figure 2 shows the first three regression coefficients of the PLS-DA. The first coefficient corresponds to cork spectra, the second coefficient to the coating spectra, and finally the third coefficient is the background spectra, as explained previously. Figure 3 represents the absorbance spectrum of Bopsil and CAF. Both spectra have peaks around 1600-1800 nm and 2250-2400 nm. These regions align with those found in the second regression coefficient. This leads us to believe that the second coefficient primarily represents the coating materials. Regression coefficients of the PLS-DA model. (a) The main peaks correspond to the functional groups of the cork material. (b) The peaks correspond to the coating material for both types, CAF and Bopsil. (c) These peaks are from the background material. Absorbance spectrum of (a) Bopsil and (b) CAF.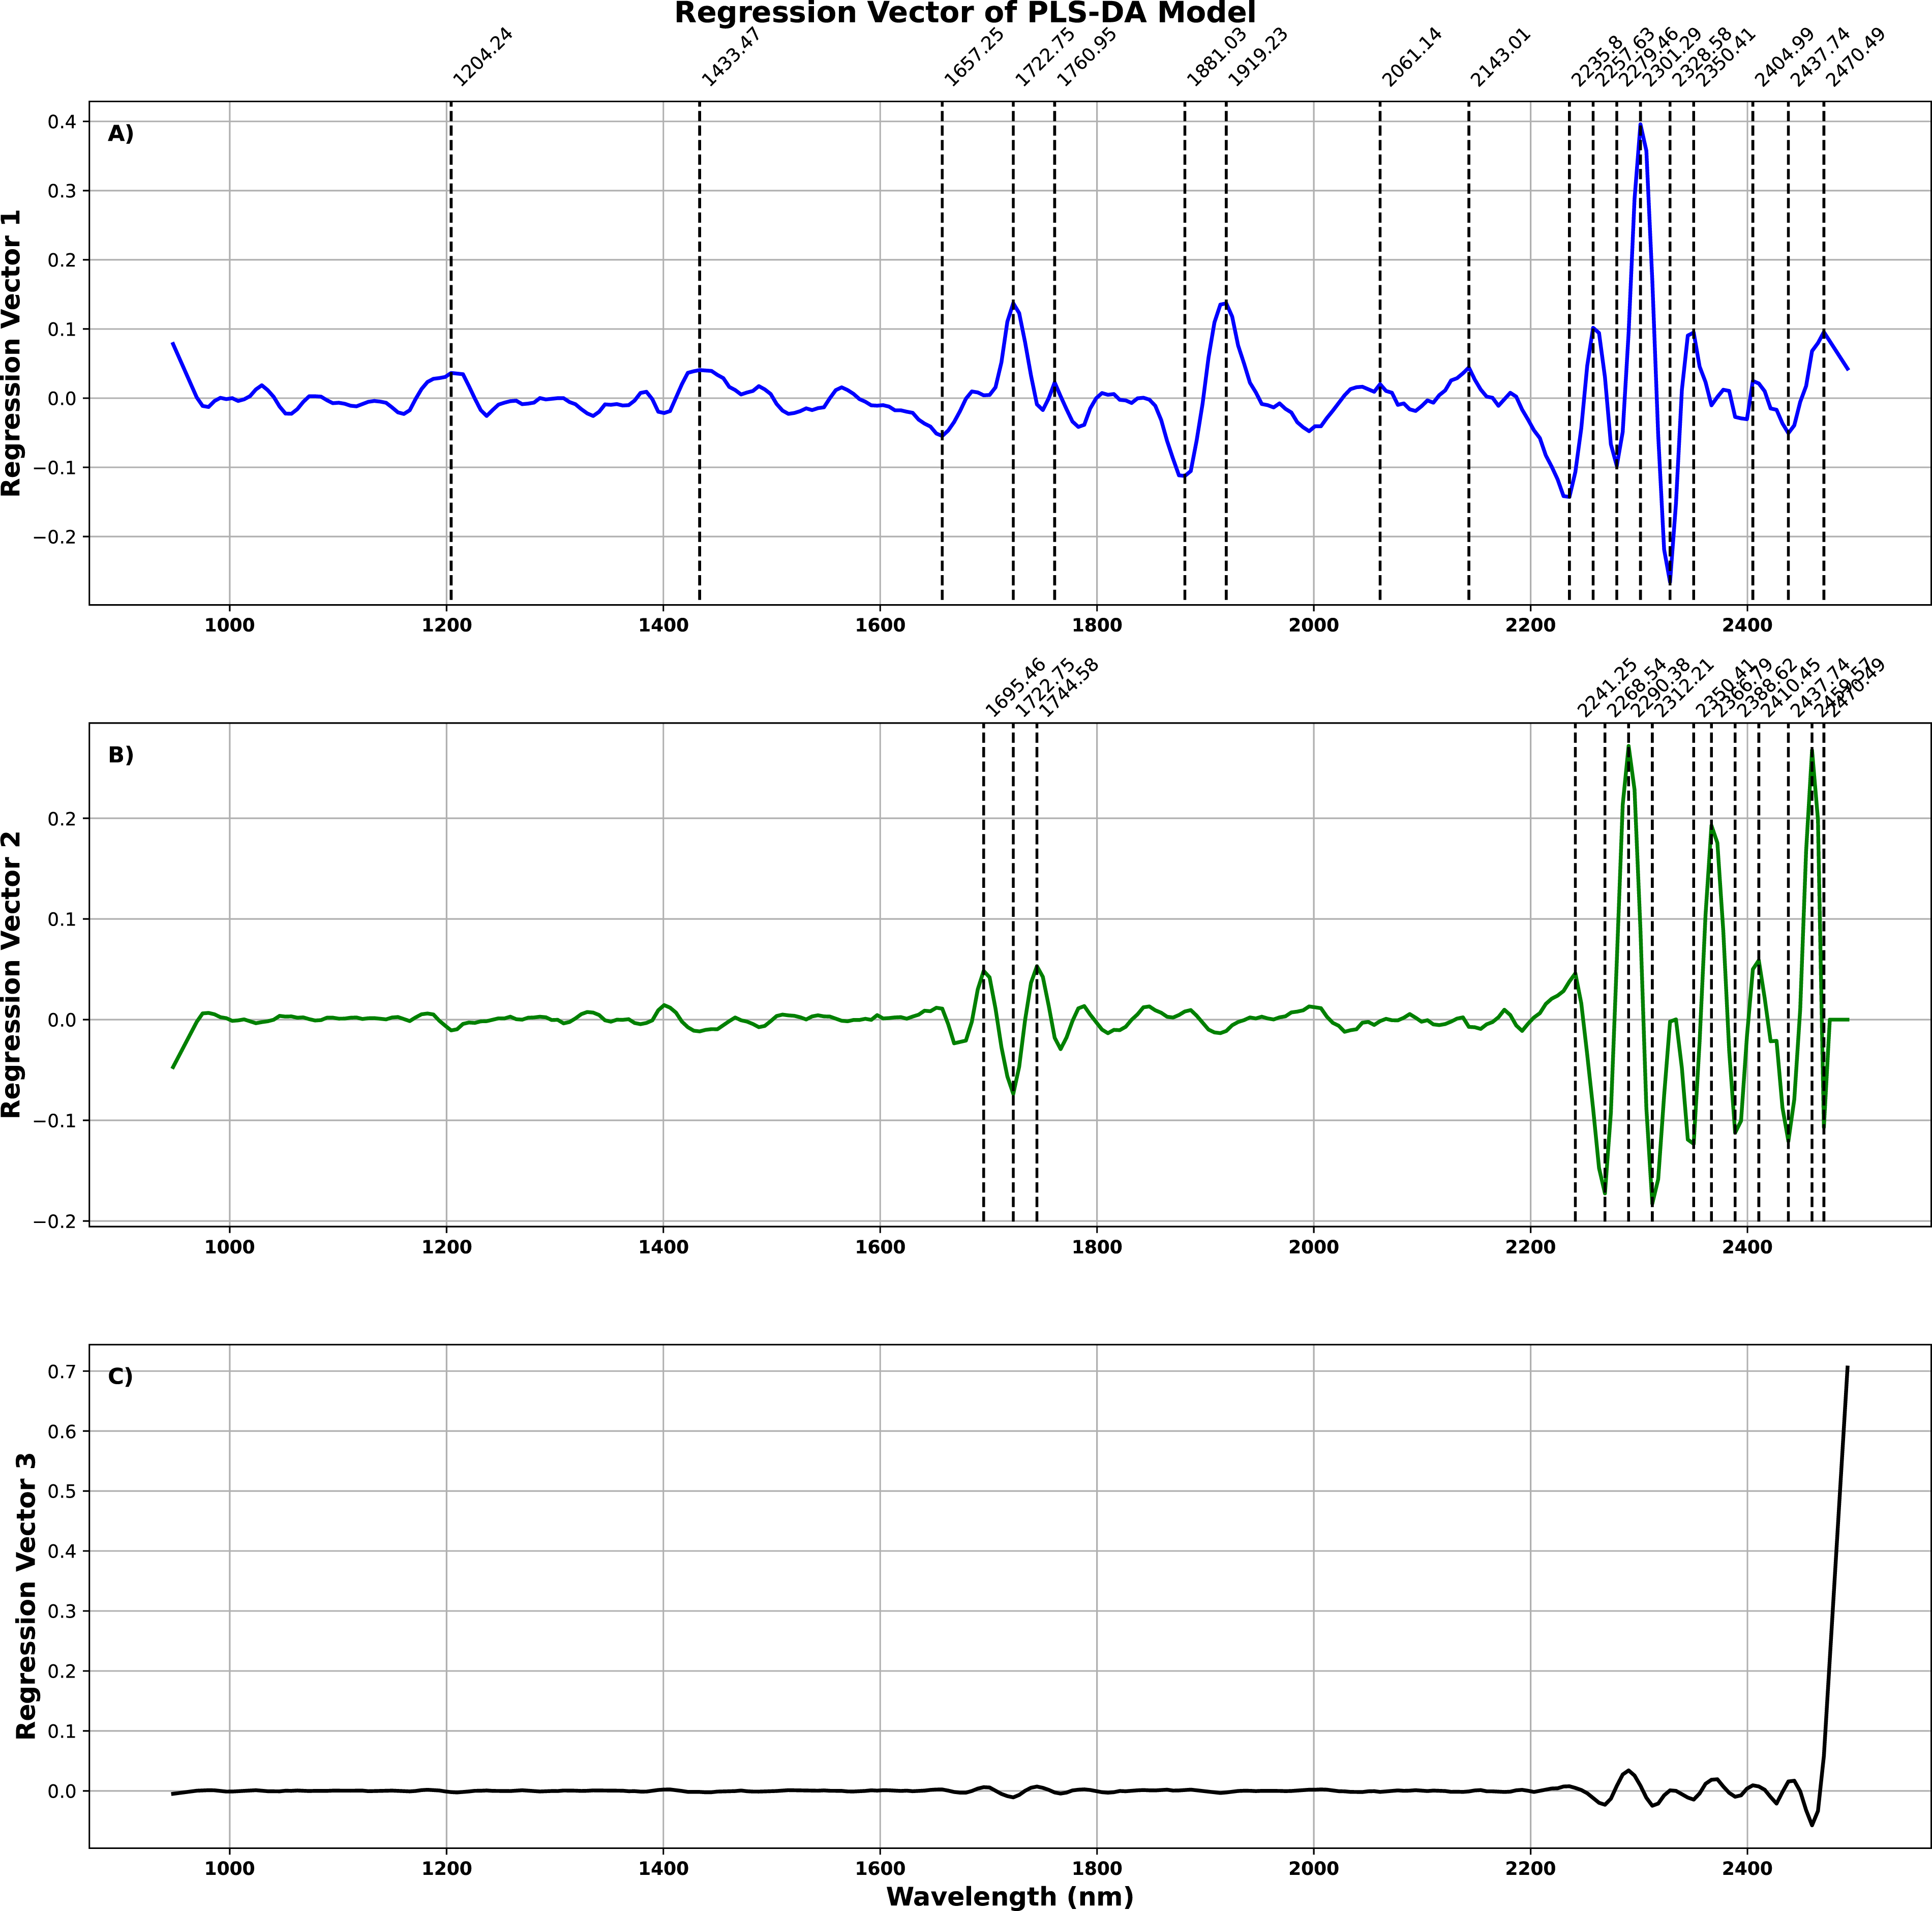
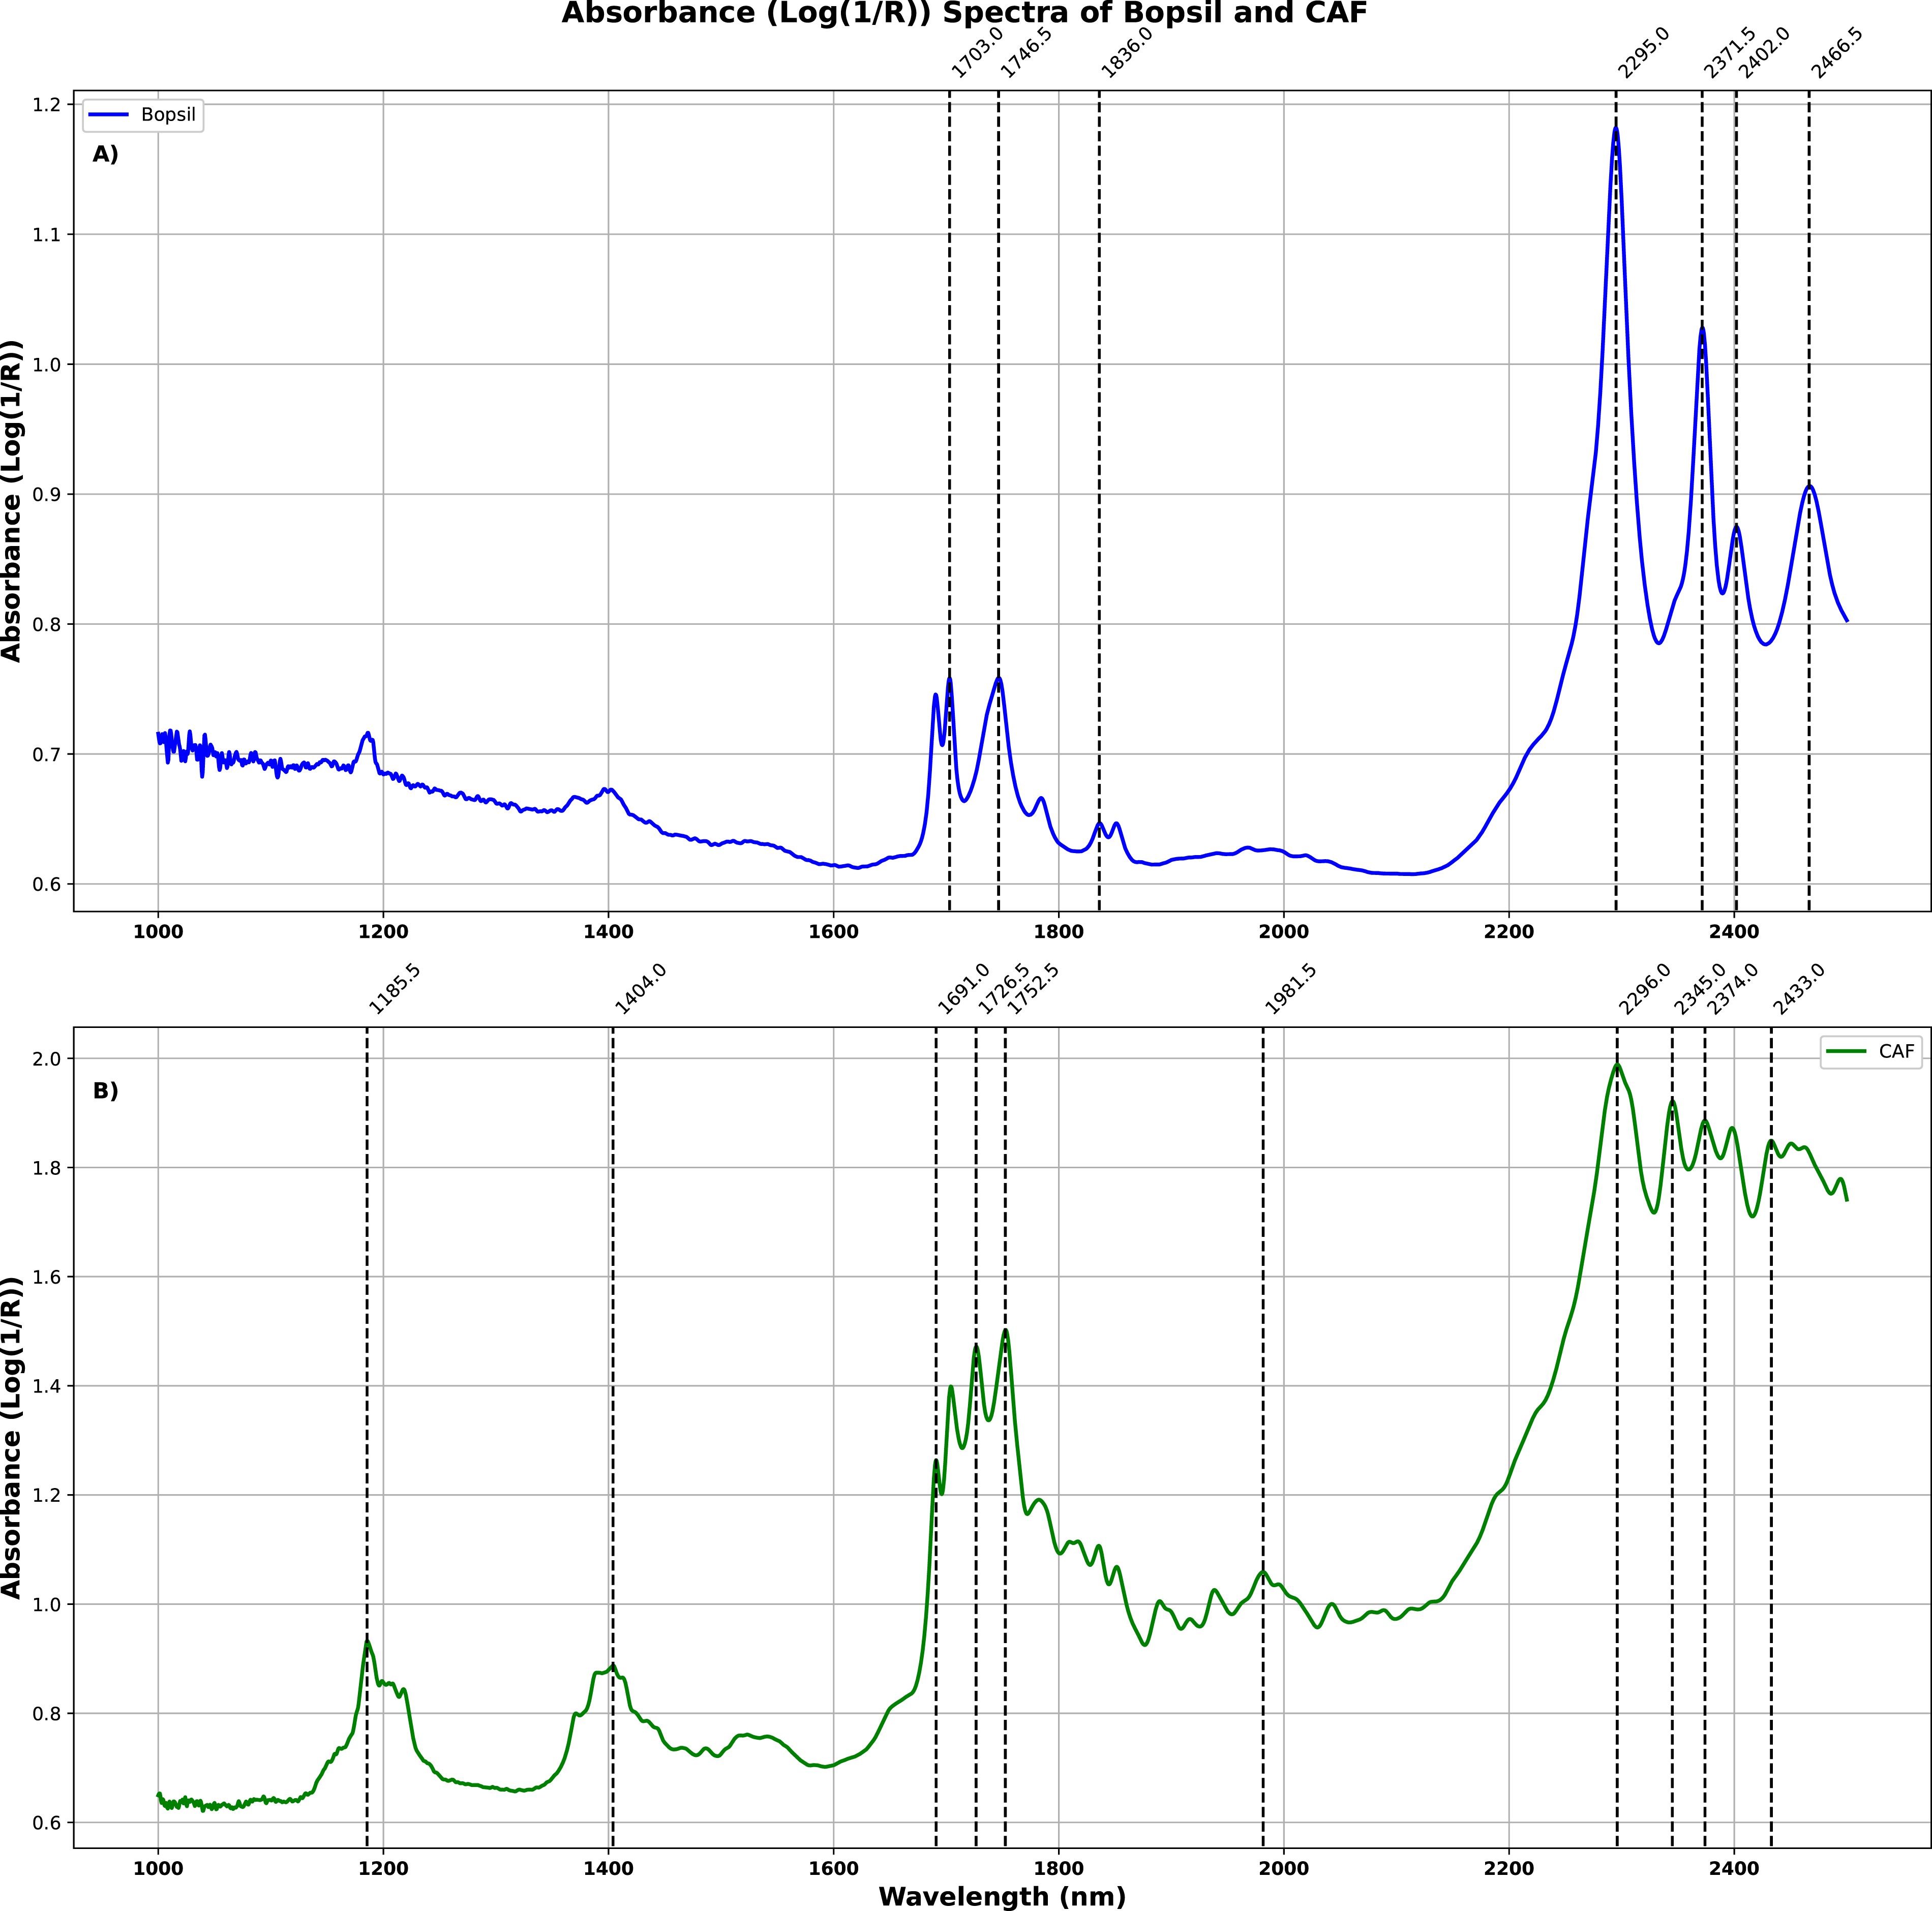
Image analysis
Three prediction images, one for each class, were obtained from the PLS-DA model for each one of the hyperspectral images acquired. This study focused only on the probability of being classified as “coated”, as the main objective was to compare the coating homogeneity on the cork surfaces. The prediction image representing probability of belonging to the coated class for Bopsil samples is plotted in Figure 4. The prediction image for CAF coated samples is shown in Figure 5. Bopsil PLS-DA prediction image. The colour gradient corresponds to the probability of being from the class “coated”. Values closest to 0 are blue in colour and values closest to 1 are red in colour. The first two corks are controls (no coating). The following six corks are coated with a fixed pneumatic pistol, and the last six corks are coated with a mobile pneumatic pistol. Each vertical image corresponds to one axial rotation of 90°. CAF PLS-DA predictions. The colour gradient corresponds to the probability of being from the class “coated”. Values closest to 0 are blue in colour and values closest to 1 are red in colour. The first two corks are controls (no coating). The following five corks are coated with a fixed pneumatic pistol, and the last five corks are coated with a mobile pneumatic pistol. Each vertical image corresponds to one axial rotation of 90°.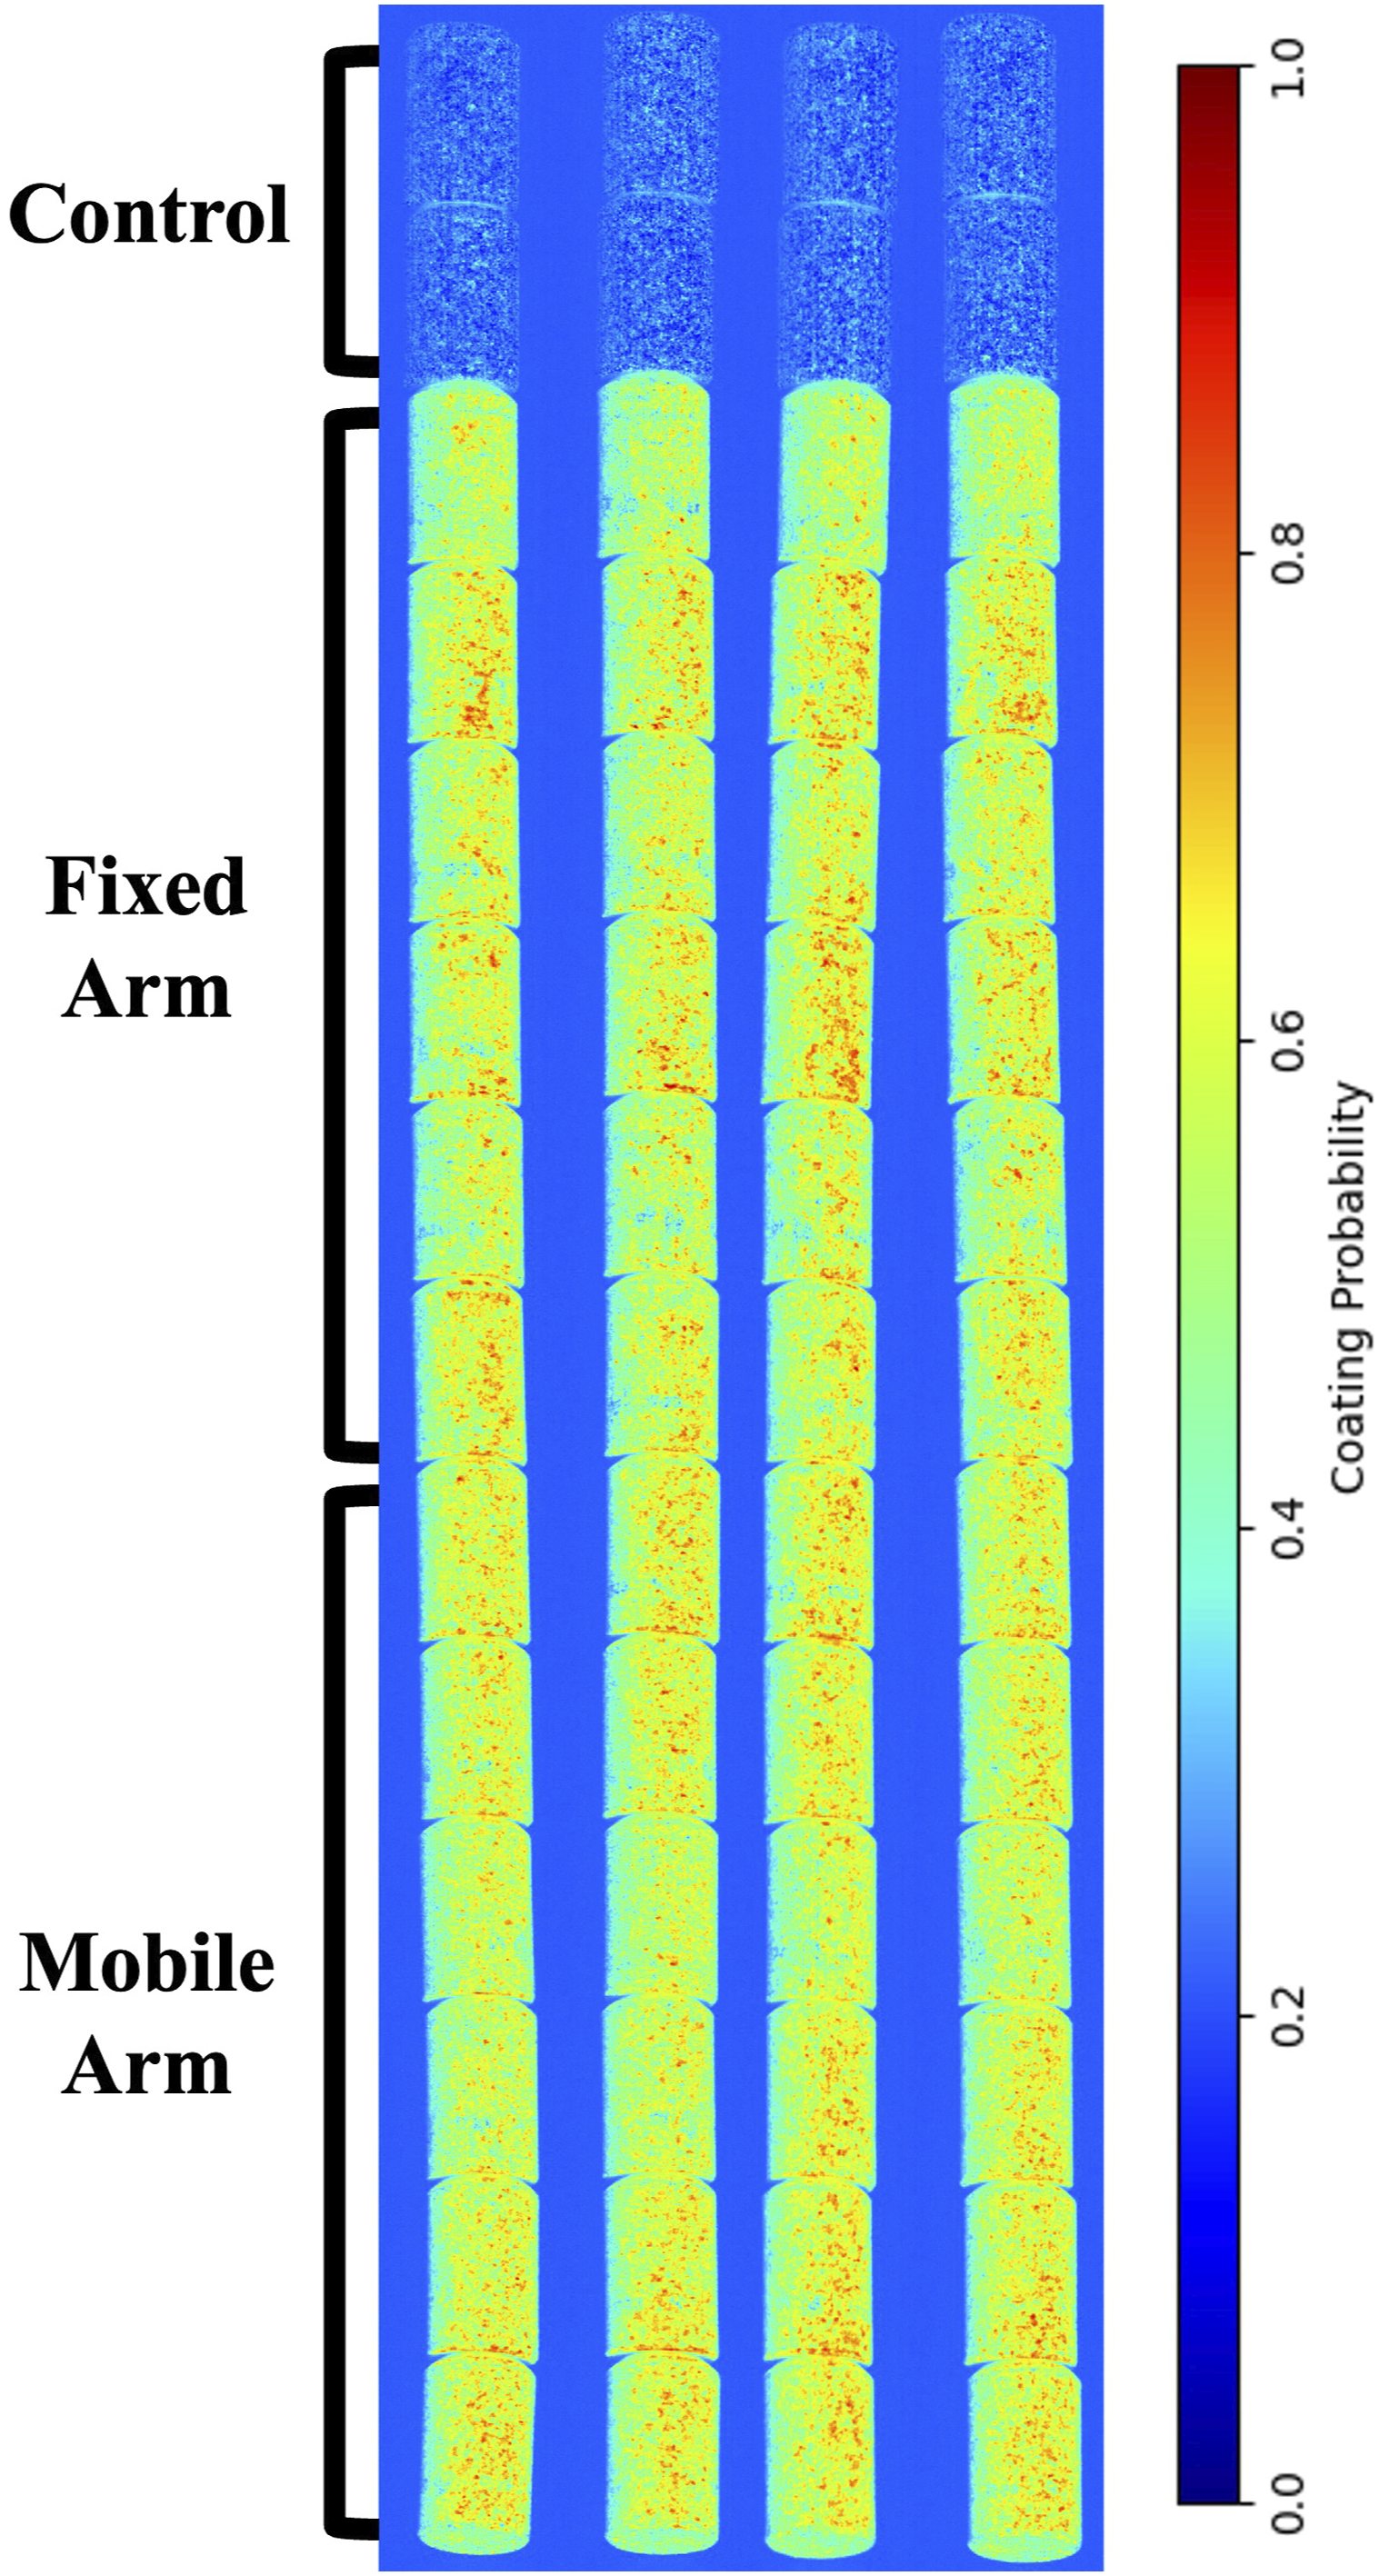
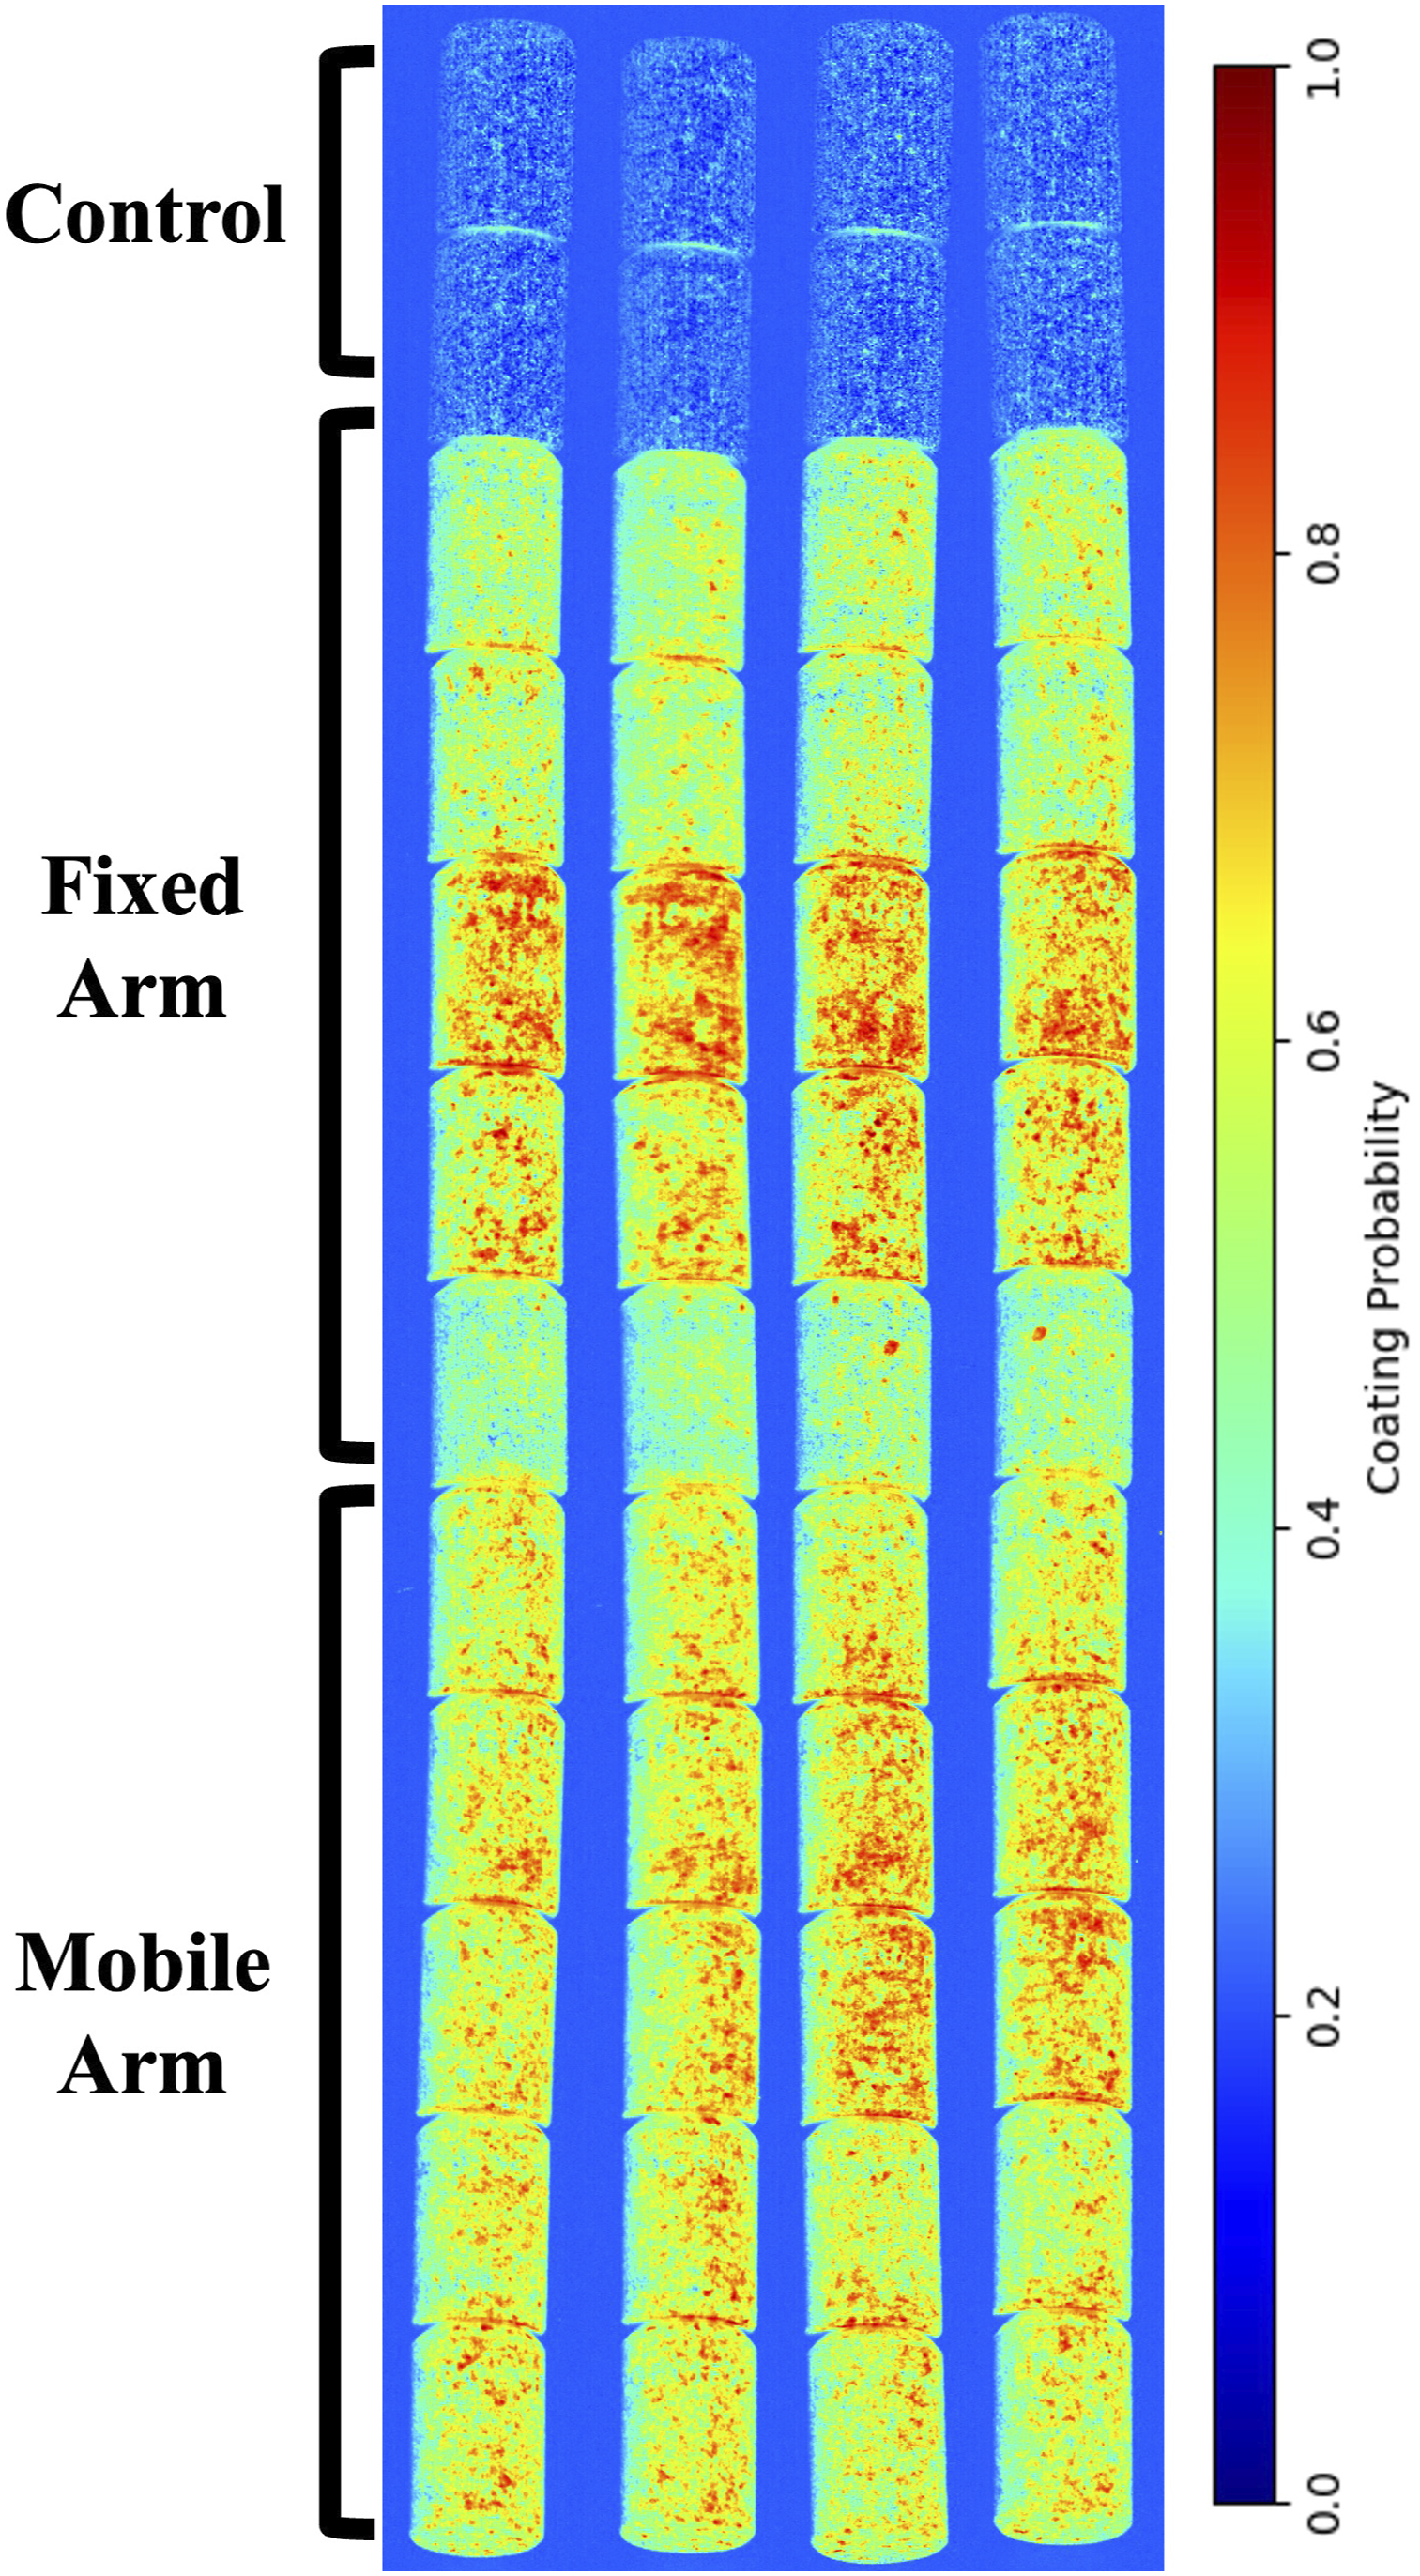
For each image, the value of each pixel in the image represents the predicted probability for that pixel to belong to the ‘coated’ class. These probability values are colour-coded using the ‘jet’ colourmap. The colourmap transitions smoothly from cold (blue) to warm (red) colours, with blue representing low values, followed by green, then yellow, and finally red representing high values.
In Figure 4, each column represents a 90° axial rotation and is composed of two control corks, six corks coated with the fixed pneumatic pistol and six corks coated with the mobile pneumatic pistol.
In all images, the background exhibits a uniform blue colour. This occurs because the model effectively distinguishes between “background” and “non-coated” or “coated” spectra, with the probabilities of being “coated” almost zero. Looking at the control corks, the first two corks for each rotation, it is noticeable that the probability of belonging to “coated” is low, but with more heterogeneity when compared with the background. It is proposed that this heterogeneity is due to the error of the system. Looking at coated corks, the images are greener and orange, since the probabilities of being coated are higher. Visually it is not possible to see differences between corks coated with a fixed or mobile arm, since all corks have a similar colour gradient.
Figure 5 shows the CAF PLS-DA predictions, like the Bopsil image it reveals a clear distinction between background and cork regions, and a subtle heterogeneity observed in the control samples. However, in contrast to the Bopsil samples, the CAF samples reveal different variances among the coated corks, especially, the corks coated with the fixed pneumatic pistols. Three of them display a predominantly green hue, while only two samples display orange tonalities. This difference in probabilities could indicate that the two corks with higher probabilities (orange tonality), have more coating material on them. Such patterns are not present in the corks coated using the mobile pneumatic pistols, where a more uniform colouration is evident, indicating a more evenly coated surface.
Statistical analysis
Figure 6 show the boxplots of homogeneity values from PLS-DA prediction maps for the presence of coating on control, Bopsil and CAF samples, respectively. In homogeneous areas of the images, such as those represented by the control samples in Figures 4 and 5, there are fewer regional variations in the intensity, as compared with the treated samples. As a result, the “homogeneity” feature is expected to be higher in areas of control samples.
16
Boxplot of homogeneity values of control samples (blue), corks coated with a fixed (orange) pneumatic pistol and corks coated with a moving (green) pneumatic pistol.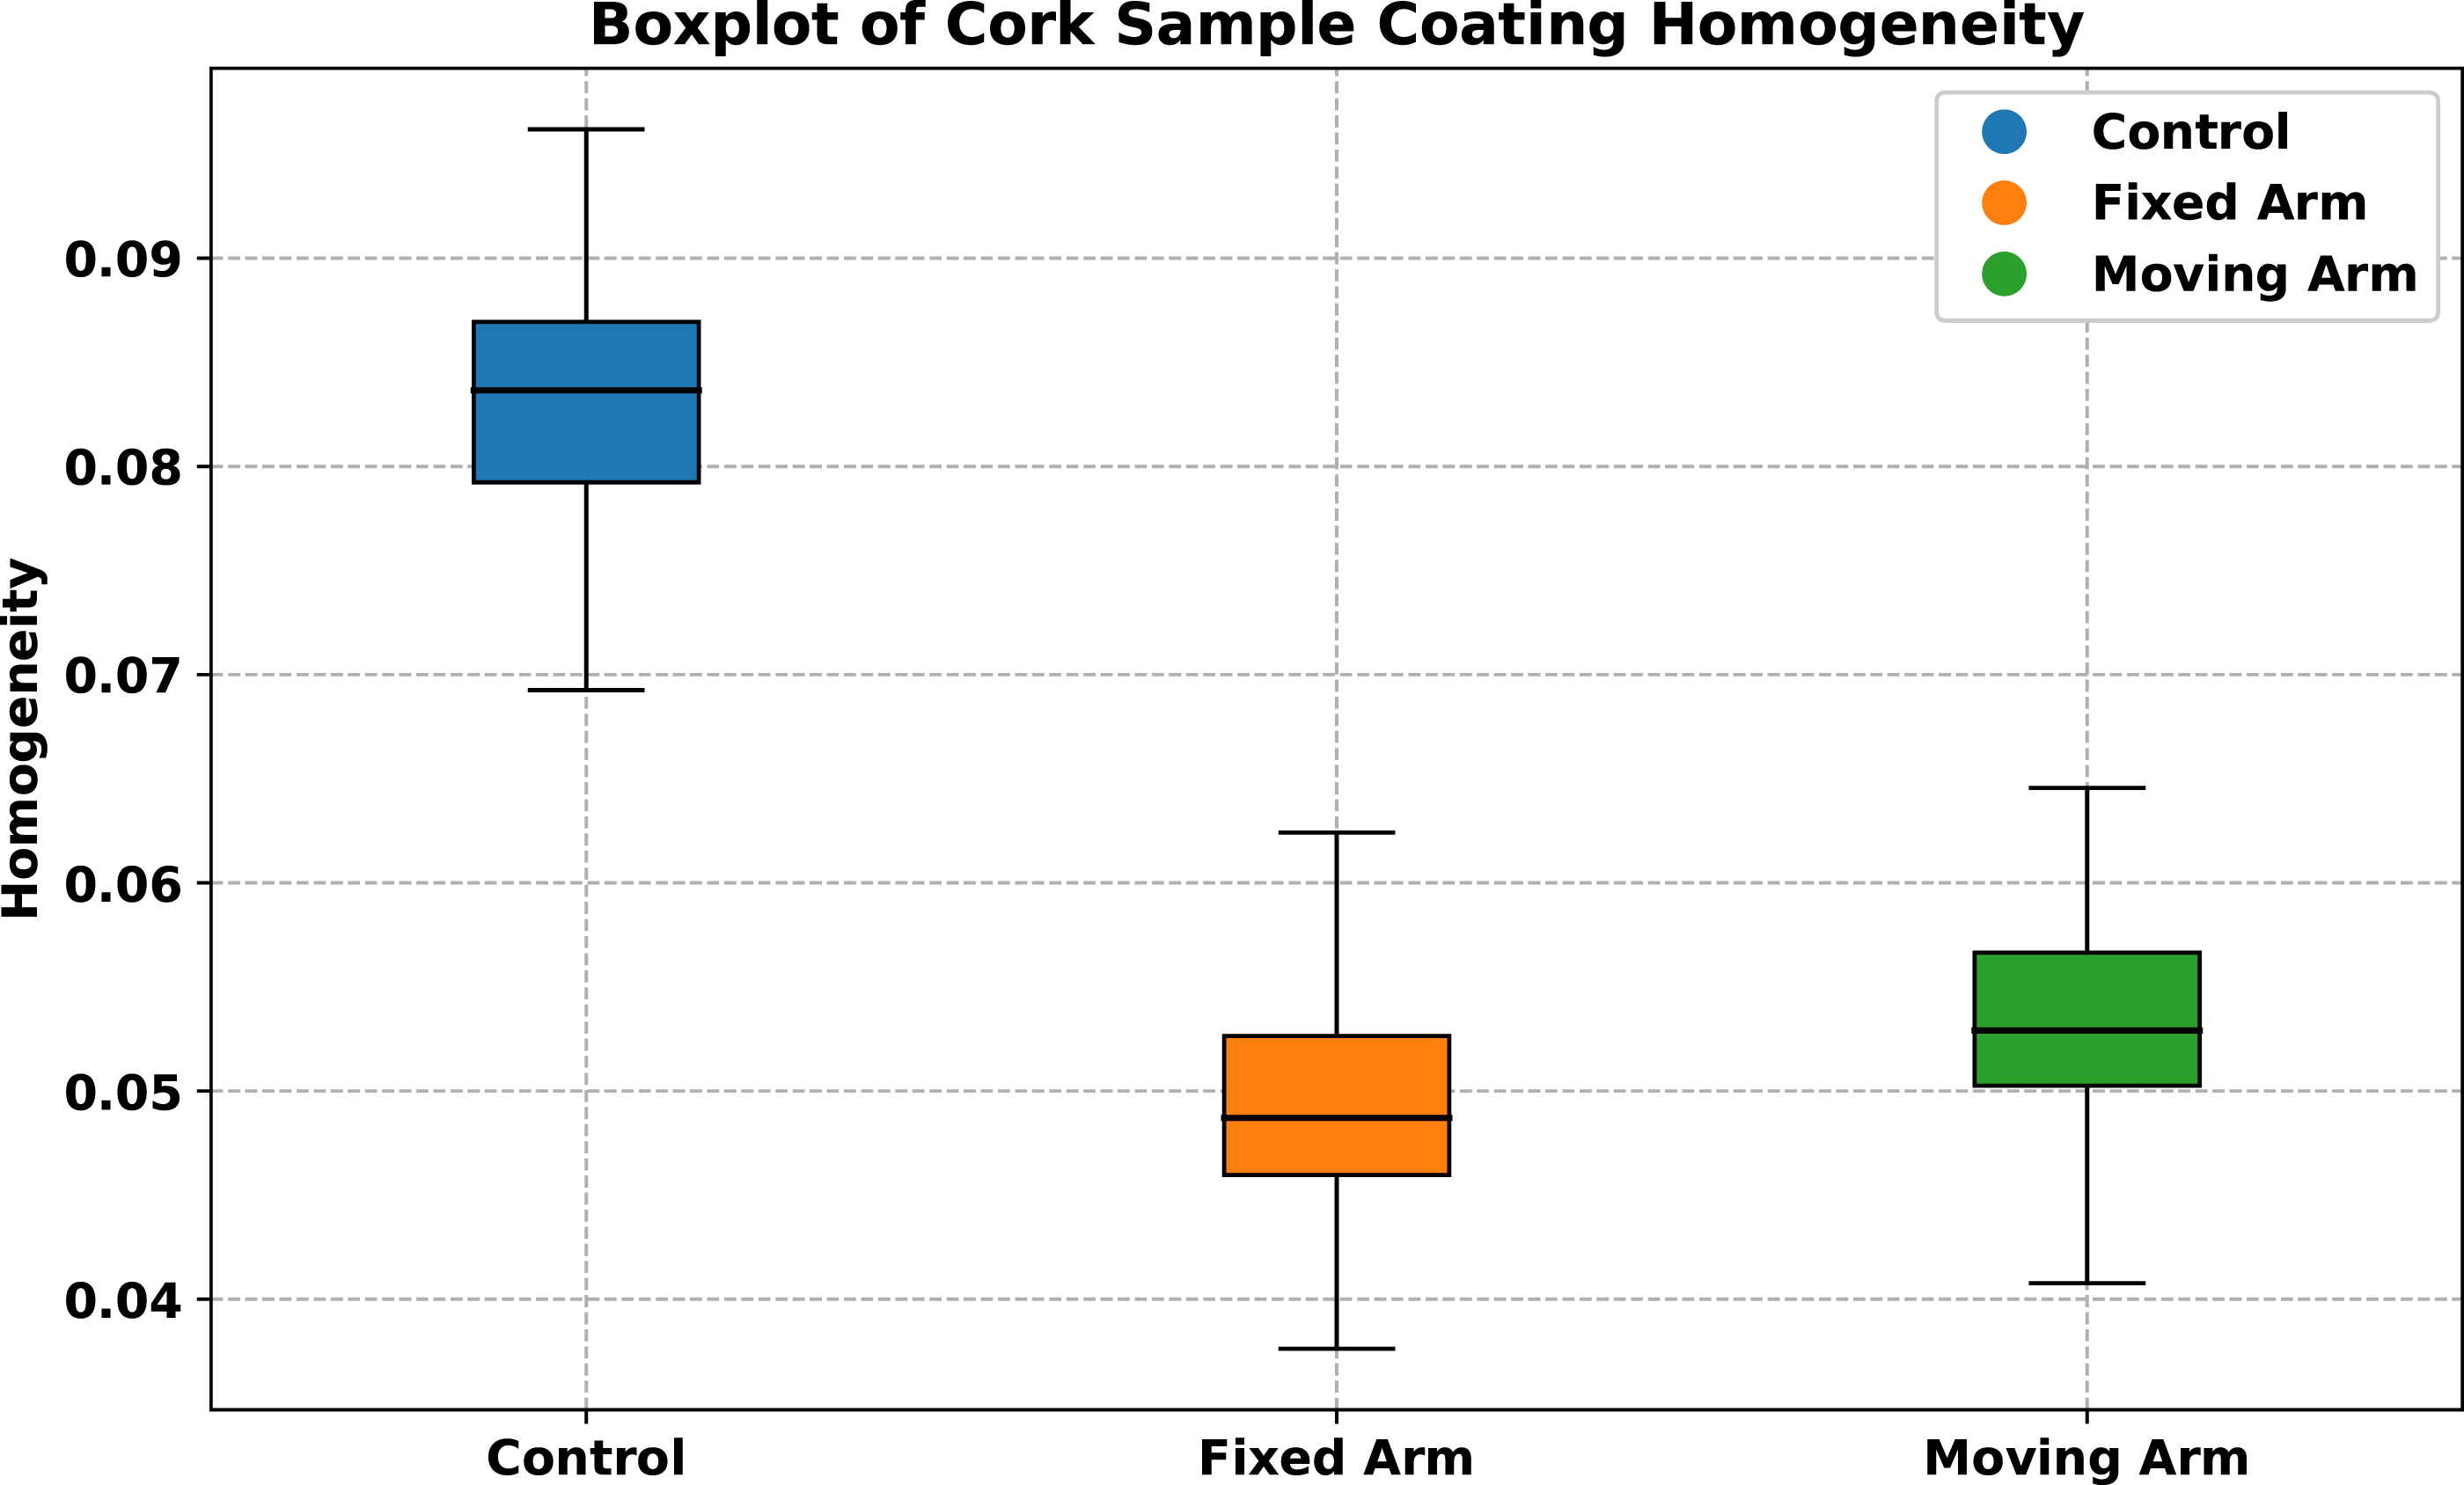
From the boxplot, it is possible to notice control samples have higher homogeneity values than the coated samples. Homogeneity measures the closeness of a set of pixels from the diagonal line of the GLCM. High homogeneity values implies that pixel values are similar and clustered around the GLCM diagonal, consequently, images where pixel values are more uniform (less noise) have higher homogeneity values. Control samples do not have a coating, therefore there is no variance of coating. This leads to higher homogeneity values. Samples coated with fixed and moving pneumatic pistols have more heterogeneity due to the coating surface, leading to noisier areas of the images (mobile and fixed areas from Figures 4 and 5), and decreasing the homogeneity values. Some overlap is also noticeable in the distributions between these two groups.
Shapiro-Wilk test of the homogeneity values from control cork samples, corks coated with a fixed pneumatic pistol and corks coated with a mobile pneumatic pistol.
Dunn test results, comparing homogeneity values from control cork samples, corks coated with a fixed pneumatic pistol and corks coated with a mobile pneumatic pistol, with a confidence level of 95%.
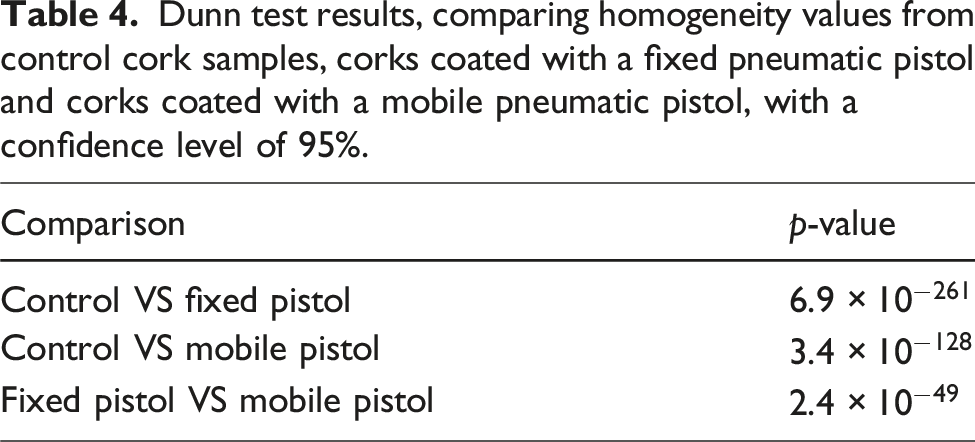
Based on the p-values obtained from the Dunn test, it is possible to notice that comparisons of control against fixed and mobile pneumatic pistol application methods have extremely low p-values, indicating a significant difference of the homogeneity values of control and the two application methods. This suggests that control cork stoppers have a more homogeneous surface, compared to corks with coating. The same results are also present in Figures 4 and 5.
Comparing the homogeneity values between fixed and mobile pneumatic pistols, the p-value is still below the significance level of 0.05. This indicates that applying coating to corks with a mobile pneumatic pistol results in a considerably higher homogeneity value. These values can be explained due to several factors such as the movement of the mobile pistol allowing for a more even and consistent distribution of the coating material across the surface of the cork stopper. The movement and angles of the pistol can be adjusted, creating a spray of coating that has a consistent speed and pattern. This can reduce the spots on the cork surface that have coating over-applied or under-applied, leading to a more uniform coating layer.
Conclusion
In conclusion, the analysis of hyperspectral SWIR images, coupled with chemometrics and image processing techniques, provides a valuable insight into cork stopper coating homogeneity. In particular, the spectral analysis reveals features that differentiate control corks and corks with a coating material. These features correspond to functional groups highly present in cork and coating materials. These differences allowed a PLS-DA classification model to be trained to distinguish between those three classes. The probability corresponding to “coating” was then used to create a grey-scale image.
Statistical analysis showed that applying cork coatings with a mobile pneumatic pistol leads to higher cork coating homogeneity than applying cork coatings with a fixed pneumatic pistol. The mobile pneumatic pistol method likely results in higher homogeneity values due to its ability to evenly distribute the coating material and maintain consistent application parameters. These factors collectively contribute to a more uniform and homogeneous coating on cork stoppers compared to fixed pneumatic systems.
Footnotes
Acknowledgements
We are grateful to the University College of Dublin (UCD), Ireland, for providing us with the HySpex SWIR-384 instrument. We would also like to express our sincere gratitude Cork Supply Portugal (Porto, Portugal), for providing samples and knowledge about the cork production steps.
Declaration of conflicting interests
The author(s) declared no potential conflicts of interest with respect to the research, authorship, and/or publication of this article.
Funding
The author(s) disclosed receipt of the following financial support for the research, authorship, and/or publication of this article: This work was supported by the SensorFINT Cost Action [CA19145] through a Short-Term Scientific Mission (STSM). Áine Ní Fhuaráin acknowledges PhD funding from the Dairy Processing Technology Centre funded through Enterprise Ireland. Grant Agreement Number: TC-2020-0028.