
Abstract
Short wave infrared hyperspectral imaging was tested for its ability to distinguish rooibos tea (Aspalathus linearis) based on production area and quality grade, with the aim to replace time-consuming sensory analysis in the industry. The number of latent variables and model parameters of the calibration model were optimised by cross-validation. Classification error rates were used to evaluate the performance of the models in classifying rooibos based on production area and quality grade. The production area of rooibos was distinguished by applying a partial least square-discriminant analysis model with second derivative pre-processing, followed by mean centering and inclusion of nine LVs. The model could successfully distinguish between the two production areas and had a classification accuracy of 100% for the prediction set. To distinguish between different quality grades, a hierarchical model with second derivative pre-processing was developed. Grade A could be distinguished successfully from grades B, C and D (class BCD) with 100% accuracy and grade D could be distinguished from grades B and C (class BC) with 96% accuracy. However, the model was less accurate to distinguish between grade B and C samples, with prediction accuracies of 82 and 66% for B and C, respectively. Application of near infrared hyperspectral imaging therefore offers the potential to replace the use of sensory analysis in the rooibos tea industry to predict production area and quality grade of this herbal tea.
Keywords
Introduction
Several studies have demonstrated the application of near infrared (NIR) spectroscopy and NIR hyperspectral imaging (NIR-HSI) to classify Camellia sinensis teas based on quality,1–4 extent of fermentation, 5 storage period, 6 and geographical origin.7,8 The relationship between non-volatile compounds such as polyphenols and specific NIR spectral regions forms the basis of such classifications. Near infrared spectroscopy represents a spectroscopic technique, which measures absorbance or reflection of light in the NIR region of the electromagnetic spectrum (800 – 2500 nm). 9 This technique only provides a mean spectrum for the sample being analysed, whilst hyperspectral imaging combines NIR spectroscopy with digital imaging, which enables the spatial and spectral data of a sample to be collected. 9
To date, the application of NIR-HSI to rooibos tea (Aspalathus linearis) for quality assessment purposes has not yet been investigated. Given that the quality of a product is inherent to its relative market share and returns, it is in the interest of the rooibos industry to ensure that rooibos tea reaching the market is of consistent, good quality. Most of the annual production of rooibos tea is subjected to a quality grading system that classifies each production batch either as A, B, C or D grade, with grades A and D representing the highest and poorest quality, respectively. The bulk of the production is graded as B or C. 10 Grades are determined by the flavour and clarity of the infusion and the appearance of the dry and wet leaves. The distinction between grades A and B is based on the typical rooibos flavour and taste, with the typical flavour being less intense in grade B rooibos. Grade C rooibos has a similar flavour and taste profile to grade B rooibos, except that some negative aroma attributes could be present at low intensities. The flavour of grade D rooibos is poor as it usually has an unacceptable high intensity of negative aroma attributes. 11
Another aspect of rooibos production that could tie into quality is the production area, since it could provide impetus to industry to promote a specific area-of-origin within the context of the recently awarded ‘Protection Designation of Origin (PDO)’ to rooibos from the European Union (EU). Descriptive sensory analysis of infusions, prepared from rooibos grown in the Western and Northern Cape Provinces of South Africa, failed to differentiate between production batches based on the production area, 12 despite the production area influencing the phenolic composition which is responsible for taste and astringency.10,13 However, the volatile compounds which are present at much lower concentrations than the non-volatiles14,15 in the processed plant material, have a greater impact on rooibos quality. 11 Regardless of very low concentrations of volatiles in plant products, examples which demonstrate the successful application of NIR spectroscopy and data analytical tools to differentiate between samples of the same product such as wines, whiskey, barley malt and coffee can be found.16–20 These studies suggest the potential application of these techniques not only to distinguishing between rooibos from different production areas, but also between different quality grades.
The advantages of the application of NIR spectroscopy include that it offers a low cost, fast, real-time, non-destructive method, requiring little to no sample preparation, which can be used for the analysis of various properties of food and agricultural products.
21
It does not make use of any chemicals and is therefore safe for the environment.
21
The application of multivariate data analysis allows several models to be developed by using the same sample spectra to predict various properties of the sample. Whereas traditional desktop NIR spectrometers collects the average spectral information of a few points, hyperspectral imaging combines the advantages of NIR spectroscopy with the ability to collect the spectral data in an image to create a 3-dimensional dataset called a hypercube.
21
This is especially advantageous for analysis of heterogeneous samples
22
such as rooibos tea (Figure 1) since a spectrum is collected at each pixel in the image.
21
When combined with chemical analysis, this technique can also be used to study the spatial distribution of chemicals in a sample.
9
Two typical samples of fermented rooibos tea produced by different suppliers have a different appearance (colour) and leaf to stem ratio, which contribute to its heterogenous nature. The application of NIR-HSI, which collects spectra of all pixels in the image, allows more of the variation in the chemical and physical properties of the samples to be captured.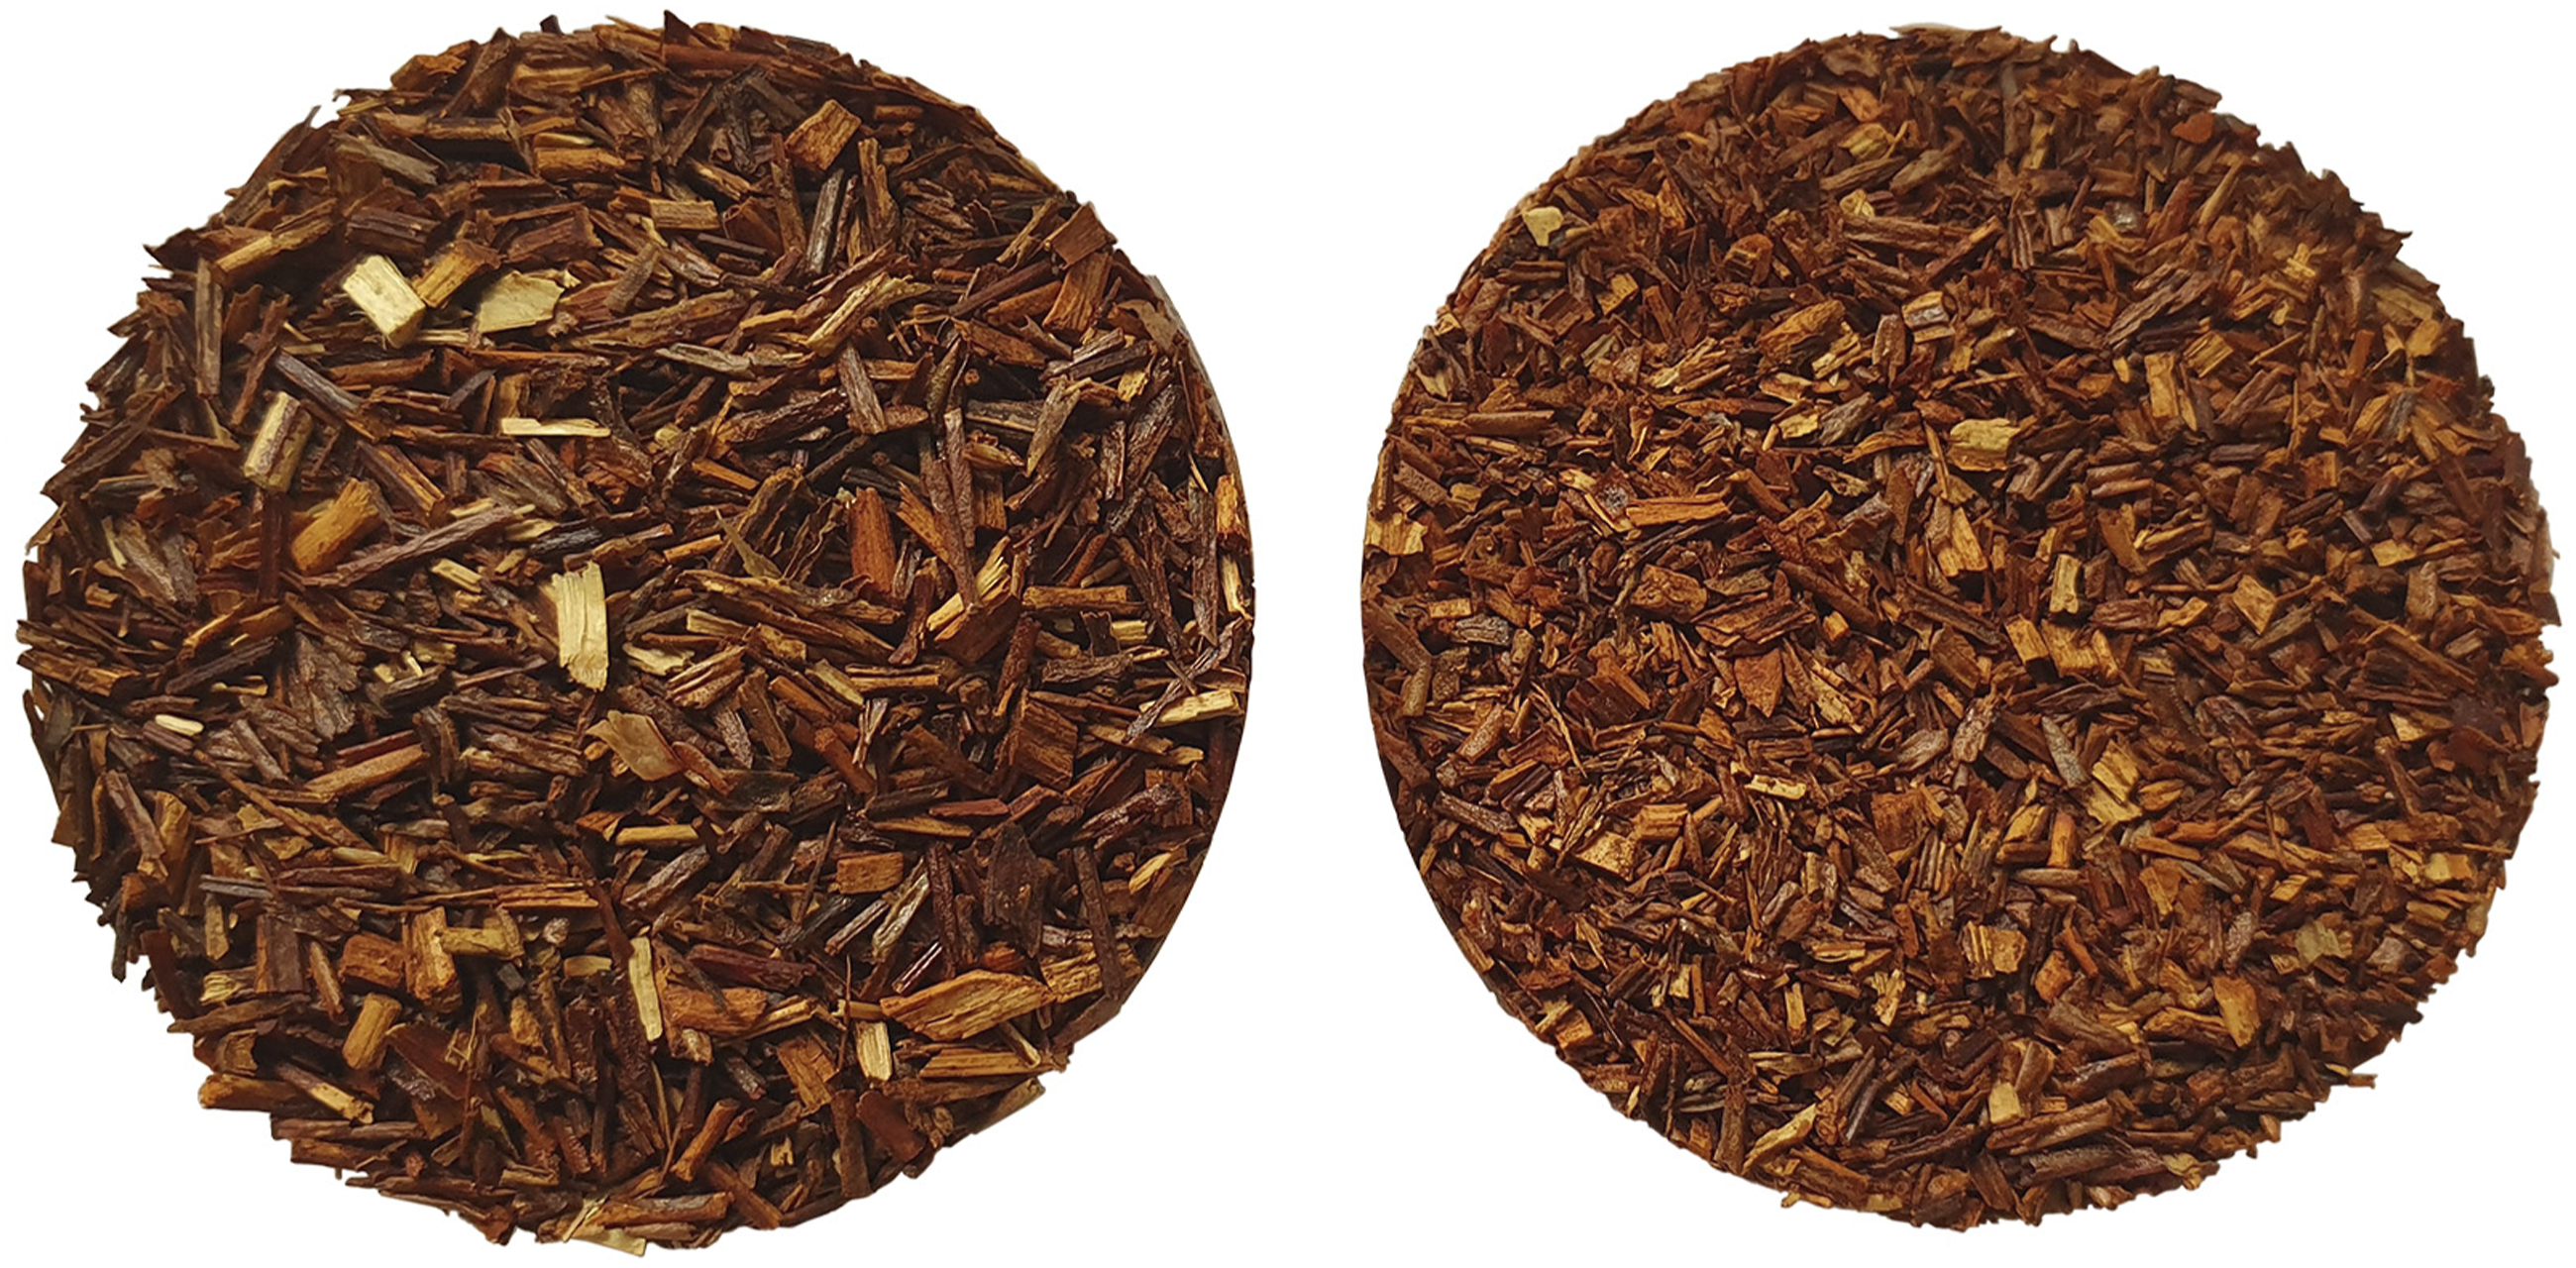
The aim of the study was therefore to investigate the potential of NIR-HSI, combined with suitable multivariate data analytical tools, to produce classification models which can differentiate between two production areas (Western and Northern Cape). For the development of a classification model which can discriminate between rooibos production batches of different quality grades (A, B, C and D), samples from the Western Cape production area was used.
Materials and methods
Plant material
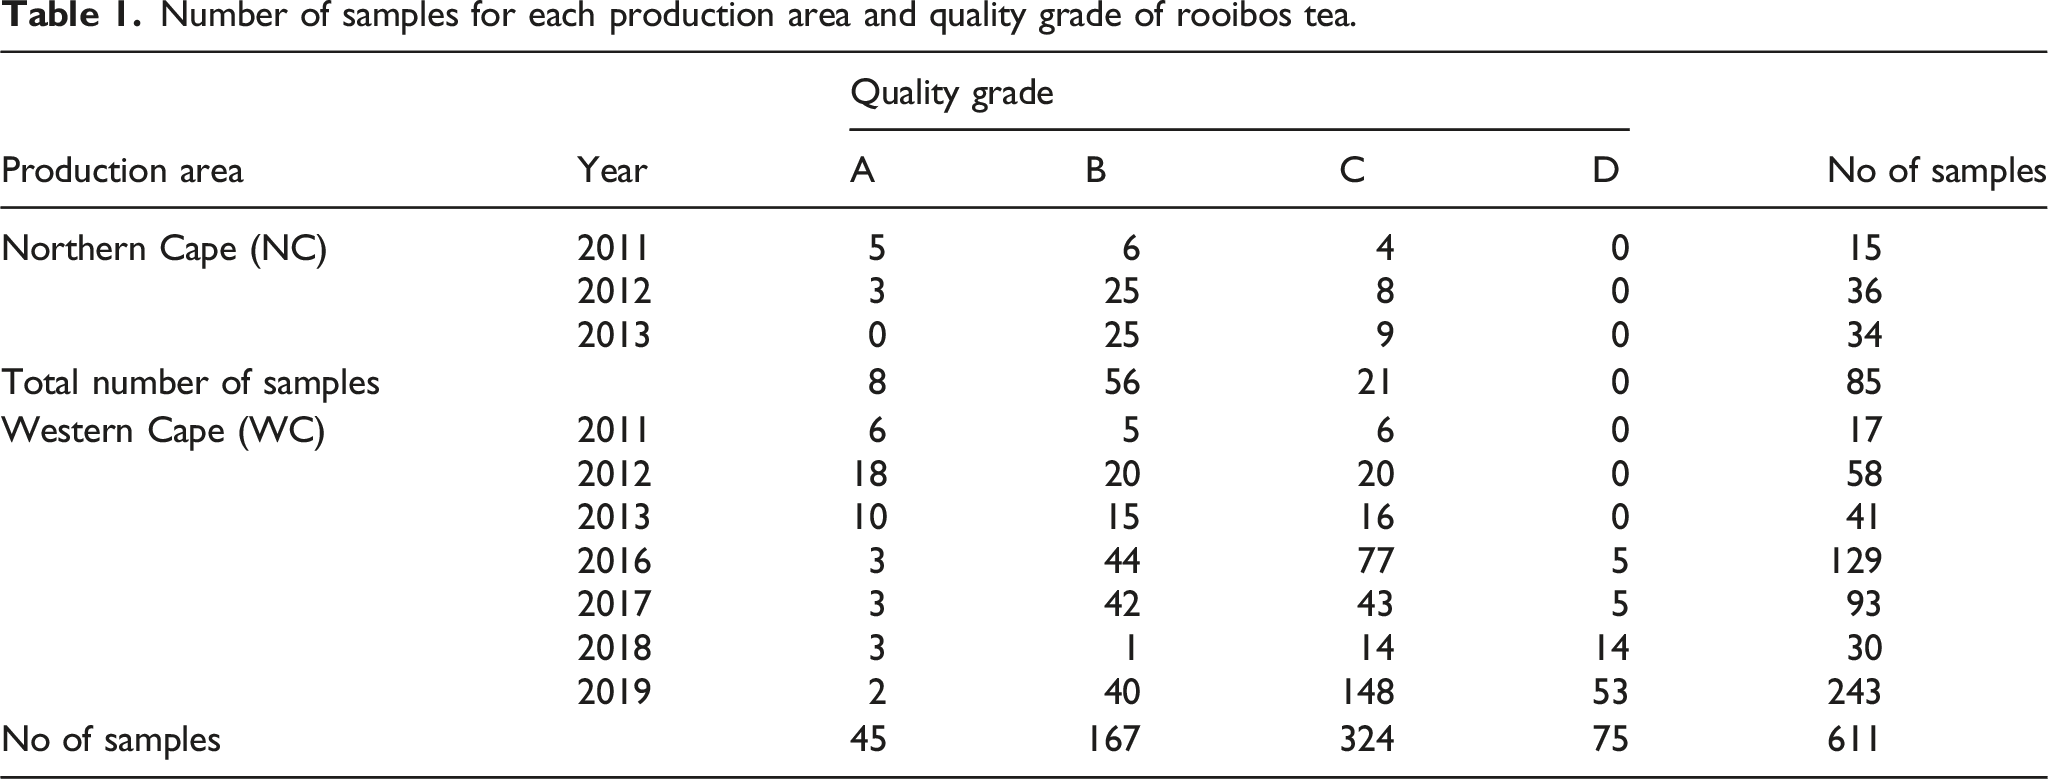
Number of samples for each production area and quality grade of rooibos tea.
NIR-HSI
A summary of the procedures followed to capture the hyperspectral images and process the data, was summarized in Figure 2. Images were acquired, using a pushbroom HySpex short wave infrared (SWIR) camera (Norsk Elektro Optikk, Norway) equipped with Breeze software version 2018.17.0 (Prediktera AB, Umeå, Sweden). The light source was two halogen lamps producing irradiation in the 400 – 2500 nm spectral range. They were positioned 30 cm above the translations stage. Spectra were captured from 950 – 2500 nm, using a 30 cm lens (field of view: 95 mm, spatial resolution 247 µm). Samples were imaged one at a time by placing the samples on a conveyer belt. The movement speed was set to 0.25 cm/s with image acquisition at a frame rate of 100 Hz and an exposure time of 3.0 ms. The spectral intervals were 5.45 nm and each line in the image consisted of 384 pixels x 288 wavebands. Outline of the procedure followed to capture hyperspectral images using a short wave infrared camera and methodology to develop models to predict the production area and quality grade of rooibos tea.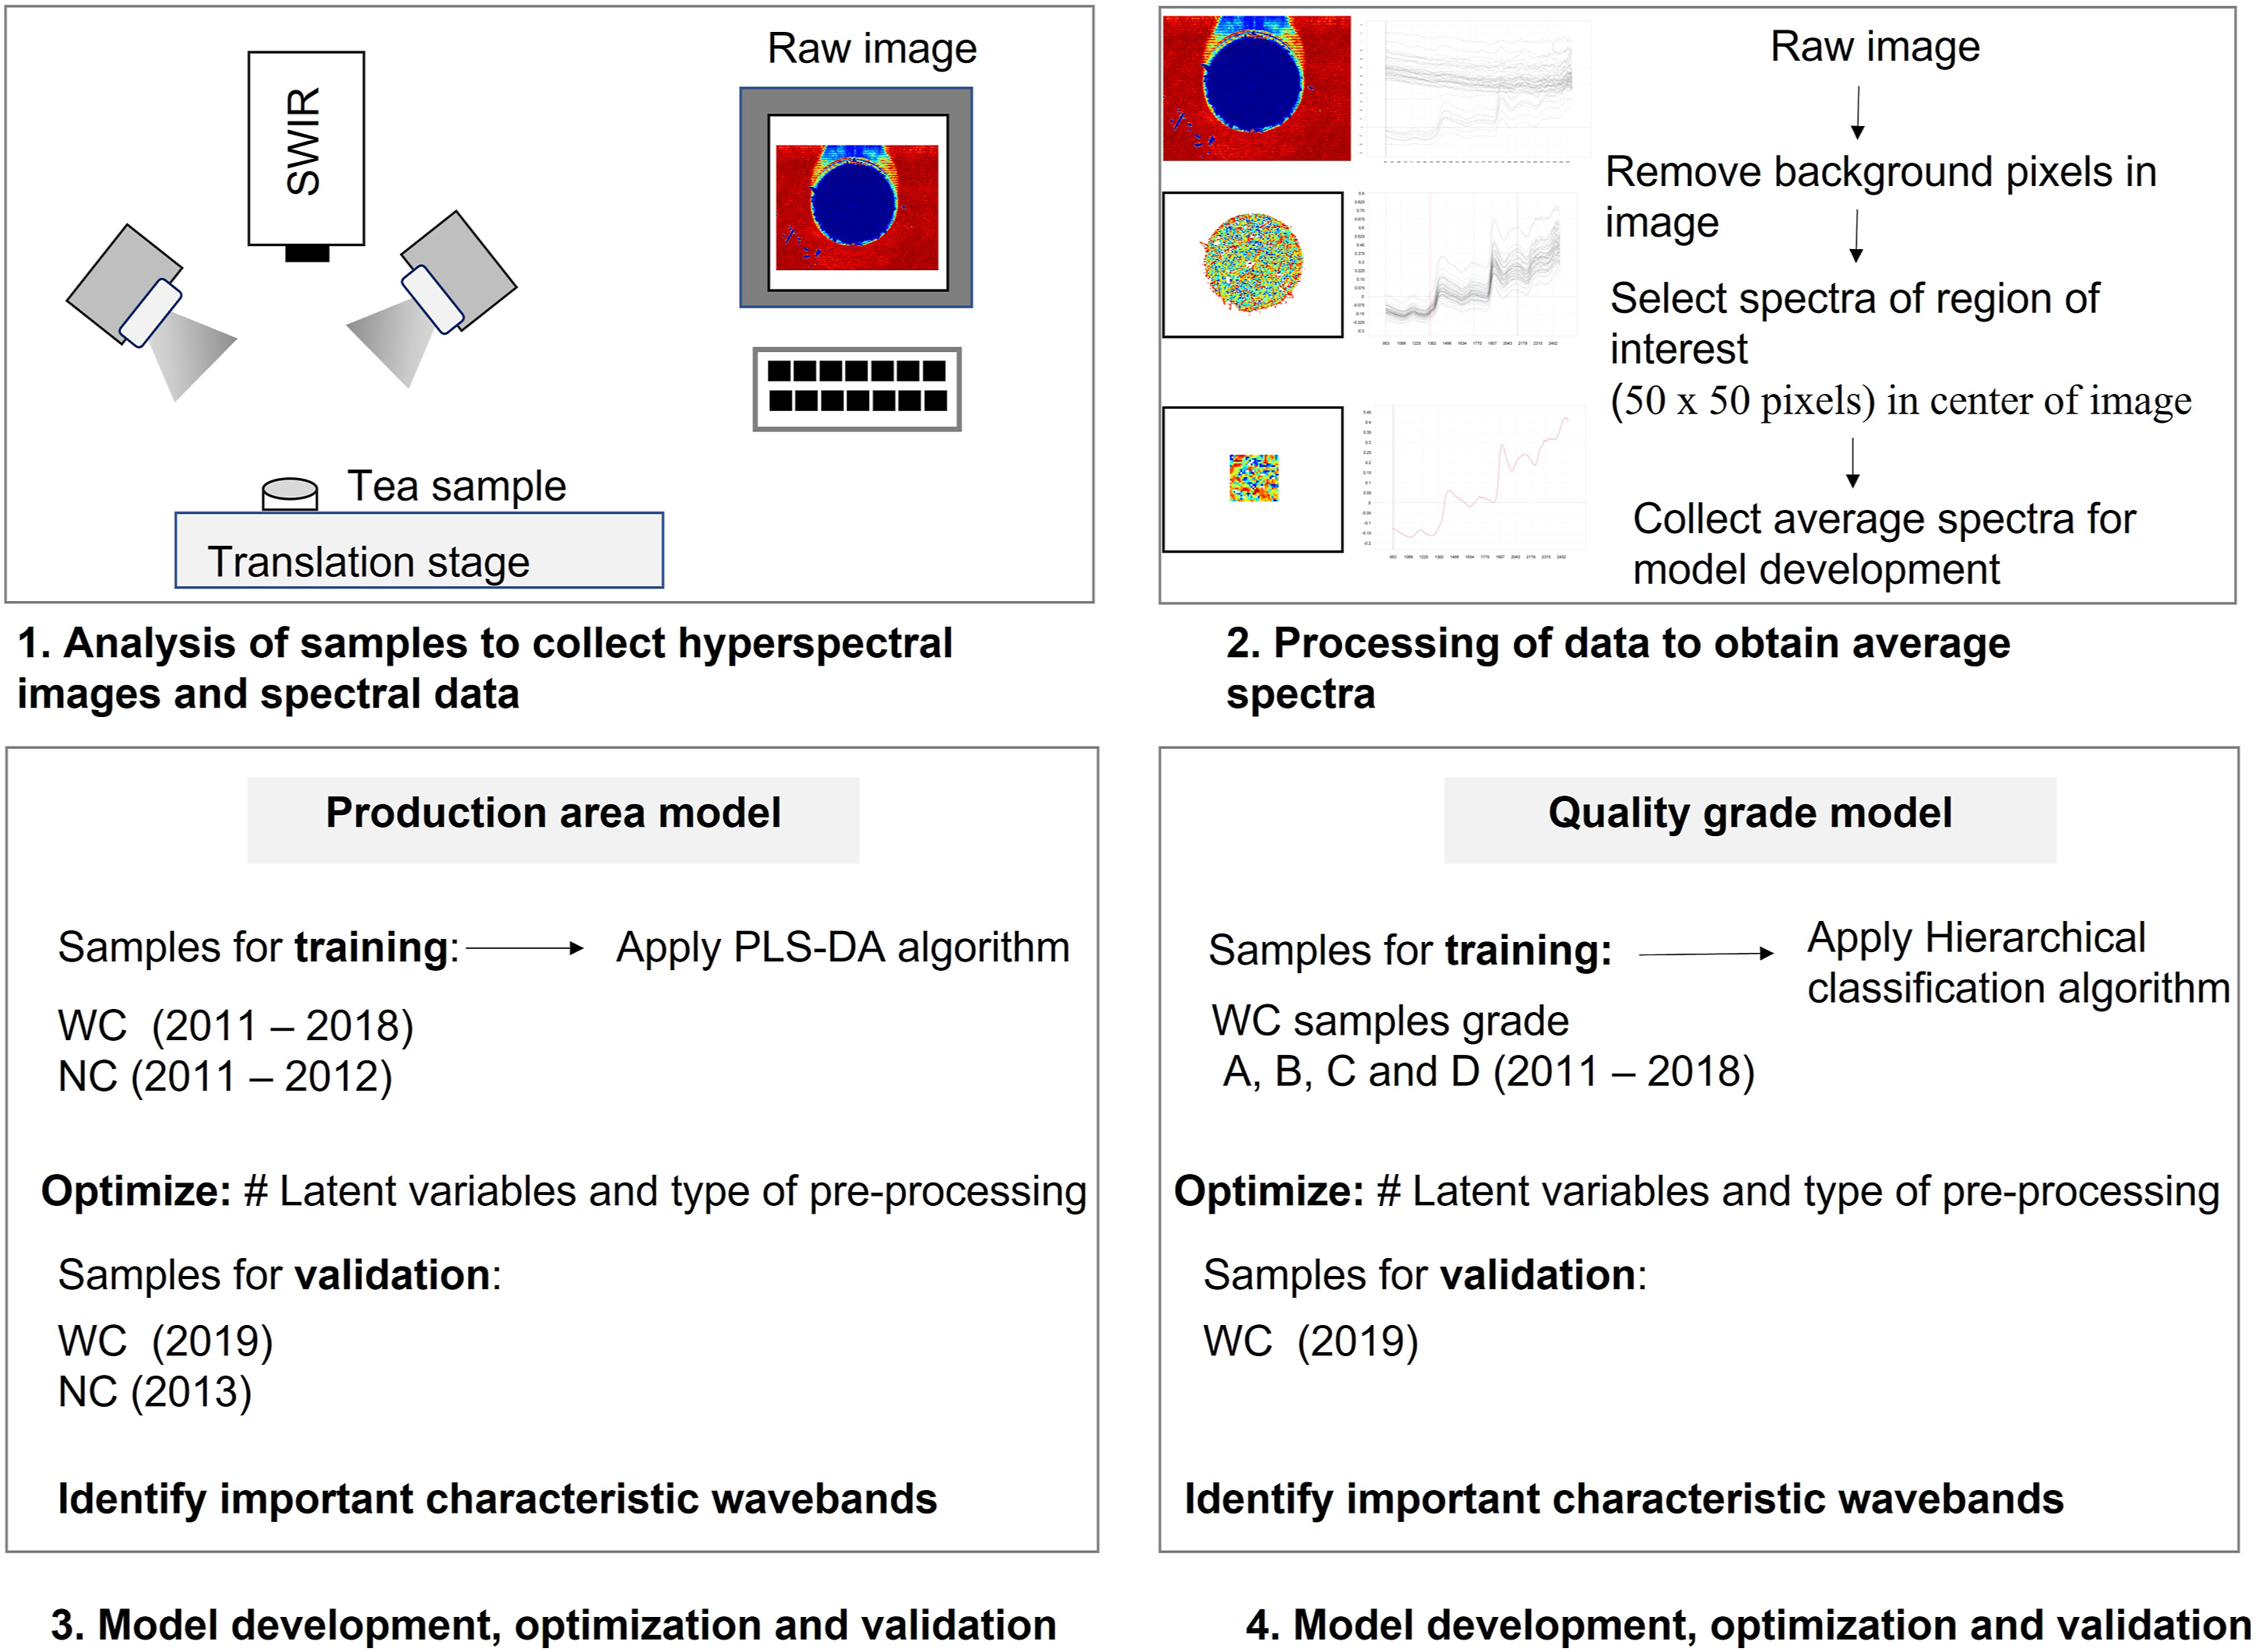
For image acquisition, each sample was transferred to a plastic container (4 cm diameter; 1 cm depth) and the surface levelled. The samples were imaged in a random order. A dark (0%) reference was collected by closing the lens aperture and a 50% grey reflectance target (Sphere Optics, Germany) was imaged to calibrate the data and to correct for variation in sample illumination. Raw images were corrected using the white and dark reference and converted to pseudo-absorbance using EvinceTM (version 2.7.0, Prediktera AB, Umeå, Sweden) software. As indicated in Figure 2, the next step was to process the images to remove the background pixels and only the pixels from a smaller region of interest (50 × 50 pixels equivalent to 11 × 11 mm) at the center of the sample image was selected to exclude shadows at the edges of the sample.
Data analysis
Average spectra extraction and sample division
Prior to the development of the classification models, the average spectral data for each sample for the spectral range, 950 – 2500 nm, were calculated, using EvinceTM. The data were exported and processed using MATLAB (The Mathworks, Natick, MA; version 2015b).
Pre-processing and model development
Samples were divided into a test and training set prior to model development. The test and training set for prediction of production area was selected so that samples from the final year of collection (2013 for NC and 2019 for WC) represented the external test set. Samples from the other production years comprised the training set. Only WC samples were used for the development of the prediction model for quality grade. In this case, the samples from 2019 were used to generate the test set, whilst samples from the 2011 – 2018 production years were used to generate the training set. At first, only samples from the training set were used to carry out a model selection stage. This involved optimising the spectral pre-processing method and number of latent variables (LVs). Spectral pre-treatments included standard normal variate (SNV) 23 and second derivatives (calculated according to the method of Savitzky and Golay, 1964). 24 Each pretreatment was followed by mean centering prior to analysis. The optimal combination of pre-processing and model complexity was selected as the one leading to the lowest classification error in a 10-fold cross-validation procedure. Next, the test set was evaluated using these model conditions to determine how well the model predicted the classes of the external data set.
Feature waveband selection
Interpretation of the model in terms of the spectral bands which contribute most to the observed differentiation can be carried out by inspecting the values of the variable importance in projection (VIP) scores. 25 VIP scores are used as an indication of how much the individual variables contribute to the partial least squares discriminant analysis (PLS-DA) model. They are normalised in a manner that a ‘greater than one’ criterion can be applied to assess the relevance of the predictors for a model. Moreover, the Covariance Selection (CovSel) algorithm 26 was applied for further validation of the wavebands identified as significant and for selection of the minimum number of non-redundant wavelengths that would provide reliable classification. CovSel is a parsimonious variable selection algorithm which is based on identifying the predictors having maximum covariance with the response. Parsimony and non-redundancy are achieved by orthogonalising the candidate predictors with respect to the ones already selected prior to proceeding with any successive iteration. Further details can be found in the original paper. 26
Results and discussion
The need to discriminate between rooibos production batches, originating from Western Cape and Northern Cape, has been motivated by the possibility to promote rooibos as an origin-based product for niche markets. Descriptive sensory analysis of a large sample set, however, did not show clear differences between rooibos originating from the two production areas. Similarly, the composition of the infusions in terms of the content of the major flavonoids, ferulic acid and phenylpyruvic acid glucoside offered limited discrimination between the production areas. Application of NIR-HSI to rooibos would collect a wider range of chemical information related to molecular bonds (e.g., O-H, N-H, C-H) for both non-volatile and volatile compounds which may reflect differences between samples and allow discrimination based on production area and quality.
From the raw spectra for both the geographical origin and the grade it is clear that the spectral behaviour of the tea samples was similar. Based on the average spectra for the geographical origin, there is limited difference between the spectra of the two areas compared to the spectra for the tea grades where more prominent differences in the region 1400 – 2500 nm are clearly visible (Figure 3). Raw average spectra of (a) tea collected from two production areas (Western and Northern Cape) and (b) tea from different quality grades (A-D).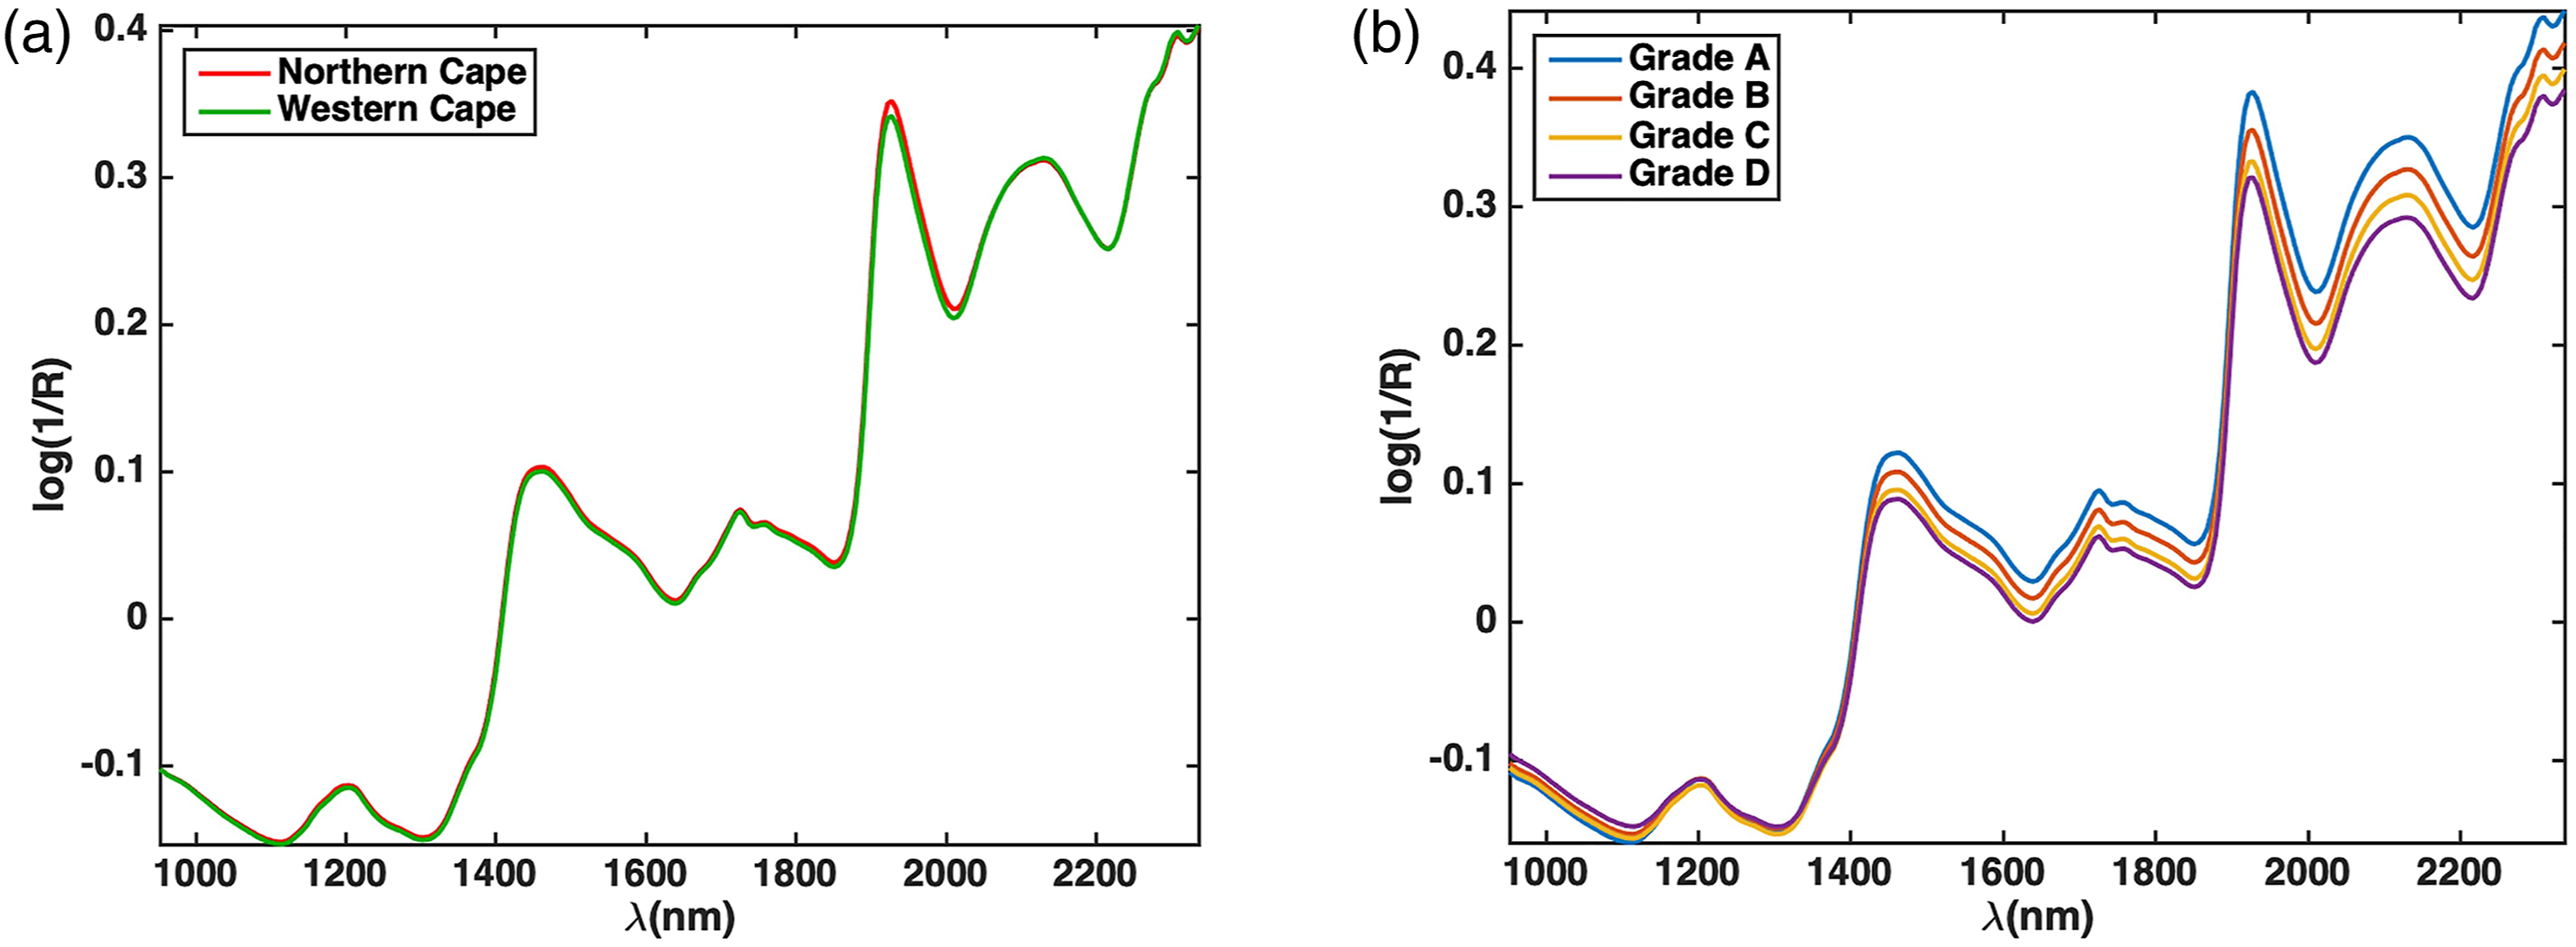
Classification of production area of rooibos
Altitude is known to affect composition of agricultural products, including teas. Classification of rooibos samples based on production area was therefore first attempted as production of rooibos in the Western Cape generally takes place at a lower altitude than in the Northern Cape. A scenario based on climate change models predicts a substantial contraction in the suitable area where rooibos can be cultivated in the future. The suitable area is predicted to shift southeastwards and upslope. 27
For development of a classification model to predict the production area of rooibos samples, the mean spectra from each sample were collected in a matrix with dimensions 696 (number of samples) x 255 (number of wavelengths). In order to validate the chemometric models using a completely external test set, the data set was split into a training and a test set as described, prior to any classification analysis. The data sets were generated in such a way to demonstrate as closely as possible the application of the models for predicting new samples. All the grades were represented in both data sets. The training set consisted of 419 samples (51 from NC and 368 from WC), while the remaining 277 samples (34 from NC and 243 from WC) constituted the test set.
Results for the PLS-DA model for the authentication of the production area of rooibos tea samples. The model was developed using 10-fold cross validation and application of second derivative (19 points window and third order polynomial) pre-processing.
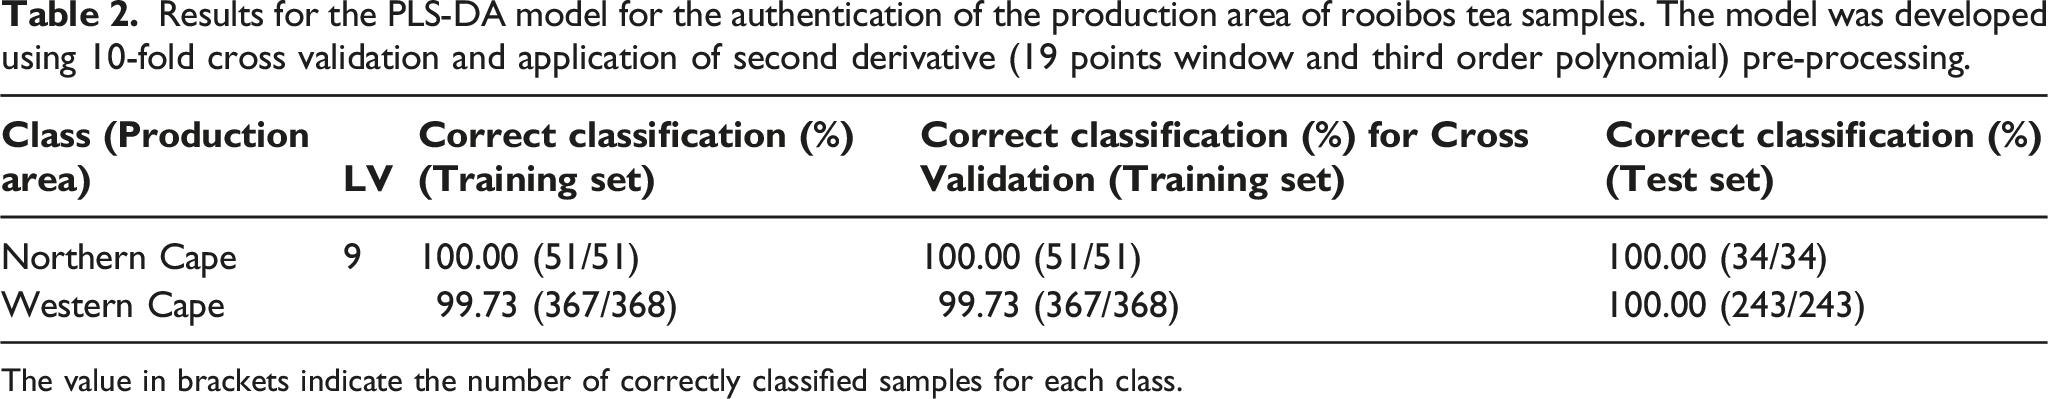
The value in brackets indicate the number of correctly classified samples for each class.
The excellent discrimination between the two categories is also evident from Figure 4, where the values of the predicted Y (the response variable on which the classification is based) are plotted for both the training and the test samples, together with the classification threshold. Here, the classification threshold was calculated by applying linear discriminant analysis (LDA) on the predicted Y values28,29 and corresponds to the value of the predicted response for which the probability of a sample being from Western Cape is equal to that of a sample belonging to the Northern Cape. Classification accuracy of the optimal PLS-DA model for authenticating the production areas of rooibos tea samples. Results for the predicted Y values vs the sample index for both the training (upper panel) and test (lower panel) sets are shown; legend: circles – Northern Cape; diamonds – Western Cape. The dashed line indicates the classification threshold between the two categories.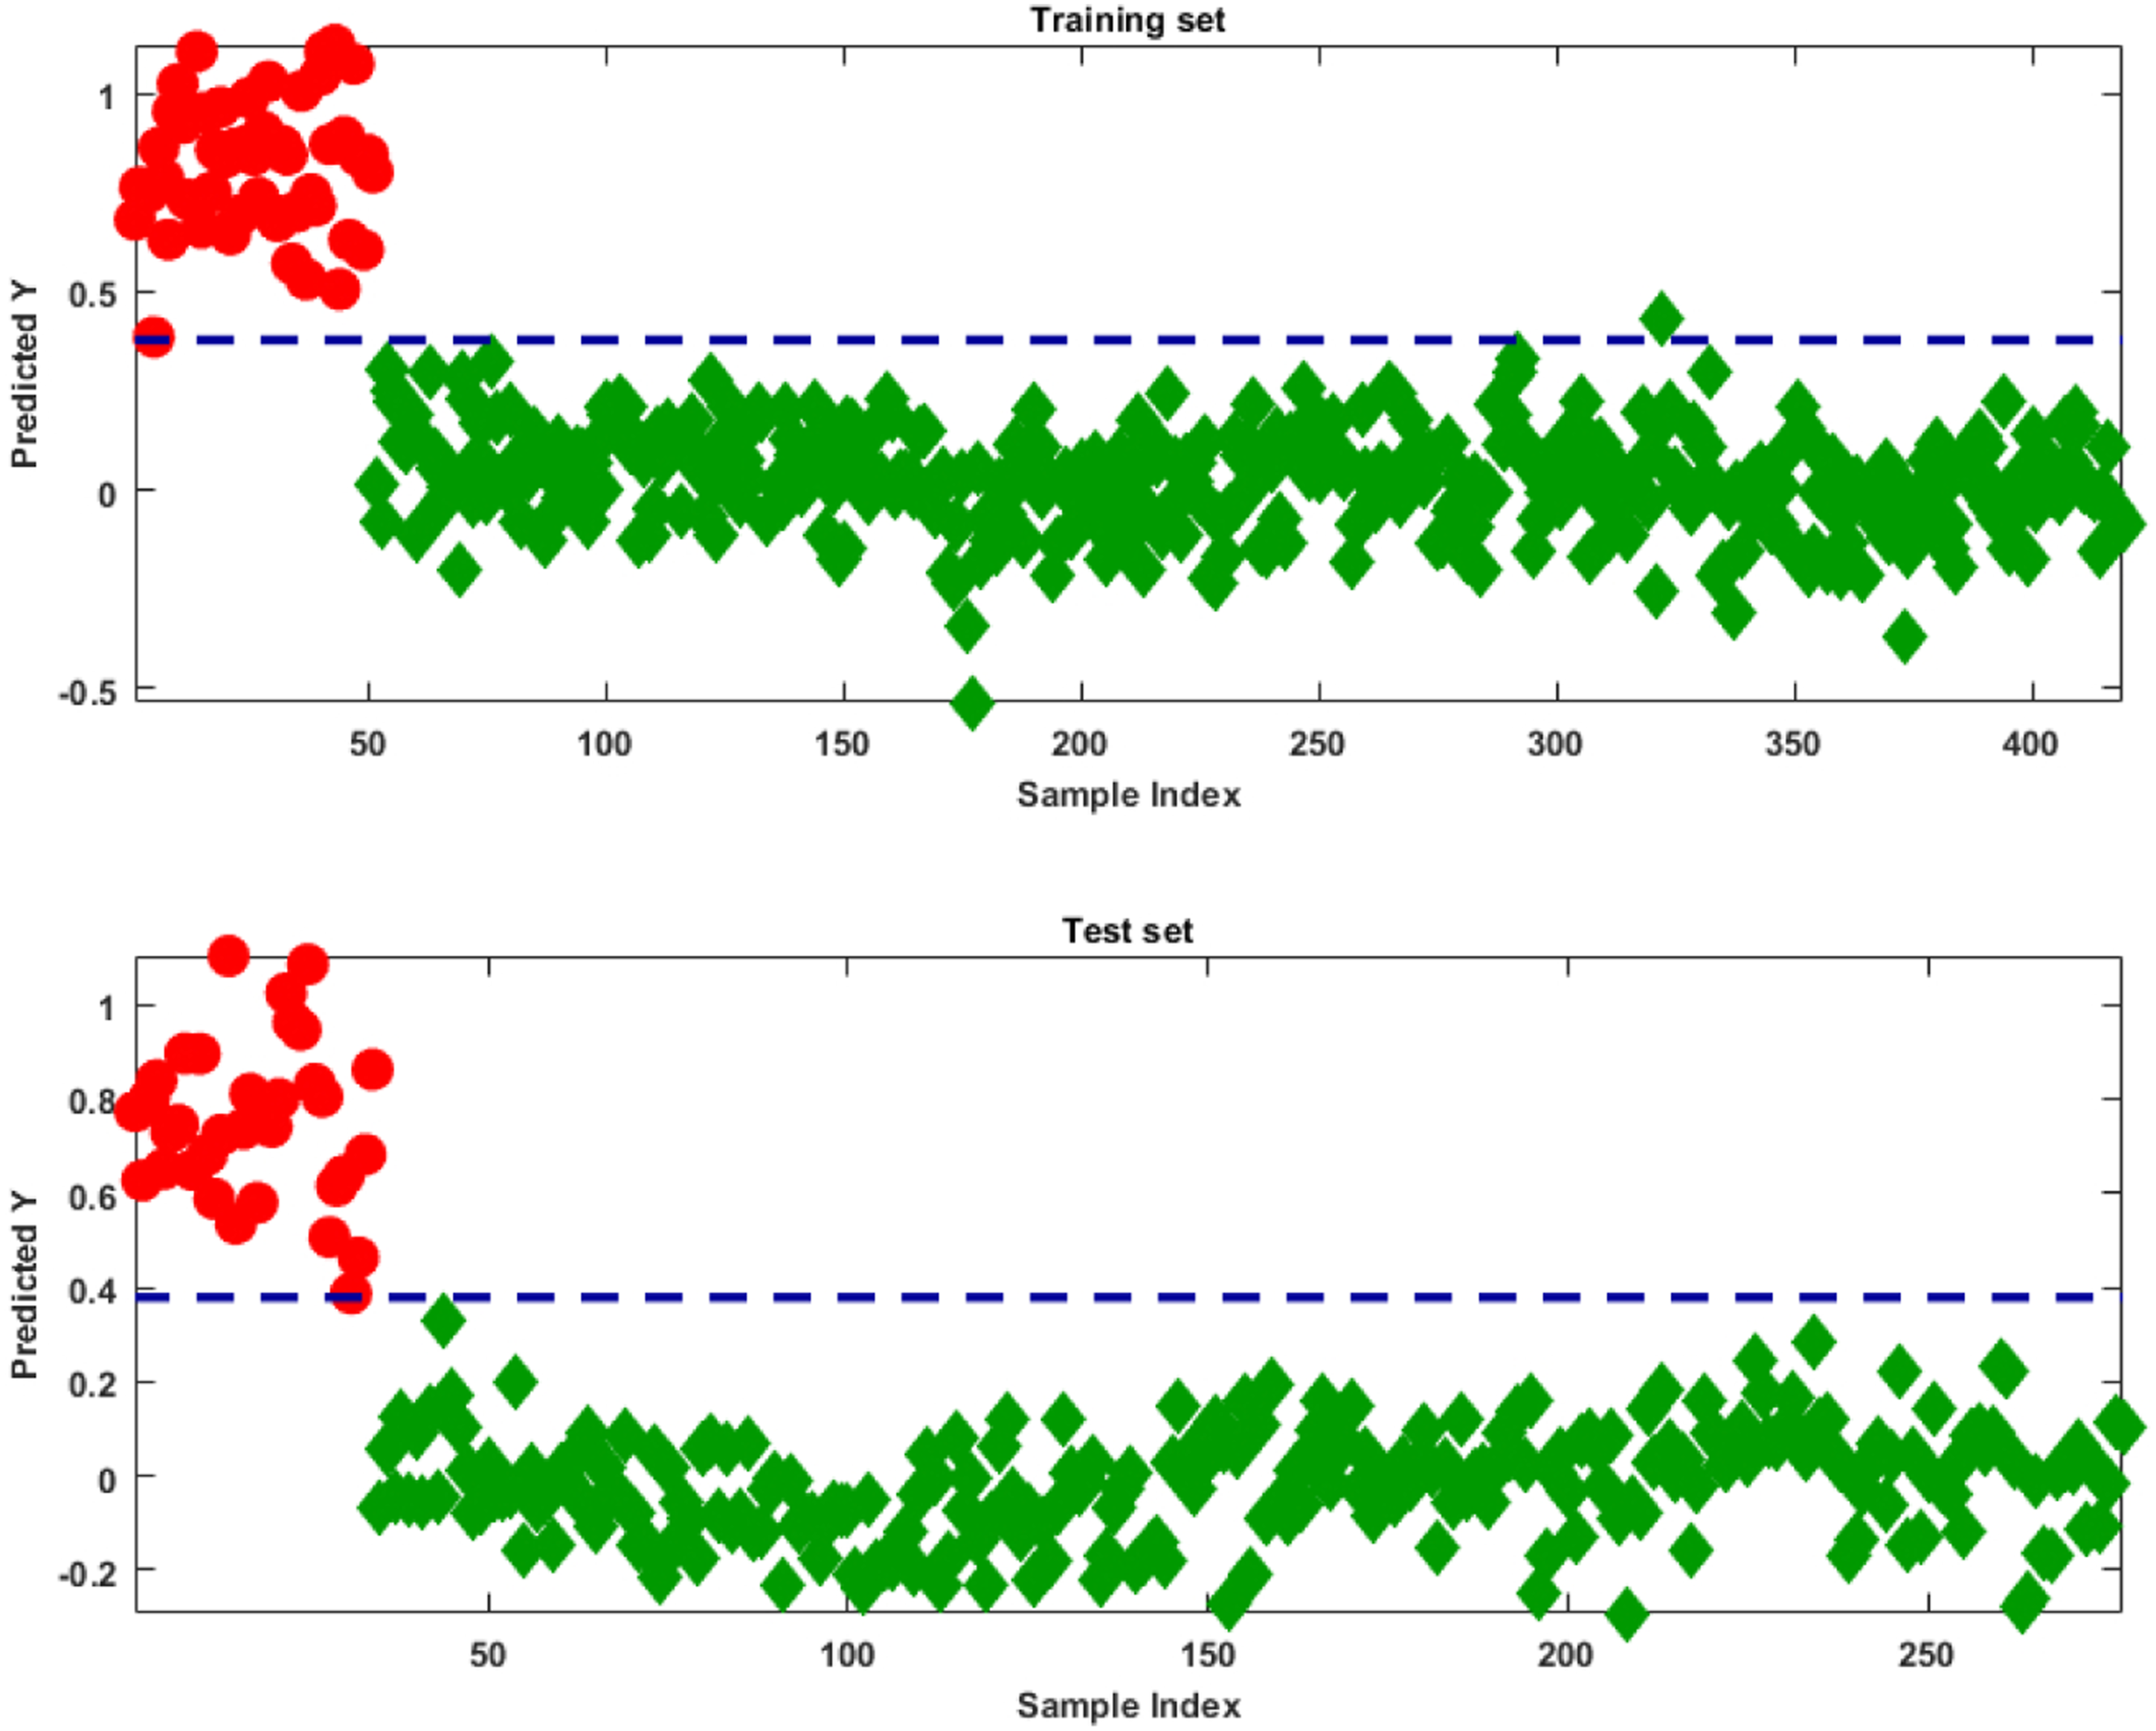
By inspecting the values of the VIP scores (Figure 5), the spectral bands which contribute most to the observed differentiation between the two regions can be identified. From Figure 5(a), it is apparent that the spectral regions, which contribute most significantly to the PLS-DA model and, as a consequence, which may carry discriminant information to differentiate rooibos samples according to their production area, are: 1389–1405 nm (combination of the first overtone of C-H stretching and -CH2 deformation), 1700–1732 nm (first overtone of C-H stretching), 1923–2005 nm (combination between O-H stretching and O-H or C-H deformation/bending), 2048–2070 nm (combination between O-H and C-O stretching), 2228–2261 nm (combination between arylic C-C and C-H stretching), 2288–2337 nm (C-H stretching and CH2 deformation combination). VIP plots illustrating the relevant spectral regions, which contribute most to the PLS-DA model for the authentication of production areas of rooibos tea. (a) Spectral regions marked with bars were identified using VIP analysis as contributing most to the PLS-DA model; (b) the 12 spectral variables identified as optimal by the CovSel-LDA algorithm to differentiate between the production areas of the rooibos samples.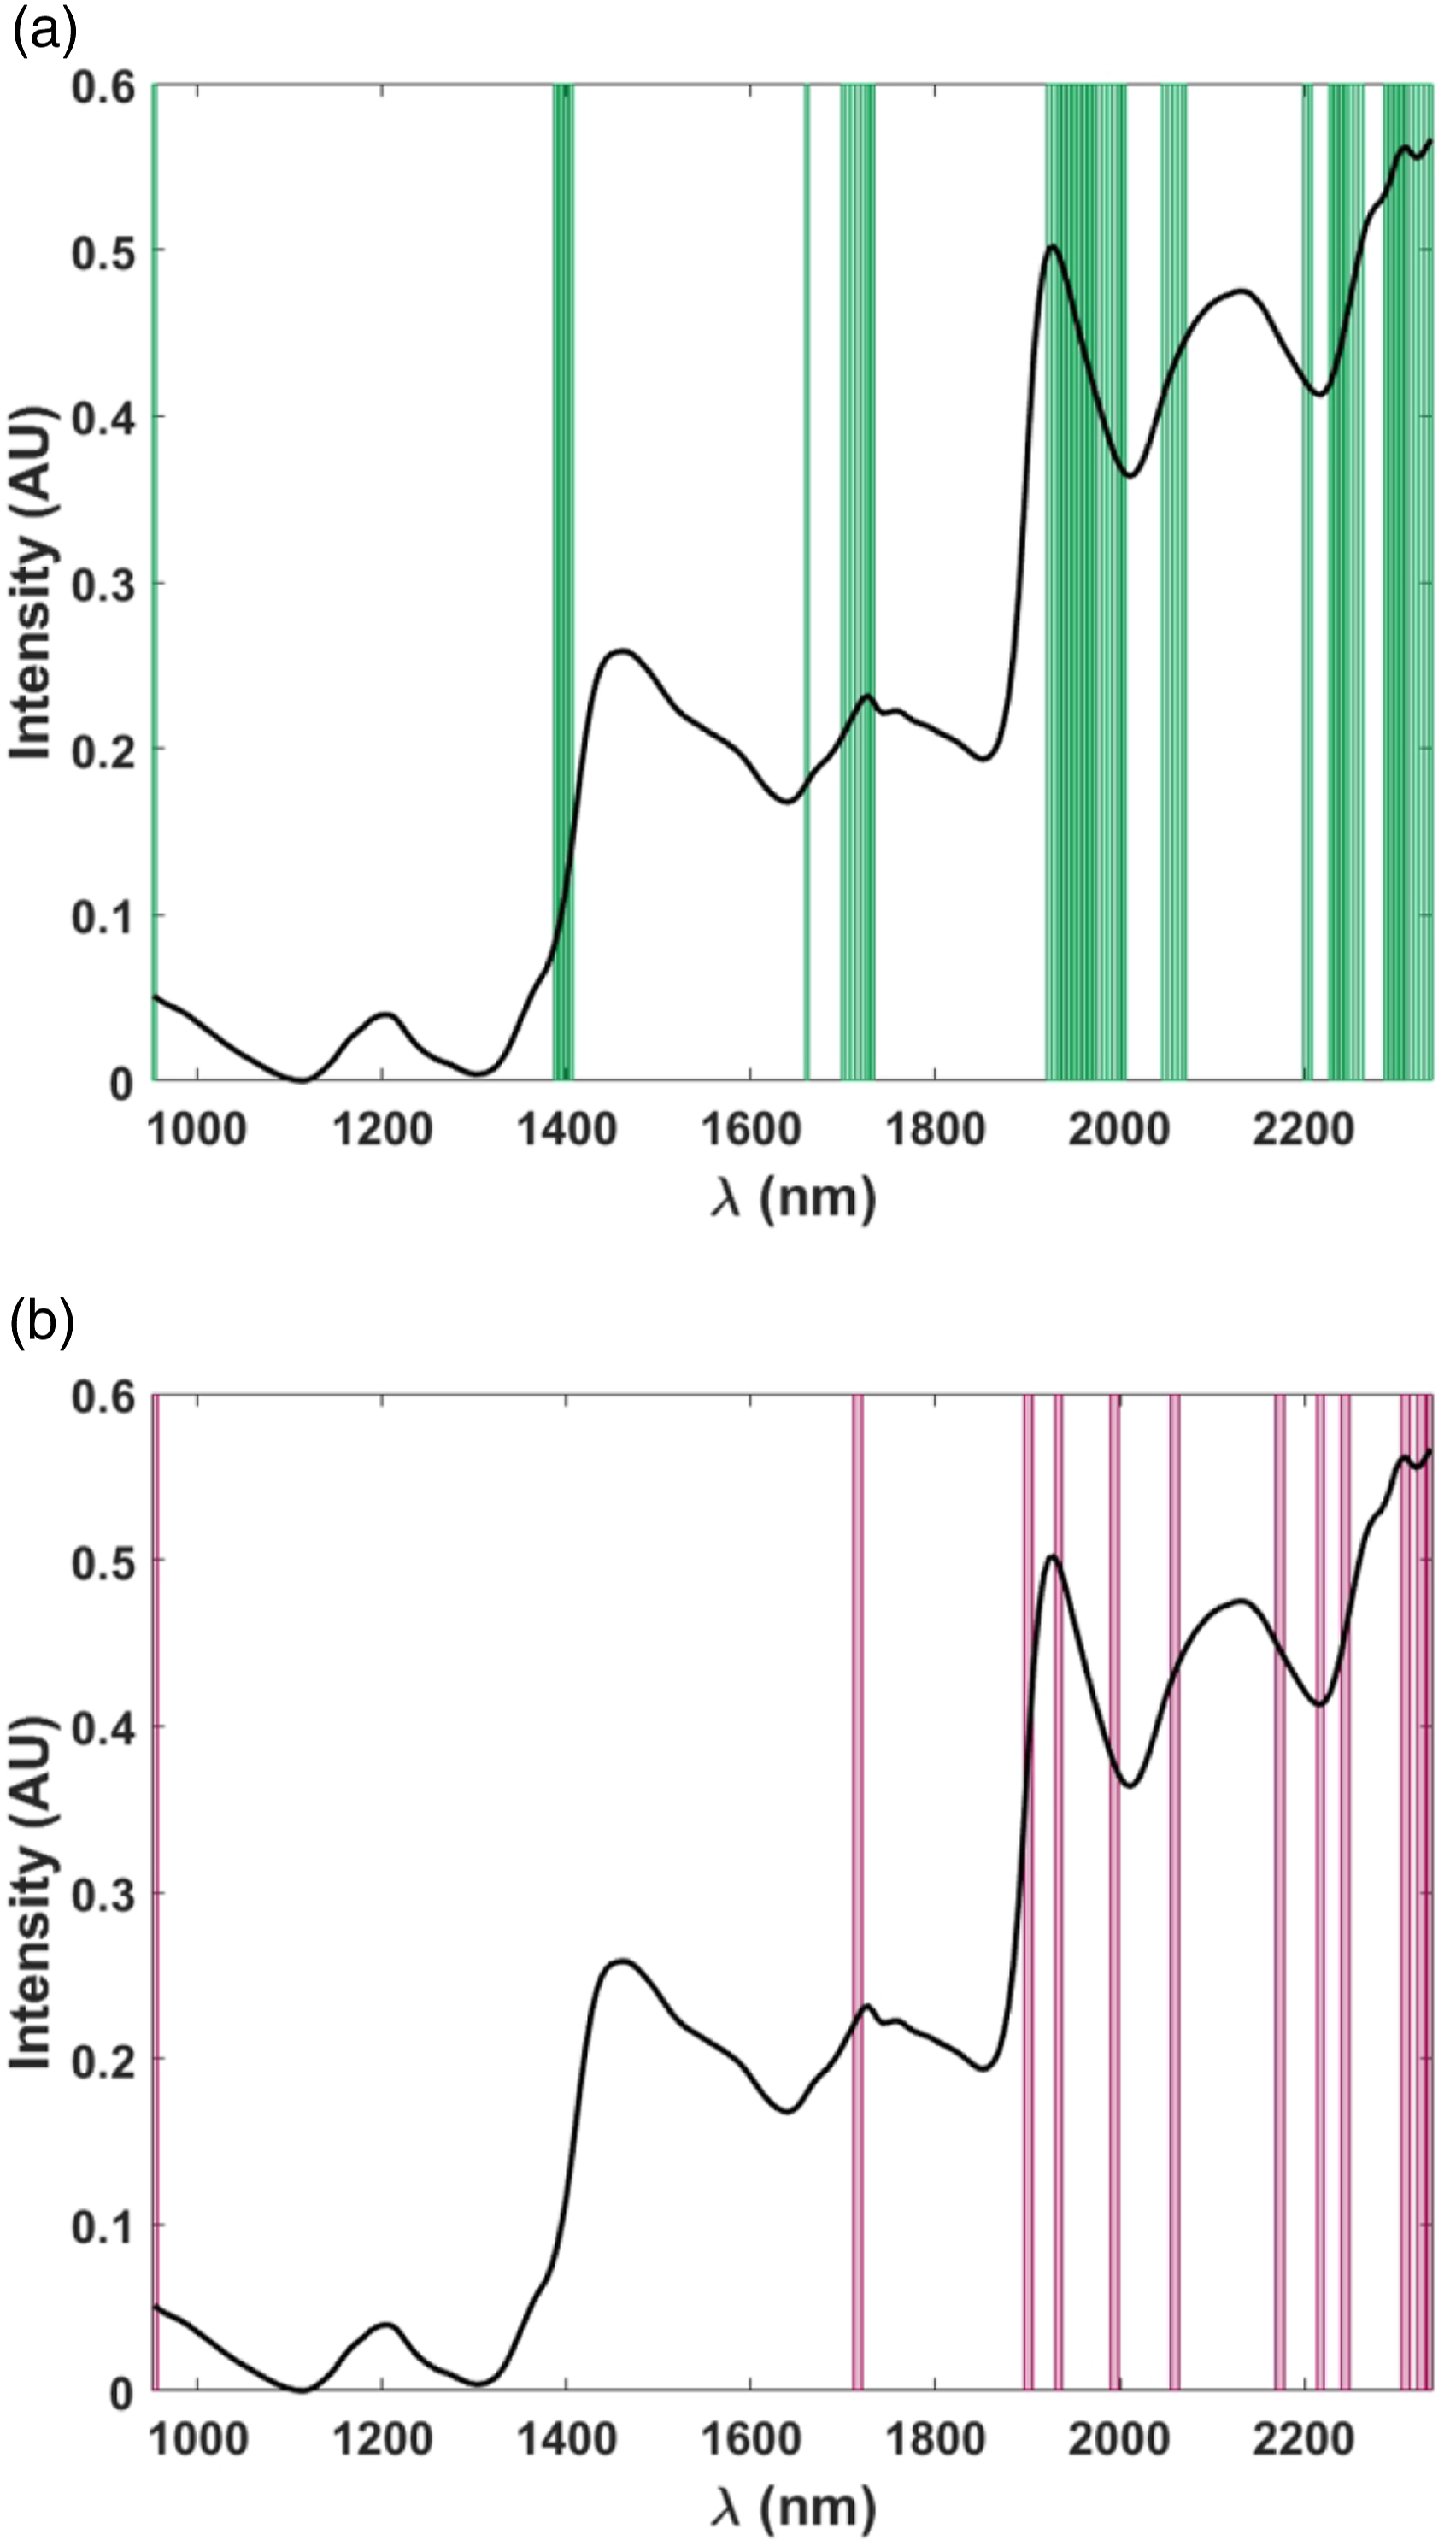
A variable selection approach, based on the coupling of the CovSel algorithm and LDA, was also applied to the data. This approach was taken to (i) identify the spectral variables, which were mostly associated with the discriminant information, and (ii) to determine whether only a reduced subset of wavelengths could be used for classification. This would be required to facilitate the real-world application of the method (e.g., by means of generating more affordable fast filter instruments for specific applications). The optimal number of experimental variables to be retained in the final predictive model was optimised on the training set (pretreated as already described, i.e., by second derivative followed by mean centering) resulting in the lowest classification error in a 10-fold cross-validation procedure. It appeared that a model including 12 variables (Figure 5(b)) was able to correctly classify all the training samples both in calibration and cross-validation. When applied to the samples of the external test set, the model also allowed the correct classification of all the validation samples. These results are very promising as they indicate that perfect classification can be achieved using a very parsimonious model.
By inspecting the plot in Figure 5(b), it is apparent that the variables selected by the CovSel-LDA approach are consistent with those highlighted as relevant by the calculation of VIP scores, thus confirming the robustness of the interpretation. The 12 predictors identified as mostly discriminant are the spectral intensities at: 953 nm, 1716 nm, 1901 nm, 1934 nm, 1994 nm, 2059 nm, 2174 nm, 2217 nm, 2245 nm, 2310 nm, 2326 nm and 2337 nm. Additional work would be required to identify compounds which correspond to these wavebands. Such information could lead to the development of additional models to discriminate between rooibos production batches.
PLS-DA analysis to discriminate samples according to grade
In the second stage of the study, the possibility of differentiating between rooibos tea samples according to their grade was also investigated. For this analysis, attention was focused exclusively on the samples derived from the Western Cape production area.
Analogous to the approach to model the production area of the rooibos samples, the training set was prepared using the large number of WC samples (n = 368) from years 2011–2018 (43 grade A, 127 grade B, 176 grade C, and 22 grade D). The test set comprised the samples collected in 2019 representing the remaining 243 samples (2 grade A, 40 grade B, 148 grade C and 53 grade D). This approach was followed in order to mimic as closely as possible the use of the model for predicting new samples from successive harvesting years.
Due to the uneven distribution of grades across the samples and the degree of subjectivity connected to the grading operation and possible overlap of grade B and C samples, it was decided to adopt a hierarchical strategy. This entailed contructing a model to differentiate grade A (representing the highest quality grade tea) from grades B, C and D (class BCD), and successively, another model to differentiate grade D (representing the lowest quality grade tea) from grades B and C (class BC), and lastly a model to differentiate grade B from C.
Results of PLS-DA modeling for discrimination of Western Cape rooibos samples according to quality grade.
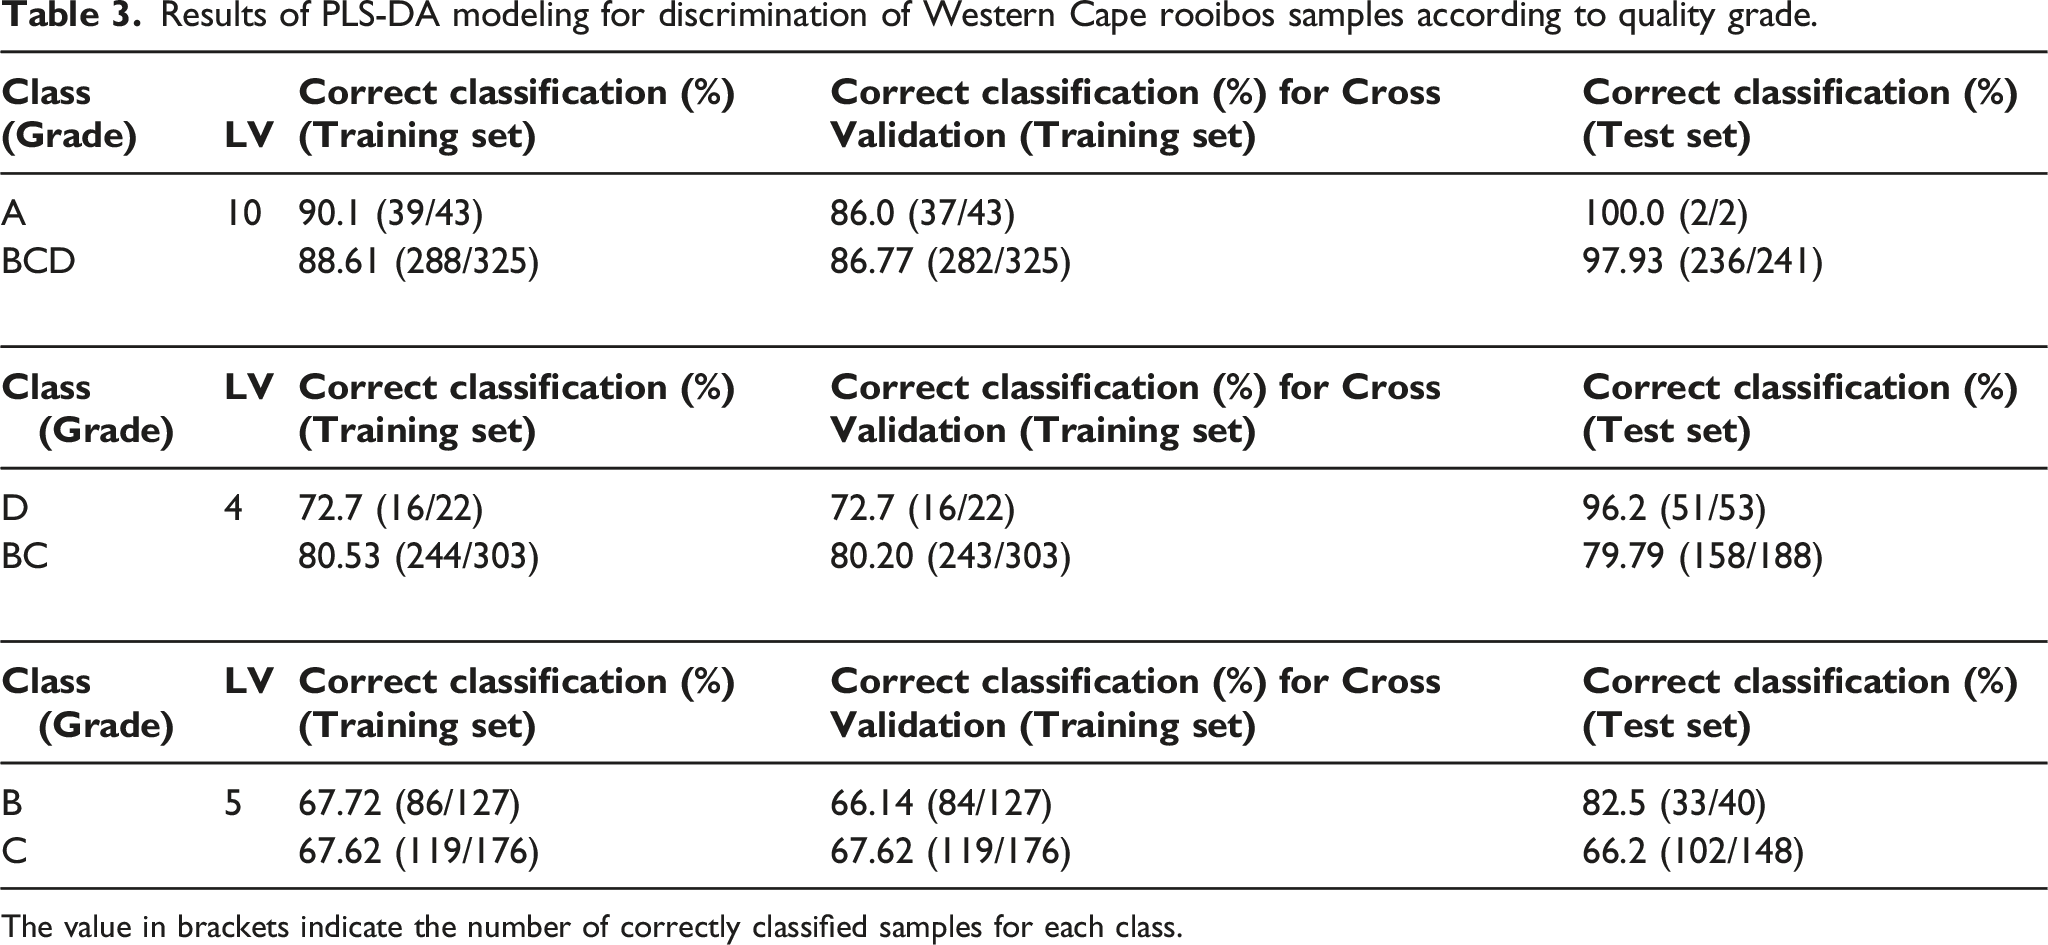
The value in brackets indicate the number of correctly classified samples for each class.
When the first discriminant model (class A vs BCD) was applied to the test samples, all the grade A samples from 2019 were correctly classified. For class BCD, only five out of 241 samples were incorrectly classified. These results demonstrate the accuracy of the model to differentiate samples harvested in a different year than those of the training set.
Inspection of the values of the VIP scores (Figure 6(a)) again enabled identification of spectral regions which contributed most to the model. These spectral regions are 953–964 nm (second overtone of O-H stretching), 1378–1389 nm (combination of the first overtone of C-H stretching and -CH2 deformation), 1422–1465 nm (first overtone of O-H stretching), 1847–1961 nm (combination between O-H stretching and O-H or C-H deformation/bending), 2010–2054 nm/2125–2163 nm (combination between O-H and C-O stretching), 2223–2256 nm (combination between arylic C-C and C-H stretching), and 2315–2338 nm (C-H stretching and CH2 deformation combination). VIP plots illustrating the relevant spectral regions, which contribute most to the PLS-DA models for the authentication of the quality grades of rooibos tea. Spectral regions marked with bars contribute most to the PLS-DA models of (a) grade A vs class BCD; (b) grade D vs class BC; (c) grade B vs grade C.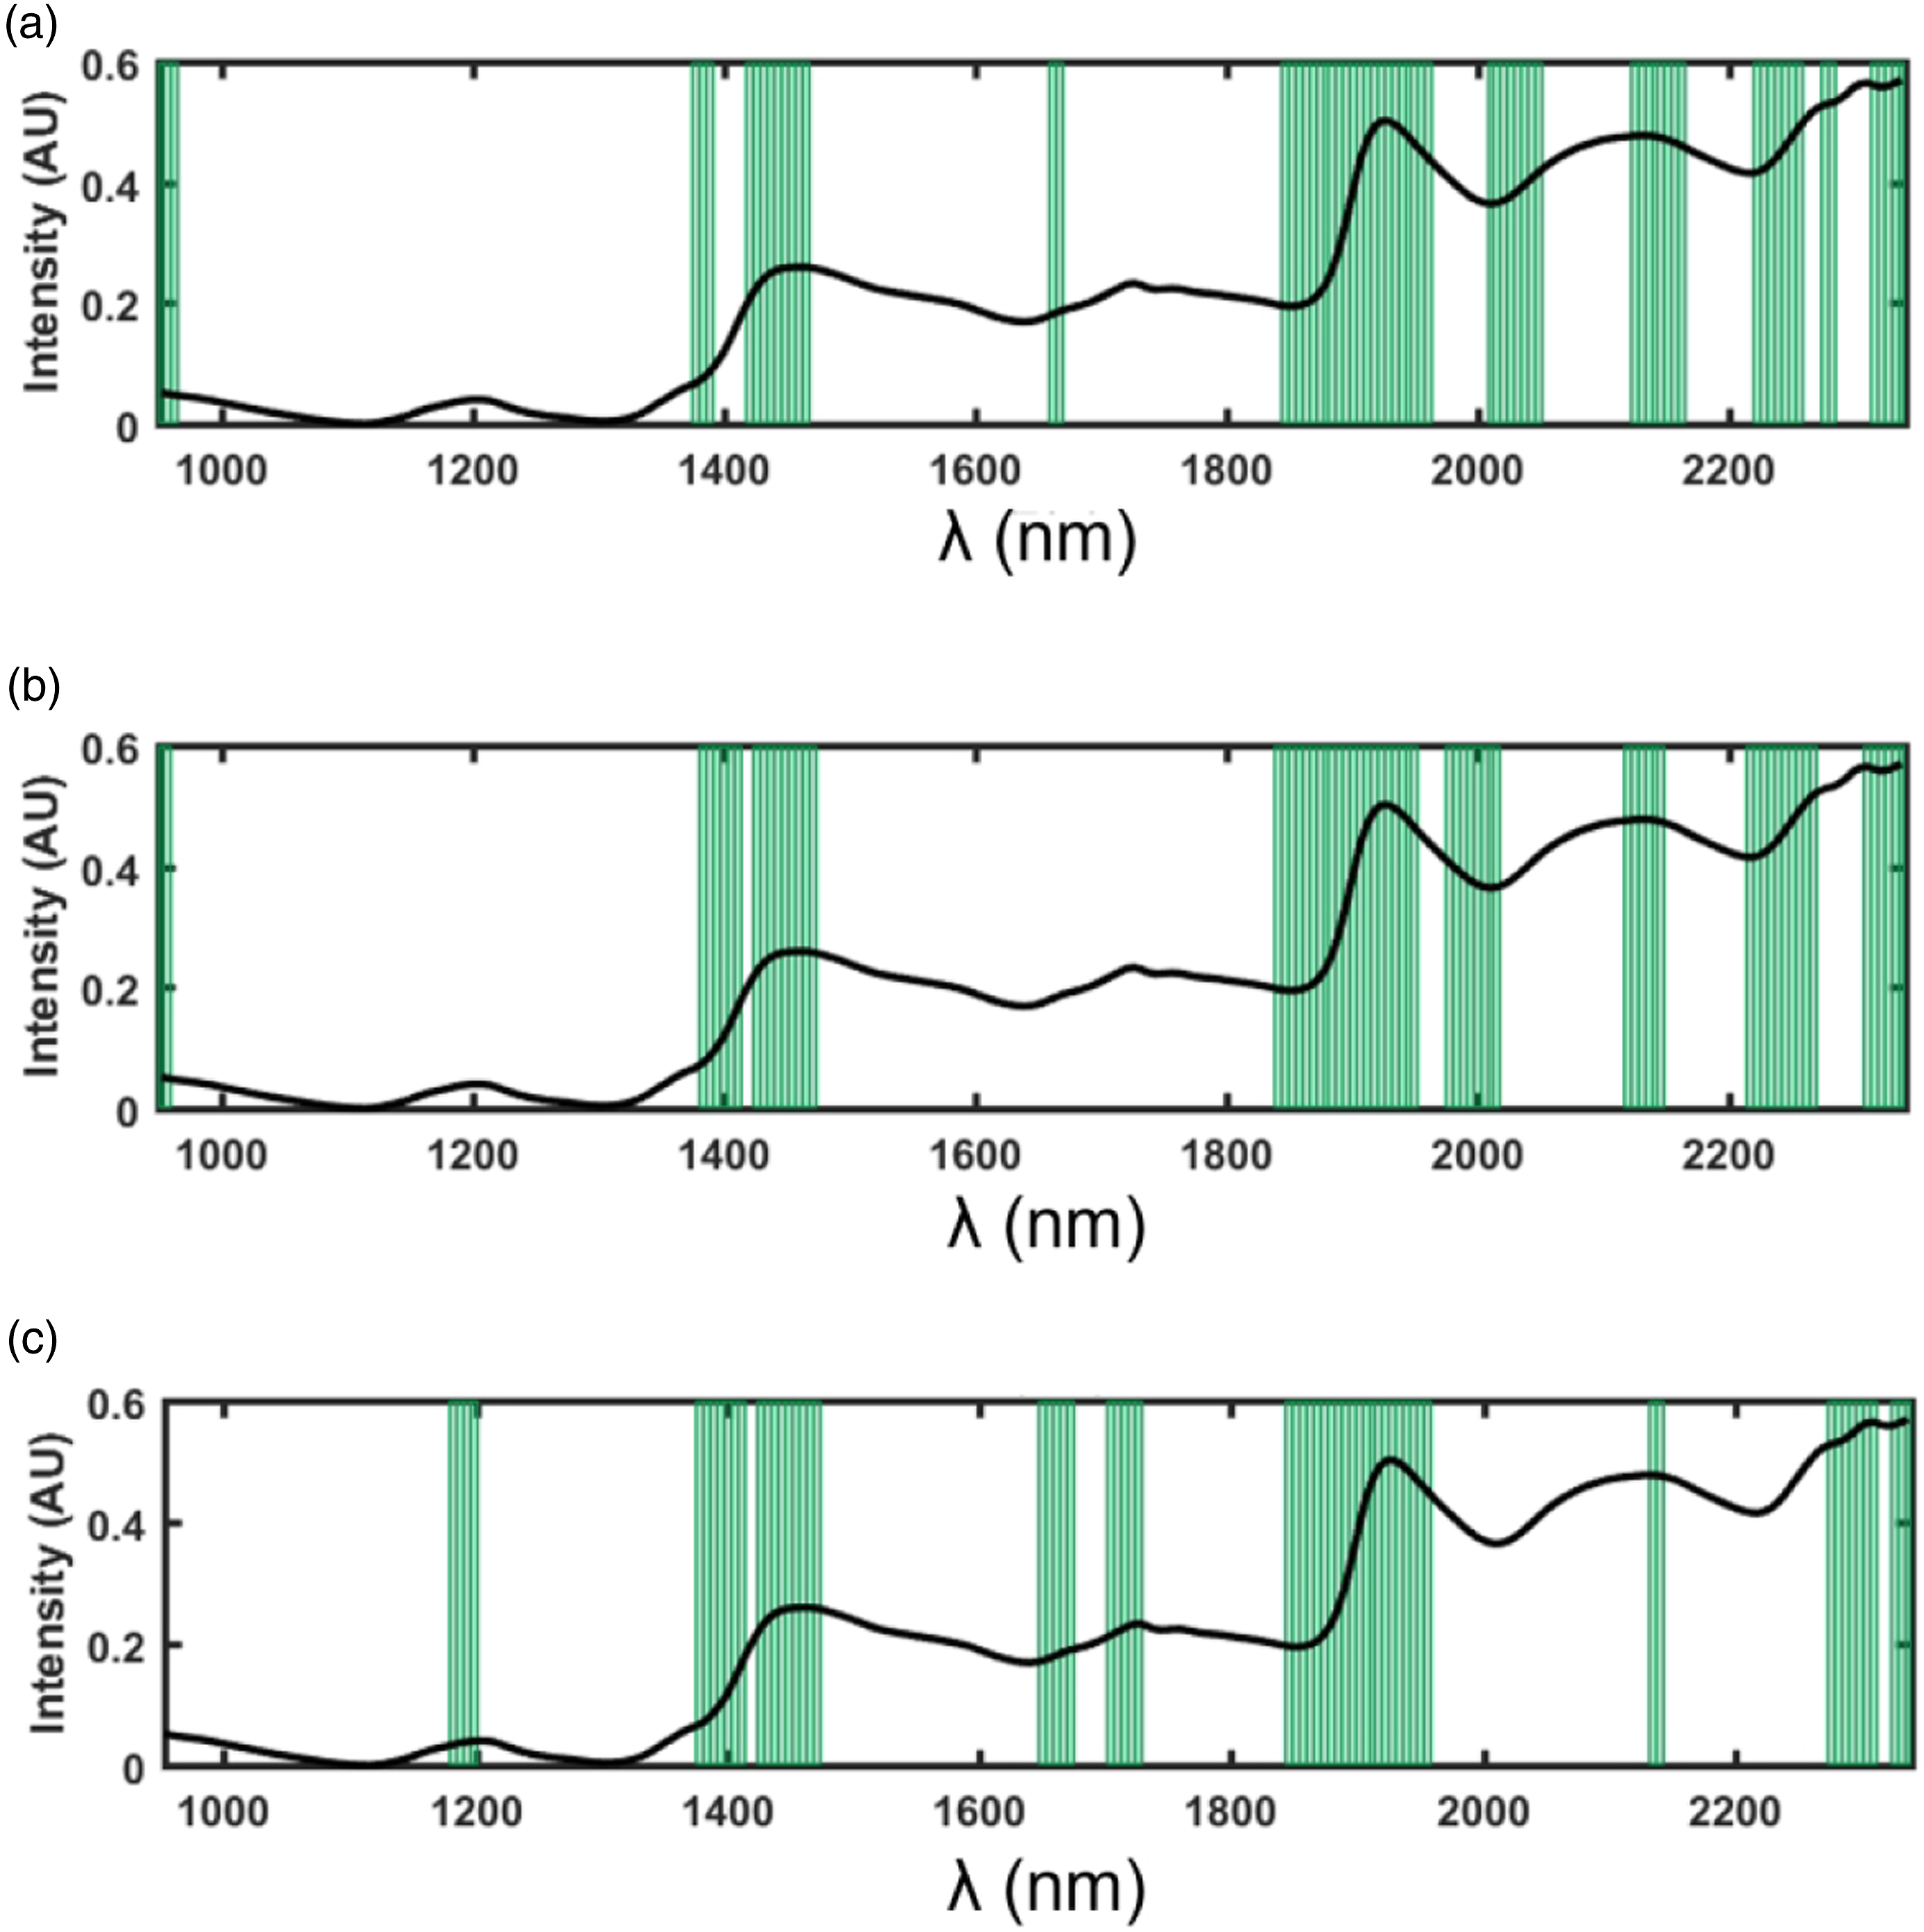
Next, a discriminant model was built to differentiate D grade samples from those of grades B and C (class BC). In this case, the best pre-processing strategy and optimal model complexity were again selected on the basis of a 10-fold cross-validation procedure. This entailed second derivative (with 19 points window and a third order interpolating polynomial) followed by mean centering and the use of four LVs. The corresponding classification accuracy is reported in Table 3.
When the model was applied to the external test set, consisting of the samples from 2019, a very good prediction accuracy was obtained, especially for grade D samples (Table 3). Inspection of the VIP scores (Figure 6(b)) also made it possible to highlight the spectral regions, which mostly contribute to the observed discrimination of the samples. In particular, the spectral bands which contributed significantly to the model were: 953–958 nm (second overtone of O-H stretching), 1383–1411 nm (combination of the first overtone of C-H stretching and -CH2 deformation), 1427–1471 nm (first overtone of O-H stretching), 1847–1950 nm/1978–2005 nm (combination between O-H stretching and O-H or C-H deformation/bending), 2119–2147 nm (combination between O-H and C-O stretching), 2217–2266 nm (combination between arylic C-C and C-H stretching), and 2310–2338 nm (C-H stretching and CH2 deformation combination).
Finally, a third model was generated to discriminate samples from grades B and C. For these two grades, we were expecting the classification to be difficult since the boundary between the two grades is less clear than with the other grades. The optimal data pre-processing and number of LVs were, as before, based on the combination leading to the highest classification accuracy in a 10-fold cross-validation. In this case, the optimal data processing was also found to be second derivative (with 19 points window and a third order polynomial) followed by mean centering. The optimal model complexity was fixed at five LVs.
Given the poor classification accuracy results for grades B and C (Table 3), it was difficult to differentiate between samples of these two grades. This was expected, considering the results of previous studies on the sensory and flavonoid profiles of infusions prepared from B and C grade samples. The study 11 on a sample set of 69 rooibos samples showed that the infusions of B and C grade samples had similar intensities of the different aroma, flavour and taste attributes and the only significant difference was for the higher intensity of the minor ‘green’ note in C grade samples. In terms of individual flavonoid composition of the infusions little to no significant difference also existed between B and C grades as determined for a larger sample set (n = 114). 30
When applied to the test set, better prediction results, especially for grade B, were obtained. By inspecting the VIP scores (Figure 6(c)), it is also possible to identify the spectral regions, which contribute most to the discriminant model: 1182–1196 nm (second overtone of C-H stretching), 1378–1411 nm (combination of the first overtone of C-H stretching and -CH2 deformation), 1427–1471 nm (first overtone of O-H stretching), 1651–1672 nm/1705–1727 nm (first overtone of C-H stretching), 1847–1956 nm (combination between O-H stretching and O-H or C-H deformation/bending), 2136–2141 nm (combination between O-H and C-O stretching), and 2283–2338 nm (C-H stretching and CH2 deformation combination).
Results of predicting the quality grade of Northern Cape rooibos samples based on the PLS-DA hierarchical models developed on rooibos samples from the Western Cape.
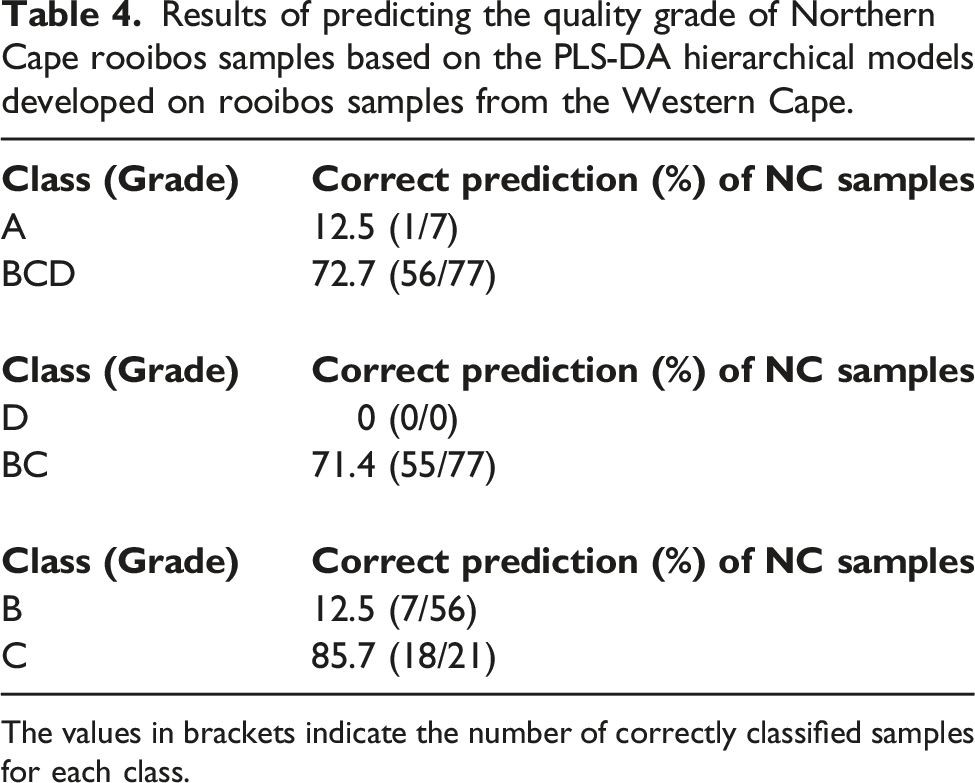
The values in brackets indicate the number of correctly classified samples for each class.
Results of the multi-class PLS-DA model for discrimination of Western Cape rooibos samples according to quality grade.
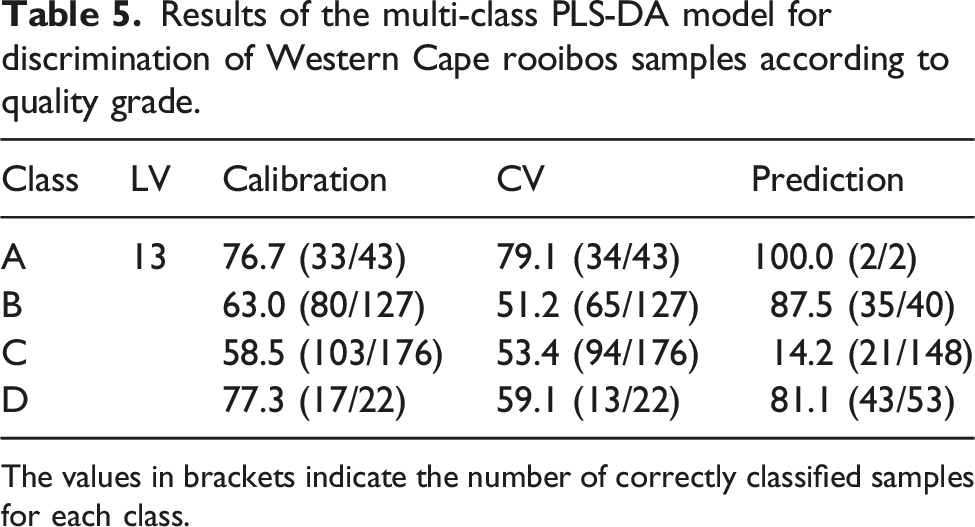
The values in brackets indicate the number of correctly classified samples for each class.
From Table 5, it is evident that the multi-class discriminant approach resulted in poorer classification accuracy, in particular for samples of the lowest grades. These sample would, in general, be predicted as having a higher quality, thus resulting in a potential commercial problem.
Conclusions
The aim of the study was to investigate the potential of SWIR-HSI, combined with suitable data analytical tools, to develop classification models which can distinguish between two production areas and four different quality grades of rooibos tea. A PLS-DA classification model could successfully differentiate between tea based on their production area. A hierarchical classification model, using Western Cape samples, was developed to distinguish between rooibos of different quality grades. The model could accurately distinguish grade A and D samples from class BC, but the model was less effective for distinguishing between B and C grade samples. This model was also less effective when applied to Northern Cape samples. Therefore, to build a global, robust model that could discriminate rooibos on the basis of quality grade, irrespective of production area, future work should include a larger Northern Cape sample set, spanning several production years, as well as grading by one expert panel to exclude discrepansies between panels.
Footnotes
Declaration of conflicting interests
The author(s) declared no potential conflicts of interest with respect to the research, authorship, and/or publication of this article.
Funding
The author(s) disclosed receipt of the following financial support for the research, authorship, and/or publication of this article: This work was supported by grants for the National Research Foundation (NRF) (Grant 05652 for equipment funding to J. Colling); SU DRD Travel Grant (to facilitate collaboration between SU and the University of Rome “La Sapienza” to F. Marini) and the Northern Cape Department of Agriculture, Land Reform and Rural Development (NC/ DALC/ 0590 for sample analysis to M. Muller and E. Joubert).