
Abstract
To identify the optimal transplantation route for enhancing homing of mesenchymal stem cells (MSCs) to the kidney, thereby ameliorating rat Adriamycin nephropathy (AN). In vivo animal imaging revealed that ultrasound-guided intrarenal-arterial transplantation of GFP-MSCs markedly increased the number of MSCs homing to the kidney compared with the intravenous injection (IV) and renal parenchyma (RP) routes. Multimodal ultrasonography revealed that the renal artery (RA) group exhibited reduced renal parenchymal echogenicity and significantly increased cortical microvascular perfusion compared to the Adriamycin (ADR), IV, and RP groups. Hematoxylin and eosin (H&E) staining, Masson staining, and electron microscopy revealed that the RA group had an enlarged glomerular volume, diminished renal interstitial fibrosis, and attenuated mitochondrial damage compared to the ADR, IV, and RP groups. Western blotting, qRT-PCR and immunohistochemistry further indicated that the RA group mitigated rat AN by downregulating the JAK2, AKT1, and STAT3 signaling pathways more effectively than the ADR, IV, and RP groups did. The above findings indicate that under ultrasound guidance, MSCs transplanted via the renal artery can ameliorate AN-induced renal injury by acting on the JAK/STAT signaling pathway.
We used different approaches to transplant MSCs. Under ultrasound-mediated conditions, the MSCs transplanted via the renal artery significantly improved the renal damage in rats with doxorubicin-induced nephropathy through the JAK2/STAT3 signaling pathway.
Introduction
Adriamycin (ADR), a widely used chemotherapeutic agent, exerts pronounced nephrotoxic effects 1 . The induction of glomerular sclerosis, podocyte injury, mitochondrial damage, oxidative stress, interstitial inflammatory cell infiltration, and fibrosis2,3 ultimately leads to injury of resident renal cells, impairment of metabolism and function, and pathological changes that closely resemble human focal glomerulonephritis 4 , compromising both renal structure and function 5 .
Mesenchymal stem cells (MSCs) are pluripotent cells with strong in vitro expansion capacity and differentiation potential6,7. Once transplanted, MSCs protect the kidneys through multiple mechanisms8,9. According to numerous studies, the number of cells homing to the target tissue is closely related to the route of transplantation 10 ; however, an optimal infusion pathway has not yet been identified. As minimally invasive and safe procedures, ultrasound-guided puncture techniques, such as portal vein transplantation of stem cells for liver fibrosis and cirrhosis, are widely used in clinical diagnosis and treatment because they provide visualization11,12, real-time tractability, and easy operation 13 . Therefore, this study used an ADR-induced rat Adriamycin nephropathy (AN) model to assess the modeling results based on biochemical detection and pathological structural changes in kidney tissue after 8 weeks. By comparing the homing efficiency of GFP-MSCs to the AN kidney and their therapeutic effects after infusion via different routes, this study aimed to identify the optimal transplantation route that maximizes MSCs homing to the AN kidney, thereby ameliorating rat AN.
Materials and methods
Modeling method of AN model
This study was conducted in accordance with the National Institutes of Health Guide for the Care and Use of Laboratory Animals. Specific pathogen-free male Sprague–Dawley (SD) (aged 6–8 weeks, weighing 200–250 g) rats were provided by the Laboratory Animal Center of the Kunming Medical University. The animal study was approved by the Laboratory Animal Welfare and Ethics Committee of the Second Affiliated Hospital of Kunming Medical University (kyfeyxm2024005).
Forty 10-week-old male SD rats were randomly selected for the study. After overnight fasting, each rat received an intravenous injection of ADR (4 mg/kg, 2 mg/ml) via the tail vein, and the same dose was administered 14 days after. Throughout the modeling period, food and water intake, activity, changes in coat color, body weight, and urinary/fecal output were recorded daily. At the end of week 8, the rats were placed in metabolic cages to collect 24-h urine and tail vein blood, and serum creatinine (Scr), blood urea nitrogen (BUN), and Alb levels were measured using an automated biochemical analyzer (Thermo, USA). Two rats were randomly euthanized, and their kidneys were harvested, fixed, and processed for hematoxylin and eosin (H&E) and Masson’s trichrome (Masson) staining. Based on previous experiments conducted by our research group, a successful modeling standard was defined as a ≥2-fold increase in Scr, BUN, and Alb, accompanied by histological evidence of glomerular atrophy and interstitial fibrosis on H&E and Masson staining 14 .
Histopathological assessment of renal injury
Renal injury was scored histopathologically in a blinded manner 15 . The kidney tissue was fixed, dehydrated, and embedded in paraffin. The sections were stained with hematoxylin or iron staining solution for 3–5 min, differentiated, counterstained with a bluing reagent, rinsed, cleared in xylene, and mounted. Five fields per section were randomly selected and imaged using light microscopy (Leica, USA). Two pathologists independently performed a blinded semiquantitative analysis of the kidney sections.
Culture and identification of GFP-MSCs
The purchased third-passage GFP-MSCs (RASMX-01101, Cyagen Biosciences) were rapidly thawed in a pre-warmed 37°C water bath until completely melted. The cryovials were sterilized with 70% ethanol and transferred to a sterile operating table. The thawed cell suspension was aspirated with a pipette, transferred into a 15 ml centrifuge tube, gently diluted with culture medium at a 1:10 ratio, centrifuged at 1000 rpm for 5 min, and mixed. The cell suspension was then seeded into a T25 culture flask and incubated at 37°C with 5% CO in a humidified incubator. The culture medium was replaced 24 h after seeding. The medium was subsequently changed, and the cells were passaged at a 1:3 ratio. The growth duration, morphological characteristics, and status of each passage at different stages were observed and recorded using an inverted microscope.
Passage-4 GFP-MSCs were collected, washed three times with phosphate-buffered saline (PBS), and divided into four groups in T25 culture dishes. Each group was incubated for 24 h in a medium supplemented with 1% PBS and rabbit monoclonal CD90 (ab307736, Abcam), Rabbit monoclonal CD29 (ab308384, Abcam), Rabbit monoclonal CD34 (ab81289, Abcam), and Rabbit monoclonal CD45 (ab40763, Abcam). The surface antigen expression of GFP-MSCs was detected by flow cytometry and analyzed using FlowJo software. Passage-4 GFP-MSCs were collected and subjected to adipogenic and osteogenic differentiation assays.
EdU-labeled GFP-MSCs
The EdU solution (Reagent A) was diluted with complete cell culture medium at a 1:1000 ratio to prepare a 50 μM EdU-containing culture medium. Next, 100 μl of freshly prepared 50 μM EdU medium was added to each well containing the GFP-MSCs suspension and incubated for 2 h at 37°C under standard culture conditions. The medium was then carefully removed. The cells were washed once or twice with PBS for 5 min each wash.
Transplantation of EdU-labeled GFP-MSCs
Thirty male SD rats were randomly divided into four groups of eight rats each, and eight normal rats were selected as the negative control group. Tail-vein IV infusion (Group IV): EdU-labeled GFP-MSCs (1 ml) was injected into the tail veins. Ultrasound-guided intrarenal parenchymal infusion (Group RP): EdU-labeled GFP-MSCs (1 ml) were directly injected into the renal parenchyma under ultrasound guidance. Ultrasound-guided intrarenal-arterial infusion (Group RA) EdU-labeled GFP-MSCs (1 ml) were infused into the renal artery under ultrasound guidance (Fig. 1).

Methods for ultrasound-guided transplantation of EdU-labeled GFP-MSCs. (a) Ultrasound-guided intra-renal-parenchyma transplantation of EdU-labeled GFP-MSCs (the red arrow indicates the puncture needle). (b) Color Doppler and spectral Doppler imaging were used to identify the renal artery at the hilum. (c) Ultrasound-guided intra-renal-arterial transplantation of EdU-labeled GFP-MSCs (the red arrow indicates the puncture needle, and the green arrow shows EdU-labeled GFP-MSCs entering the renal artery).
Multimodal ultrasound assessment on the effect of EdU-labeled GFP-MSCs transplanted via different routes on improving AN
After anesthesia with 2% isoflurane, the abdominal fur was shaved to fully expose the back, and the rat was placed in a prone position on the examination platform. A GE ultrasound system equipped with a 9L4 high-frequency linear array transducer featuring a contrast-enhanced imaging mode and acoustic radiation force impulse imaging software was used. The transducer was oriented perpendicular to the kidney. Two-dimensional ultrasound was used to measure renal size and parenchymal thickness, whereas color Doppler was used to assess renal blood flow distribution. Ultrasound elastography was used to measure renal cortical stiffness, and a stable image was obtained when the on-screen pressure remained between 2 and 3. The elastography device was activated in this mode. After selecting a stable image mode, a 1 cm × 1 cm sampling width was used to repeatedly measure the cortical values at various orientations of the kidney, with the final value taken as the mean. Renal cortical microperfusion was detected using contrast-enhanced ultrasonography. Briefly, SonoVue ultrasound contrast microbubbles were used to prepare the suspension, according to the manufacturer’s instructions. The suspension (0.5 ml) was drawn into a 1-ml syringe and injected via the tail vein of each rat. Immediately after injection, dual-mode real-time dynamic contrast-enhanced ultrasonography was initiated, and renal perfusion was observed and recorded for 3 min. All measurements were performed three times for each kidney in each rat.
Preparation of EdU-stained tissue sections from animal models
Frozen kidney tissue sections were obtained from rats in each experimental group. The sections were fixed with 4% paraformaldehyde at room temperature for 15 min. The sections were aspirated and rinsed thoroughly with PBS three times. The tissue was permeabilized by incubating in permeabilization solution (0.3% Triton X-100 in PBS) at room temperature for 10–15 min. Subsequently, 500 μl of Click reaction mixture was applied to each section and incubated at room temperature in the dark for 30 min. Following the reaction, the slides were gently washed with PBS, and each section was mounted with approximately 50 μl of anti-fade mounting medium containing 4′,6-Diamidino-2-Phenylindole (DAPI). The slides were cured if necessary, and images were obtained using a fluorescence microscope under the appropriate excitation wavelengths.
Immunohistochemical staining
After dehydration and clearing, the samples were embedded and sectioned into 5 µm slices. Sections were deparaffinized, rehydrated, and applied with the primary antibody: the sections were diluted, and then incubated overnight at 4°C with JAK2, AKT1 (AK1-H5283, cell signaling) (1 : 200), PI3K (17366T, cell signaling) (1 : 100), mTOR (2983T, cell signaling) (1 : 100), STAT1 (14994T, cell signaling) (1 : 100), STAT3 (A19566, abcolon) (1 : 100), and antibody (HA1006, HUABIO) at a 1:150 dilution. A polymer of horseradish peroxidase-labeled goat anti-mouse/rabbit immunoglobulin was applied to the sections in a humidified chamber and incubated at 37°C for 35 min. While examining the specimen under a microscope, images were collected for analysis.
Immunofluorescence
Paraffin-embedded sections were dewaxed and rehydrated. The tissue slices were placed in a repair chamber filled with EDTA antigen retrieval buffer (pH 8.0) and subjected to antigen retrieval using a microwave oven. After encircling the sections, BSA was applied and incubated for 30 min. The sections were then incubated with a primary antibody against JAK2 (1:200), AKT1 (1:200), PI3K (1:100), mTOR (1:100), STAT1 (1:100), and STAT3 (1:100) appropriately diluted in PBS. As a control, HRP-Goat Anti-Rabbit (AS014, abcolon) (1:150) was added and incubated in a humidified chamber at 4°C overnight. The FITC reagent and DAPI staining solution were then applied to the circles and incubated for 10 min at room temperature in the dark. Finally, three random fields per section were examined and imaged using fluorescence microscopy.
Transmission electron microscopy
Freshly harvested renal tissue was immediately immersed in a preset 4°C electron microscopy fixative and fixed for 4 h. After dehydration with graded ethanol, the samples were infiltrated with acetone and 812 embedding medium for 7 h, sectioned, and polymerized at 60°C for 48 h. Ultrathin sections (50 nm) were cut using a microtome and stained with uranyl acetate and lead citrate. Three samples per group were examined using a transmission electron microscope (HT7700S, Japan).
Western blot analysis
The detailed Western blot (WB) process and protocol have been described in our previous study 16 . Briefly, renal tissue was added to Radioimmunoprecipitation Assay (RIPA) lysis buffer (20 mg/200 ml) supplemented with 1% (v/v) phosphatase and protease inhibitors to extract total protein. After casting, the gels were transferred to an electrophoresis chamber for protein electrophoresis. After transfer and blocking, the incubation chamber was washed three times with tris-buffered saline with Tween®-20 (TBST). The humidified chamber was then incubated with JAK2 (1:2000), AKT1 (1:2000), PI3K (1:1000), mTOR (1:1000), STAT1(1:1000), and STAT3 (1:1000) antibody diluted in 5% BSA. After overnight incubation at 4°C on a shaking table, horseradish peroxidase-conjugated secondary antibodies were added to the incubation chamber. The blots were then placed in a fluorescence imager, treated with chemiluminescent substrate, and exposed for 20–30 min. While observing the results, the protein expression levels for each group were recorded; the gray value of each group was measured using ImageJ software. The relative value of the target indicator to be measured was equal to the target blot value to be measured/internal reference β-actin blot value.
Enzyme-linked immunosorbent assay
After coating and blocking, kidney tissues from each group were sequentially added to the test samples and enzyme-labeled antibody solutions. ELISA kits were used to determine the levels of interleukin 6 (IL-6) (EK0592, MULTI SCIENCES), interleukin 10 (IL-10) (EK310/2-01, MULTI SCIENCES), and interleukin 1β (IL-1β) (EK301B/3-02, MULTI SCIENCES) according to the manufacturer’s instructions.
RT-PCR analysis
RNA was extracted from the kidney tissue. RNA concentration was determined using ultraviolet (UV) absorbance spectrophotometry. RT-qPCR was performed to detect the expression of key target genes. Total RNA was extracted from the kidney tissues using TRIzol reagent (G3013, Serviocebio). Real-time quantitative PCR was performed using glyceraldehyde-3-phosphate dehydrogenase (GAPDH) as the housekeeping gene. Relative gene expression levels were calculated using the 2−ΔΔCT method. Gene expression levels were normalized to those of the housekeeping gene (β-actin), and each sample was analyzed in triplicate. The primers used for RT-qPCR are listed in Table 1.
Specific primers for RT–qPCR.

Statistical analysis
We used GraphPad Prism 9.0 to determine the statistical significance of the differences between the two groups using two-tailed Student’s t-tests. Multiple group comparisons were performed using one-way analysis of variance (ANOVA). Data were obtained from at least three replicates of each dataset, and all data are presented as means ± standard deviations. In all cases, n.s. ≥ 0.05, *P < 0.05, **P < 0.01, and ***P < 0.001.
Results
Identification of GFP-MSCs
The purchased passage-3 GFP-MSCs exhibited a green and feather-like diffuse distribution when viewed under a fluorescence microscope. GFP-MSCs were positive for the surface markers CD90 (98.2%) and CD29 (99.4%), whereas CD34 and CD45 were negative (0.63% and 0.01%, respectively). In addition, GFP-MSCs undergo adipogenic and osteogenic differentiation processes. These results show that GFP-MSCs conform to stem cell phenotypes with differentiation capacity, rendering them suitable for subsequent experiments and analyses (Fig. 2).
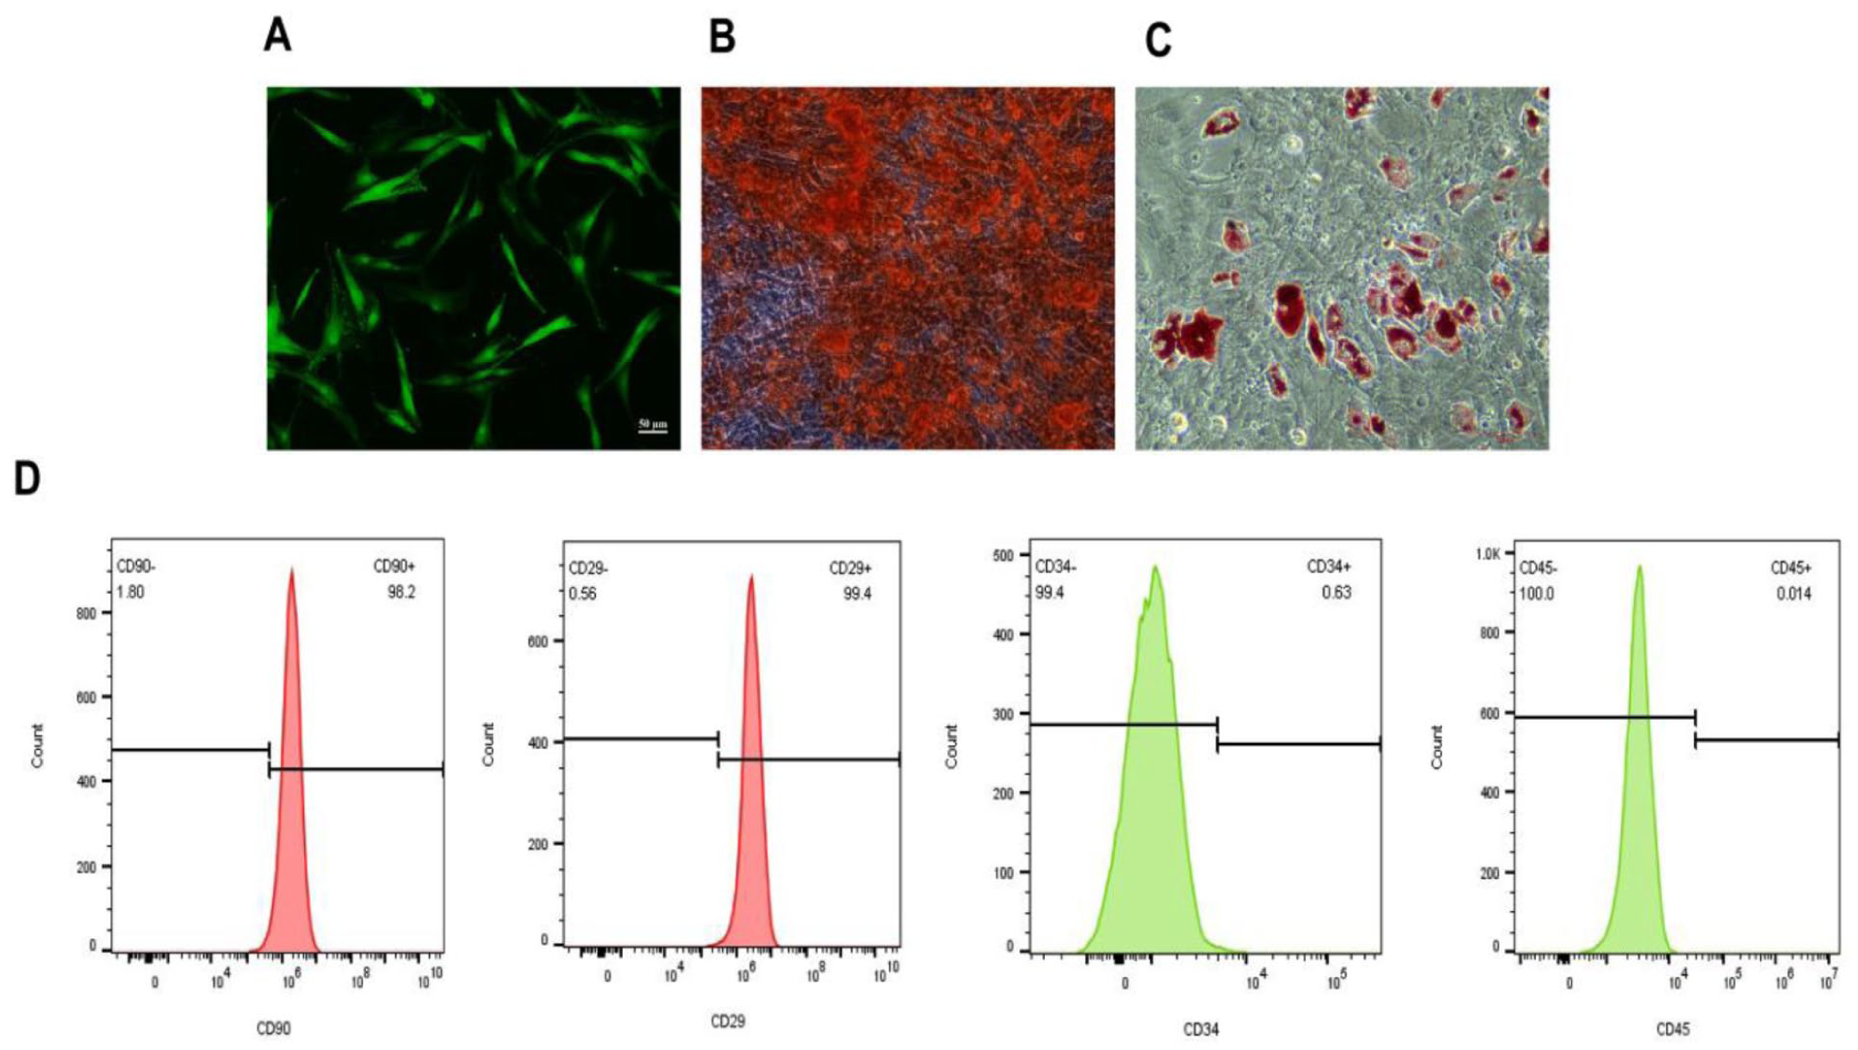
Characterization of the GFP-MSCs. (a) P3 GFP-MSCs transfection (×50). (b) The GFP-MSCs identified by flow cytometry were positive for CD90 and CD29 and negative for CD34 and CD45. (c)After osteogenic induction, the differentiated cells exhibited positive Alizarin red staining. (d) After adipogenic induction, the differentiated cells presented positive Oil red O staining. 17
Compare the homing ability of MSCs through different transplantation routes
Fourteen days after transplantation, we compared the homing abilities of MSCs transplanted via different routes. Two days after transplantation of EdU-labeled GFP-MSCs via different routes, immunofluorescence and In Vivo Imaging System (IVIS) revealed that more EdU-labeled GFP-MSCs homed to the kidney tissue in the RA group than in any other group (Fig. 3a).
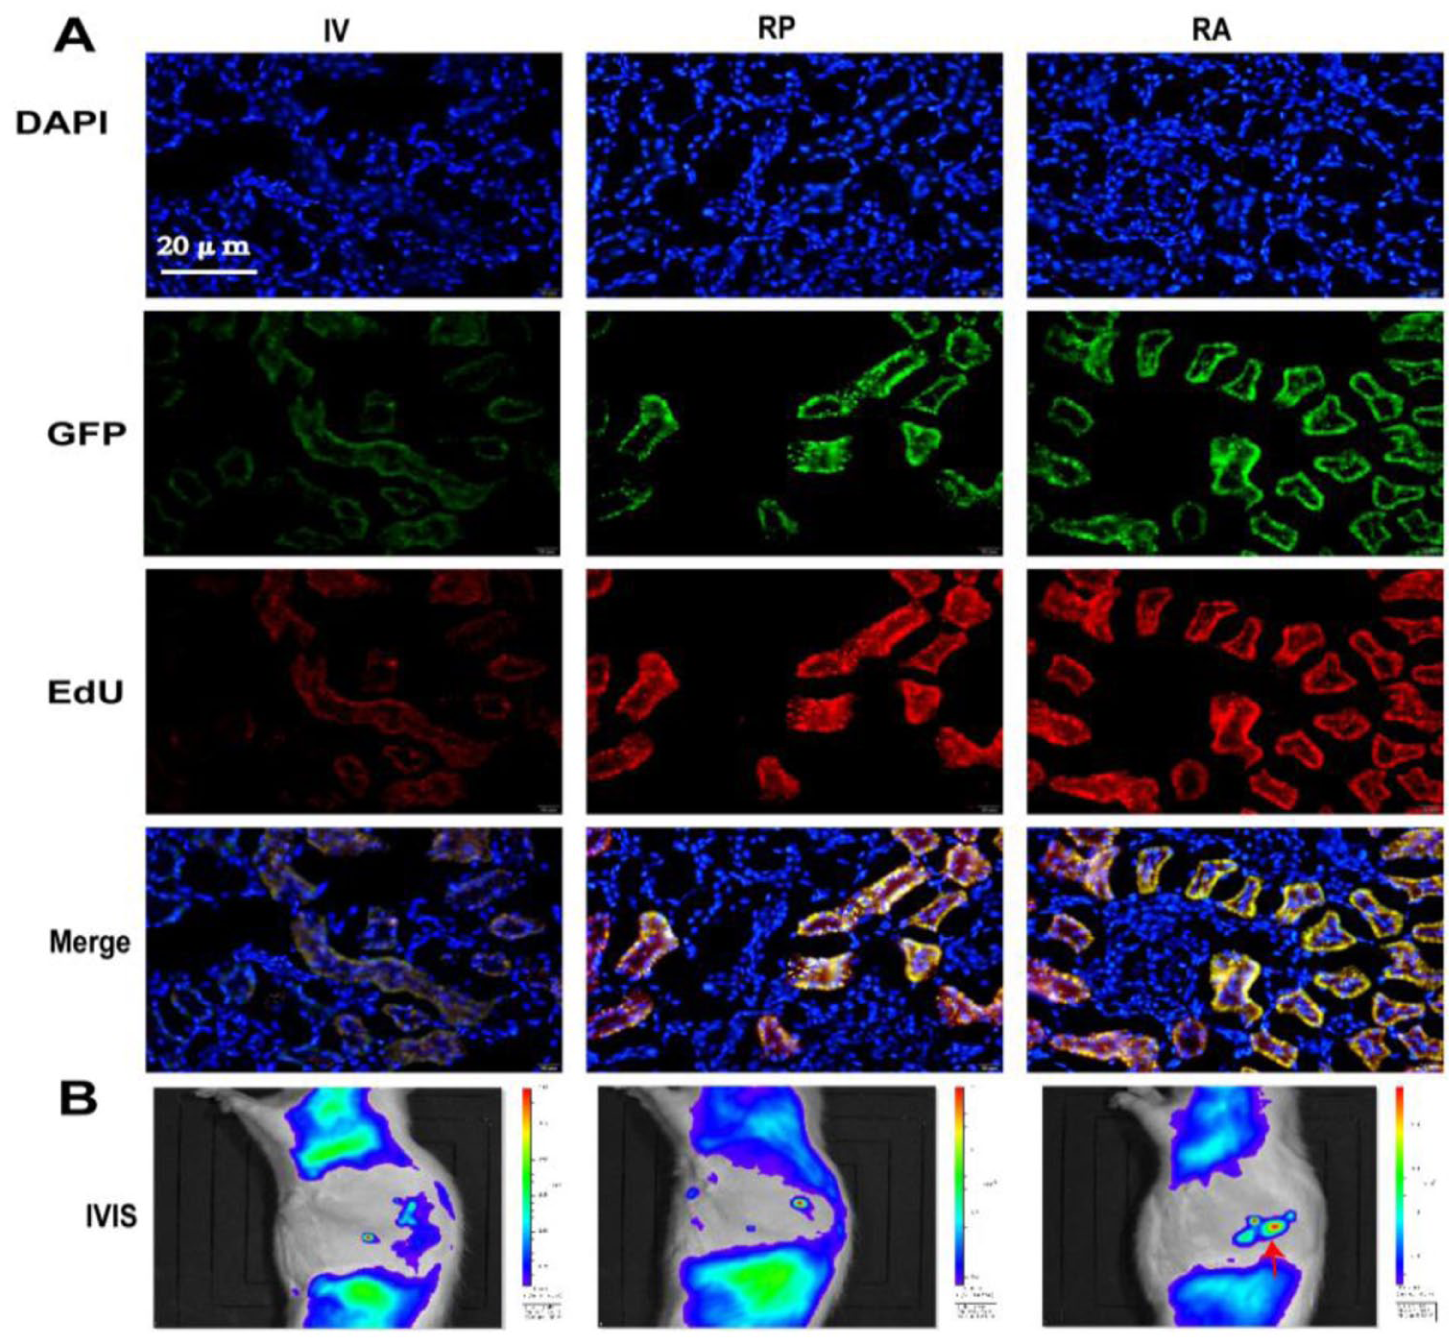
Comparison of the abilities of EdU-labeled GFP-MSCs transplantation via different routes to ameliorate the pathological structure of rat AN. (a) Immunofluorescence staining images of GFP-MSCs and EdU expression in the kidney after transplantation via different routes, Scale bar, 20 μm, n = 3 per group. (b) IVIS assessment of EdU-labeled GFP-MSCs homing to the kidney after transplantation via different routes, n = 3 per group.
Comparison of the ability of MSCs transplantation via different routes to ameliorate the pathological structure of rat AN
Fourteen days after treatment, H&E staining results showed that the ADR group exhibited pronounced glomerular atrophy and sclerosis, with marked thickening of the glomerular basement membrane, compared with the normal group. In contrast, the RA group displayed largely restored glomerular architecture and no obvious thickening of the glomerular basement membrane compared with the ADR group. Masson staining results showed that the ADR group exhibited marked interstitial fibrosis and tubular atrophy compared to the normal group. In contrast, the RA group displayed a significant reduction in interstitial fibrosis and no obvious tubular atrophy compared with the ADR group. Transmission Electron Microscope (TEM) results revealed that the ADR group exhibited a marked decrease in the number of mitochondria and pronounced swelling and rupture of some mitochondrial membranes compared to the control group, whereas the RA group showed a substantial increase in the number of mitochondria and only mild swelling compared to the ADR group (Fig. 4c).

Comparison of the abilities of MSCs transplantation via different routes to ameliorate the pathological structure of rat AN. (a) H&E staining for detection of glomerular architecture following MSCs transplantation via different routes. (b) Masson staining for detection of renal interstitial fibrosis after MSCs transplantation via different routes. (c) TEM detection of mitochondrial changes (red arrows denote mitochondria) after MSCs transplantation via different routes.
Multimodal ultrasound evaluation of the therapeutic effects of MSCs transplantation via different routes on rat AN
Fourteen days after MSCs transplantation via different routes, the therapeutic effects were evaluated using multimodal ultrasound. According to the CEUS results, compared to the normal group, the ADR group showed markedly reduced renal cortical blood perfusion, along with significantly prolonged arrival and peak times of the contrast agent. In contrast, the RA group exhibited a pronounced increase in renal cortical blood perfusion and markedly shortened arrival and peak times compared with the ADR group (Fig. 5a). Color Doppler ultrasound results showed that renal blood flow distribution was significantly diminished in the ADR group compared to the normal group, whereas the RA group showed an obvious increase in renal blood flow distribution compared to the ADR group (Fig. 5b). According to the elastography results, renal parenchymal stiffness was markedly elevated in the ADR group compared to that in the normal group, whereas it was markedly reduced in the RA group compared to that in the ADR group (Fig. 5c).

Multimodal ultrasound evaluation of the therapeutic effects of MSCs transplantation via different routes on rat AN. (a) CEUS evaluation of the influences of MSCs transplantation via different routes on the renal cortical blood perfusion of rat AN. (b) CDFI evaluation of the influences of MSCs transplantation via different routes on the renal blood flow distribution of rat AN. (c) Elastography evaluation of the influences of MSCs transplantation via different routes on the renal parenchymal stiffness of rat AN (n = 8).
Impact of MSCs transplantation via different routes on the JAK/STAT signaling pathway of rat AN
The JAK/STAT signaling pathway was also examined. Immunofluorescence results revealed markedly elevated JAK2 and AKT1 expression in the ADR group compared to the normal group, whereas JAK2 and AKT1 expression was significantly reduced in the RA group compared to the ADR group (Fig. 6a–d). WB analysis showed that JAK2 and AKT1 protein expression was substantially increased in the ADR group compared to that in the normal group and was significantly reduced in the RA group compared to that in the ADR group.

Influences of MSCs transplantation via different routes on the JAK/STAT signaling pathway of rat AN. (a) Immunofluorescence assessment of JAK2 expression in renal tissue across the different groups. (b) Immunofluorescence assessment of AKT1 expression in renal tissue across the different groups. (c) The quantitative analysis of JAK2 expression in different groups (n = 8). (d) The quantitative analysis of AKT1 expression in different groups (n = 8). (e) The protein expression levels of JAK2 and AKT1 in rat kidney tissue were assayed by WB. (f) JAK2 and AKT1 and β-catenin expression were normalized to the expression of beta-actin (n = 8). The values are presented as the mean ± SD. (*P < 0.05, **P < 0.01, ***P < 0.001).
The JAK/STAT signaling pathway was also examined. Immunofluorescence results revealed markedly elevated PI3K and mTOR expression in the ADR group compared to the normal group, whereas PI3K and mTOR expression was significantly reduced in the RA group compared to the ADR group. WB analysis revealed that PI3K and mTOR protein expression was substantially increased in the ADR group compared to that in the normal group and was significantly reduced in the RA group compared to that in the ADR group (Fig. 6e–g).
The JAK/STAT signaling pathway was also examined. Immunofluorescence results revealed markedly elevated PI3K and mTOR expression in the ADR group compared to the normal group, whereas PI3K and mTOR expression was significantly reduced in the RA group relative to the ADR group (Fig. 7a–d). WB analysis showed that PI3K and mTOR protein expression was substantially increased in the ADR group compared to that in the normal group and was significantly reduced in the RA group compared with the ADR group (Fig. 7e, f).

Influences of MSCs transplantation via different routes on the JAK/STAT signaling pathway of rat AN. (a) Immunofluorescence assessment of PI3K expression in renal tissue across the different groups. (b) Immunofluorescence assessment of mTOR expression in renal tissue across the different groups. (c) The quantitative analysis of PI3K expression in different groups (n = 8). (d) The quantitative analysis of mTOR expression in different groups (n = 8). (e) The protein expression levels of PI3K and mTOR in rat kidney tissue were assayed by WB. (f) PI3K and mTOR and β-catenin expression were normalized to the expression of beta-actin (n = 8). The values are presented as the mean ± SD. (*P < 0.05, **P < 0.01, ***P < 0.001).
The JAK/STAT signaling pathway was also examined. Immunofluorescence results revealed markedly elevated STAT1 and STAT3 expression in the ADR group compared to the normal group, whereas STAT1 and STAT3 expression was significantly reduced in the RA group relative to the ADR group (Fig. 8a–d). WB analysis showed that STAT1 and STAT3 protein expression was substantially increased in the ADR group compared to that in the normal group and was significantly reduced in the RA group compared with the ADR group (Fig. 8e, f).

Influences of MSCs transplantation via different routes on the JAK/STAT signaling pathway of rat AN. (a) Immunofluorescence assessment of STAT1 expression in renal tissue across the different groups. (b) Immunofluorescence assessment of STAT3 expression in renal tissue across the different groups. (c) The quantitative analysis of STAT1 expression in different groups (n = 8). (d) The quantitative analysis of STAT3 expression in different groups (n = 8). (e) The protein expression levels of STAT1 and STAT3 in rat kidney tissue were assayed by WB. (f) STAT1 and STAT3 and β-catenin expression were normalized to the expression of beta-actin (n = 8). The values are presented as the mean ± SD (*P < 0.05, **P < 0.01, ***P < 0.001).
Comparison of the ability of MSCs transplantation via different routes to ameliorate AN injury
We further compared the ability of MSCs transplantation via different routes to ameliorate AN injury. JAK2, AKT1, mTOR, PI3K, STAT1, and STAT3 gene expression was significantly elevated in the ADR group compared to the normal group, whereas it was markedly reduced after ultrasound-guided intrarenal-arterial MSCs transplantation compared to the ADR and IV groups (Fig. 9a–f). In addition, biochemical test results revealed that BUN, serum creatinine (Scr), and albumin levels were markedly increased in the ADR group compared to those in the normal group, and they were significantly reduced after ultrasound-guided intrarenal-arterial MSCs transplantation (Fig. 9g–i).

Comparison of the abilities of MSCs transplantation via different routes to ameliorate AN injury. (a) The mRNA expression levels of JAK2 in rat kidney tissue were assayed by RT-qPCR. (b) The mRNA expression levels of AKT1 in rat kidney tissue were assayed by RT-qPCR. (c) The mRNA expression levels of mTOR in rat kidney tissue were assayed by RT-qPCR. (d) The mRNA expression levels of STAT1 in rat kidney tissue were assayed by RT-qPCR. (e) The mRNA expression levels of PI3K in rat kidney tissue were assayed by RT-qPCR. (f) The mRNA expression levels of STAT3 in rat kidney tissue were assayed by RT-qPCR (n = 4). (e–i) Levels of BUN, Alb and Scr at the 14 day (n = 8). The values are presented as the mean ± SD. (*P < 0.05, **P < 0.01, ***P < 0.001).
Influences of MSCs transplantation via different routes on the renal inflammation of rat AN
Renal immunohistochemistry was performed to compare renal inflammation 14 days after MSCs transplantation via different routes. JAK2, AKT1, mTOR, PI3K, STAT1, and STAT3 expression were markedly higher in the ADR group than in the control group, whereas JAK2, AKT1, mTOR, PI3K, STAT1, and STAT3 expression were significantly lower in the RA group than in the ADR group (Fig. 10a–f). ELISA results revealed that the levels of the inflammatory cytokines IL6, IL10, and IL-1b were significantly elevated in the ADR group compared to the normal group, whereas this elevation was substantially attenuated in the RA group compared to the ADR group (Fig. 10g–i).

Influences of MSCs transplantation via different routes on the renal inflammation of rat AN. (a-f) Immunohistochemical detection of JAK2, AKT1, mTOR, PI3K, STAT1, and STAT3 expression in the kidney across the different groups. (g) The expression level of IL6 detected by ELISA in different groups. (h) The expression level of IL10 detected by ELISA in different groups. (i) The expression level of IL1β detected by ELISA in different groups (n = 4). The values are presented as the mean ± SD (*P < 0.05, **P < 0.01, ***P < 0.001).
Discussion
ADR-induced renal injury involves multiple aspects18,19. In this study, AN kidneys exhibited marked glomerular atrophy and sclerosis, destruction of intraglomerular endothelial cells, pronounced thickening of the glomerular basement membrane, and mesangial cell proliferation20,21. In addition, interstitial fibrosis, tubular atrophy, and inflammatory factor accumulation have been observed 22 . This drug drives excessive accumulation of Reactive Oxygen Species (ROS) in renal tissue, which subsequently damages cellular membranes, proteins, nucleic acids, and other macromolecules, ultimately disrupting cellular structure and function. Moreover, glomerular sclerosis, interstitial fibrosis, and deposition in the AN progressively increase renal stiffness. Consistently, in vitro elastography revealed significantly elevated cortical stiffness in AN kidneys compared with that in the normal group. Elastography is an ultrasound-based technique that evaluates tissue elasticity or hardness and measures the deformation produced by the mechanical force exerted by the probe, indirectly reflecting the mechanical properties (primarily stiffness) of the tissue23,24.
In vitro color Doppler ultrasound showed that the ADR group exhibited a markedly reduced and sparser blood flow distribution compared to the other groups. Contrast-enhanced ultrasonography further revealed a significantly prolonged arrival time and markedly diminished perfusion in the renal cortex of the ADR group, which is consistent with Garessus findings that cortical microperfusion is lower in patients with chronic kidney disease than in healthy subjects 25 . This reduction is caused by ADR-generated ROS, which directly injure vascular endothelial cells, impair vasodilatory function, and induce sustained constriction of glomerular capillaries, ultimately leading to a decreased blood flow volume 26 . In addition, ROS compromise the integrity of the mitochondrial membrane, increase its permeability, and allow excessive water influx, leading to swelling, structural disruption, and disordered, diminished, or even absent mitochondrial cristae27,28. Correspondingly, our TEM images revealed markedly fewer swollen mitochondria with severely damaged membranes and disrupted cristae in the kidneys of AN rats. Changes in these pathological structures ultimately reduce the glomerular filtration rate and cause changes in related renal functions, such as significantly elevated serum creatinine, BUN, and urinary protein levels.
Stem cells play an indispensable role in treating renal diseases by promoting renal cell regeneration. Inflammation, fibrosis, apoptosis, and necrosis are suppressed through paracrine signaling, thereby ameliorating renal injury29,30. Studies have shown that MSCs improve the viability of glomerular podocytes in AN kidneys, reduce glomerular inflammation and sclerosis, and ameliorate doxorubicin-induced renal fibrosis31,32. Some researchers have recognized that the therapeutic effect of stem cells on kidney diseases is closely linked to factors such as homing capacity, viability, and transplantation route 33 . Among these, selecting an effective transplantation route is a critical determinant for maximizing stem cell homing to the kidneys. Intravenous infusion is one of the most commonly used routes for stem cell infusion 34 . Owing to its simplicity, noninvasiveness, repeatability, and patient tolerance, it is widely used in the clinical treatment of hematological diseases. However, this approach has several drawbacks when used to treat renal diseases. First, intravenously infused stem cells rapidly disperse throughout the body with blood circulation, and the majority are gobbled up by the lungs, liver, and spleen (such as pulmonary circulation filtering and phagocytic effects on stem cells), resulting in only a minute fraction reaching the target organ, limiting their therapeutic effect. Second, immune cells in the blood recognize and eliminate stem cells, further reducing their survival rates. Finally, shear forces within the blood circulation may damage stem cells and compromise their viability 35 .
Therefore, researchers have changed the conventional transplantation routes to boost the number of MSCs homing to the kidney. For example, the number of stem cells can be locally increased via direct intraparenchymal or subcapsular renal injections to treat renal disease36,37. This approach bypasses blood circulation, avoiding the problems of stem cells being swept away by blood flow, blocked by the vascular endothelium, or eliminated by the immune system, which significantly increases the retention rate of stem cells in the target tissue 38 . However, it carries the risk of direct injury to the renal parenchymal cells during puncture, potentially causing hemorrhage or hematoma. Moreover, stem cells only concentrate around the injection site, making it difficult to distribute them evenly throughout the kidney; as a result, the reparative effect may remain localized, leaving other lesion areas inadequately treated. Hence, some researchers have adopted direct intrarenal-arterial transplantation of stem cells. Compared with intravenous infusion or local injection, this route delivers stem cells directly into the kidney’s blood circulation, causing the accumulation of more stem cells within the renal tissue while minimizing their dispersion to other organs39,40. However, this approach requires open surgery, which may impede recovery. Therefore, based on previous studies, this study adopted ultrasound-guided intrarenal-arterial transplantation of MSCs. Because of their proven advantages of safety, minimal invasiveness, and low risk, they have been widely adopted in clinics41–43. To ensure both the safety and efficacy of the puncture, this study first used two-dimensional ultrasound, color Doppler, and spectral Doppler ultrasound to observe and identify the renal artery. After confirming the location and evaluating its safety in relation to the surrounding tissues, a puncture needle was introduced into the renal artery to infuse the stem cells. This study confirmed the excellent local safety of renal artery-based MSC transplantation. First, in terms of hemodynamics, no significant renal artery pressure spikes or hemodynamic instability were observed after controlling the injection rate and dosage. Immediately after injection, the system was pressurized for 30 min, followed by two-dimensional and color Doppler ultrasound examinations to monitor the formation of renal artery aneurysms or perirenal hematomas. No renal infarctions were observed. These findings suggest that the procedure did not cause severe mechanical or vascular damage. Second, although the arterial injection of MSCs theoretically carries the risk of capillary embolism, the rigorous cell suspension preparation protocol (avoiding cell aggregation) and pre- and post-injection ultrafine blood flow contrast imaging of renal vessels at all levels demonstrated no abnormal flow signals, velocity, or resistance indices in the renal arteries post-injection. This effectively mitigates the risks. Renal artery-based MSC injections, performed under strict operational standards, represent a safe and feasible strategy for renal-targeted therapy. IVIS imaging revealed that ultrasound-guided renal artery infusion of stem cells resulted in a more extensive renal distribution than that of other transplantation methods. These results validate the efficacy and safety of ultrasound-guided renal artery-based MSC transplantation. More notably, IVIS imaging revealed that ultrasound-guided intrarenal-arterial infusion resulted in the accumulation of more MSCs within the kidney than other transplantation routes. These findings demonstrate that ultrasound-guided intrarenal-arterial transplantation of MSCs is effective and feasible.
Next, we investigated the mechanisms by which MSCs homing to the kidney ameliorated rat AN. In AN, multiple signaling pathways and molecular abnormalities are activated or dysregulated, which are involved in renal injury by mediating oxidative stress, inflammation, apoptosis, and fibrosis44,45. The classical JAK2/STAT pathway associated with renal injury was identified for the first time in this study. In AN, after ADR binds to its receptor, JAK2 is phosphorylated and activated, and the transcription factor STAT is phosphorylated, enabling it to enter the nucleus as a dimer, bind to target genes, and regulate the transcription of downstream genes, governing renal cell proliferation, differentiation, and apoptosis46,47. In the context of renal inflammation, fibrosis, and functional impairment, this study found that inflammation-related proteins were upregulated in the kidneys of AN rats, characterized by marked increases in JAK2, AKT1, PI3K, mTOR, and STAT. In addition, the levels of inflammatory cytokines IL-1β, IL-10, and IL-6 were markedly elevated and can release anti-inflammatory factors, such as IL-10 and prostaglandin E2 (PGE2), through paracrine actions48,49. These factors can block JAK2 activation in two ways: On one hand, anti-inflammatory factors, such as IL-10, can bind to corresponding receptors on the surface of immune cells in renal tissue, inhibiting the synthesis and release of pro-inflammatory factors (e.g. IL-6 and IFN-γ) through downstream signaling, reducing the activation signals of the JAK2/STAT pathway upstream 50 . In contrast, PGE2 can act directly on renal tubular epithelial cells and renal interstitial fibroblasts, competitively binding to pro-inflammatory factor receptors and inhibiting the interaction between receptors and JAK2, directly blocking the phosphorylation of JAK2 and reducing the phosphorylation levels of downstream STAT proteins 51 . In this study, the expression levels of pro-inflammatory factors, such as IL-6 and IL-10, in the renal tissues of the ultrasound-guided renal artery-transplanted MSCs treatment group were significantly reduced, consistent with the downregulation of JAK2, AKT1, STAT1, and STAT3. This further confirms the mechanism by which US-guided renal artery-transplanted MSCs inhibit the activation of the JAK2/STAT pathway through the secretion of anti-inflammatory factors. In conclusion, the above findings indicate that the JAK/STAT signaling pathway may be a fundamental cause of renal inflammation, fibrosis, and structural and functional damage in AN. Under ultrasound guidance, MSCs transplanted via the renal artery can ameliorate AN-induced renal injury by acting on the JAK/STAT signaling pathway.
Study limitations
This study had some limitations. ADR-induced AN is typically accompanied by damage to vital organs such as the heart and liver. However, it remains unclear whether MSCs confer indirect protection to these organs, which is one of our future research objectives. In addition, due to resource constraints, the interaction between the JAK2/STAT pathway and other fibrosis-related pathways (e.g. TGF-β/Smad pathway) and oxidative stress was not thoroughly investigated. Subsequent research could address these issues and provide a solid theoretical foundation for optimizing MSC-targeted therapeutic strategies and improving clinical outcomes of patients.
Footnotes
Acknowledgements
We thank Huanghuang Xu and all our laboratory members for supporting this study.
Ethical Considerations
This article does not contain any studies with human. The animal study was approved by the Laboratory Animal Welfare and Ethics Committee of the Second Affiliated Hospital of Kunming Medical University (kyfeyxm2024005). The approval date is February 2024 (2024/02/18).
Author Contributions
CX, XH, BL, and JW performed the experiments. CX, XH, and BL are responsible for the analysis and interpretation of the data. BL and JW participated in manuscript writing. YK and JW designed the experiments and revised the manuscript. CX provided financial support. All authors have read and approved the final manuscript.
Funding
The authors disclosed receipt of the following financial support for the research, authorship, and/or publication of this article: This work was supported by grants from the Yunnan Applied Basic Research Projects-Joint Special Project (202401AY070001-339) and Yunnan Provincial Education Department Scientific Research Foundation (2024J0226).
Declaration of Conflicting Interests
The authors declared no potential conflicts of interest with respect to the research, authorship, and/or publication of this article.
Data Availability Statement
All data generated or analyzed during this study are included in this article. The datasets used during the current study are available from the corresponding author on reasonable request.
Statement of Human and Animal Rights
This article does not contain any studies with human or animal subjects.
Statement of Informed Consent
There are no human subjects in this article and informed consent is not applicable.