
Abstract
Incidence of neurodegenerative diseases such as Alzheimer’s, Parkinson’s, Huntington’s, and amyotrophic lateral sclerosis have increased dramatically as life expectancy has risen year-over-year, and can lead to neurologic changes. Neurological changes within the central nervous system, specifically the brain, include cell loss and deterioration that impact motor function, memory, executive function, and mood. Available treatments are limited and often only address symptomatic manifestations of the disease rather than disease progression. Cell transplantation therapy has shown promise for treating neurodegenerative diseases, but a source of autologous cells is required. Blastocyst complementation provides an innovative method for generating autologous neural cells. By injecting mouse induced pluripotent stem cells into a wild type mouse blastocyst, we generated a chimeric mouse brain derived of both donor and host neuronal and non-neuronal cells. At embryonic day 12.5 (E12.5), automated image analysis of mouse-mouse chimeric brains showed the presence of GFP-labeled donor-derived dopaminergic and serotonergic neuronal precursors. GFP-labeled donor-derived cholinergic precursor neurons and non-neuronal microglia-like and macrophage-like cells were also observed using more conventional imaging analysis software. This work demonstrates that the generation of mouse-mouse chimeric neural cells is possible; and that characterization of early neuronal and non-neuronal precursors provides a first step toward utilizing these cells for cell transplantation therapies for neurodegenerative diseases.

Introduction
Neurodegenerative diseases are incurable, age-dependent, or genetic component disorders that result in cell loss and deterioration in the nervous system 1 . In recent years, the increasing elderly population has driven the prevalence of neurodegenerative diseases such as Alzheimer’s disease (AD), Parkinson’s disease (PD), Huntington’s disease, and amyotrophic lateral sclerosis. These diseases impact memory, thought processing, language, problem-solving, and movement2–5. The neuropathology and physiology for these diseases are diverse; however, all of these diseases display a common characteristic in the loss of neurons. In some cases, microglia are implicated in disease pathology and are associated with increased inflammation and immune signaling, compromised blood–brain barrier, stress responses, and more6,7. For example, in AD there is loss of serotonergic neurons in the dorsal raphe nucleus and cholinergic neurons in the nucleus basalis and medial septal nucleus, while in PD, there is a loss of dopaminergic neurons in the substantia nigra pars compacta and cholinergic neurons on the nucleus basalis 8 . These brain regions are by no means an exhaustive list of affected areas. The manifestation of symptoms is dependent upon the affected brain regions that undergo neuronal loss 8 . Treatments for neurodegenerative disease are rather limited and mostly include (1) pharmacological agents to slow down the degenerative process or compensate for the neuronal loss; and (2) non-pharmacological interventions to improve quality of life9,10. Therefore, therapeutic approaches to replace the lost neuronal and non-neuronal cells may prove to be more effective.
Cell replacement therapy through methods like transplantation have shown to be a promising avenue of study. In a mouse AD model, researchers found that intranasal transplantation with human neural stem cells improve cholinergic dysfunction, neuroinflammation, synaptic loss, pericytic loss, and cognition 11 . Human neural stem cells may promote neurogenesis by regulating several proteins11,12. Other studies have used embryonic stem cells (ESCs) and induced derived pluripotent stem cells (iPSCs) as a source of cells to treat AD and PD models with memory and motion improvements after transplantation, respectively13,14. Further differentiated cells like specific neurons could provide therapeutic relief as well to neurodegenerative patients. For example, the transplantation of human fetal derived basal forebrain cholinergic cells improved memory function and migrated to damaged brain areas in a nucleus basalis of Meynert lesioned rat model 15 . Human chorion derived basal forebrain cholinergic progenitor cells improved cognitive function in brain areas in an amyloid beta induced rat model 16 .
Clinical trials of transplanted dopaminergic neuron precursor cells from human fetal brain tissue have resulted in the amelioration of movement disorders in patients with PD for over 25 years after transplantation, without the need for levodopa medication17–19. The ethical concerns of using human fetal brain tissue as a source of cells for clinical transplantation, however, have resulted in the exploration of other sources of cells for implantation. The derivation of iPSCs via reprogramming of adult somatic cells, and the differentiation of these iPSCs into dopamine precursor cells have demonstrated efficacy in transplantation studies in animal models of PD, and are currently being evaluated in a limited number of phase I clinical trials14,20–22. However, studies evaluating the efficacy of differentiated iPSCs compared to primary cells demonstrated limitations. These included different transcriptional expression profiles, limited engraftment of transplanted cells, including short extensions for neurite outgrowth, no synapse formation, requirement for more tyrosine hydroxylase (TH) positive cells in the graft to reverse behaviors, and risk for graft overgrowth in the iPSC derived cells after transplantation23,24. The results from these studies suggest that dopamine precursor cells generated from this approach are not completely reprogrammed to function as authentic precursor cells.
Blastocyst complementation is a method to generate authentic exogenic cells, tissues, and complete organs from one species within the body of another that behaves as a biological incubator 25 . A typical blastocyst complementation approach involves generating a developmental niche by ablating a gene of interest in the early host embryo, for a specific tissue or organ, which is followed by microinjecting donor pluripotent stem cells (PSC) into the genetically modified host blastocyst 26 . The progeny of the donor cells should fill this developmental niche. Past studies have successfully generated intraspecies (e.g., mouse-mouse) and interspecies (e.g. rat-mouse) chimeric liver, forebrain, kidney, pancreas, lung, thyroid, eye, heart, and vascular system via blastocyst complementation, and some of these studies highlight functionality of these exogenic organs such as insulin production27–33.
Blastocyst complementation of the nervous system has only begun to be explored in the last decade as a method of repair. Neurog1+/--deficient mice complemented with donor mouse PSCs successfully formed donor-derived inner ear sensory neurons, correcting for the typical ear malformations observed in these mice 34 . An additional study used a targeted ablation of dorsal telencephalic progenitors expressing Emx1 during development, causing agenesis of the cerebral cortex and hippocampus. Donor embryonic stem cells injected into these genetically engineered blastocysts resulted in morphological and neurological normal brain tissue 35 . More recent studies have begun to explore the brain as an organ that can also be generated through more traditional methods of blastocyst complementation. A recent approach used several gRNAs and CRISPR to generate both intraspecies mouse-mouse and interspecies rat-mouse chimeric animals with chimeric brains 36 . Another group sought to generate wild type rat-mouse chimeras to study the functional circuitry of the rat and mouse neurons 37 . Yet, these studies lack characterization of the specific neural and non-neural cells developing within these chimeric brains. A basic understanding of intraspecies mouse-mouse chimeras can provide insight into donor-derived cellular heterogeneity and the level of mosaicism observed in various brain regions.
Donor cell contribution has become one of the driving outcomes for determining the success of blastocyst complementation or microinjection of donor cells into unmodified blastocysts. Donor cells microinjected into wild type (WT) blastocysts can contribute and form interspecies chimeras, and mores specifically brain regions37,38. As the generation of the nervous system is rather novel among blastocyst complementation studies, a basic understanding of donor cell contribution must be conducted in intraspecies chimeras to provide a foundation for future blastocyst complementation studies. Additionally, to evaluate the use of these cells for future transplantation therapies, understanding what types and what proportions of precursors are present will be helpful to determine if WT chimeras alone can provide a sufficient number of cells for transplantation 39 . Here, we focused on characterizing and quantifying a portion of those cell phenotypes in the brain that may prove to be beneficial for neurodegenerative diseases.
Past chimeric studies report a wide range of methods to quantify donor cell contribution in on- and off- target tissues, these quantification methods include: fluorescent-activated cell sorting (FACs), polymerase chain reaction (PCR), manual or software-assisted cell counts from tissue histology or a combination of both29,36–38. Each method offers advantages and disadvantages. For example, FACs and PCR enable accurate quantification, but require the dissociation of the tissue providing less context about the integration of those cells in space. For quantification methods that use image analysis, there are methodological differences in terms of plane, size, and quality of tissue sections, regions of interest analyzed, the degree of automation, software platforms, cost, and learning curves. These distinct differences indicate that there is an opportunity to explore methods to increase intra- and inter-laboratory reproducibility among chimeric efficiency.
In the current study, we have generated WT intraspecies (mouse-mouse) with microinjection of donor cells into WT blastocysts, for the purpose of studying neural and non-neural cells found within the developing brain. Donor cells formed various neural cell types and contributed to the early developmental brain regions of embryonic day 12.5 mouse-mouse intraspecies chimeras that will become the nucleus basalis, medial septal nucleus, substantia nigra pars compacta, and the dorsal raphe. To explore these brain regions, we have developed a quantification methodology using automated imaging (AI) for two cell types with a tolerable learning curve to collect cell counts of neuronal precursor cells with more consistency. We have also developed an analysis protocol for cell types with simpler morphology (e.g., more round) to collect cell counts for cholinergic/oligodendrocyte precursor and microglia-like cells.
Methods
Cell lines: mouse induced pluripotent stem cells (miPSCs)
The UMN-3F10 miPSC line was generated to express a transmembrane bound eGFP 40 . The miPSCs were cultured on irradiated mouse embryonic fibroblasts (#PSC001, R&D Systems, Inc., Minneapolis, MN) in miPSC medium composed of knockout DMEM with 4.5 g/l D-glucose and sodium pyruvate (#10829018, Thermo Fisher Scientific), 10% GibcoTM KnockoutTM serum replacement (#A3181501, Thermo Fisher Scientific, Waltham, MA), 10% fetal bovine serum (#SH30071.02HI, HyClone, Logan, UT), 1X GibcoTM MEM non-essential amino acids (#11140050, Thermo Fisher Scientific), 1X GibcoTM GlutaMAX (#35050061, Thermo Fisher Scientific), 0.1 mM 2-mercaptoethanol (#31350010, Thermo Fisher Scientific), 1X CorningTM penicillin/streptomycin (#30002CI, Thermo Fisher Scientific), and 1000 U/ml ESGRO-LIF (#ESG1107, Millipore Sigma, Burlington, MA). The cells were incubated at 37°C, 5% CO2.
Animals
All research involving mice was approved by the University of Minnesota Institutional Animal Care and Use Committee. Mice had a light cycle of 14:10-h light:dark cycle, with lights on at 6:00 a.m. Surrogate female mice were fed Teklad 2919 diet and all other mice were fed Teklad 2918 diet. Mice were housed in individually ventilated micro-isolator cages on corn-cob bedding and enviro-dri enrichment.
Mouse zygote isolation
The chimeric embryos were generated, using 3- to 4-week-old female C57BL6/J mice (Jackson Laboratory, Bar Harbor, ME) that were superovulated using pregnant mare’s serum gonadotropin (5 IU/female, i.p.; National Hormone and Peptide Program, Harbor-UCLA Medical Center, Torrance, CA) at 1:00 p.m. followed 48 h later with human chorionic gonadotropin (5 IU/female, i.p.; National Hormone and Peptide Program) and immediately mated with C57BL6/J stud males. Female mice were checked for the presence of virginal plug the following morning; this is considered embryonic day 0.5 (E0.5). The Cumulus-Oocyte Complexes (COC) were collected from all plugged females and then were treated in 3.5 ml of 0.28 mg/ml hyaluronidase (#H4272, Sigma-Aldrich, St. Louis, MO) in mHTF for no more than 2–5 min. The zygotes were collected and washed in mHTF before being transferred to a drop of mHTF, cultured at 37°C with 5% CO2 until they reached the blastocyst stage (E3.5), approximately 72 h later. The miPSC injected blastocysts were transferred to the CD-1 (Charles River, Wilmington, MA) pseudo-pregnant female mice.
Preparation of miPSCs for blastocyst injection
miPSC cultures were first washed in 1X PBS without calcium or magnesium (#14190144, Thermo Fisher Scientific), followed by exposing cultures to 0.1 ml/cm2 0.25% Trypsin (#59428C, Sigma Aldrich) for 1 to 3 min at 37°C. Trypsin was neutralized with miPSC media, single cell suspension was collected, and centrifuged at 1200 rpm (300 × g) for 4 min. miPSCs were re-suspended in 1 ml of miPSC media, transferred to a 1.5 ml microcentrifuge tube, placed on ice for transport to the injection suite, and injected within the next 2 h. Cells were used between passages 10 and 15.
Mouse blastocyst injection and embryo transfer
The blastocysts were injected with eGFP-labeled mouse induced pluripotent stem cells (miPSCs) from the UMN-3F10 line. Those miPSCs were mixed with blastocysts in a drop of EmbryoMax M2 media (#MR-015-D, Millipore Sigma, Burlington, MA) for the injection. Approximately 5–15 miPSCs were microinjected into the blastocoel cavity of each blastocyst. After blastocyst complementation, injected blastocysts were placed into mHTF drops under mineral oil and incubated at 37°C, 5% CO2 before transferring to the surrogate mothers. The complemented embryos were then transferred into the uteri of E2.5 pseudo-pregnant female mice as previously described 27 . Supplemental Table S1 includes additional information on number of injected and transferred blastocysts and the number of chimeras that were generated.
Mouse embryo extraction for immunohistochemistry
Post-implantation embryos were harvested from pregnant mice that were euthanized via carbon dioxide asphyxiation followed by a pneumothorax between 8 a.m. and 11:30 a.m. on embryonic day 12.5 (E12.5). Uteri were quickly dissected and placed in ice-cold PBS and transported back to the lab on ice for further dissection in a PBS filled petri dish on ice to isolate conceptuses. Embryos were extracted in a fresh petri dish on ice with PBS under a stereomicroscope. Whole embryo images were taken on a fluorescent stereoscope (Leica). Chimeric embryos expressed GFP throughout the body, which was detectable through the eye pieces and camera on the fluorescent stereoscope. WT embryos expressed no detectable GFP signal.
Immunohistochemistry
Wild type mouse embryos and complemented mouse-mouse were harvested at E12.5, and immersion-fixed with fresh 4% paraformaldehyde (PFA; #J19943K2, Thermo Fisher Scientific) in PBS overnight at 4°C. Embryos were rinsed in PBS and then cryoprotected by immersion in increasing concentrations of sucrose in PBS up to 30%. The final sucrose immersion was removed from the embryos by dabbing with a paper towel, and samples were embedded in Tissue Plus O.C.T. Compound (#4585, Fisher HealthCare) and snap-frozen on dry ice. Cryosections of 14 μm thickness were cut in the sagittal plane for the brain on a Leica cryostat (Wetzlar, Germany). Slides dried completely prior to being stored at −20°C until the day of staining. Frozen sections were placed on a heating block for 15 to 20 min before antibody staining. Sections were surrounded by a hydrophobic barrier (Vector Labs ImmEDGE hydrophobic barrier pen, Newark, CA). Sections were fixed with 4% PFA for 5 min, followed by three rinses with PBST containing 0.1% Triton X-100 for 5 min. Nonspecific binding was blocked with 10% normal donkey serum (#017-000-121, Jackson ImmunoResearch, West Grove, PA) in PBST. Sections were incubated with primary antibodies overnight at 4°C, then incubated with secondary antibodies and counterstained with DAPI (#D1306, InvitrogenTM, Waltham, MA) for 2 h at RT (see antibody information in Supplemental Tables S2 and S3).
Imaging
All immunohistological imaging was performed on a Nikon TiE inverted light microscope using a SPECTRA3 light source (Lumencor), a 20X Plan Apo (NA 0.75) objective, and a Hamamatsu ORCA-Flash4.0 V2 camera. The exposure time for a given antibody was selected to maximize the signal-to-noise ratio. Images were acquired and analyzed using the NIS elements advanced research software (Nikon). Images were exported as raw .nd2 files for analysis.
Slides for imaging and immunohistochemistry were selected using the Allen Brain Atlas: Developing Mouse Brain to identify E12.5 brain regions for the regions that will develop into the substantia nigra (SNpc), dorsal raphe nucleus (DRN), nucleus basalis (NB), and the medial septal nucleus (MSN). The Developing Mouse Brain atlas only provides E13.5 atlases for reference. These atalses were used as a guide for determining the correct region for imaging and analysis, based on similar anatomical structures in the E12.5 brains. Due to some variability in slicing of these small samples and the thinness of the sections, we used two sections for most regions as a reference point, which can be found in Supplemental Fig. S1.
Image processing: AI-based dopaminergic and serotonergic precursor neuronal cell quantification
Data were sampled from WT (n = 5 to 6) and mouse-mouse chimeras (n = 5 to 6) depending on the brain region and available sections. Analysis was performed in Nikon NIS-Elements AR software (version 6.10.01) with General Analysis (GA3) and NIS.ai software modules.
For analysis, a 20X stitched image with a z thickness of 14 µm for dopaminergic and cholinergic precursor neurons and 10 µm for microglia and macrophages was captured in the region of interest from all samples. For analysis of the serotonergic precursor neurons, a 20X stitched image with no z thickness was used because of the antibody sensitivity that led to bleaching with a z acquisition. Images with z thickness were then compressed into an EDF for future analysis steps.
For the AI quantification of dopaminergic and serotonergic precursor neurons, images were processed in GA3 with batch processing. Batch processing allows all images to be processed with identical parameters across the samples. For serotonergic neurons, the process was (1) denoising; (2) local contrast; (3) rolling ball; and (4) segment_ai. The SegmentObjects.ai module was trained for 15 iterations on images of WT mice manually segmented with neuronal markers tryptophan hydroxylase 2 (TPH2) for serotonergic precursors to a training loss of 0.0617. This module was then used for automating the detection of individual TPH2 positive cells in the processed images. After the AI-dependent detection process was complete, an operator inspected images for errors and made manual corrections to the detected cells.
Next, in a second batch process with GA3, GFP expression was analyzed without any operator input to eliminate bias. The GFP channel of each analysis was processed with (1) local contrast; (2) detect regional maxima; and (3) threshold of 1087 and greater to determine GFP-positive pixels. In another batch process with GA3 for DAPI expression, the DAPI channel was processed with (1) local contrast; and (2) bright spots, to define DAPI-positive pixels. Each identified neuronal cell was then determined to be GFP-positive or negative based on the overlap with the DAPI-positive signal and set of binary image layers from the AI detection. The number of cells was recorded for each image in Supplemental Table S4.
A similar process was followed for the dopaminergic precursor neurons, the process was (1) denoising; (2) local contrast; and (3) segment_ai. The SegmentObjects.ai module was trained for 5 iterations on images of WT mice manually segmented with neuronal markers tyrosine hydroxylase (TH) for dopaminergic precursors to a training loss of 0.03435. This module was then used for automating the detection of individual TH-positive cells in the processed images. After the AI-dependent detection process was complete, an operator inspected images for errors and made manual corrections to the detected cells. The same second batch processing method from the serotonergic analysis was followed for GFP and DAPI channels for the dopaminergic precursors. The number of cells was recorded for each image in Supplemental Table S5.
Image processing: cholinergic precursors and microglia/macrophage quantification using GA3 software
For cholinergic precursor neuron quantification, GA3 module in NIS-Elements, 16-bit multichannel images were processed with batch processing. To process the nucleus basalis region and medial septal nucleus, we followed standard protocol. The nucleic stain, DAPI, was used in the 405 channel, endogenously expressed GFP in the 488 channel, and Olig2 in the 647 channel. Bright spot detection was used in the DAPI channel to identify nuclei. Local contrast, sharpen, and threshold of 500 and greater were used in the 488 channel to identify GFP-positive cells. Local contrast, sharpen slightly, and threshold of 375 and greater were used in the 647 channel to identify Olig2 positive cells. These analysis steps were performed automatically and identically for each image. Cell counts that were derived from these image processing steps were counted and tabulated in Supplemental Table S6.
For microglia and macrophage quantification, GA3 module in NIS-Elements, 16-bit multichannel images were processed with batch processing. The nucleic stain, DAPI, was used in the 405 channel, endogenously expressed GFP in the 488 channel, Lyve1 in the 555 channel, and Iba1 in the 647 channel. Local contrast followed by bright spot detection was used in the DAPI channel to identify nuclei. Local contrast, sharpen, and threshold of 3005 and greater were used in the 488 channel to identify GFP-positive cells. Only the threshold of 500 and greater was used in the 555 channel to identify Lyve1 positive cells. Rolling ball, local contrast, threshold of 175 and greater were used in the 647 channel to identify Iba1 positive cells. These analysis steps were performed automatically and identically for each image. Cell counts that were derived from these image processing steps were counted and tabulated in Supplemental Table S7.
Statistical analysis
All statistical analysis was performed using GraphPad Prism (GraphPad Software). The cell count data acquired from the image processing section above was compared between the WT and all of a cell type in the mouse-mouse (M-M) animal using an unpaired two-tailed t-test. Further analysis was conducted with a repeated measures one-way ANOVA and multiple comparison’s test, Tukey test, comparing the M-M chimeras all of a cell type, GFP only of that cell type, and host only of that cell type. Donor and host cell contribution was analyzed with a paired two-tailed t-test. Some analyses had values that appeared to be outliers; these data were kept due to the diversity of chimeric contribution that can be seen when generating WT chimeras. Results were reported as mean + the standard error of the mean (SEM). Differences were regarded as statistically significant where the P-value was <0.05.
Results
Donor GFP-labeled stem cells generate mouse-mouse chimeric embryos with chimeric brains
Mouse-mouse chimeras were generated by performing superovulation and timed-mating to extract zygotes. Next, eGFP-labeled miPSCs were injected into WT blastocysts at embryonic day (E) 3.5 and transferred into surrogate pseudo-pregnant dams (Fig. 1a). Embryos collected at E12.5 generally showed robust GFP expression throughout the body (Fig. 1b). Upon further analysis, donor-derived GFP cells were observed in the mouse-mouse chimera brain compared to a WT brain with no GFP donor cells (Fig. 1c). The GFP-labeled cells contributed to both early neuronal and non-neuronal cells in the M-M chimeras with robust donor cell contribution (Fig. 1c). Previous studies demonstrated donor cell contribution to the brain via blastocyst complementation with mouse stem cells35,36. Our results confirmed the previous findings, and demonstrated on a broad scope that many cell types within the brain can be derived from the donor cells.
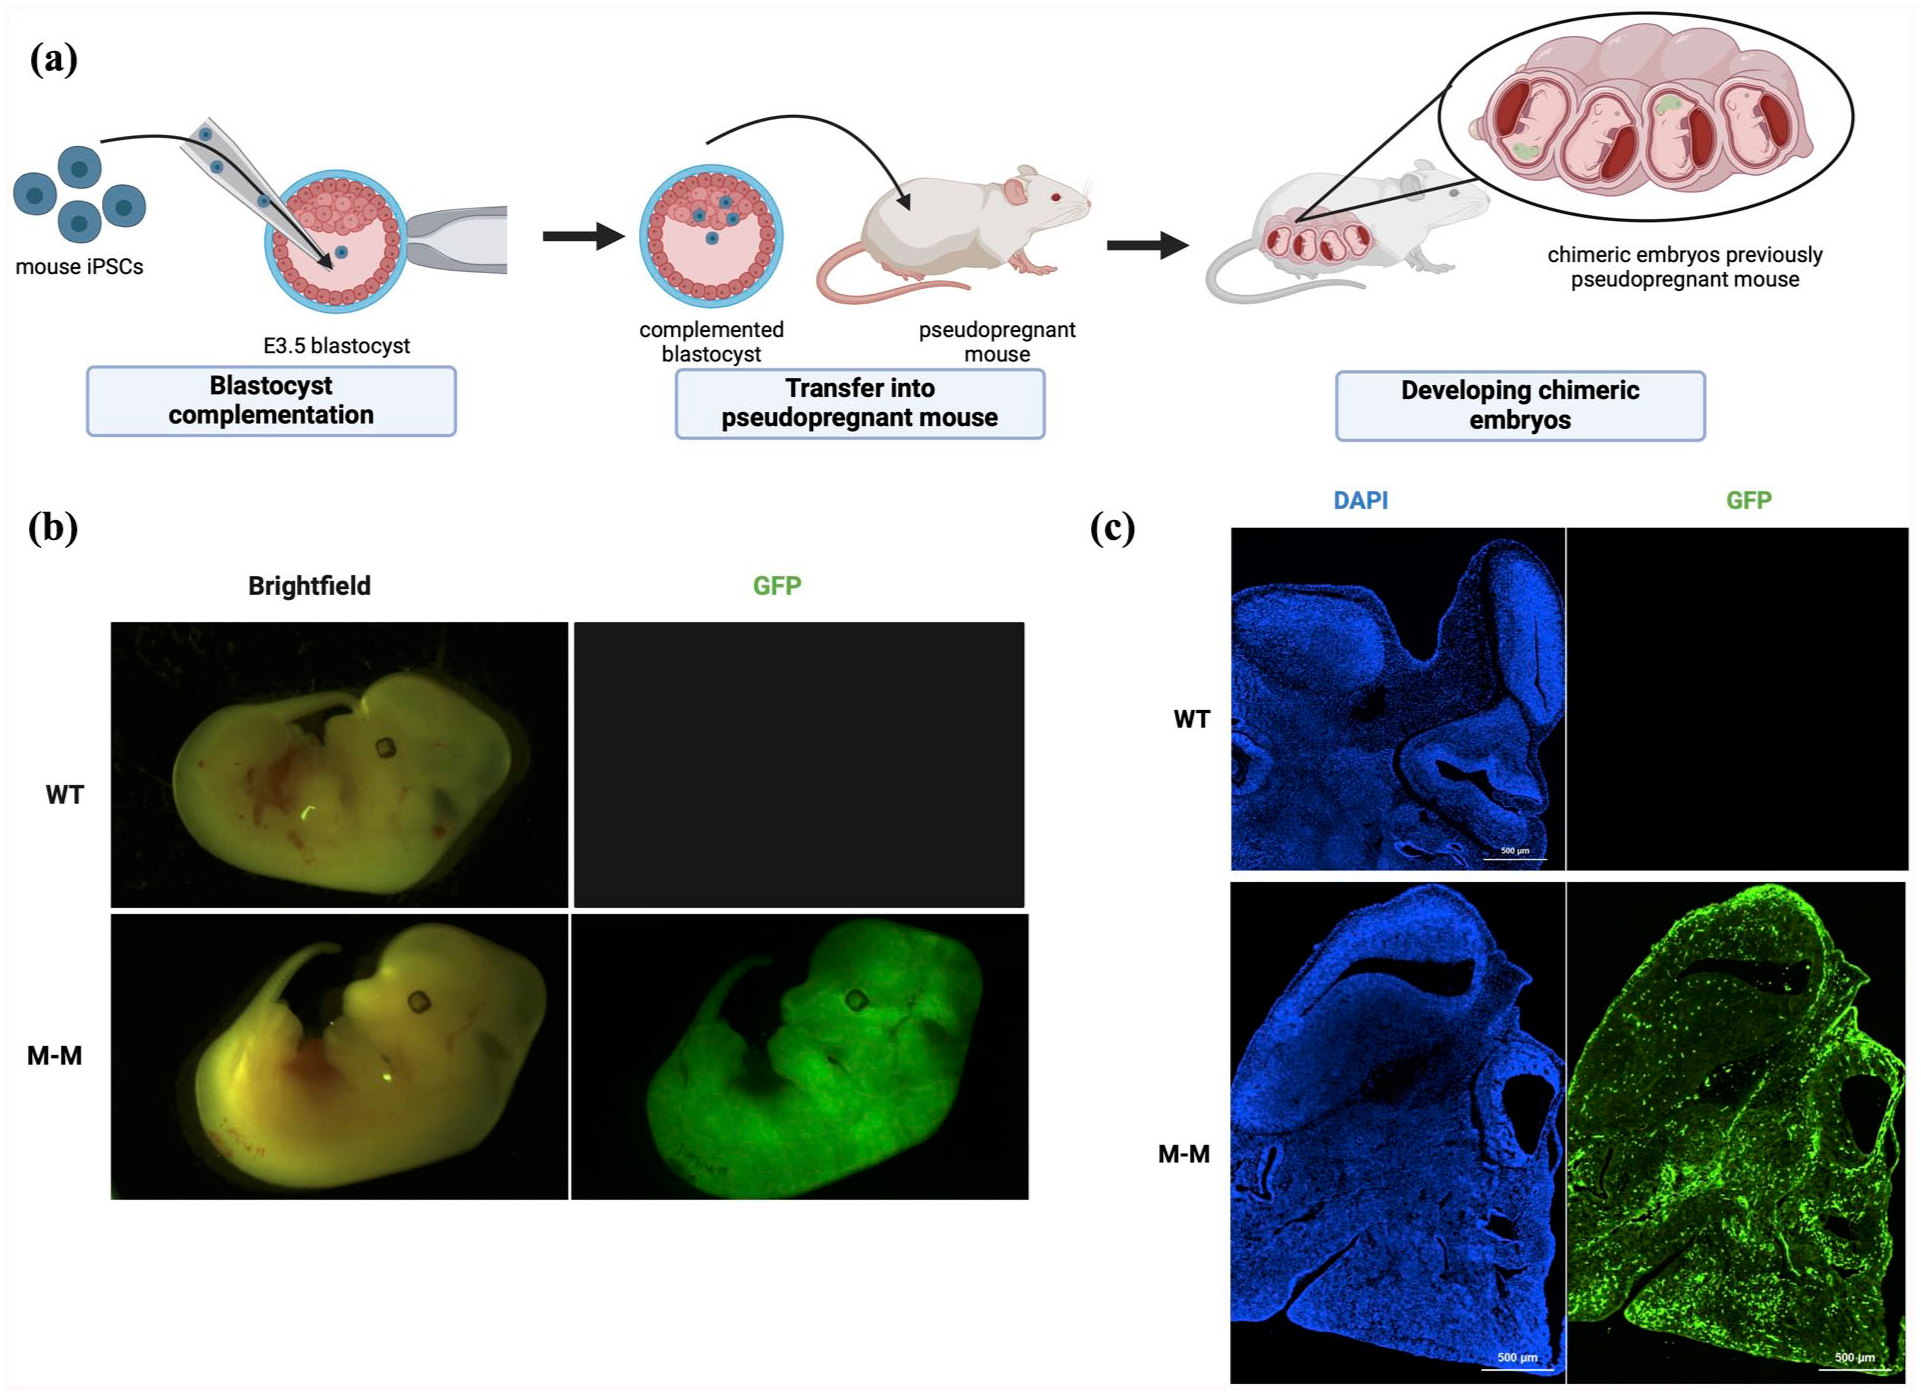
GFP-labeled donor cell robust expression and contribution in a WT M-M chimera. (a) Overview schematic of generating WT M-M chimeras. (b) Representative images of 12.5 WT and M-M whole embryos with robust GFP expression in the M-M chimera. (c) Representative images of 14 μm sections of E12.5 WT and M-M heads to show the presence of GFP-labeled donor cells throughout the M-M head and brain regions. Part of this figure was generated with the help of Biorender.com.
Donor stem cells contribute to relevant developing chimeric mouse-mouse brain regions
Donor cell contribution appeared throughout the M-M brain (Fig. 1b, c), in support of previously reported studies 36 . In the developing M-M chimeras, GFP-labeled cells were found in the developing brain regions of the DRN, SNpc, NB, and MSN (Figs. 3–6). Under further analysis, we have begun to characterize cell types in these developing brain regions that may be important for cellular replacement or transplantation therapies for neurodegenerative diseases.
AI quantification of serotonergic and dopaminergic neuronal precursors derived from GFP-labeled donor cells
We adapted an AI quantification workflow to detect the level of co-labeled neuronal precursor cells 41 (Fig. 2a). The AI-dependent cell detection allowed for the detection of a complex cell morphology with a more consistent and reliable cell counting system, while avoiding subjective human operator errors (Fig. 2b). AI-based workflows improved the sensitivity, morphology resolution, and reproducibility by developing a neural network to identify the cells of interest. By providing initial datasets with annotations from a human operator, the AI-detection develops a baseline framework for detecting the specific cells. This cell detection approach is refined by providing corrected annotations back to the neural network. The AI-detection continues to undergo deep learning on these corrected annotations. Novel data sets are then given to the neural network to improve its training further 42 . These AI-detection systems can then identify cells with the given cell morphology even if the samples have poorer tissue or staining quality 41 . An AI-detection software could be used by several users in the lab independent of an inter-operator variation in cell detection. Immunological fluorescent identification of serotonergic and dopaminergic neuronal precursors was performed with TPH2 and TH, respectively. The cellular markers were selected based on their expression in the developing brain regions of interest. TPH2 expression begins as early as E10 in mice and TH expression begins around E12.5 in mice.

Automated cell detection method. (a) Overview of automated neuronal or microglia donor cell analysis approach. Steps 1–3 and 5–6 were performed without an operator, so they were identical and automatic after initial setup. Initial Step 2 setup was completed by an operator to train AI, after setup this was completed without an operator. Step 4 was performed by an operator. (b) Representative images of the original image on the left contains GFP (green) from donor cells and TH (red) for the dopaminergic precursor cells. The AI-dependent detection contains the GFP (green) from the donor cells, and now the dopaminergic precursor cells (red) are outlined in pink. The circle and arrow indicate two different cell morphologies that the AI software can detect. Scale bar, 100 μM. This figure was generated with the help of Biorender.com.
The developing DRN region showed that WT and M-M chimeras had approximately the same quantity of total cells and total serotonergic precursors detected in the analyzed developing brain regions (Fig. 3a–c). The serotonergic precursor cells were derived from donor stem cells, observed by the co-localization of the GFP-labeled donor cells and TPH2, a serotonergic neuron marker. However, the donor-derived cell count mean of 118.7 was lower than that of the host-derived cell count mean of 384.3 (Fig. 3a, d). When examining the proportion of donor-derived compared to host-derived TPH2-positive cells, there was a significantly lower percentage of donor-derived TPH2-positive cells (Fig. 3d, e). These observations suggested that exogenic serotonergic precursors derived from GFP-labeled donor cells can be generated in an intraspecies chimera.
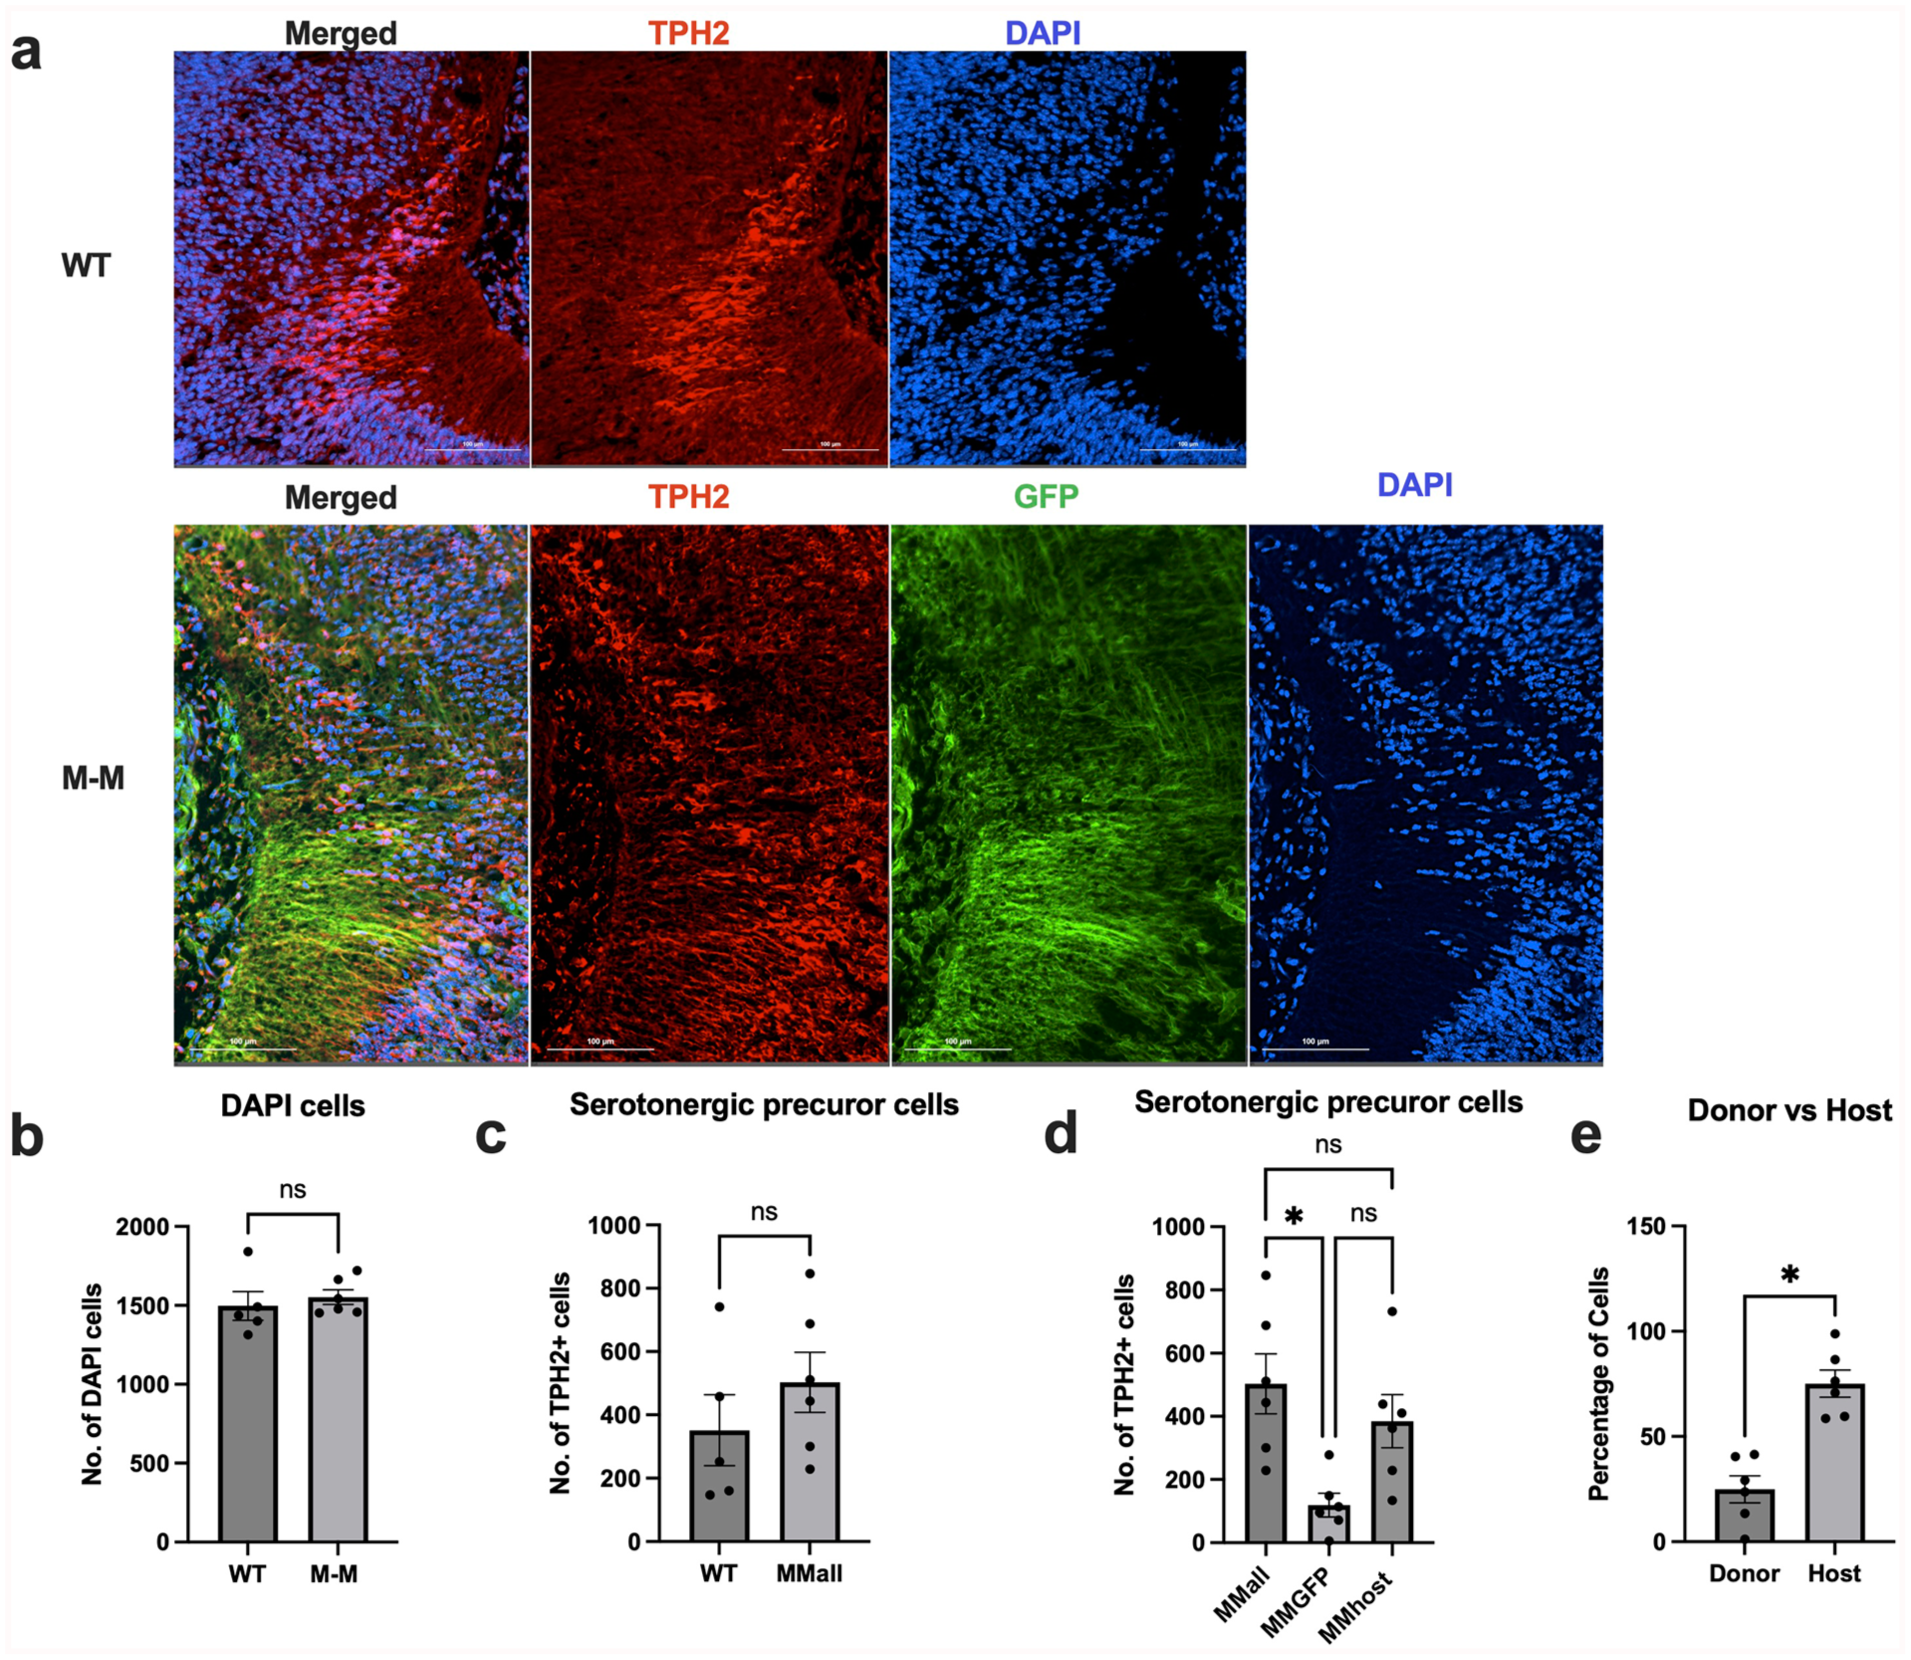
Quantification of serotonergic precursor cells in the E12.5 chimeric M-M brain. (a) Representative images from E12.5 WT and M-M developing region of the DRN, stained with TPH2–a serotonergic neuronal marker. (b) Total number of DAPI cells detected in the brain regions analyzed (unpaired t-test, p=0.5839). (c) Total number of TPH2-positive cells detected in the WT (n = 5) and M-M (n = 6) chimeras in the analyzed region (unpaired t-test, P = 0.3268). (d) Comparison of the total number of TH-positive cells detected within each M-M (n = 6) chimera that were also GFP-positive (MMGFP) and GFP negative (MMhost), with fewer serotonergic cells detected that were GFP positive (repeated measures one-way ANOVA, P = 0.0065). (e) Percentage of donor and host cell contribution to brain region under analysis with fewer donor-derived cells contributing to serotonergic cells found in the developing DRN (n = 6, paired t-test, P = 0.0112). P-values are indicated in the figure as follows: ns p>0.05 and *p ⩽ than 0.05.
Further examination of the SNpc, using TH to identify dopaminergic precursors, showed that WT and M-M chimeras had approximately the same quantity of total cells and total dopaminergic precursors detected in the analyzed developing brain regions (Fig. 4a–c). The dopaminergic precursor cells were derived from donor stem cells, as evident by the co-localization of the GFP-labeled donor cells and TH (Fig. 4a, d). We also observed dopaminergic precursors in the M-M chimeras that originated from host cells (Fig. 4d). The quantity of donor-derived TH-positive cells was about half of the total dopaminergic precursors detected (Fig. 4d, e). The degree of donor and host cell contribution of TH-positive cells showed no difference between the two groups, with ~ 50% coming from the donor and host cells (Fig. 4e). Together, these observations suggested that both serotonergic and dopaminergic precursors were derived from GFP-labeled donor cells. However, dopaminergic precursors have more equal proportions of cells derived from donor and host cells compared to serotonergic, as quantified with the use of AI-dependent cell detection methods. This suggests the percentage of donor cell contribution may be dependent on a given brain region and/or cell type.

Quantification of dopaminergic precursor cells in the E12.5 chimeric M-M brain. (a) Representative images from E12.5 WT and M-M developing region of the SNpc, stained with TH—a dopaminergic neuronal marker. (b) Total number of DAPI cells detected in the brain regions analyzed (unpaired t-test, P = 0.6436). (c) Total number of TH-positive cells detected in the WT (n = 5) and M-M (n = 6) chimeras in the analyzed region (unpaired t-test, P = 0.1462). (d) Comparison of the total number of TH-positive cells detected within each M-M (n = 6) chimera that were also GFP positive (MMGFP) and GFP negative (MMhost) (repeated measures one-way ANOVA, P = 0.1718). (e) Percentage of donor and host cell contribution to brain region under analysis (n = 6, paired t-test, P = 0.8639). P-values are indicated in the figure as follows: ns p>0.05.
Quantification of cholinergic neuronal precursors derived from GFP-labeled donor cells
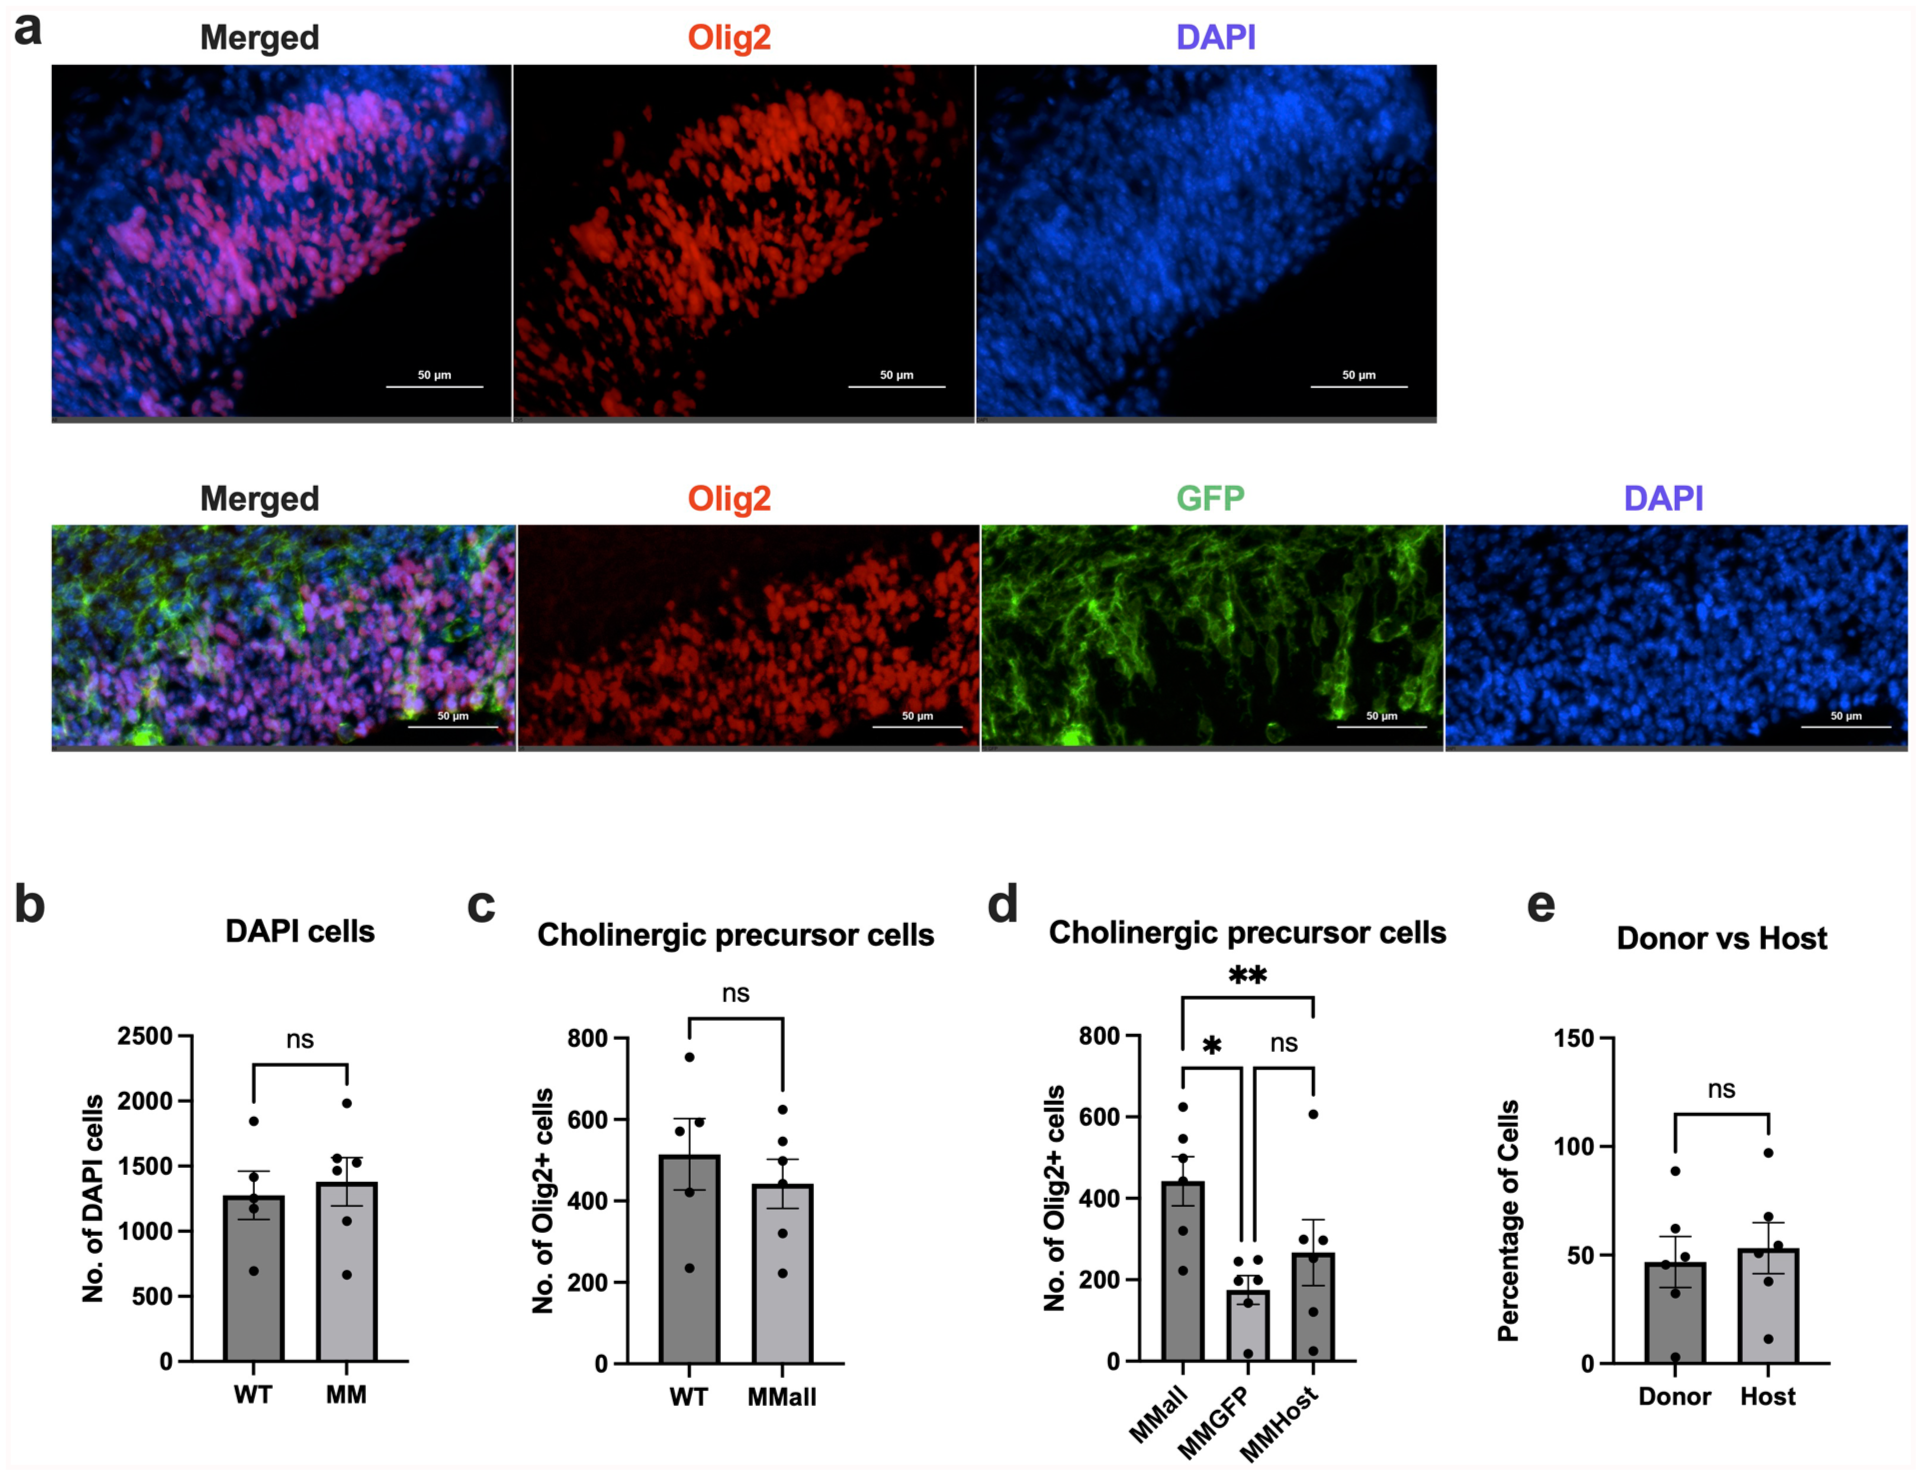
To examine the developing NB and MSN brain regions in the WT and M-M chimeras, we analyzed brain regions that had approximately the same quantity of total cells and total cholinergic precursors for the given brain region (Figs. 5a–c and 6a–c). An early marker for cholinergic cell development, Olig2 was selected to identify possible cholinergic neurons expressed at E12.5 43 . The Olig2 marker is a cell marker that denotes the cells for this study as cholinergic precursors. The NB contained cholinergic precursor cells derived from donor stem cells, as observed by the co-localization of the GFP-labeled donor cells and Olig2 (Fig. 5a, d). Cholinergic precursors in the M-M NB also originated from host cells (Fig. 5d). We noted a greater cell count of donor-derived Olig2-positive cells than that of the Olig2-positive host cells (Fig. 5d, e). These donor and host cell counts are almost significantly different from the total number of Olig2-positive cells that should develop within this region in the M-M chimera (Fig. 5d).

Quantification of cholinergic precursor cells in the E12.5 chimeric M-M developing NB brain region. (a) Representative images from E12.5 WT and M-M developing region of the NB, stained with Olig2–a cholinergic precursor marker. (b) Total number of DAPI cells detected in the brain regions analyzed (unpaired t-test, P = 0.3016). (c) Total number of Olig2-positive cells detected in the WT (n = 6) and M-M (n = 6) chimeras in the analyzed region (unpaired t-test, P = 0.2642). (d) Comparison of the total number of Olig2-positive cells detected within each M-M (n = 6) chimera that were also GFP positive (MMGFP) and GFP negative (MMhost) (repeated measures one-way ANOVA, P = 0.0583). The donor-derived cells and host cells are nearly different from the total number of Olig2-positive cells that should develop in that space (Tukey’s comparisons test: MMall vs MMGFP, P = 0.0737; MMall vs MMhost P = 0.0538). (e) Percentage of donor and host cell contribution to brain region under analysis (n = 6, paired t-test, P = 0.4210). P-values are indicated in the figure as follows: ns p>0.05.
Quantification of cholinergic precursor cells in the E12.5 chimeric M-M developing MSN brain region. (a) Representative images from E12.5 WT and M-M developing region of the MSN, stained with Olig2–acholinergic precursor marker. (b) Total number of DAPI cells detected in the brain regions analyzed (unpaired t-test, P = 0.7033). (c) Total number of Olig2-positive cells detected in the WT (n = 5) and M-M (n = 6) chimeras in the analyzed region (unpaired t-test, P = 0.5012). (d) Comparison of the total number of Olig2-positive cells detected within each M-M (n = 6) chimera that were also GFP positive (MMGFP) and GFP negative (MMhost) (repeated measures one-way ANOVA, P = 0.0603). The donor-derived cells and host cells were significantly different from the total number of Olig2-positive cells that should develop in that space (Tukey’s comparisons test: MMall vs MMGFP, P = 0.0479; MMall vs MMhost P = 0.0096). (e) Percentage of donor and host cell contribution to brain region under analysis (n = 6, paired t-test, P = 0.7979). P-values are indicated in the figure as follows: ns p>0.05, *p ⩽ 0.05, and **p ⩽ 0.01.
The MSN also contained cholinergic precursor cells derived from donor stem cells, as seen with the co-localization of the GFP-labeled donor cells and Olig2 (Fig. 6a, d). Cholinergic precursors in the M-M MSN also originated from host cells (Fig. 6d). The quantity of donor-derived Olig2-positive cells was lower than that of the Olig2-positive host cells, with no significant difference between the cell counts of the donor and host cells (Fig. 6d, e). A comparison of the donor-derived cells, host-derived cells, and total number of counted cells showed that the Olig2-positive donor cell count mean and Olig2-positive host cell count mean were significantly different than the total number of Olig2-positive cells present in the M-M chimera (Fig. 6d). The degree of donor and host cell contribution to Olig2-positive cells showed no difference between the two groups, with a slight trend in favor of more cells contributed from the host (Fig. 6e). Together these observations suggested that cholinergic precursors in the developing NB and MSN can be derived from GFP-labeled donor cells, but the number of GFP-derived cells detected within these regions may vary depending on the developing brain region.
Quantification of microglia-like cells and macrophage-like cells derived from GFP-labeled donor cells
As previously noted, we observed robust expression of GFP-labeled donor cells in neuronal and non-neuronal cells (Fig. 1c). Using a similar brain region across all samples for immunofluorescence and analysis, we generated microglia-like cells derived from GFP-labeled donor cells (Fig. 7a, c), as observed by the co-localization of GFP and IBA1, microglia and macrophage cell surface marker 44 . To distinguish microglia-like cells from macrophage-like cells, we stained samples with LYVE1, an endothelial and perivascular macrophage marker45,46. Therefore, cells double-positive for IBA1 and LYVE1 were macrophages, and cells positive for IBA1 and not LYVE1 were microglia-like cells. A similar quantity of microglia-like cells and macrophage-like cells were detected in the WT and M-M chimeras (Fig. 7b, e). Both donor and host-derived microglia-like cells and macrophages were observed, with greater numbers of cells derived from the GFP-labeled donor cells (Fig. 7c, f). There was a greater degree of donor cell contribution to microglia-like cells and macrophages compared to host cell contribution (Fig. 7d, g). Notably, the donor-derived macrophage-like cells were significantly more abundant compared to the host macrophage-like cells (Fig. 7g). The microglia-like cells trended in this direction but had one animal that had much fewer donor-derived microglia compared to host cells. These findings suggested GFP-labeled donor cells injected into an early-stage blastocyst, more readily contribute to microglia-like cells and macrophages in intraspecies chimeras, with one outlier with little donor cell contribution.

Quantification of microglia-like cells and macrophage-like cells. (a) Representative images of WT and M-M chimera, showing staining of Iba1 (red), Lyve1 (orange), GFP (green), and DAPI (blue). (b) Number ofIba1+Lyve1- cells detected in the WT (n = 6) and M-M (n = 6) chimeric animals (unpaired t-test, P = 0.9661). (c) The total number of microglia-like cells detected (M-M_all) cells detected in the M-M chimera (n = 6), along with the number of donor cells that expressed Iba1+Lyve1-GFP+ (M-M_GFP) and the number of host cells that expressed Iba1+Lyve1- (M-M_host) (repeated measures one-way ANOVA, P = 0.0584). (d) The percentage of microglia-like cells derived from the donor GFP-labeled cells compared to the host cells (n = 6, paired t-test, P = 0.1357). (e) Number of Iba1+Lyve1+ cells detected in the WT (n = 6) and M-M (n = 6) chimeric animals (unpaired t-test, P = 0.9735). (f) The total number of macrophage-like cells detected (MM_ all) cells detected in the M-M chimera (n = 6), along with the number of donor cells that expressed Iba1+Lyve1+GFP+ (M-M_GFP) and the number of host cells that expressed Iba1+Lyve1- (M-M_host) (repeated measures one-way ANOVA, P = 0.1419). The GFP-derived donor cell count showed that it was different from the control cell count of microglia-like cells in M-M chimera (Tukey’s comparisons test: MMall vs MMGFP, P = 0.0150). (g) The percentage of macrophage-like cells derived from the donor GFP-labeled cells compared to the host cells (n = 6, paired t-test, P = 0.0358). P-values are indicated in the figure as follows: ns p>0.05, and *p ⩽ 0.05.
Discussion
In this study, we have shown that characterization of intraspecies chimeras varies depending on cell type and brain region to produce chimeric M-M brains. Using donor and host from the same species, typically encourages higher levels of chimerism when using blastocyst complementation 29 . We found that the average percentage of donor cell contribution ranged from 50% to 80% depending on the cell type at E12.5 with microglia-like cells and macrophages having higher donor cell contribution compared to the neuronal precursors. The neuronal precursor contributions aligned with adult cortex and midbrain contribution as previously observed 36 . Despite the same species for the donor cells and host embryo, there was still large variability in donor-cell contribution in some cases within a cell type. For example, one M-M chimera had ~17% of microglia-like cells derived from donor cells and 83% derived from host cells. Another M-M chimera had ~2% dopaminergic precursor cells derived from donor cells and 98% derived from host cells. Thus, there appear to be some hurdles that exist within the blastocyst complementation field even for intraspecies chimeras, including the brain.
Our results underscore the significance of having a baseline for neuronal and non-neuronal cell types that can be produced in the developing intraspecies M-M brain. We found that GFP-labeled donor cells contributed less to overall levels of chimerism in neuronal precursors and specific developing brain regions than in non-neuronal cells, like the early macrophage-like cells. This suggests that there may be barriers that influence the success of a donor cell integrating into a particular cell type in a given region. For example, microglia and macrophage cells arise from the mesoderm germ layer that originates from the yolk sac, while neurons and other glial cells arise from the ectoderm47,48. Microglia appear in the yolk sac and in brain rudiment as early as E8 49 . Microglia are derived from primitive macrophages located in the embryonic yolk sac determined by in vivo fate mapping using Runx1, a gene that is restricted to yolk sac derived cells 50 . This was also evident by another study that examined a hematopoietic transcription factor, Myb, and found that it did not alter the generation of microglia 51 . While neural induction of the ectoderm occurs around E6.0-E8.5, it receives various inductive cues to form the neural plate (or neuroectoderm) followed by the neural tube 52 . Ultimately, microglia and neurons follow different developmental pathways, as these cell types originate from different germ layers. Thus, how and where these donor cells integrate during gastrulation influences part of their success in developing further along in the host. Additionally, there may be more conserved developmental cues in the generation of these myeloid lineages than in neurons.
A significant observation from our study was that donor contribution differed across brain regions such as in the nucleus basalis and medial septal nucleus with the same or similar cell types. Several factors may influence donor cell contribution in spatial specific regions with similar cell types. One key factor may be region-specific progenitor availability, as neurogenic niches within the basal forebrain show temporal and spatial heterogeneity in the proliferation of cholinergic and GABAergic precursors53,54. Additionally, the competition between the host and donor progenitor cells may determine the relative contributions since endogenous progenitors may be more dominant in certain regions of the brain, ultimately reducing the opportunity for donor cells to engraft 55 . The synchronization of donor and host cells is also thought to be crucial for proper integration. If the donor cells were to miss a developmental window of opportunity it may be the case that they fail to compete with the host cells effectively in regions where neurogenesis occurs early, such as in the medial septal nucleus 56 . Taken together, this suggests that donor contribution is highly region specific, shaped by developmental timing, local progenitor availability, as well as, host- donor competition. However, important recent work shows that even partial donor engraftment can yield functional outcomes.
More recent studies showed that WT chimeras can generate functional cells37,57. In some cases, these donor-derived cells have been shown to treat certain diseases such as liver fibrosis, and restore normal hepatocyte morphology and function 57 . This suggests that WT donor-derived may be sufficient to treat degenerative diseases. Successful liver regeneration with WT donor-derived cells does not necessarily equate to this approach being successful in nervous system regeneration, but it poses a key question. Are cells produced from a WT chimera a plausible source of cells to restore cells and function in the brain compared to a more complex source of cells that uses genetically modified systems like the Clustered Regularly Interspaced Short Palindromic Repeats (CRISPR)-Cas9 system to generate a developmental niche? Recent studies have begun to explore this question using the generation of interspecies brains using microinjection methods. Throesch et al. 37 found that rat embryonic stem cells integrated, differentiated, and restored neuronal circuits using WT donor cells and WT blastocysts. Huang et al. 36 used several guide RNAs to knockout Hesx1 in a blastocyst and WT donor cells to generate partial and full forebrains. Pluchino and Lombardi 58 address some emerging challenges of regenerative neuroscience related to the aforementioned studies and our study. These hurdles include low chimeric efficiency with CRISPR-Cas9 systems, xenogeneic barriers decreasing donor cell contribution in the brain, stochastic distribution of donor cells, and ethical considerations when moving to large animal models, such as the pig 58 . All of these challenges are reasonable and valid concerns within the regenerative neuroscience field. Throesch et al. 37 study showed donor cell contribution to various brain regions in WT rat-mouse chimeric brain, but did not focus on intraspecies brain development, early embryo brain development, and developing cell types within the brain. Our study aimed to generate a foundation to characterize some of these developing WT-derived neural cells, as a possible future means of cellular therapy.
Cell transplantation therapies have successfully engrafted and reversed cognitive and behavioral deficits of neurodegenerative disease models8,23,59. Cholinergic neurons extracted from the E14-E15 medial septal nucleus of rats have shown to engraft, express acetyl cholinesterase, and improve memory60,61. More recent studies have aimed to use stem-cell derived cholinergic neurons, which have also been shown to survive post transplantation, express choline acetyltransferase, and form functional synapses62,63. Fetal rat serotonergic neurons have also survived post-transplantation, innervated, and may restore serotonin levels64–66. Dopamine precursor cells from human fetal brain and iPSC-derived cells were shown to engraft and ameliorate movement disorders in PD patients14,17–21. As for non-neuronal cells, like microglia, that are implicated in neurodegenerative disease pathologies, these cells may ameliorate pathology and restore neurological function59,67. Our study identifies some of these neuronal precursors such as dopaminergic, serotonergic, and cholinergic cells, and non-neuronal cells like microglia-like cells in the WT mouse-mouse chimeric brain. The use of the characterized cells may be beneficial in future cell transplantation studies.
Several ethical complications exist with the generation of chimeras that include the contribution to the reproductive system and central nervous system (e.g., brain). Although our study focused on the brain, the observation that donor-derived cells are distributed throughout the embryo, as seen in E12.5 whole-body fluorescence (Fig. 1b), highlights concerns about off-target donor contribution(s) to germline or other sensitive tissues. One potential strategy to reduce these risks is the use of blastocyst complementation with targeted gene knockouts. Knocking out specific genes for the formation of specific organs or tissue of interest creates a developmental niche. For example, knockout of Pdx1 prevents pancreas development, which can then be complemented by donor stem cells to form a donor-derived pancreas 29 . Not only have previous studies generated pancreases with success but also a wide range of cells and organs, including inner ear sensory neurons, liver, forebrain, lymphocytes, kidney, lung, thyroid, and eye27,28,30,31,34,35,68. A targeted developmental niche represents a promising future direction to enhance both the safety and therapeutic potential of blastocyst complementation in regenerative neuroscience.
Conclusion
In summary, we have characterized plausible neuronal and non-neuronal precursor cells generated through blastocyst complementation that could be used in future cell transplantation therapies for neurodegenerative diseases. Our intraspecies complementation strategy focused on the first steps of characterizing these cell types and proportions of donor-cell contribution in these developing intraspecies chimeric brain regions. A limitation of this study is that it does not address the more complex goal of interspecies chimeras; however, a more simplified view of intraspecies chimeras provides a baseline for future studies.
Supplemental Material
sj-docx-1-cll-10.1177_09636897251384571 – Supplemental material for Characterization of the intraspecies chimeric mouse brain at embryonic day 12.5
Supplemental material, sj-docx-1-cll-10.1177_09636897251384571 for Characterization of the intraspecies chimeric mouse brain at embryonic day 12.5 by Phoebe Strell, Madison A. Waldron, Sether T. Johnson, Anala Shetty, Andrew T. Crane, Yun You, Clifford J. Steer and Walter C. Low in Cell Transplantation
Footnotes
Acknowledgements
The authors thank the University of Minnesota Imaging Core for imaging equipment used for this research; Alicia Strtak from Nikon Instruments for additional software training; Fig. 1 and 2 were created with the help of BioRender.com.
Ethical Considerations
The University of Minnesota Institutional Animal Care and Use Committee approved the experimental procedures used in this study (approval no. 2304-40989A) on 18 July 2024. All animals were housed, and experiments were conducted in strict accordance with institutional Guidelines for Care and Use of Laboratory Animals at the University of Minnesota.
Author Contributions
Conceptualization and experimental design—P.S. and W.C.L.; data collection and experiments—P.S., M.A.W., S.T.J., A.S., and Y.Y.; writing—original draft preparation—P.S.; writing—reviewing and editing—P.S., M.A.W., S.T.J., A.S., Y.Y, A.T.C., C.J.S., W.C.L.; visualization—P.S.; project administration—W.C.L. and C.J.S; funding acquisition—W.C.L. and C.J.S. All authors have read and agreed to the published version of the manuscript.
Funding
The author(s) disclosed receipt of the following financial support for the research, authorship, and/or publication of this article: This work is supported, in part, by NIH grants R01 DK117286 (C.J.S.), R01 DK117286-03S1 (C.J.S. and W.C.L.), and R01 AI173804-01 (C.J.S. and W.C.L.).
Declaration of Conflicting Interests
The author(s) declared no potential conflicts of interest with respect to the research, authorship, and/or publication of this article.
Data Availability Statement
The raw data that support the findings of this study are available from the corresponding author upon reasonable request.
Statement of Human and Animal Rights
This article does not contain any studies with human or animal subjects.
Statement of Informed Consent
There are no human subjects in this article and informed consent is not applicable.
Supplemental Material
Supplemental material for this article is available online.
References
Supplementary Material
Please find the following supplemental material available below.
For Open Access articles published under a Creative Commons License, all supplemental material carries the same license as the article it is associated with.
For non-Open Access articles published, all supplemental material carries a non-exclusive license, and permission requests for re-use of supplemental material or any part of supplemental material shall be sent directly to the copyright owner as specified in the copyright notice associated with the article.