
Abstract
This study presents an examination of whether the double overexpression of ZNF746 and cellular prion protein (PrPC) genes in rat adipose-derived mesenchymal stromal cells (ADMSCs) (ie, MSCDGe-OVE) offered enhanced protection to the livers of rats against ischemia‒reperfusion (IR) injury. The in vitro results revealed that compared with those of rat ADMSCs, cell activities (viability/proliferation/growth/cell cycle process) were significantly upregulated by the overexpression of either gene in rat ADMSCs and were further significantly increased by MSCDGe-OVE, whereas the expression of biomarkers of oxidative stress/ROS/apoptosis/fibrosis/autophagy decreased with increasing cell viability among the groups (all P < 0.001). Male adult SD rats (n = 50) were equally categorized into groups 1 (sham-operated-control), 2 (IR), 3 (IR-MSCOVE-PrPC), 4 (IR-MSCOVE- ZNF746), and 5 (IR-MSCDGe-OVE), and livers were harvested by day 3. By day 3, the number of circulatory inflammatory/immune cells, protein expression of oxidative stress/apoptotic/fibrotic/mitochondrial damage/autophagic biomarkers, and cellular levels of DNA damage/fibrosis/inflammation in the liver parenchyma were lowest in group 1, highest in group 2 and significantly lower in groups 3/4 than in group 5 (all P < 0.0001). Liver fibrosis detected by ultrasound and the liver injury score displayed identical patterns of circulatory levels of immune cells among the groups (all P < 0.0001). Upstream and downstream inflammatory and cell-stress signaling pathways were identified as playing crucial roles in acute liver IR injury. In conclusion, MSCDGe-OVE enhanced cell proliferation and growth and ameliorated IR-induced liver damage.

Keywords
Introduction
The liver, a vital organ, has important physiological functions in humans. The liver is a storage organ, participates in drug and metabolite and detoxification, produces bile juice, and secretes digestive enzyme for food digestion. However, the liver is well known to be quite vulnerable to damage by various factors/disease entities, such as hemodynamic instability/shock, resuscitation, drug intoxication, infectious sepsis, and ischemia‒reperfusion (IR) injury during cardiovascular surgeries or liver transplantation1–6. Among these factors1–6, IR injury is among the most common causes of liver damage1–7. In fact, acute liver IR injury can cause liver dysfunction and even liver failure, resulting in unacceptably high morbidity and mortality. Although advances in critical care for liver damage have improved survival from liver failure, in-hospital morbidity and mortality remain significantly high4,6. Therefore, finding a feasible and effective treatment modality for patients with acute liver IR and failure is highly important, especially for patients who are refractory to conventional therapy.
The underlying mechanisms involved in liver IR injury-associated liver failure have been thoroughly researched5,7,8. Plentiful evidence has shown that the generation of reactive oxygen species (ROS) after reoxygenation inflicts tissue damage and initiates a cellular cascade leading to inflammation, cell death, and ultimately organ failure5,7,8. Kupffer cells and T cells mediate the activation of neutrophil inflammatory responses and infiltration in the liver parenchyma5,9. In addition, investigators have indicated that the inflammatory reaction induced by IR frequently causes a cascade of proinflammatory mediators and the recruitment of activated leukocytes and granulocytes 1 , ultimately leading to hepatocyte death and liver necrosis. These issues1,5,7–9 lead to the hypothesis that suppressing the generation of oxidative stress and inflammatory reactions and increasing liver regeneration are ideal options for the treatment of liver failure.
Numerous investigations have shown that cell-based therapy provides a new therapeutic modality for ischemia-related organ dysfunction, especially in situations that do not respond to conventional therapies10–14. Mesenchymal stromal cells (MSCs), especially adipose-derived mesenchymal stromal cells (ADMSCs), have distinctive anti-inflammatory, antioxidant and immunomodulatory effects, as well as aid in tissue regeneration10–14. In this manner, ADMSC treatment has been proven to be effective and promising for protecting organs from ischemia or IR injury, which in turn preserves organ functional integrity10–18.
Cellular prion protein (PrPC), a small cell-surface glycoprotein, was originally identified for its critical role in the pathogenesis of neurodegenerative disorders 19 . Several studies have suggested that the prion protein has an additional role as an antioxidant20–24. PrPC-deficient cells and mice exhibiting PrPC-deficiency phenotypes were shown to be more vulnerable to exogenous oxidative stress19–24. Interestingly, our recent study revealed that valsartan and melatonin upregulated the expression of PrPC in ADMSCs and further modulated cell proliferation and tissue regeneration mainly through the activation of PI3K/AKT/mTOR signaling 25 . In addition, treatment with valsartan/melatonin-supported ADMSCs significantly decreased oxidative stress and effectively preserved residual renal function in chronic kidney disease (CKD) model rats 25 .
Zinc-finger protein (ZNF)746, with a Kruppel associated box at its N-terminus and a C2HC/C2H2-type zinc finger at its C-terminus, acts with Parkin as a ubiquitin E3 ligase or as a suppressor of peroxisome proliferator-activated receptor γ coactivator-1 (PGC-1) in neurodegeneration and Parkinson’s disease 26 . In addition, we previously demonstrated that melatonin-mediated downregulation of ZNF746 expression suppressed bladder tumorigenesis (ie, cell growth, migration, and invasion) mainly through inhibition of the PI3K/AKT-MMP signaling pathway both in vitro and in vivo 27 . Our recent study also revealed that ZNF746 signaling plays a key role in colorectal cancer cell proliferation and survival 28 . These findings suggest that the ZNF746 gene plays an extremely important role in cell proliferation and growth. However, no report has investigated the role of ZNF746 in AMDSC differentiation, proliferation, expansion and growth. According to the aforementioned reports, a rational belief is that double overexpression of the PrPC and ZNF746 genes in ADMSCs (MSCDOVE-ZNF746/PrPC) would be more effective than single overexpression of the ZNF746 gene or PrPC gene in ADMSCs in protecting against acute liver IR injury.
Materials and methods
Ethical issues
All animal procedures were approved by the Institute of Animal Care and Use Committee at Kaohsiung Chang Gung Memorial Hospital (Affidavit of Approval of Animal Use Protocol No. 2022031704) and performed in accordance with the Guide for the Care and Use of Laboratory Animals.
Transfection of ADMSCs with prion protein and ZNF746 expression vectors
For transfection, pCMV, pCMV-Flag-ZNF746, pCS6-PRNP and pReceiver-M68 PRNP were transfected into the corresponding cells with Lipofectamine 3000 (Invitrogen, Life Technologies, Carlsbad, CA, USA) according to the manufacturer’s instructions. Cells were replated 24 h before transfection at a density of 1 × 10⁶ cells in 10 ml of fresh culture medium in a 10-cm plastic dish. For use in transfection, 20 µl of Lipofectamine 3000 was incubated with 10 μg of the indicated expression vector at room temperature. The complex was incubated with cells at 37°C in a humidified atmosphere of 5% CO2 before being harvested.
Isolation of autologous ADMSCs
Adipose tissue surrounding the epididymis was dissected, excised and prepared on the basis of our previous reports13,29. Briefly, sterile saline (37°C) was added to the homogenized adipose tissue at a ratio of 3:1 (saline:adipose tissue), followed by the addition of stock collagenase solution to a final concentration of 0.2% (w/v). After centrifugation at 600 × g for 5 min at room temperature, the cell pellets were obtained, and an aliquot of the cell suspension was then removed for cell culture in Dulbecco’s modified Eagle’s medium (DMEM)-low glucose medium supplemented with 10% fetal bovine serum for 14 days.
Liver IR procedure
The procedure and protocol for acute liver IR in rats have been described in our previous reports8,30. Pathogen-free, adult male SD rats (n = 50) weighing 325–350 g were utilized in this study. After the abdominal skin and muscle layers (ie, laparotomy) were opened, the liver was identified, and the left lobe of the liver was dissected free from the surrounding ligaments. Hepatic ischemia was then induced by temporal obstruction of the vessels by placing a 4-0 silk loop around the hilar region of the left liver lobe in the liver IR groups, whereas sham-operated control (SC) animals received only laparotomy without undergoing hepatic ischemia. Reperfusion for 72 h was started 60 min later when the hilar occlusion was released.
Animal grouping
Animals were divided into group 1 [sham-operated control (SC) receiving laparotomy only plus systemic venous administration of fresh culture medium (DMEM) immediately and at 1 and 18 h after the operation], group 2 (acute liver IR only, ie, left liver lobe ischemia for 60 min followed by reperfusion for 72 h, plus systemic venous administration of fresh culture medium at 1 and 18 h after reperfusion), group 3, acute liver IR + intravenous administration of ADMSCs overexpressing PrPC (MSCPrPC-OVE) (1.2 × 10⁶) at 1 and 18 h after reperfusion, group 4, acute liver IR + intravenous administration of ADMSCs overexpressing ZNF746 (MSCZNF746-OVE) (1.2 × 10⁶) at 1 and 18 h after reperfusion, and group 5, acute liver IR + double overexpression of PrPC and ZNF746 in ADMSCs (MSCDGe-OVE) (1.2 × 10⁶) at 1 and 18 h after reperfusion. The dosage and time points of stem cell administration at 1 and 18 h after acute liver IR were selected on the basis of our recent reports13,29 with some modifications.
All the animals were euthanized 72 h after IR. Blood samples were collected before and after the liver IR procedure, and plasma samples were harvested for analyses of the aspartate aminotransferase (AST) concentration and circulating levels of inflammatory cytokines as well as markers for apoptosis, mononuclear cells, and immune cells. Liver specimens were acquired and then stored at −80°C for analyses of protein and mRNA expression. The tissues were also embedded in OCT or 4% buffered formaldehyde for cryosectioning and paraffin sectioning, respectively.
Noninvasive assessment of liver fibrosis
The entire liver was scanned in B-mode using a 3D motor and VisualSonics Vevo 3100 software (FUJIFILM VisualSonics Inc. Bothell, WA, 90821. USA). To ensure consistency between the animals and images, the optimized acquisition settings were stored in an instrument 31 . All B mode ultrasound images were captured under the same data capture settings (frequency = 30 MHz, frame rate = 16 images/s, gain = 30 dB, depth = 12 mm, dynamic range = 65 dB, width = 15.36 mm, persistence = high, and sensitivity = high) for each mouse. The optimal region of interest (ROI) plane was selected after B-mode analysis of 3D liver data to allow maximum liver plane coverage and to obtain organ orientation, avoiding vessels/organs in that ROI plane. The kidney was used as an internal reference to normalize signals in B mode ultrasound, and the renal cortex was also imaged for each animal. Pixel intensity [average intensity/mm2 (a.u.)] was calculated at three different areas for each transverse ROI plane, averaged and analyzed for each animal.
Histological assessment of liver injury
The criteria for scoring liver injury were described in our previous report 16 . Briefly, after the liver sections were subjected to hematoxylin and eosin staining, the degree of liver injury was assessed, and the liver injury score was defined as follows: 0—no notable impairment in hepatocyte integrity or sinusoidal distortion; 1—mild hepatic injury involving less than 25% of the section; 2—moderate hepatic injury involving 25% to 50% of the section; and 3—severe hepatic injury involving more than 50% of the section. For each rat, three liver sections were examined, and three randomly selected high-power fields (HPFs; 100×) were analyzed in each section. The mean score for each animal was then determined by summing all the numbers divided by 9.
Flow cytometric analysis
In the present study, a Beckman Coulter Gallios Flow Cytometer was used for flow cytometric analysis. Briefly, 72 h after liver IR, peripheral blood was collected to analyze inflammatory cell surface markers, myeloperoxidase (MPO), Ly6G, and CD11c/d, immune cell surface markers (CD3+CD4+ helper T cells, CD3+CD8+ cytotoxic T cells, and CD4+CD25+Foxp3+ Tregs), and apoptotic cells, ie, early (annexin V+/PI-) and late (annexin V+/PI+) phases of apoptosis.
Flow cytometric analysis for the identification of ROS levels in ADMSCs
Carboxy-H2DCFDA (Invitrogen) was used to examine intracellular ROS production. Carboxy-H2DCFDA dye was diluted with phosphate-buffered saline to achieve a concentration of 10 mM, and the plates were incubated at 37°C in 5% CO2 for 30 min. After incubation, the dye solution was eliminated, and the cells were washed with phosphate-buffered saline and further cultured for 30 min in fully defined culture medium. For mitochondrial ROS analysis in cells, the MitoSOX™ Red dye was directly replenished at a concentration of 10 nM for an additional 30 min incubation period. The fluorescence intensity was assessed by a Beckman Coulter Gallios flow cytometer.
Immunofluorescence (IF) and immunohistochemical staining
The procedure and protocol were based on our previous reports15–17. Briefly, sections were incubated with primary antibodies against PCNA (1:200; Cell Signaling Technology); double-staining antibodies against cytochrome C (1:500, Santa Cruz)/Hsp60 (1:1,000, Abcam), CD68 (1:500, Abcam), Kupffer cells (ie, stellate macrophages) (1:200, Invitrogen) and γ-H2AX (1:500, Abcam), while sections were incubated with irrelevant antibodies as controls. Three liver sections from each animal were analyzed.
In addition, for identification of the morphology and structure of mitochondria, we conducted the IF microscopic study with a HPF of 1,200× to identify the mitochondrial length (referred to Supplemental Fig. 1).
Histological study of liver fibrosis
The procedure and protocol were based on our previous reports15–17. Briefly, Masson’s trichrome was used to assess fibrosis in the liver parenchyma. Three 4-µm-thick serial sections of liver parenchyma were prepared using a cryostat. The integrated area (µm2) of fibrosis in each section was calculated using Image Tool 3 (IT3) image analysis software.
Western blot analysis
Equal amounts (50 μg) of protein extracts were separated by SDS‒PAGE. After electrophoresis, the separated proteins were transferred to a polyvinylidene difluoride (PVDF) membrane (Amersham Biosciences). Nonspecific sites were blocked with blocking buffer [5% nonfat dry milk in TBS containing 0.05% Tween 20 (T-TBS)] for 1 h at room temperature. The membranes were incubated with the indicated primary antibodies overnight at room temperature. The membranes were then incubated with a secondary antibody, HRP-conjugated anti-rabbit immunoglobulin IgG (1:2,000, Cell Signaling), for 1 h at room temperature.
Statistical analysis
All parameters are expressed as the mean ± SD. The differences between two groups were compared with Student’s t test. In addition, continuous variables among different groups were compared with analysis of variance (ANOVA), followed by the Bonferroni test for post hoc between-group comparisons. SAS statistical software for Windows version 8.2 (SAS Institute, Cary, NC, USA) was utilized as an analytic tool. A probability value <0.05 was considered to indicate statistical significance.
Results
Demonstrating the efficacy of gene transfection into ADMSCs and its impact on cell viability and migration in ADMSCs
To confirm that gene transfection in ADMSCs was effective, western blotting was conducted in vitro (Fig. 1). Compared with those of the controls, the protein expression levels of PrPC (Fig. 1a) and ZNF746 (Fig. 1b) were significantly increased, highlighting that PrPC and ZNF746 gene transfection into ADMSCs was successful.

Impact of gene manipulation on cell proliferation and migration in adipose-derived mesenchymal stromal cells (ADMSCs). (a) Protein expression of cellular prion protein (PrPC), * vs †, P < 0.0001. (b) Protein expression of NF746, * vs ‡, P < 0.0001. (c) Cell viability at day 24, * vs ‡, P < 0.0001, P for trend <0.001. (d) Cell viability at day 48, * vs ‡, P < 0.0001, P for trend <0.001. (e) Cell viability at day 72, * vs ‡, P < 0.0001, P for trend <0.001. (f) to (i) Illustrating wound healing process at 0 h, the wound healing rate, P > 0.5. (j) to (m) Illustrating the wound healing process at 72 h. (n) The wound healing rate, * vs †, P < 0.0001, P for trend <0.001. n = 6 for each group. A1 = ADMSCs; A2 = overexpression of cellular prion protein in ADMSCs (MSCPrPC-OVE); A3 = overexpression of ZNF746 in ADMSCs (MSCZNF746-OVE); A4 = double gene overexpression in ADMSCs (MSCDGe-OVE).
In addition, to test the effects of gene manipulation on cell viability and growth, the ADMSCs were categorized into groups A1 (ADMSCs), A2 [overexpression of cellular prion protein in ADMSCs (MSCPrPC-OVE)], A3 [overexpression of NF746 in ADMSCs (MSCZNF746-OVE)], and A4 [double gene overexpression in ADMSCs (MSCDGe-OVE)]. The results revealed that the cell viability at 24 (Fig. 1c), 48 (Fig. 1d), and 72 h (Fig. 1e) of culture significantly and progressively increased from A1 to A4.
After the same conditions were used and the samples were grouped from A1 to A4, we conducted a wound healing assay (ie, an indication of cell growth), and the results revealed that at baseline (ie, on day 0) (Fig. 1f to i), the wound healing rate did not differ among the groups. However, by 24 h, the wound healing rate (Fig. 1j to m) significantly and progressively increased from A1 to A4 (Fig. 1n).
Effects of gene manipulation on cell proliferation and cell cycle progression in ADMSCs
Based on conditions identical to those shown in Fig. 1, we analyzed cell proliferation and cell cycle progression at the cellular and protein levels, respectively (Fig. 2). The results revealed that the cellular expression of PCNA+ cells (Fig. 2a to d), an indicator of cell proliferation, significantly and progressively increased from A1 to A4 (Fig. 2e). In addition, when we looked at the protein levels of cell cycle biomarkers, we found that the protein expression levels of CDK2 (Fig. 2f), CDK4 (Fig. 2g), cyclin D1 (Fig. 2h), and cyclin E2 (Fig. 2i), four indicators of cell cycle biomarkers, were significantly lower in A1 than in A2 to A4 and significantly lower in A2 and A3 than in A4, but they did not differ between A2 and A3, indicating that overexpression of either PrPC or ZNF746 individually enhanced cell cycle progression, and their combined overexpression resulted in an even greater enhancement.
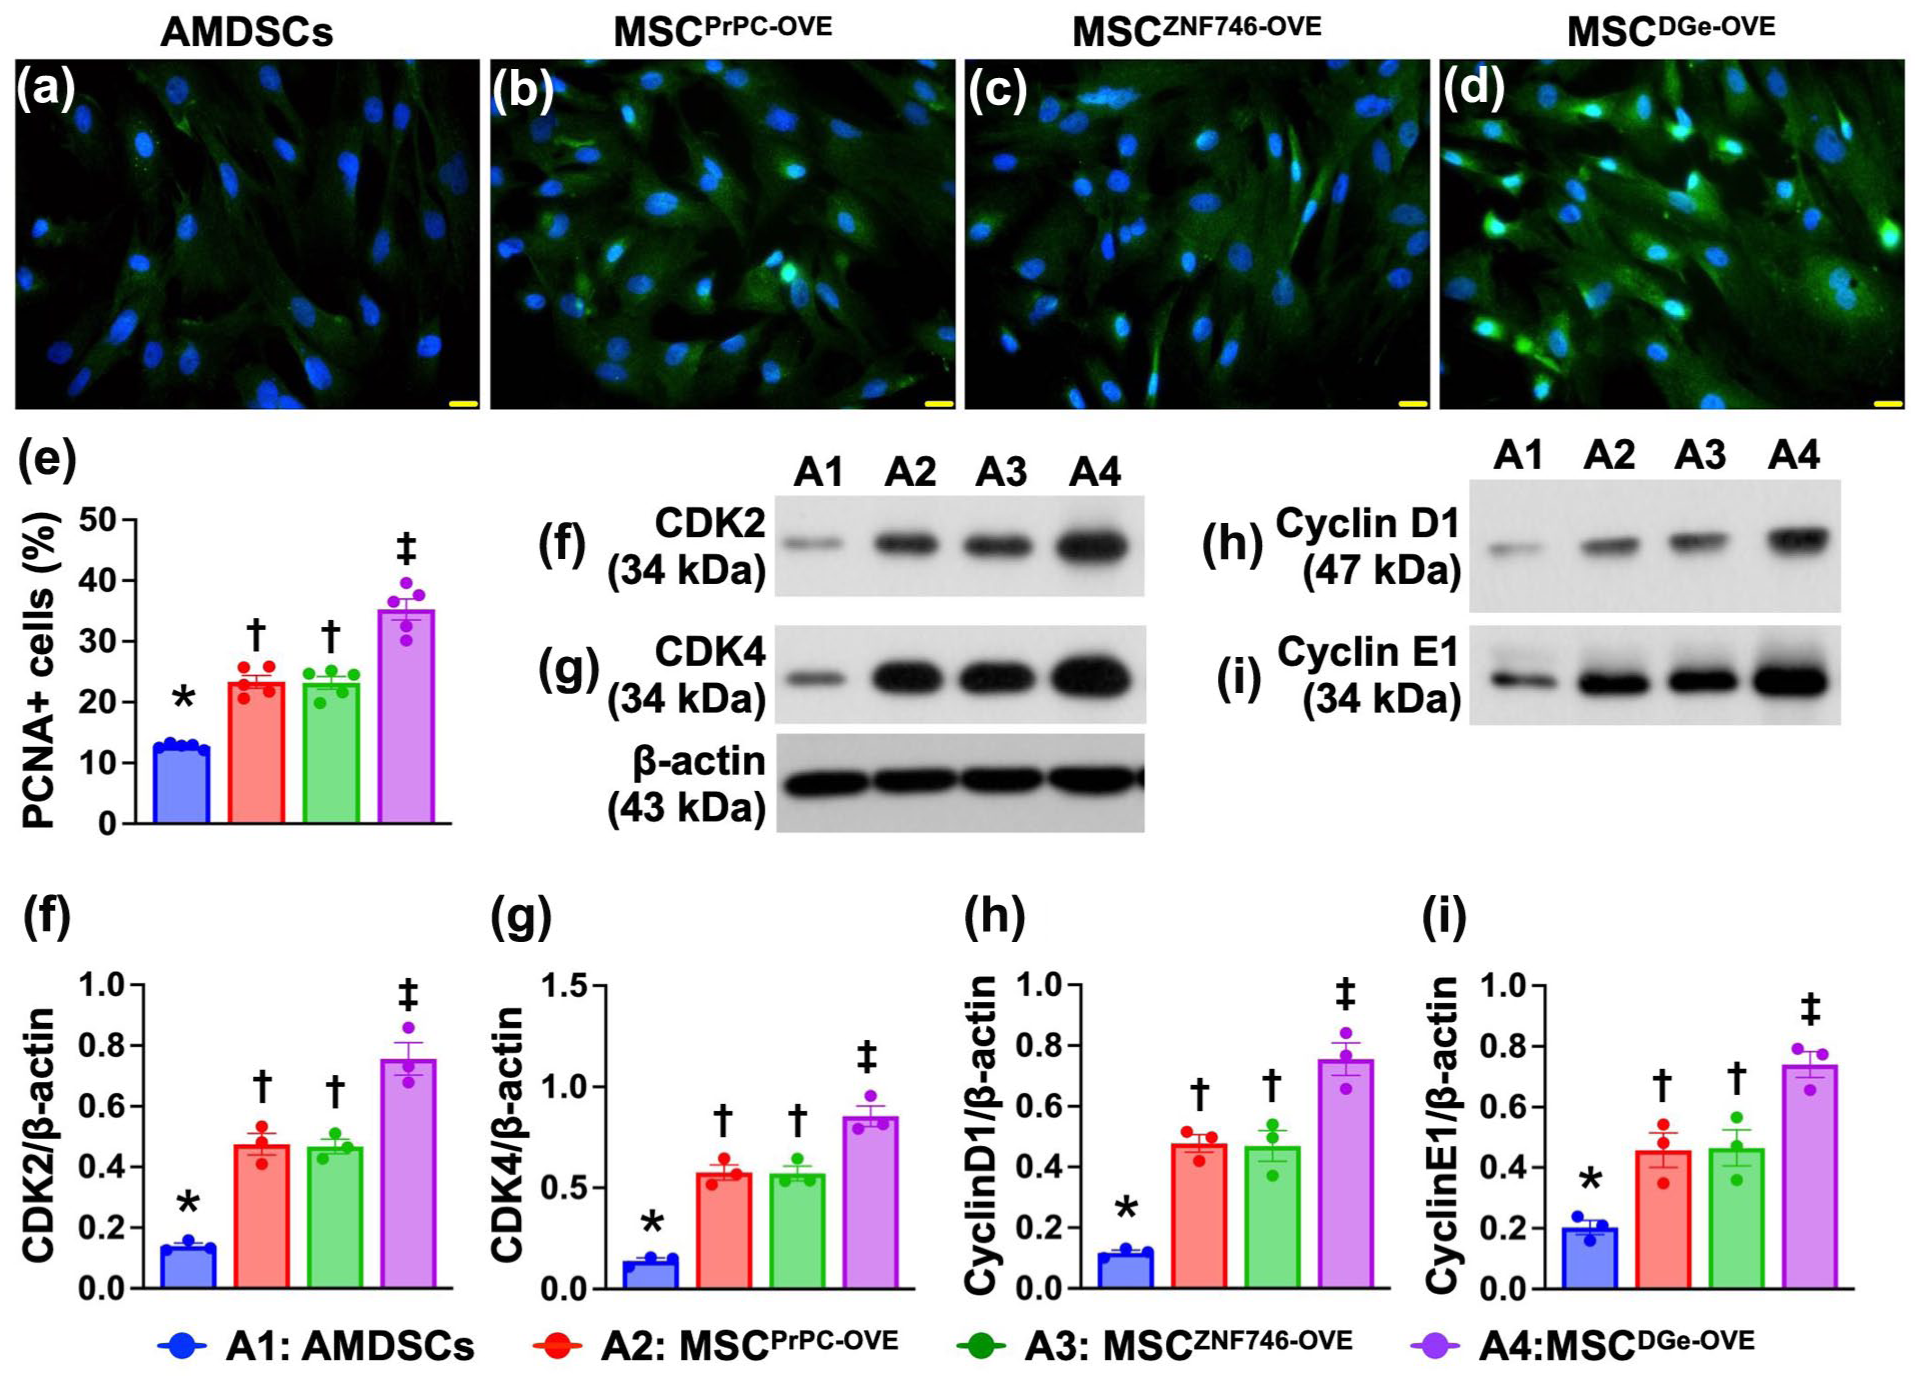
Impact of gene manipulation on cell proliferation and cell cycle progression in ADMSCs. (a) to (d) Immunofluorescent (IF) microscopic finding (400×) for identification of cellular expression of PCNA (green color), blue color indicated DAPI stain for identifying the nuclei. Scale bar in right lower corner represents 20µm. (e) Analytical result of number (%) of PCNA+ cells, * vs other groups with different symbols (†, ‡) P < 0.0001. (f) Protein expression of CDK2, * vs other groups with different symbols (†, ‡) P < 0.001. (g) Protein expression of CDK4, * vs other groups with different symbols (†, ‡) P < 0.001. (h) Protein expression of cyclin D1, * vs other groups with different symbols (†, ‡) P < 0.001. (i) Protein expression of cyclin E2, * vs other groups with different symbols (†, ‡) P < 0.001. All statistical analyses were performed by one-way ANOVA, followed by Bonferroni multiple comparison post hoc test (n = 3–5 for each group). Symbols (*, †, ‡) indicate significance (at 0.05 level). A1 = ADMSCs; A2 = overexpression of cellular prion protein in ADMSCs (MSCPrPC-OVE); A3 = overexpression of ZNF746 in ADMSCs (MSCZNF746-OVE); A4 = double gene overexpression in ADMSCs (MSCDGe-OVE). ADMSCs = adipose-derived mesenchymal stem cells.
Effects of gene manipulation on the protection of cells against oxidative stress
To elucidate whether gene manipulation would protect the cells far from oxidative damage, the cells were cocultured with H2O2 and categorized into groups B1 (ADMSCs), B2 [ADMSCs + H2O2 (200 µM)/cocultured for 6 h], B3 [MSCPrPC-OVE + H2O2 (200 µM)/cocultured for 6 h], B4 [MSCZNF746-OVE + H2O2 (200 µM)/cocultured for 6 h], and B5 [MSCDGe-OVE + H2O2 (200 µM)/cocultured for 6 h] after which the cells were collected for individual culture (Fig. 3). The results revealed that the expression of cytochrome C (Fig. 3a to e) in mitochondria was highest in B1, lowest in B2 and significantly higher in B5 than in B3 and B4 (Fig. 3f), but this parameter did not differ between B3 and B4.
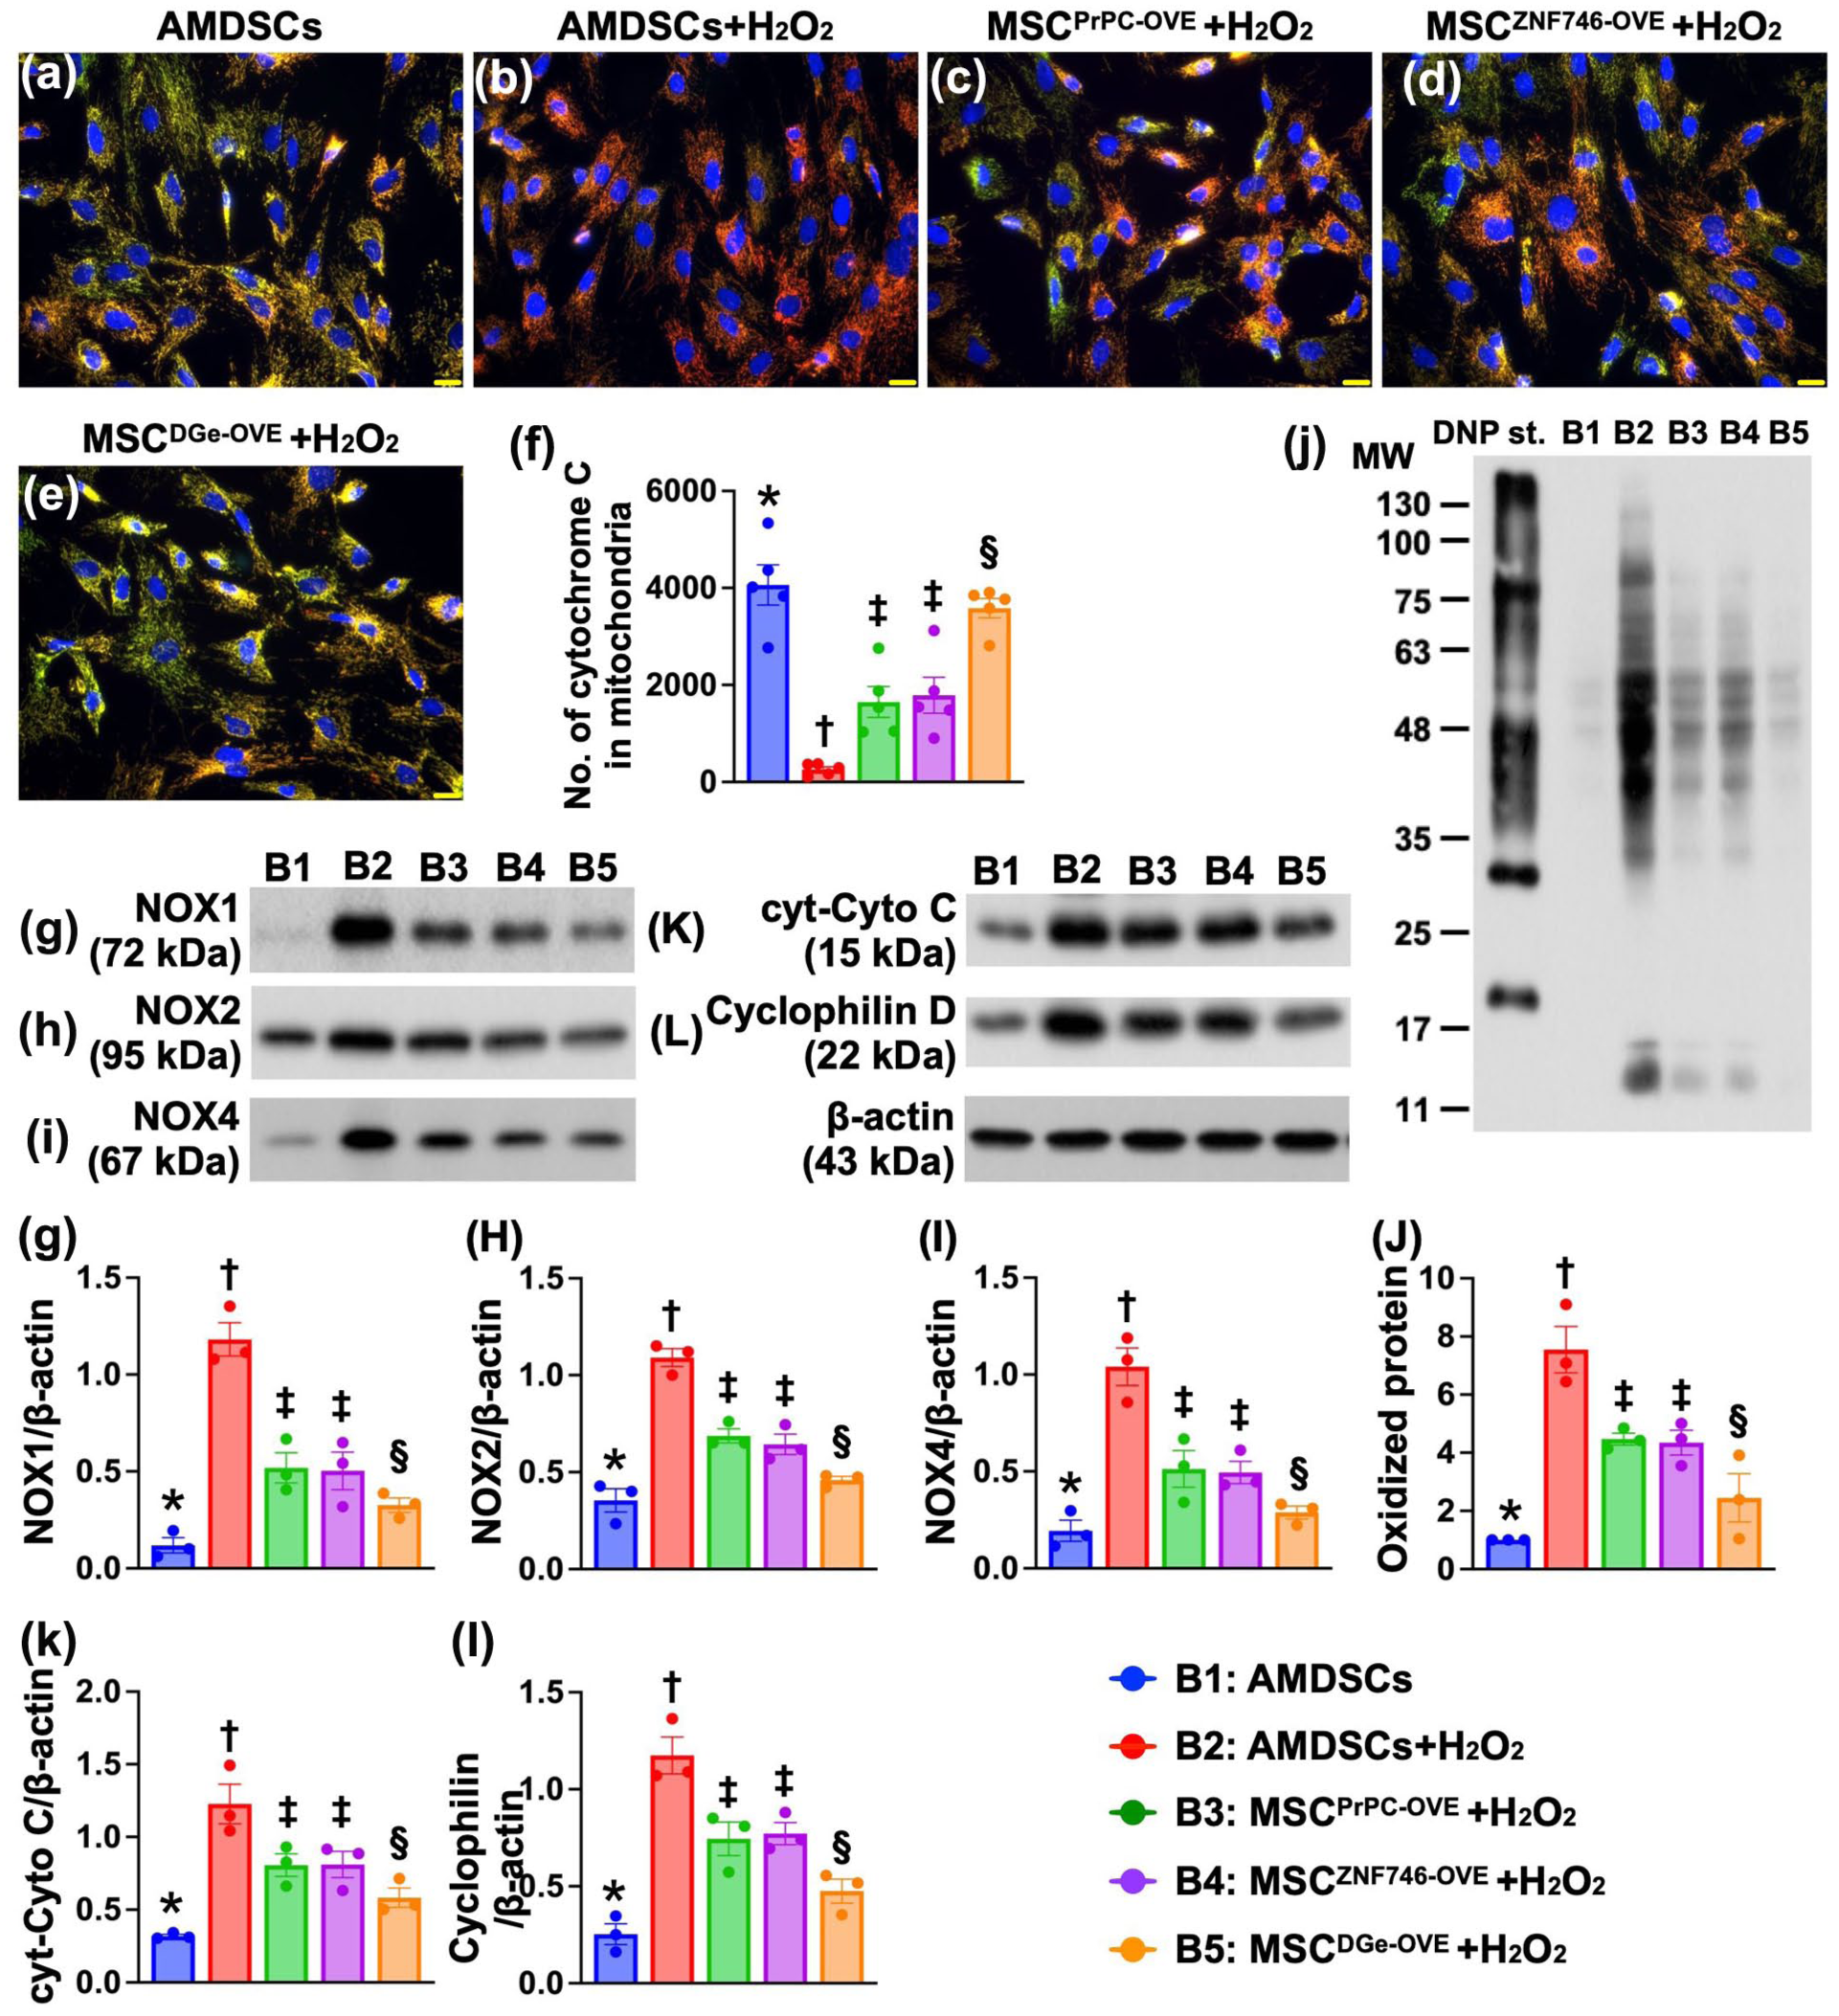
Impact of gene manipulation on protecting the cell against oxidative stress. (a) to (e) Illustrating the IF microscopic finding (400×) for identification of cellular expression of mitochondrial cytochrome C (green-red color). Scale bar in right lower corner represents 20µm. (f) Analytical result of number of mitochondrial cytochrome C+ cells, * vs other groups with different symbols (†, ‡, §) P < 0.0001. n = 5 for each group. (g) Protein expression of NOX-1, * vs other groups with different symbols (†, ‡, §) P < 0.001. (h) Protein expression of NOX-2, * vs other groups with different symbols (†, ‡, §) P < 0.001. (i) Protein expression of NOX-4, * vs other groups with different symbols (†, ‡, §) P < 0.001. (j) Oxidize protein expression, * vs other groups with different symbols (†, ‡, §), P < 0.001, (Note: the left and right lanes shown on the upper panel represent protein molecular weight marker and control oxidized molecular protein standard, respectively). M.W. = molecular weight; DNP = 1-3 dinitrophenylhydrazone. (k) Protein expression of cytosolic cytochrome C (cyt-Cyto C), * vs other groups with different symbols (†, ‡, §), P < 0.001. (l) Protein expression of Cyclophilin, * vs other groups with different symbols (†, ‡, §), P < 0.001. n = 3 in each group for protein analysis. All statistical analyses were performed by one-way ANOVA, followed by Bonferroni multiple comparison post hoc test (n = 3-5 for each group). Symbols (*, †, ‡, §) indicate significance (at 0.05 level). B1 = ADMSCs; B2 = ADMSCs + H2O2; B3 = MSCPrPC-OVE + H2O2; B4 = MSCZNF746-OVE + H2O2; B5 = MSCDGe-OVE + H2O2. ADMSCs = adipose-derived mesenchymal stem cells.
In addition, the protein expression levels of NOX-1 (Fig. 3g), NOX-2 (Fig. 3h), NOX-4 (Fig. 3i) and oxidized protein (Fig. 3j), four indices of oxidative stress, were lowest in B1, highest in B2 and significantly lower in B5 than in B3 and B4, but they were similar between B3 and B4. Furthermore, the protein expression levels of cytosolic cytochrome C (Fig. 3k) and cyclophilin D (Fig. 3l), two indicators of mitochondrial damage, were similar to those of NOX-1 among the groups. These findings implied that, compared with control ADMSCs, single-gene overexpression in ADMSCs provided superior protection, and double gene overexpression in ADMSCs offered even greater protection against oxidative stress damage.
Effects of gene manipulation on the protection of cells against hypoxic conditions
Next, to determine whether gene manipulation would ensure cell survival under hypoxic conditions, the cells were treated with CoCl2 and categorized into groups C1 (ADMSCs), C2, ADMSCs + CoCl2 (30 µM)/cocultured for 24 h, C3, MSCPrPC-OVE + CoCl2 (30 µM)/cocultured for 24 h, C4, MSCZNF746-OVE + CoCl2 (30 µM)/cocultured for 24 h, and C5, MSCZNF746-OVE + CoCl2 (30 µM)/cocultured for 24 h, after which they were collected for individual culture (Fig. 4). The results revealed that the expression of mitochondrial cytochrome C (Fig. 4a to e) was highest in C1, lowest in C2 and significantly higher in C5 than in C3 and C4 (Fig. 4f), but this parameter did not differ between C3 and C4.

Impact of gene manipulation on protecting the cells against hypoxic condition. (a) to (e) Illustrating the IF microscopic finding (400×) for identification of cellular expression of mitochondrial cytochrome C (green-red color). Scale bar in right lower corner represents 20µm. (f) Analytical result of number of mitochondrial cytochrome C+ cells, * vs other groups with different symbols (†, ‡, §) P < 0.0001. n = 5 for each group. (g) Protein expression of mitochondrial (mit)-Bax, * vs other groups with different symbols (†, ‡, §) P < 0.001. (h) Protein expression of cleaved caspase 3 (c-Casp3), * vs other groups with different symbols (†, ‡, §) P < 0.001. (i) Protein expression of c-PARP, * vs other groups with different symbols (†, ‡, §) P < 0.0001. (j) Protein expressions of transforming growth factor (TGF)-β, * vs other groups with different symbols (†, ‡, §) P < 0.001. (k) Protein expression of Smad3, * vs other groups with different symbols (†, ‡, §) P < 0.0001. (l) Protein expression of beclin-1, * vs other groups with different symbols (†, ‡, §) P < 0.001. (m) Protein expression of ATG5, * vs other groups with different symbols (†, ‡, §) P < 0.001. (n) Protein expression of ratio of LC3BII to LC3BI, * vs other groups with different symbols (†, ‡, §) P < 0.001. (o) Protein expression of p-DRP, * vs other groups with different symbols (†, ‡, §) P < 0.001. (p) Protein expression of cyclophilin D, * vs other groups with different symbols (†, ‡, §) P < 0.001. (q) Protein expression of cytosolic cytochrome C (cyt-Cyto-C), * vs other groups with different symbols (†, ‡, §) P < 0.001. n = 3 in each group for protein analysis. All statistical analyses were performed by one-way ANOVA, followed by Bonferroni multiple comparison post hoc test (n = 3-5 for each group). Symbols (*, †, ‡) indicate significance (at 0.05 level). C1 = ADMSCs; C2 = ADMSCs + CoCl2; C3 = MSCPrPC-OVE + CoCl2; C4 = MSCZNF746-OVE + CoCl2; C5 = MSCDGe-OVE + CoCl2. ADMSCs = adipose-derived mesenchymal stem cells.
In addition, the protein expression of mitochondrial Bax (Fig. 3g), cleaved caspase 3 (Fig. 3h), and cleaved PARP (Fig. 3i)—three indices of apoptosis; the protein expression of TGF-β (Fig. 3j) and Smad3 (Fig. 3k)—two indicators of fibrosis; and the protein expression of beclin-1 (Fig. 3l), ATG5 (Fig. 3m) and the ratio of LC3BII to LC3BI (Fig. 3n)—three indicators of autophagy—were lowest in C1, highest in C2, and significantly lower in C5 than in C3 and C4, but these parameters did not differ between the latter two groups. Furthermore, the protein expression levels of p-DRP (Fig. 3o), cyclophilin D (Fig. 3p), and cytosolic cytochrome C (Fig. 3q)—three indicators of mitochondrial damage—exhibited identical patterns of apoptosis among the five groups. These findings indicated that double gene overexpression was superior to the overexpression of either single gene for ensuring cell survival in a hypoxic environment.
Flow cytometric analysis for the identification of intracellular and mitochondrial ROS and apoptosis
To assess the effects of PrPC and ZNF746 gene overexpression on attenuating the generation of total intracellular and mitochondrial ROS, flow cytometric analysis was performed (Fig. 5). The results revealed that both the intracellular (Fig. 5a to f) and mitochondrial (Fig. 5g to l) ROS levels were lowest in B1, highest in B2, significantly lower in B5 than in B3 and B4, and significantly lower in B3 than in B4. By using the same tool (ie, flow cytometric analysis), we found that the early (annexin V+/PI-) and late (annexin V+/PI+) phases of apoptosis were lowest in C1, highest in C2, significantly lower in C5 than in C3 and C4, and significantly lower in C3 than in C4 (Fig. 5m to s). These findings suggested that double gene overexpression was superior to the overexpression of either single gene for protecting cells against ROS and hypoxic environment damage.

Flow cytometric analysis for measurement of intracellular and mitochondrial reactive oxygen species (ROS) and cellular apoptosis. (a) to (e) Illustrating the flow cytometric analysis for identification of total intracellular ROS. (f) Analytical of mean fluorescent intensity (ie, by DCFDA dye stain) of total intracellular ROS, * vs other groups with different symbols (†, ‡, §, ¶) P < 0.0001. (g) to (k) Illustrating the flow cytometric analysis for identification of mitochondrial ROS. (l) Analytical result of mean fluorescence intensity (ie, by MitoSOX dye stain) of mitochondrial ROS, * vs other groups with different symbols (†, ‡, §, ¶) P < 0.0001. B1 = ADMSCs; B2 = ADMSCs + H2O2; B3 = MSCPrPC-OVE + H2O2; B4 = MSCZNF746-OVE + H2O2; B5 = MSCDGe-OVE + H2O2. (m) to (q) Illustrating the flow cytometric analysis for identification of early (annexin V+/PI-) and late (annexin V+/PI+) apoptosis. (r) Analytical result of early apoptosis, * vs other groups with different symbols (†, ‡, §, ¶) P < 0.0001. (s) Analytical result of late apoptosis, * vs other groups with different symbols (†, ‡, §, ¶) P < 0.0001. C1 = ADMSCs; C2 = ADMSCs + CoCl2; C3 = MSCPrPC-OVE + CoCl2; C4 = MSCZNF746-OVE + CoCl2; C5 = MSCDGe-OVE + CoCl2. All statistical analyses were performed by one-way ANOVA, followed by Bonferroni multiple comparison post hoc test (n = 5 for each group). Symbols (*, †, ‡, §, ¶) indicate significance (at 0.05 level).
Flow cytometric analysis for detecting the circulating levels of inflammatory and immune cells and abdominal ultrasound findings by day 3 after acute liver IR induction
Any IR tissue/organ injury always elicits localized innate and inflammatory–immune reactions (Fig. 6). Therefore, to elucidate whether liver IR injury also elicited not only localized but also systemic inflammatory and immune reactions, flow cytometric analysis was utilized in the present study. The results demonstrated that the circulatory levels of MPO+ (Fig. 6a), Ly6G+ (Fig. 6b), and CD11c/d+ cells (Fig. 6c)—three indices of inflammation—and circulatory levels of helper T cells (CD3+CD4+) (Fig. 6d) and cytotoxic T cells (CD3+CD8+) (Fig. 6e)—two immune cell surface markers—were lowest in group 1 (SC), highest in group 2 (acute liver IR) and significantly higher in group 3 (acute liver IR + MSCPrPC-OVE) and group 4 (acute liver IR + MSCZNF746-OVE) than in group 5 (acute liver IR + MSCDGe-OVE), but the differences were not significant between groups 3 and 4. In contrast, the circulatory level of CD4+CD25+Foxp3+ regulatory T cells (Fig. 6f), an index of suppressed immune responses, ie, inhibiting the activation of CD4+ and CD8+ T cells and suppressing antitumor activity, was lowest in group 2, highest in group 5, significantly higher in group 4 and further significantly higher in group 3 than in group 1.

Flow cytometric analysis for detecting the circulating levels of inflammatory and immune cells and the abdominal ultrasound finding by day 3 after acute liver IR. (a) Circulatory level of myeloperoxidase (MPO)+ cells, * vs other groups with different symbols (†, ‡, §, ¶) P < 0.0001. (b) Circulatory level of Ly6G+ cells, * vs other groups with different symbols (†, ‡, §, ¶) P < 0.0001. (c) Circulatory level of CD11c/d+ cells, * vs other groups with different symbols (†, ‡, §, ¶) P < 0.0001. (d) Circulatory level of CD3+CD4+ cells, * vs other groups with different symbols (†, ‡, §, ¶) P < 0.0001. (e) Circulatory level of CD3+CD8+ cells, * vs other groups with different symbols (†, ‡, §, ¶) P < 0.0001. (f) Circulatory level of CD4+CD25+Foxp3+ Treg cells, * vs other groups with different symbols (†, ‡, §, ¶) P < 0.0001. (g1)-(g5) Illustrating the abdominal ultrasound for identification of mean intensity of liver fibrosis (ie, the brightness) by transverse region of interest (ROI) at day 0 (ie, baseline). (h1) Analytical result of mean ROI intensity, p>0.5. (g6)-(g10) Illustrating the abdominal ultrasound for identification of mean intensity of liver fibrosis (ie, the brightness indicated by red dotted line) by transverse region of interest (ROI) at day 72 after acute liver IR. (h2) Analytical result of mean ROI intensity, * vs other groups with different symbols (†, ‡, §, ¶) P < 0.0001. IR = ischemia–reperfusion. All statistical analyses were performed by one-way ANOVA, followed by Bonferroni multiple comparison post hoc test (n = 5 for each group). Symbols (*, †, ‡, §, ¶) indicate significance (at 0.05 level).
In addition, abdominal ultrasound revealed that the mean intensity of liver fibrosis (ie, the brightness) according to the transverse region of interest (ROI) evaluation on day 0 did not differ among the groups (Fig. 6g1 to g5, Fig. 6h1). However, by day 3 after acute IR induction, this parameter was lowest in group 1, highest in group 2, significantly lower in group 5 than in groups 3 and 4, and significantly lower in group 3 than in group 4 (Fig. 6g6 to g10, Fig. 6h2).
Impact of gene manipulation on attenuating liver fibrosis and damage by day 3 after acute liver IR induction
The microscopic findings of hematoxylin and eosin staining (Fig. 7a to e) demonstrated that the liver injury score was highest in group 2, lowest in group 1 and significantly lower in group 5 than in groups 3 and 4, but the liver injury score was not significantly different between groups 3 and 4 (Fig. 7f). In addition, IHC staining (Fig. 7g to k) revealed that the fibrotic area of the liver parenchyma displayed an identical pattern to that of the liver injury scores (Fig. 7l).

Impact of gene manipulation on attenuating the liver fibrosis and damage day 3 after acute liver IR induction. (a) to (e) Illustrating the microscopic finding (200×) of H.E., stain for identification of liver ischemic area (gray color) (green dotted line). (f) Analytical result of liver injury score, * vs other groups with different symbols (†, ‡, §) P < 0.0001. (g) to (k) Illustrating the microscopic finding (200×) of Masson’s trichrome stain for identification of fibrosis area (blue color, indicated by green arrow heads). (l) Analytical result of fibrotic area, * vs other groups with different symbols (†, ‡, §) P < 0.0001. Scale bar in right lower corner represents 50µm. All statistical analyses were performed by one-way ANOVA, followed by Bonferroni multiple comparison post hoc test (n = 5 for each group). Symbols (*, †, ‡, §) indicate significance (at 0.05 level). IR = ischemia–reperfusion.
Overexpression of the PrPC and ZNF746 genes markedly suppressed inflammatory cell infiltration and DNA damage markers in the liver parenchyma by day 3 after acute liver IR induction
The findings obtained via microscopy revealed that liver cellular infiltration of CD68+ Kupffer cells (Fig. 8a to f) and MMP-9+ (Fig. 8g to l) cells, two indices of inflammation at the cellular level, was highest in group 2, lowest in group 1 and significantly lower in group 5 than in groups 3 and 4, but these parameters did not differ between the latter two groups (Fig. 8). In addition, IF microscopy revealed that the expression of γ-H2AX, an indicator of DNA damage, (Fig. 8m to r) in the liver parenchyma was similar among the groups.
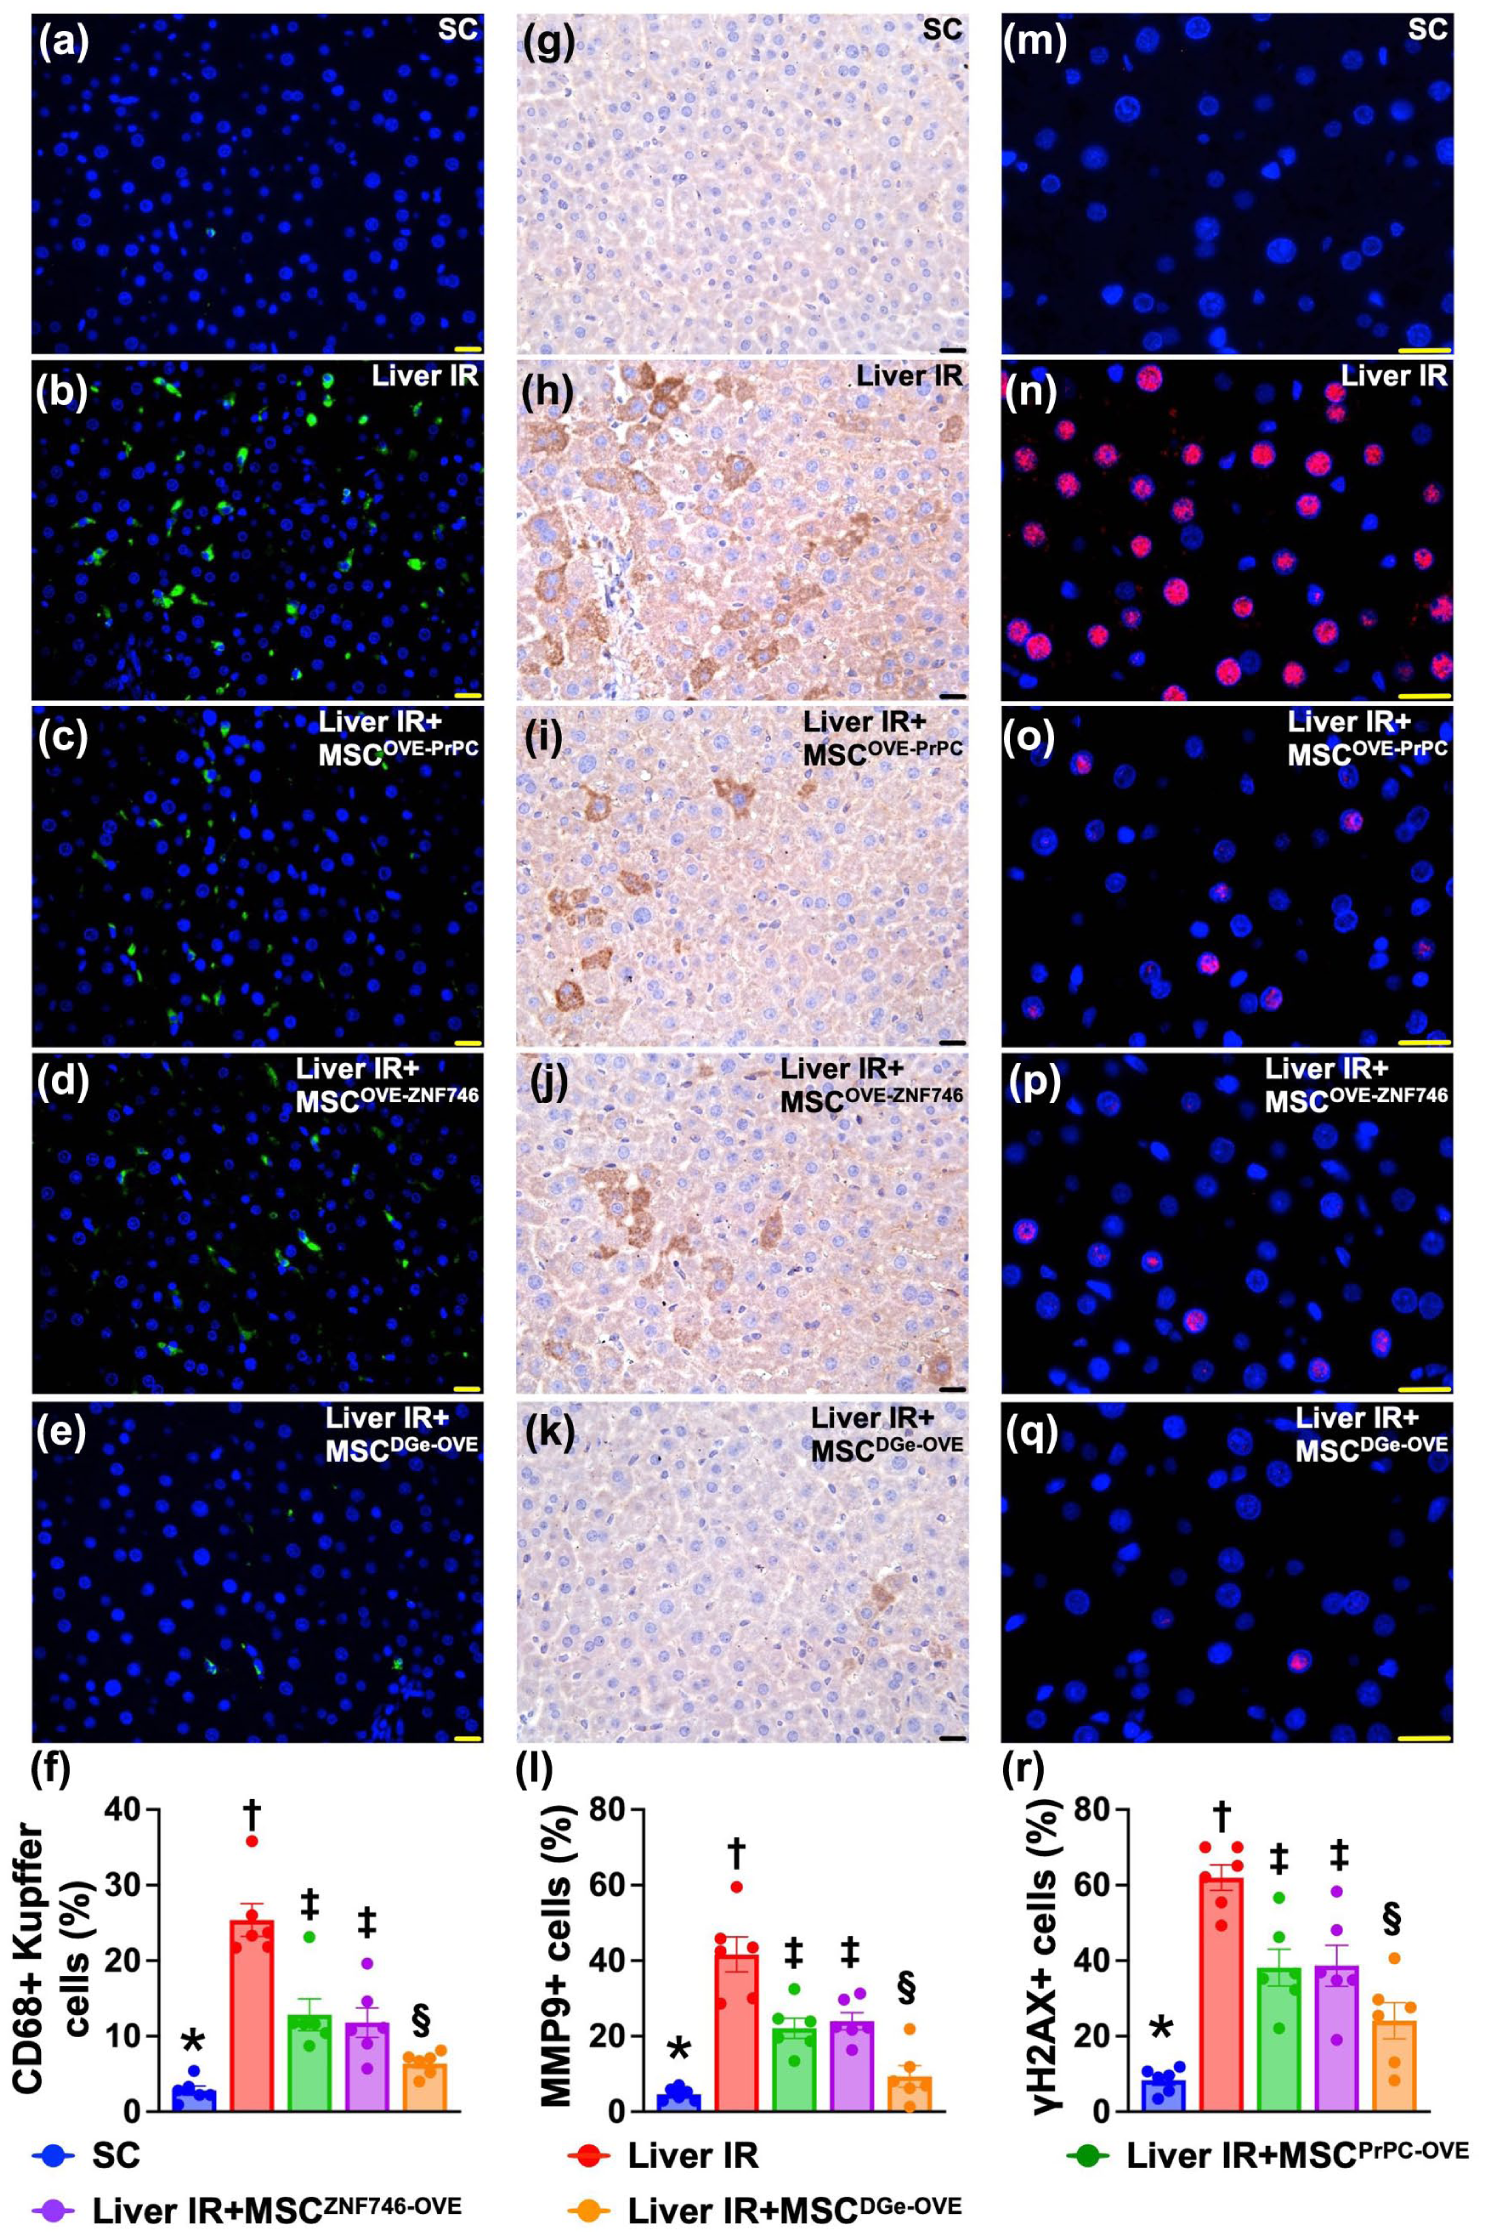
Overexpression of PrPC and ZNF746 gene markedly suppressed the inflammatory cell infiltration and DNA-damaged marker in liver parenchyma by day 3 after acute liver IR induction. (a) to (e) Illustrating the immunofluorescent (IF) microscopic finding (400×) for identification of Kuppler cells in liver parenchyma (green color). (f) Analytical result of number of Kuppler cells, * vs other groups with different symbols (†, ‡, §) P < 0.0001. (g) to (k) Illustrating the immunohistochemical (IHC) microscopic finding (400×) for identification of matrix metalloproteinase (MMP)-9 in liver parenchyma (gray color). (l) Analytical result of number of Kupffer cells, * vs other groups with different symbols (†, ‡, §) P < 0.0001. (m) to (q) Illustrating the IF microscopic finding (400×) for identification of γ-H2AX+ cell filtration in liver parenchyma (green color). (r) Analytical result of number of γ-H2AX+ cells, * vs other groups with different symbols (†, ‡, §) P < 0.0001. All statistical analyses were performed by one-way ANOVA, followed by Bonferroni multiple comparison post hoc test (n = 6 for each group). Symbols (*, †, ‡, §) indicate significance (at 0.05 level). IR = ischemia–reperfusion.
The expression of proteins related to oxidative stress, apoptosis, fibrosis, mitochondrial damage and autophagy in the liver parenchyma was measured on day 3 after acute liver IR induction
The protein expression levels of mitochondrial Bax (Fig. 9a), cleaved caspase 3 (Fig. 9b), and cleaved PARP (Fig. 9c)—three indicators of apoptosis; protein expression levels of Smad3 (Fig. 9d) and TGF-β (Fig. 9e)—two indicators of fibrosis; protein expression levels of γ-H2AX (Fig. 9f), cytosolic cytochrome C (Fig. 9g) and p-DRP1 (Fig. 9h)—three indicators of DNA and mitochondrial damage; and protein expression levels of beclin-1 (Fig. 9i), ATG5 (Fig. 9j) and the ratio of LC3B-II to LC3B-I (Fig. 9k)—three indicators of autophagy—were lowest in group 1, highest in group 2 and significantly lower in group 5 than in groups 3 and 4, but these parameters were similar between groups 3 and 4.

Protein expressions of oxidative stress, apoptosis, fibrosis, mitochondrial damage and autophagy in liver parenchyma by day 3 after acute liver IR induction. (a) Protein expression of mitochondrial (mit)-Bax, * vs other groups with different symbols (†, ‡, §) P < 0.0001. (b) Protein expression of cleaved caspase 3 (c-Casp3), * vs other groups with different symbols (†, ‡, §) P < 0.0001. (c) Protein expression of c-PARP, * vs other groups with different symbols (†, ‡, §) P < 0.0001. (d) Protein expression of Smad3, * vs other groups with different symbols (†, ‡, §) P < 0.0001. (e) Protein expression of transforming growth factor (TGF)-β, * vs other groups with different symbols (†, ‡, §) P < 0.0001. (f) Protein expression of γ-H2AX, * vs other groups with different symbols (†, ‡, §) P < 0.0001. (g) Protein expression of cytosolic cytochrome C (cyt-CytoC), * vs other groups with different symbols (†, ‡, §) P < 0.0001. (h) Protein expression of p-DRP1, * vs other groups with different symbols (†, ‡, §) P < 0.0001. (i) Protein expression of beclin-1, * vs other groups with different symbols (†, ‡, §) P < 0.0001. (j) Protein expression of ATG5, * vs other groups with different symbols (†, ‡, §) P < 0.0001. (k) Protein expression of the ratio of LC3B-II to LC3B-I, * vs other groups with different symbols (†, ‡, §) P < 0.0001. All statistical analyses were performed by one-way ANOVA, followed by Bonferroni multiple comparison post hoc test (n = 6 for each group). Symbols (*, †, ‡, §) indicate significance (at 0.05 level). IR = ischemia–reperfusion.
The expression of proteins related to the cell cycle, oxidative stress biomarkers and cell stress signaling in the liver parenchyma by day 3 after acute liver IR induction
In the in vivo study, the protein expression of cyclin D1 (Fig. 10a) and cyclin E1 (Fig. 10b), two indices of cell cycle biomarkers, was lowest in group 2, highest in group 1 and significantly higher in group 5 than in groups 3 and 4, but the expression did not differ between groups 3 and 4, indicating that the cell cycle was turned off in acute liver IR and was switched on in acute liver IR treated with MSCPrPC-OVE or MSCZNF746-OVE and further upregulated by MSCDGe-OVEtreatment. However, the protein expression levels of NOX-1 (Fig. 10c), NOX-2 (Fig. 10d), and oxidized protein (Fig. 10e) were opposite those of cell cycle-related proteins among the groups.

Protein expressions of cell cycle and oxidative stress biomarkers in liver parenchyma by day 3 after acute liver IR induction. (a) Protein expression of cyclin D1, * vs other groups with different symbols (†, ‡, §) P < 0.0001. (b) Protein expression of cyclin E1, * vs other groups with different symbols (†, ‡, §) P < 0.0001. (c) Protein expression of NOX-1, * vs other groups with different symbols (†, ‡, §) P < 0.0001. (d) Protein expression of NOX-2* vs other groups with different symbols (†, ‡, §) P < 0.0001. (e) The oxidized protein expression, * vs other groups with different symbols (†, ‡, §), P < 0.0001 (Note: the left and right lanes shown on the upper panel represent protein molecular weight marker and control oxidized molecular protein standard, respectively). M.W. = molecular weight; DNP = 1-3 dinitrophenylhydrazone. (f) Protein expression of phosphorylated (p)-PI3K, * vs other groups with different symbols (†, ‡, §), P < 0.0001. (g) Protein expression of p-Akt, * vs other groups with different symbols (†, ‡, §), P < 0.0001. (h) Protein expression of p-mTOR, * vs other groups with different symbols (†, ‡, §), P < 0.0001. All statistical analyses were performed by one-way ANOVA, followed by Bonferroni multiple comparison post hoc test (n = 6 for each group). Symbols (*, †, ‡, §) indicate significance (at 0.05 level). IR = ischemia–reperfusion.
In addition, the protein expression levels of p-PI3K (Fig. 10f), p-Akt (Fig. 10g) and p-mTOR (Fig. 10h), three indicators of cell stress signaling, indicated a similar level of oxidative stress among the groups.
The expression of proteins related to upstream and downstream inflammatory signaling in the liver parenchyma by day 3 after acute liver IR induction
The protein expression levels of TLR2 (Fig. 11a), TLR4 (Fig. 11b), MyD88 (Fig. 11c), TRAF6 (Fig. 11d), IkB-α (Fig. 11e), Ikk-α (Fig. 11f), Ikk-β (Fig. 11g), and NF-κB (Fig. 11h)—seven indices of upstream inflammatory signaling—and the protein expression levels of IL-1β (Fig. 11i), IL-6 (Fig. 11j), TNF-α (Fig. 11k), MMP-9 (Fig. 11l), and iNOS (Fig. 11m)—five downstream inflammatory signaling pathways—were lowest in group 1, highest in group 2 and significantly lower in group 5 than in groups 3 and 4, but these parameters did not differ between groups 3 and 4, indicating that these inflammatory signaling pathways were activated in acute liver IR.

Protein expressions of upstream and downstream signalings in liver parenchyma by day 3 after acute liver IR induction. (a) Protein expression of Toll-Like Receptor 2 (TLR2), * vs other groups with different symbols (†, ‡, §), P < 0.0001. (b) Protein expression of TLR4, * vs other groups with different symbols (†, ‡, §), P < 0.0001. (c) Protein expression of MyD88, * vs other groups with different symbols (†, ‡, §), P < 0.0001. (d) Protein expression of tumor necrosis factor receptor associated factor 6 (TRAF6), * vs other groups with different symbols (†, ‡, §), P < 0.0001. (e) Protein expression of IkB-α, * vs other groups with different symbols (†, ‡, §), P < 0.0001. (f) Protein expression of Ikk-α, * vs other groups with different symbols (†, ‡, §), P < 0.0001. (g) Protein expression of Ikk-β, * vs other groups with different symbols (†, ‡, §), P < 0.0001. (h) Protein expression of nuclear factor (NF)-κB, * vs other groups with different symbols (†, ‡, §), P < 0.0001. (i) Protein expression of interleukin (IL)-1β, * vs other groups with different symbols (†, ‡, §), P < 0.0001. (j) Protein expression of IL-6, * vs other groups with different symbols (†, ‡, §), P < 0.0001. (k) Protein expression of tumor necrosis factor (TNF)-α, * vs other groups with different symbols (†, ‡, §), P < 0.0001. (l) Protein expression of matrix metalloproteinase (MMP)-9, * vs other groups with different symbols (†, ‡, §), P < 0.0001. (m) Protein expression of inducible nitric oxide synthase (iNOS), * vs other groups with different symbols (†, ‡, §), P < 0.0001. All statistical analyses were performed by one-way ANOVA, followed by Bonferroni multiple comparison post hoc test (n = 6 for each group). Symbols (*, †, ‡, §) indicate significance (at 0.05 level). IR = ischemia–reperfusion.
Discussion
This study presents an investigation of the therapeutic impact of double gene (ie, ZNF746 and PRNP) overexpression in ADMSCs for the treatment of acute liver IR injury and revealed several striking preclinical implications. First, we not only successfully induced double gene overexpression in ADMSCs but also suggested that such gene manipulation in ADMSCs was effective and satisfied both in vitro and in vivo therapeutic aims. Second, we not only successfully created an acute liver IR model in rodents but also revealed that upstream/downstream inflammatory and cell stress signaling played two comparably crucial roles in liver IR injury. Third, as we expected, double gene overexpression was superior to the overexpression of only one gene in ADMSCs in promoting hepatocyte survival in a toxic environment because of acute liver IR injury.
The discovery of the application of MSCs for tissue regeneration is a major medical advancement. Stem cell therapy, which could be successful in treating organ dysfunction, depends on several fundamental properties: (1) cells should have the ability to mobilize, home/migrate, proliferate and rapidly grow in ischemic organs and (2) cells should have the ability to maintain their survival rate and counteract the toxic environment, which includes oxidative stress and inflammation that are always elicited by ischemic tissues and organs. One principal finding in the present study was that cell viability, wound healing (an indicator of cell migratory ability), cell proliferation (an indicator of cell growth) and cell cycle progression were markedly enhanced in ADMSCs with overexpression of either a single gene (ie, either ZNF746 or PRNP) and were markedly enhanced by double gene (ie, ZNF746 and PRNP) overexpression in ADMSCs compared with those in control cells (ie, only ADMSCs). These findings suggest that these gene manipulations in ADMSCs satisfy the aforementioned 1st fundamental property of stem cells.
Acute inflammation and oxidative stress are always upregulated under ischemic conditions10,11,13–15 which, in turn, commonly cause apoptosis and cell death, tissue damage and organ dysfunction/failure13–18. An essential finding of the present in vitro study was that under hypoxic or oxidative stress conditions (ie, toxic environments), the molecular perturbations of oxidative stress, apoptosis, fibrosis, and DNA/mitochondrial damage and the generation of total intracellular/mitochondrial ROS and autophagic biomarkers substantially increased under these two unfavorable conditions. However, compared with control cells (ie, only ADMSCs), these molecular perturbations were markedly alleviated by overexpression of either single gene (ie, either ZNF746 or PRNP) and more markedly alleviated by double gene (ie, ZNF746 and PRNP) overexpression in ADMSCs. Our novel findings, in addition to supporting the findings of previous studies10,11,13–18, clarified that these genes manipulated in ADMSCs could help ADMSCs survive in a toxic environment, which meets the requirement of the 2nd fundamental property of stem cells to be regarded as good candidates for therapy in different disease entities. On the basis of these findings, we designed an animal model of acute liver IR injury to determine whether these gene manipulations could be applied in vivo to obtain good prognostic outcomes.
Acute ischemia-related organ injury elicits not only local but also systemic inflammatory (ie, innate) and immune (ie, adapt) reactions that are strongly positively correlated with unfavorable clinical outcomes11,32,33. In addition, not only inflammation and immune reactions but also fibrosis, oxidative stress, apoptosis and DNA damage biomarkers are correlated with the severity of organ damage and poor outcomes11,13–18,32,33. Several principal findings in the present study were that compared with those in the SC group, the circulatory levels of inflammatory and immune cells markedly increased. In addition, compared with those in the SC group, the levels of apoptotic, autophagic, cytochrome C and mitochondrial ROS and damage biomarkers in the liver parenchyma as well as pathological features of fibrosis detected by abdominal ultrasound were substantially increased in the acute IR group. Our extensive works strongly support the findings of previous studies11,13–18,32,33. Notably, double gene overexpression was superior to single gene overexpression in ADMSCs for alleviating these molecular–cellular perturbations.
The underlying mechanisms of acute liver IR injury are well recognized as unusual and complicated processes [6-8], such as the ability of Kupffer cells and T cells to mediate the activation and recruitment of neutrophil infiltration in the liver parenchyma5,9 and the generation of a cascade of proinflammatory cytokines 1 , resulting in hepatocyte death and liver necrosis and failure. The most important finding in the present study was that upstream and downstream inflammatory signaling participated in acute liver IR damage (referred to Fig. 12). In addition, cell stress signaling is deeply involved in inflammatory reactions and apoptosis and cell death (referred to Fig. 12). However, these inflammatory and cell stress signaling pathways, as well as ROS signaling, were significantly suppressed by single gene overexpression and more significantly suppressed by double gene overexpression in ADMSCs. Therefore, in addition to being consistent with those of previous studies1,5,7–9, our results could explain why gene manipulation in ADMSCs is a novel therapy for protecting the liver far from the site of IR injury.

Illustrating the impact of gene manipulations of PrPC and ZNF746 in ADMSCs on protecting the liver against acute IR injury. IR = ischemia–reperfusion, ROS = reactive oxygen species. ADMSCs = adipose-derived mesenchymal stem cells.
Study limitations
This study has at least two limitations. First, the study period was only 3 days. Although the results were attractive and promising, the long-term effects of these specific treatments on prognostic outcomes in the context of acute liver IR remain uncertain. Second, despite the extensive experiments performed in the present study, the underlying mechanism of acute IR-induced liver injury might be more complex than the findings of the present study indicate. Accordingly, on the basis of our results, we schematically illustrated the underlying mechanism through which MSCDGe-OVE therapy protects the liver against acute IR-induced damage (refer to the Graphic Abstract).
In conclusion, MSCDGe-OVE improved ADMSC proliferation, growth and survival in IR injury in the liver in a toxic environment as well as outcomes in rodents after acute liver IR injury.
Supplemental Material
sj-docx-1-cll-10.1177_09636897251381882 – Supplemental material for Double gene overexpression of ZNF746 and cellular prion protein in rat adipose-derived mesenchymal stromal cell therapy protects the liver against ischemia‒reperfusion injury
Supplemental material, sj-docx-1-cll-10.1177_09636897251381882 for Double gene overexpression of ZNF746 and cellular prion protein in rat adipose-derived mesenchymal stromal cell therapy protects the liver against ischemia‒reperfusion injury by Sheung-Fat Ko, Chi-Ruei Huang, John Y. Chiang, Yi-Ling Chen and Hon-Kan Yip in Cell Transplantation
Footnotes
Acknowledgements
We thank Institute for Translational Research in Biomedical Sciences, Kaohsiung Chang Gung Memorial Hospital, which provided laboratory facilities and technical support for this study. We also thank Center for Laboratory Animals in Kaohsiung Chang Gung Memorial Hospital for the animal care.
Ethical Considerations
All animal experiments here were performed in accordance with the Guide for the Care and Use of Laboratory Animals published by the U.S. National Institutes of Health. The protocols were approved by the Kaohsiung Chang Gung Memorial Hospital Laboratory Animal Center, Taiwan (Approval Number: 2022031704).
Consent for Publication
All authors have read the journal’s author agreement, carefully reviewed, and approved the manuscript.
Author Contributions
Sheung-Fat Ko: Investigation, Formal analysis, Data curation, Funding acquisition.
Chi-Ruei Huang: Methodology, Formal analysis, Data curation.
John Y. Chiang: Methodology, Writing—review & editing
Yi-Ling Chen: Investigation, Formal analysis, Data curation, Writing—review & editing.
Hon-Kan Yip: Supervision, Investigation, Formal analysis, Data curation Writing—review & editing, Writing—original draft.
Funding
The author(s) disclosed receipt of the following financial support for the research, authorship, and/or publication of this article: This study was supported by a program grant from Chang Gung Memorial Hospital, Chang Gung University (CMRPG8M1041).
Declaration of Conflicting Interests
The author(s) declared no potential conflicts of interest with respect to the research, authorship, and/or publication of this article.
Data Availability Statement
Not applicable.
Statement of Human and Animal Rights
This article does not contain any studies with human or animal subjects.
Statement of Informed Consent
There are no human subjects in this article and informed consent is not applicable.
Supplemental Material
Supplemental material for this article is available online.
References
Supplementary Material
Please find the following supplemental material available below.
For Open Access articles published under a Creative Commons License, all supplemental material carries the same license as the article it is associated with.
For non-Open Access articles published, all supplemental material carries a non-exclusive license, and permission requests for re-use of supplemental material or any part of supplemental material shall be sent directly to the copyright owner as specified in the copyright notice associated with the article.