
Abstract
Allogeneic skin transplantation faces significant immunological challenges due to immune rejection, primarily mediated by dendritic cells (DCs). Adipose-derived stem cells (ADSCs) possess immunomodulatory effects; however, the underlying molecular mechanisms in regulating DC function remain unclear. This study aimed to investigate the regulatory effects of ADSCs and tumor necrosis factor-α-stimulated gene 6 (TSG-6) secreted by ADSCs on DC in the murine allogeneic skin transplantation. Following transplantation, recipients received ADSCs, TSG-6 knockdown ADSCs (ADSCs-shTSG-6), or control treatments. Immune cell infiltration and cytokine expression were analyzed by flow cytometry and immunohistochemistry. Transwell assays were used to assess the effect of TSG-6 on DCs migration. TSG-6-related gene expression profiles were explored using transcriptomic analysis and validated by RT-qPCR. ADSC treatment significantly reduced the migration of DCs to the recipient than the ADSCs-shTSG-6 treatment, while reducing the levels of macrophages, lymphocytes, and pro-inflammatory cytokines. ADSC-derived TSG-6 inhibited DCs migration, an effect diminished upon TSG-6 knockdown and restored by TSG-6 supplementation. Transcriptomic analysis identified a panel of immune-related genes (ADM, GHRH, SELENBP1, NDRG1) regulated by TSG-6. These findings indicate that ADSCs enhance graft tolerance by inhibiting DCs migration via TSG-6 secretion, highlighting TSG-6 as a promising therapeutic target for preventing transplant rejection.

Keywords
Introduction
Allogeneic skin transplantation is needed for patients with a severe lack of autologous skin sources, such as in injuries caused by extensive burns and trauma1,2. Dendritic cells (DCs) are abundant in the skin and are key in initiating immune responses 3 . After grafting, the donor skin DCs enter the recipient tissue to present antigens and activate recipient T cells, which produce a series of immune responses and cause immune rejection4,5, resulting in short graft survival times and potentially causing serious skin deformities, scarring, and even life-threatening complications 2 . Immunosuppressants potentially prolong transplant recipient survival moderately. However, long-term or lifelong immunosuppressant use is associated with a range of adverse effects, including increased susceptibility to infections, metabolic toxicity, and increased risk of cancer development6,7. Therefore, there is an urgent need to develop novel immunotherapies.
Adipose-derived stem cells (ADSCs), a type of mesenchymal stem cell (MSC), have the same potent immunosuppressive properties as MSC and suppress T-cell proliferation by cellular or nonspecific mitogenic stimuli and inhibit T-cell functions by inducing cellular stress 8 . We previously demonstrated that ADSCs improved the allograft skin survival rate and prolonged survival time 9 , although the immunomodulatory mechanism remains unclear. In addition, ADSCs have a paracrine effect by secreting immune modulators, such as interleukin (IL)-10, transforming growth factor beta (TGFβ), Prostaglandin E2, and tumor necrosis factor (TNF)-α-stimulated gene 6 (TSG-6)10,11. TSG-6 is an inflammation-associated protein that actively participates in stromal cell functionality and extracellular matrix formation and remodeling. It is also pivotal in regulating the migration and activity of diverse cell types, including DCs, macrophages, and T cells12,13. However, the underlying mechanisms of the immunomodulatory effects of ADSCs on DC function remain unclear.
Based on the above studies, we hypothesized that ADSCs may inhibit DC function in allogeneic skin transplantation by secreting TSG-6, mitigating immune rejection, and improving grafted skin survival. This study aimed to elucidate a novel mechanism of ADSC-mediated immune regulation. The findings of this study could provide new insights into developing new immunosuppressive therapies. Therefore, we investigated the effects of ADSCs on DC function through in vivo and in vitro experiments.
Materials and methods
In vivo experiments to verify the effect of ADSCs on DC expression
Cell preparation
We purchased primary ADSCs (CP-M202) and the DC2.4 cell line (CL-0545) from Procell (Wuhan, China). The ADSC suspension was centrifuged at 420 × g for 5 min. The cell pellet was washed twice with phosphate-buffered saline (PBS) and resuspended in the Dulbecco’s modified Eagle’s medium (Invitrogen, Shanghai, China) supplemented with 10% fetal bovine serum (FBS) (Gibco, Gaithersburg, MD, USA) and 1% penicillin/streptomycin (P/S) (Invitrogen). DCs were cultured in the RPMI-1640 (Roswell Park Memorial Institute, Procell, Wuhan, China) with 10% FBS and 1% P/S (Procell, Wuhan, China). Cells were plated and incubated at 37°C in 5% CO2. ADSCs were maintained in culture for three passages. At passage 3, when these cells were approximately 90% confluent, they were digested with 0.25% trypsin/ ethylenediaminetetraacetic acid (EDTA) (Gibco, Gaithersburg, MD, USA) at 37°C, washed with PBS, and pelleted by centrifugation. Subsequently, the cells were identified as described below.
Identification of ADSCs
Passage 3 cells were stained with antibodies against CD90 (E-AB-F1283C) (Elabscience, Wuhan, China), CD105 (E-AB-F1233UE) (Elabscience, Wuhan, China), CD19 (E-AB-F1004E) (Elabscience, Wuhan, China), and CD34 (E-AB-F1284D) (Elabscience, Wuhan, China). The expression of cell-surface antigens in cultured cells was analyzed by flow cytometry using a FACSCalibur kit (BD Biosciences, Pharmingen, CA, USA). ADSCs were cultured in media for adipogenic and osteogenic differentiation to assess multipotent potential. For adipogenic differentiation, once ADSCs reaching 80%–90% confluence, cells were cultured in adipogenic medium containing 0.5 mM 3-isobutyl-1-methylxanthine (IBMX, MCE, Shanghai, China), 1 µM dexamethasone (MCE, Shanghai, China), 10 µM insulin (MCE, Shanghai, China), and 200 µM indomethacin (MCE, Shanghai, China). After 14–21 days, cells were washed with PBS, fixed in 10% formalin for 30–60 min, and stained with 0.3% Oil Red O solution (C0158M) (Beyotime, Shanghai, China). For osteogenic differentiation, the cells were cultured in osteogenic medium containing 0.1 µM dexamethasone, 10 mM β-Glycerophosphate (MCE, Shanghai, China), and 50 µM ascorbic acid 2-phosphate (MCE, Shanghai, China). After 28 days, cells were washed with PBS, fixed in 10% formalin for 30–60 min, and stained with 2% Alizarin red S solution (C0148S) (Beyotime, Shanghai, China) for 10–20 min to detect calcium-rich mineralized matrix deposition.
Animal models and study design
For in vivo experiments, we established a mouse allogeneic skin graft model based on our previous experience 9 . Six- to eight-week-old male BALB/c mice (n = 6) were used as skin graft donors, and C57BL/6 mice (n = 12) were used as skin graft recipients. The mice were kept under specific pathogen-free conditions for more than 1 week before the experiment start date to allow for adaptation to the new environment. The experimental protocol was approved by the Laboratory Animal Ethics Committee of the Affiliated First Hospital of Guangzhou Medical University (No. 20230503). The experiment was divided into two groups, including the C group (control group, injection of 0.2 ml PBS) and the A group (injection of 1×10⁶ ADSCs in 0.2 ml PBS). After all the cells had been prepared, the mouse skin allografts were commenced, as demonstrated in our previous methods 9 . PBS or ADSCs were locally injected in the fascial layer of the recipient bed, respectively. Finally, the mice were dressed with gauze and adhesive bandages for 7 days. After skin graft, 20 mg/kg of meloxicam (MCE, Shanghai, China) was given as an analgesic. On postoperative day (POD) 7, the grafted skin was excised for DC expression analysis.
Flow cytometry
On POD 7, the grafted skin tissues were harvested from mice and washed with PBS. Subsequently, the tissues were minced into small pieces, transferred to an Eppendorf (EP) tube, and digested with collagenase Liberase TL (LIBIT-RO, Roche, Germany) at 37°C for 60 min. After complete digestion, the mixture was passed through a 100-mesh cell strainer for grinding and resuspended in PBS, and the cells were collected by centrifugation. The cell pellets were then centrifuged again at 4°C at 1500 rpm for 3 min, and the supernatant was discarded. The cells were resuspended in 500 µl of PBS, and a 10 µl aliquot of the suspension was taken to measure cell density. Cell density was adjusted to 1 × 10⁵ cells per tube, followed by staining with CD11c (E-AB-F0991C) (Elabscience, Wuhan, China) and major histocompatibility complex class II (MCHII) (E-AB-F0990E) (Elabscience, Wuhan, China) at 4°C for 30 min. Subsequently, the stained cells were washed and analyzed using an LSRFortessa X-20 flow cytometer (BD Biosciences, USA) and FlowJo seven software (Tree Star, USA). Flow cytometry was performed to quantify DCs, and the results were visualized as graphs. Statistical comparisons between groups were conducted using one-way ANOVA in SPSS, with P-values <0.05 considered statistically significant.
Histologic examination and immunofluorescence assay
Skin samples were collected on POD 7 after transplantation and fixed in formalin for paraffin embedding. Subsequently, the paraffin-embedded skin was sectioned into sections of 3 μm thickness. All sections were stained with hematoxylin and eosin (H&E). For immunofluorescence staining, the paraffin sections were rehydrated and subsequently subjected to antigen retrieval. Following this step, CD80 (1:500, 66406-1-Ig, Proteintech, Chicago, USA) and CD86 (1:500, bs-1035R, Bioss, Beijing, China) monoclonal antibodies were introduced and incubated overnight at 4°C. After thoroughly washing the sections, a fluorescently labeled secondary antibody (Alexa Fluor 694 anti-mouse immunoglobulin G [lgG] or Alexa Fluor 488 rabbit anti-mouse lgG) was applied and incubated for 1 h. Finally, 4′,6-diamidino-2-phenylindole (DAPI) (Sigma-Aldrich, USA) was added to facilitate nuclear counterstaining. Microscopic examination, image acquisition, and analysis were performed.
In vitro functional assays of DCs
To assess the effects of ADSCs and TSG-6 on DC function, DC2.4 cells were subjected to in vitro assays to evaluate maturation, migration, and proliferation. Cells were assigned into six groups: Control (PBS), ADSCs (co-cultured with 1×10⁶ ADSCs), TSG-6 (8 nM, 2326-T, R&D Systems, Shanghai, China), hepatocyte growth factor (HGF) (10 nM, 315-23-500, ThermoFisher, Shanghai, China), TGFβ (10 nM, 7666-MB, Bio-Techne, Shanghai, China), and galectin-1 (15 nM, 1245-GA-050/CF, R&D Systems, Shanghai, China)14–17. All treatments lasted for 24 h before downstream analyses.
Flow cytometry for DC maturation markers
After treatment, DC2.4 cells were digested, washed, and resuspended in PBS. Cells (5–10 × 106) were incubated with fluorescently labeled antibodies against CD80 and CD86 at room temperature for 60 min. After washing, cells were analyzed using a CytoFLEX S flow cytometer (Beckman Coulter, Shanghai, China). The expression levels of CD80/CD86 were used to assess DC maturation status.
Transwell migration assay
Transwell assays were performed to evaluate the effects of ADSCs and various soluble factors, including TSG-6, HGF, TGFβ, and galectin-1, on the migration of DCs. Briefly, DCs (2 × 10⁴) suspended in serum-free RPMI-1640 medium were seeded in the upper chambers of transwell inserts (pore size: 8 µm). ADSCs (1 × 10⁶) were added to the bottom in DMEM supplemented with 10% FBS. The relevant factors were appropriately diluted and added to the bottom, respectively. After 48 h of incubation, the inserts were carefully removed. Non-migration cells inside the upper wells were gently removed with cotton swabs. The membranes were then washed with PBS and fixed with 1% paraformaldehyde (PFA) for 20 min at room temperature. Following fixation, the membranes were washed with PBS and stained with 1% crystal violet solution for approximately 10 min. Excess stain was removed by washing with tap water. The membranes were excised from the inserts using a surgical blade, air-dried, and mounted with neutral resin. At least five random areas were selected for imaging using an inverted fluorescence microscope (OLYMPUS). The number of migrated cells per area was counted using Image J software (Media Cybernetics, Rockville, MD, USA), and the data were subjected to statistical analysis.
Cell Counting Kit-8 assay for DC proliferation
Treated DC2.4 cells were seeded in 96-well plates at a density of 1 × 10⁴ cells/well and incubated for 0, 24, 48, and 72 h. Cell proliferation was assessed using a Cell Counting Kit-8 (CCK-8) assay kit (C0037, Beyotime, Shanghai, China) according to the manufacturer’s instructions. Optical density (OD) at 450 nm was measured using a Synergy LX microplate reader (BioTek). To account for non-specific absorbance, OD values of all experimental groups were normalized to substrate background.
In vivo and in vitro experiments to verify the effect of ADSCs on DC by TSG-6 secretion
ADSC transfection
To further elucidate the immunomodulatory role of TSG-6 secreted by ADSCs, we established ADSCs-shTSG-6 cells. ADSCs were prepared, and the cell density was adjusted to 1 × 10⁵/ml. Cells were inoculated in increments of 2 ml into 6-well plates coated with poly-D-lysine and cultured for 24 h at 37°C with 5% CO2 and saturated humidity in a controlled cell culture environment. The TSG-6 small interfering RNA (siRNA)/short hairpin RNA (shRNA) was then carefully added to 250 μL of serum-free culture medium and mixed thoroughly with 5 μL of Lipofectamine™ 3000 (Cat.No.C0533, Beyotime, Shanghai, China) and 250 μL of serum-free medium. The siRNA/shRNA was diluted and combined with Lipofectamine™ 3000, and incubated at room temperature for 20 min to form an RNA/Lipofectamine™ 3000 complex. Subsequently, the RNA/Lipofectamine™ 3000 complex was added to the wells containing ADSCs in a culture plate while gently rocking the plate back and forth, and then incubated for 4–6 h before removing the complex to obtain the ADSCs-shTSG-6.
Animal models
For in vivo experiments to verify the effect of ADSCs on DC expression by TSG-6 secretion, another 6- to 8-week-old male BALB/c mice (n = 24) were used as skin graft donors, and C57BL/6 mice (n = 48) were used as skin graft recipients. The experiment was divided into four groups: the C group (Control group, injection of 0.2 ml PBS), T group (injection of 1 mg/kg TSG-6 in 0.2 ml PBS), A group (injection of 1 × 10⁶ ADSCs in 0.2 ml PBS), and Sh group (injection of 1 × 10⁶ ADSCs-shTSG-6 in 0.2 ml PBS). After the skin graft was completed, the cells, TSG-6, or PBS were locally injected in the fascial layer of the recipient bed, respectively. Finally, the mice were dressed with gauze and adhesive bandages for 7 days. On POD 7, half of the mice were euthanized in each group, and the grafted skin was harvested for subsequent protein and pro-inflammatory cytokine expression analysis, while the remaining mice were monitored daily and photographed until POD 14. The graft survival areas were roughly estimated based on photographs and scored on a 6-point scale (0–5) according to the estimated graft necrotic area (Table 1).
Scores to characterize skin graft rejection, described as the percentage of the total graft area.
Flow cytometry
On POD 7, the grafted skin tissue and spleen samples were harvested as mentioned above and washed with PBS. Subsequently, the tissues were minced into small pieces, transferred to an EP tube, and digested with collagenase at 37°C for 60 min. After complete digestion, the mixture was passed through a 100-mesh cell strainer for grinding and resuspended in PBS. The cells were collected by centrifugation. The cell pellets were then centrifuged again at 4°C at 1500 rpm for 3 min, and the supernatant was discarded. The cells were resuspended in 500 µl of staining buffer, and a 10 µl aliquot of the suspension was taken to measure the cell density. The cell density was adjusted to 1 × 10⁵ cells per tube. Subsequently, the cells were incubated with anti-FcgR blocking monoclonal antibody at 4°C for 30 min, followed by staining with CD11c, MCHII, CD11b (E-AB-F1081C) (Elabscience, Wuhan, China), F4/80 (E-AB-F0995E) (Elabscience, Wuhan, China), CD4 (E-AB-F1097C) (Elabscience, Wuhan, China), and CD8 (E-AB-F1104E) (Elabscience, Wuhan, China) antibodies at 4°C for 30 min. Subsequently, the stained cells were washed and analyzed using an LSRFortessa X-20 flow cytometer and FlowJo 7.0 software. Flow cytometry was performed to quantify DCs, macrophages, and lymphocytes, and the results were visualized as graphs.
Western blot analysis
Proteins were extracted from the skin tissues and cells using a radioimmunoprecipitation assay buffer (Beyotime, Shanghai, China). Total protein concentration in the lysate was determined using the bicinchoninic acid protein assay kit (Thermo Fisher Scientific, Waltham, MA, USA). Equal amounts of protein were loaded onto a 10% sodium dodecyl sulfate-polyacrylamide gel and electrophoresed on a polyvinylidene fluoride membrane. Subsequently, the membrane was incubated with 5% bovine serum albumin at room temperature for 1 h, followed by overnight incubation with specific antibodies against TNF-α (1:1000, AMC3012, Thermor, Shanghai, China), IL-6 (1:700, YF370127, Thermor, Shanghai, China), and IL-1β (1:1000, ab205924, Abcam), glyceraldehyde-3-phosphate dehydrogenase (GAPDH) (1:5000, ab8245, Abcam) at 4°C. After washing with tris-buffered saline with Tween 20 (TBST), the membranes were incubated with secondary antibody, such as goat anti-rabbit IgG H&L (HRP) preadsorbed (1:5000, ab7090, Abcam) and goat anti-mouse IgG+IgM H&L (HRP) preadsorbed (1:7000, ab47827, Abcam), at room temperature for 2 h. Finally, antigen detection was performed using the chemiluminescence imaging system PXi9 (Syngene, Frederick, USA), and quantification was performed using Image J software. All experiments were repeated at least three times.
Transwell assay
The transwell assay was described above. In order to investigate the effect of different concentrations of TSG-6 (2 nM, 4 nM, 6 nM) on the migration of DCs, we conducted another transwell assay. C-C Motif Chemokine Ligand 19 (CCL19) (50 ng/ml, Ab307797, Abcam) was used as a positive control. Furthermore, we also compared the effects of ADSC, ADSC-shTSG-6, and ADSC-shTSG-6 + TSG-6 on the migration of DCs.
RNA sequencing and data analysis
For RNA sequencing, DCs suspended in serum-free RPMI-1640 medium were seeded into the upper chambers of transwell inserts. DMEM, ADSC cells, or TSG-6 were placed in the lower chamber and co-cultured with DCs under these conditions. Following a 48-h culture period, migrated DCs were harvested and digested using trypsin. The collected migrated DCs were subsequently centrifuged at 7000 rpm for 5 min and washed twice with PBS. The cell pellets were then collected for RNA extraction and utilized in subsequent experiments. Total RNA was extracted using TRIzol reagent and treated with DNase I to remove genomic DNA. RNA purity and concentration were evaluated using a NanoDrop spectrophotometer, and integrity was verified by agarose gel electrophoresis. Poly(A)+ mRNA was enriched using oligo (dT) magnetic beads, fragmented, and used for strand-specific cDNA library construction. After end repair, A-tailing, and adaptor ligation, 200–500 bp fragments were selected and amplified by limited-cycle PCR. Library quality and concentration were assessed with Qubit and Bioanalyzer. Sequencing was performed on an Illumina HiSeq platform with paired-end 150 bp reads, targeting ~30 million reads per sample. Raw reads were quality-checked using FastQC and trimmed with Cutadapt. Clean reads were aligned to the mouse reference genome (e.g. GRCm39) using HISAT2. Gene expression was quantified using featureCounts, and differentially expressed genes (DEGs) were identified via DESeq2 (adjusted P < 0.05).
Gene enrichment analysis
The R package edge was used to conduct differential expression analysis of the samples. Following the calculation of P-values, multiple hypothesis testing correction was performed to control for the false discovery rate and determine the threshold value for significance. The selection criteria for identifying differentially expressed genes (DEGs) were set as follows: a P-value < 0.05 and fold change with any group having a fragments per kilobase of transcript per million mapped reads >1. Gene Ontology (GO) and Kyoto Encyclopedia of Genes and Genomes (KEGG) enrichment analyses were conducted using the R package clusterProfiler.
RNA extraction and real-time quantitative polymerase chain reaction
The cell treatment groups (DMEM, ADSC, and TSG-6) in the co-culture assay were mentioned above. Total RNA was prepared from co-culture cells using an RNA isolation reagent (QIAzol Lysis Reagent Cat No. /ID: 79306), and complementary DNA (cDNA) was prepared from total RNA using a Power cDNA Synthesis Kit (ThermoFisher, Shanghai, China). Polymerase chain reaction (PCR) was performed in a 20 ml mixture containing 10 ml SYBR Premix Ex Taq (Takara Bio, Otsu, Japan), 0.4 ml ROX Reference Dye (Takara Bio, Otsu, Japan), cDNA, and primers, using an ABI PRISM 7500 (Applied Biosystem, Carlsbad, CA, USA). The sequences of the primers used are shown in Table 2. Thermo-cycling conditions were 95°C for 30 s, followed by 40 cycles of denaturation at 95°C for 15 s and annealing at 60°C for 1 min. All targeted cytokine expression levels were calculated based on their threshold cycle values and were expressed as relative mRNA expression ratios normalized to a reference gene (GAPDH).
The sequences of the primers used in RT-PCR.
Statistical analysis
The results were reported as mean ± standard deviation. Statistical analysis was performed using SPSS software (SPSS, Chicago, IL, USA). Differences in multiple group parameters were assessed using a one-way analysis of variance with the Bonferroni post hoc test. Statistical significance was set at P < 0.05.
Results
Characteristics of ADSC
ADSCs express MSC markers (CD29, CD44, CD73, CD90, and CD105), but lack hematopoietic markers (CD34, CD45, and CD19) 18 . Flow cytometry confirmed that the cultured cells were positive for MSC markers (CD90 and CD105) and negative for hematopoietic markers (CD19 and CD34) (Fig. 1a). The osteogenic and adipogenic induction experiments demonstrated the capacity of the cells to differentiate into adipocytes and osteoblasts (Fig. 1b and c). These findings confirm that the isolated ADSCs possess typical MSC phenotypes and multipotent differentiation capabilities.

Characteristics of adipose-derived stem cells. (a) Positive expression for CD90 and CD105 and negative expression for CD19 and CD34. (b), (c) Differentiation of ADSCs into adipocytes and osteoblasts. After adipogenic differentiation, newly differentiated adipocytes had lipid droplets identified by Oil Red O staining. Osteogenic differentiation was confirmed by Alizarin Red S staining. ADSCs: adipose-derived stem cells; CD: cluster of differentiation.
ADSCs affected DC expression in vivo
The allogenic skin transplantation was performed as Fig. 2a. DC expression in the grafted skin was assessed using flow cytometry. The C group had a significantly lower number of DCs than the A group (P < 0.05; Fig. 2b). The immunofluorescence and histopathological results were evaluated on POD 7. As CD80 and CD86 are commonly used DC markers 19 , we used immunofluorescence to assess the CD80 and CD86 expression levels in the skin tissue. The C group had lower CD80 and CD86 levels than the A group (Fig. 2c). Histopathology was assessed as the degree of inflammatory cell infiltration based on H&E staining. More inflammatory cells infiltrated the epidermis and dermis in the C group than in the A group (Fig. 2d). These results suggest that ADSCs may modulate local immune responses by altering DC accumulation and inflammatory cell infiltration in transplanted skin.

Adipose-derived stem cells inhibited dendritic cell migration in vivo. (a) Mouse skin allotransplantation and phosphate-buffered saline (PBS) or cell infusion. (b) Expression of dendritic cells (DCs) in grafted skin. Data are expressed as fold-changes relative to levels in the control group. Statistically significant differences among groups are reported above the columns (***P < 0.001). (c) Immunofluorescence findings. CD80 (red) and CD86 (green) are commonly used as markers for dendritic cells. The expression levels of DCs in the control group were lower than in the adipose-derived stem cell (ADSC) group. (d) Comparison of histologic changes among the two groups. Inflammatory reactions were more prominent in the control group than in the experimental group on postoperative Day 7 (×4 or ×10). CD: cluster of differentiation.
TSG-6 was a key mediator of ADSC-induced inhibition of DC maturation and migration
To identify the key factors through which ADSCs regulate DC function, DCs were co-cultured with ADSCs or candidate immunomodulatory factors, including TSG-6, HGF, TGFβ, and galectin-1. Flow cytometry analysis showed that the proportion of CD80⁺CD86⁺ mature DCs was significantly decreased in all treatment groups compared to the control group (P < 0.001; Fig. 3a). A comparison was made among the results of each experimental group; the ADSC and TSG-6 groups exhibiting the prominent suppression than HFG, TGFβ, and galectin-1 groups, although no significant statistical differences were observed. DC migration was evaluated using a transwell assay. As shown in Fig. 3b, ADSCs, TSG-6, HFG and galectin-1 markedly reduced the number of migrated DCs compared to the control (P < 0.001). The ADSCs and TSG-6 groups showed fewer migrated DCs than other experimental groups. These results suggest that TSG-6 may play a major role in mediating ADSC-induced inhibition of DC mobility. To exclude the possibility that these treatments affected DC viability, a CCK-8 assay was performed. As shown in Fig. 3c, no significant differences in cell viability were observed among the groups over the 3-day observation period, indicating that the inhibitory effects of ADSCs and TSG-6 on DC maturation and migration were not attributable to cytotoxicity.
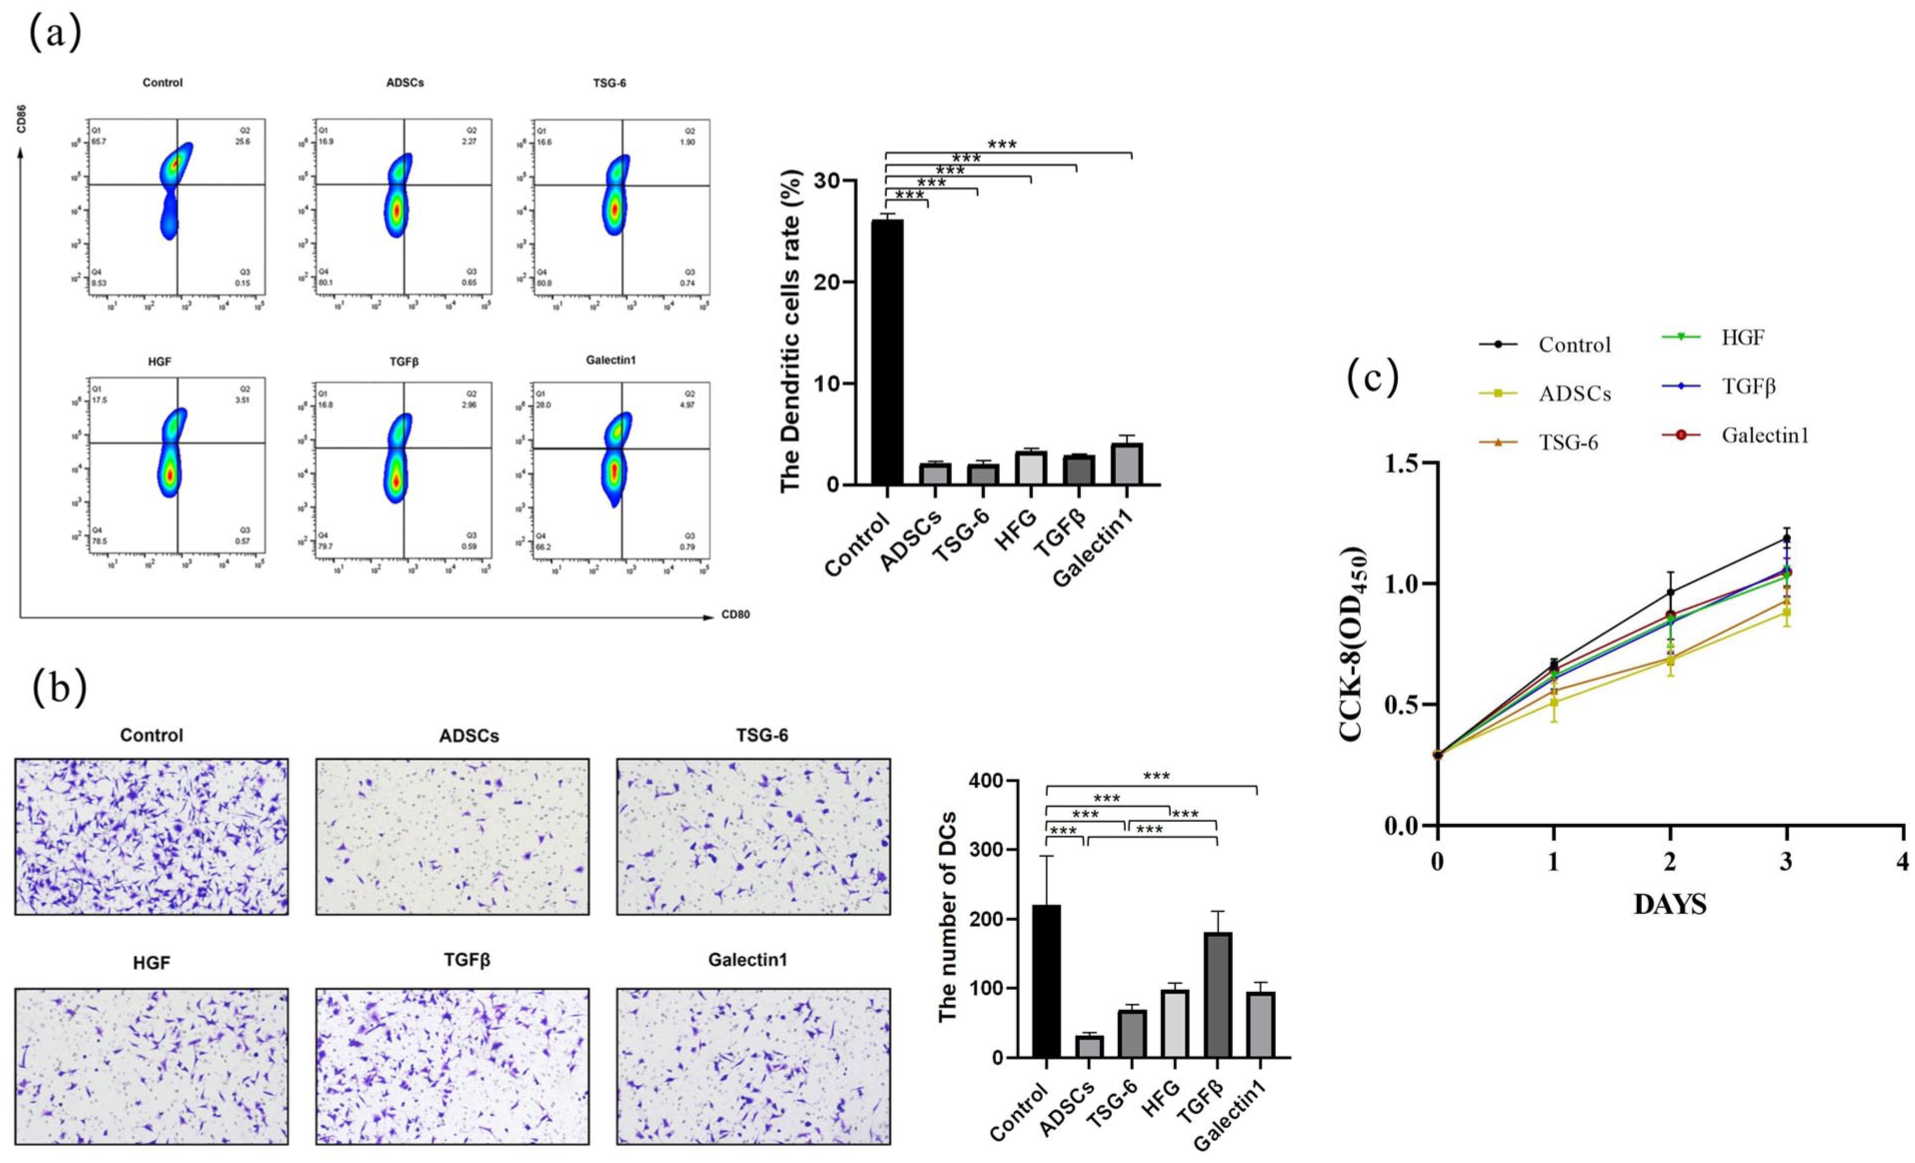
Tumor necrosis factor-α-stimulated gene 6 played a key role in inhibiting dendritic cell maturation and migration. (a) Flow cytometry analysis of dendritic cell (DC) maturation. DCs were co-cultured with adipose-derived stem cells (ADSCs) or individual immunomodulatory factors (TSG-6, HGF, TGFβ, Galectin-1), followed by staining for CD80 and CD86. Quantification of mature DCs is shown on the right. (***P < 0.001 vs control). (b) Transwell migration assay to assess DC motility after co-culture with ADSCs or indicated factors. Representative images (left) and quantification of migrated cells (right) (***P < 0.001). (c) Cell Counting Kit-8 (CCK-8) assay for DC viability. CD: cluster of differentiation; TSG-6: tumor necrosis factor-α-stimulated gene 6; HGF: hepatocyte growth factor; TGFβ: transforming growth factor beta.
Injection of ADSCs improved grafted skin survival
On POD 7, the dressing was removed, and necrotic areas of the skin graft were monitored daily and documented through photography for up to 14 days. Necrotic spots were first observed in the C group, starting on POD 7 or 8, whereas they first appeared around POD 11 in the Sh group and on POD 13 in the A and T groups (Fig. 4a). Immune rejection occurred earlier in the Sh group than in the A and T groups. The necrosis levels in the skin grafts were significantly lower from POD 10 to POD 14 in all three experimental groups than in the C group. The A and T groups had slightly higher scores than the Sh group, and significant differences were observed between the A and Sh groups on PODs 11 and 12 (P < 0.05; Fig. 4b). These findings indicate that ADSC injection, particularly via TSG-6, can delay immune rejection and improve graft survival in allogeneic skin transplantation.
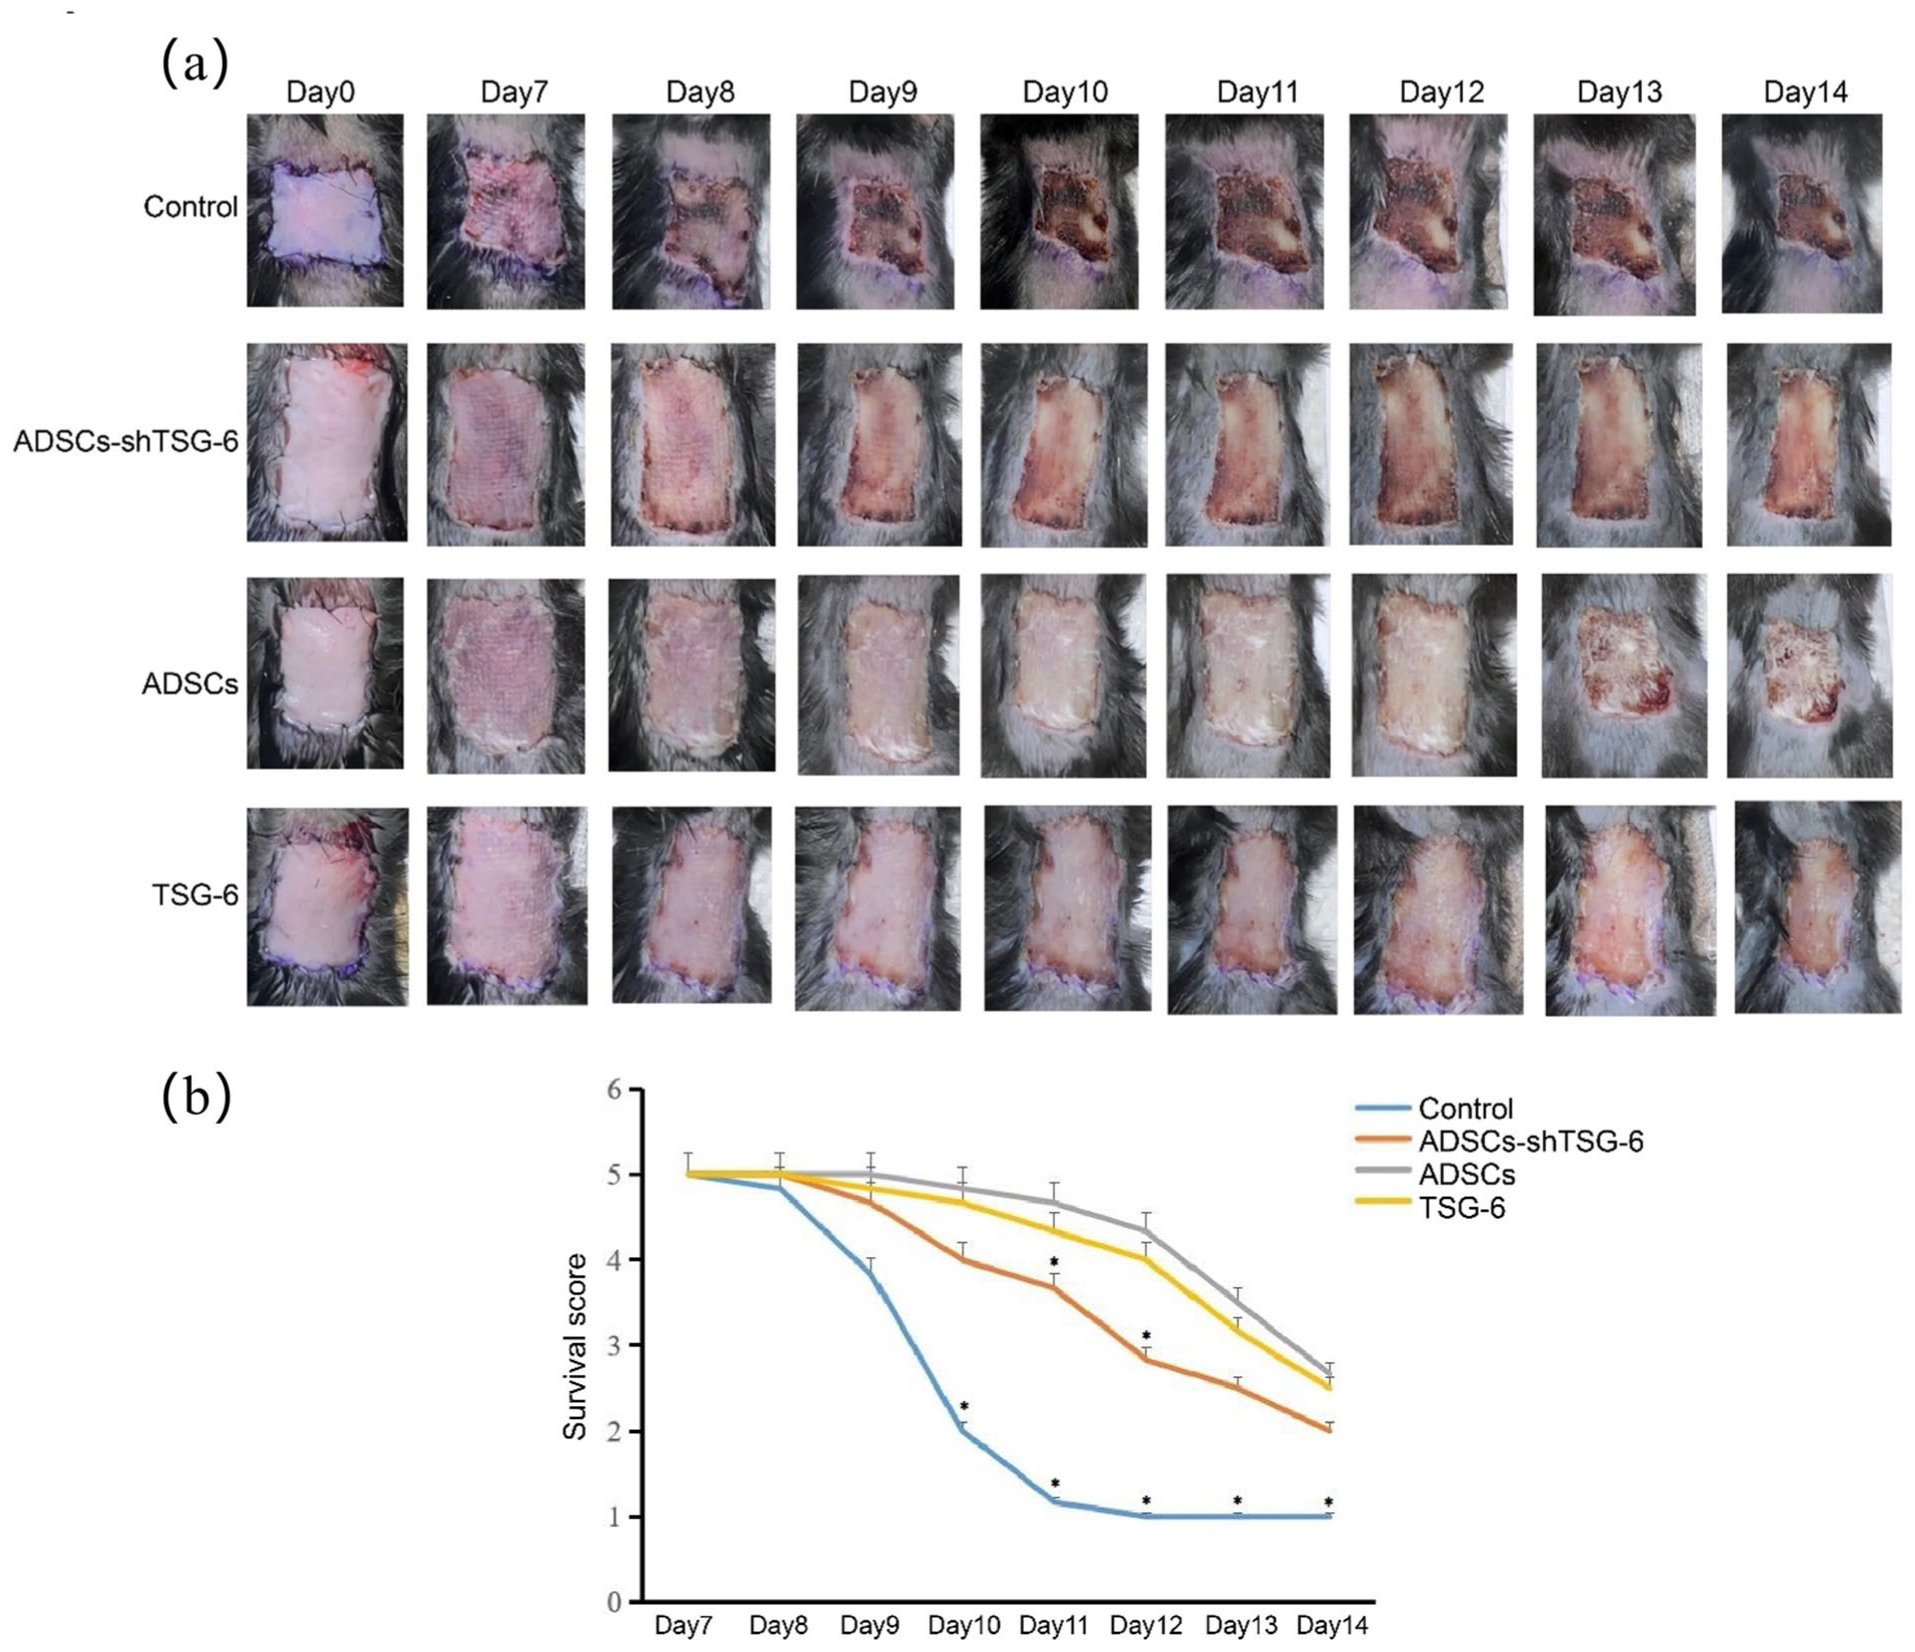
Allograft rejection. (a) Mouse skin allotransplantation with PBS or TSG-6 or ADSCs or ASDCs-shTSG-6 infusion in the four groups. And skin allograft appearance of the four groups from postoperative Days 7 to 14. (b) Different score levels indicate different necrotic areas of the mouse skin allograft (*P < 0.05). PBS: phosphate-buffered saline; TSG-6: tumor necrosis factor-α-stimulated gene 6.
ADSCs inhibited DC expression and reduced macrophage and lymphocyte infiltration by secreting TSG-6
DC, macrophage, and lymphocyte expression in the skin and spleen was assessed using flow cytometry. The C and Sh groups had a significantly lower numbers of DCs in the grafted skin than the T and A groups, suggesting that TSG-6 inhibited donor skin DC migration to the recipient site (P < 0.05; Fig. 5a). Macrophage expression in the skin was reduced in all experimental groups compared to that in the control group; notably, it was significantly lower in the T and Sh groups than in the control group (Fig. 5b). We also evaluated CD4+ and CD8+ lymphocyte expression in the skin and showed that all three experimental groups exhibited decreased CD4+ lymphocyte expression relative the C group, although no statistically significant differences were observed (p > 0.05; Fig. 5c). Notably, while the A and Sh groups had reduced CD8+ lymphocyte expression levels, the T group had increased CD8+ lymphocyte expression.

Immune cell expression in grafted skin. Expression of (a) dendritic cells, (b) microphages, and (c) lymphocytes in grafted skin. Data are expressed as fold-changes in relation to levels in the control group. Statistically significant differences among groups are reported above the columns (*P < 0.05; **P < 0.01).
The experimental groups had significantly elevated DC expression in the spleen compared to the control group, with the T and A groups having notably higher levels relative to the Sh group (P < 0.05; Fig. 6a). Conversely, macrophage expression in the spleen was markedly reduced across all three experimental groups compared to that in the control group (P < 0.05; Fig. 6b), with the T and A groups having significantly lower levels than the Sh group. CD4+ lymphocyte expression in the spleen was not noticeably variable among the four groups (P > 0.05); however, CD8+ lymphocyte expression mirrored that of macrophages (P < 0.05; Fig. 6c). These data suggest that ADSCs modulated local and systemic immune responses by secreting TSG-6, which altered DC migration and suppressed macrophage and lymphocyte infiltration.
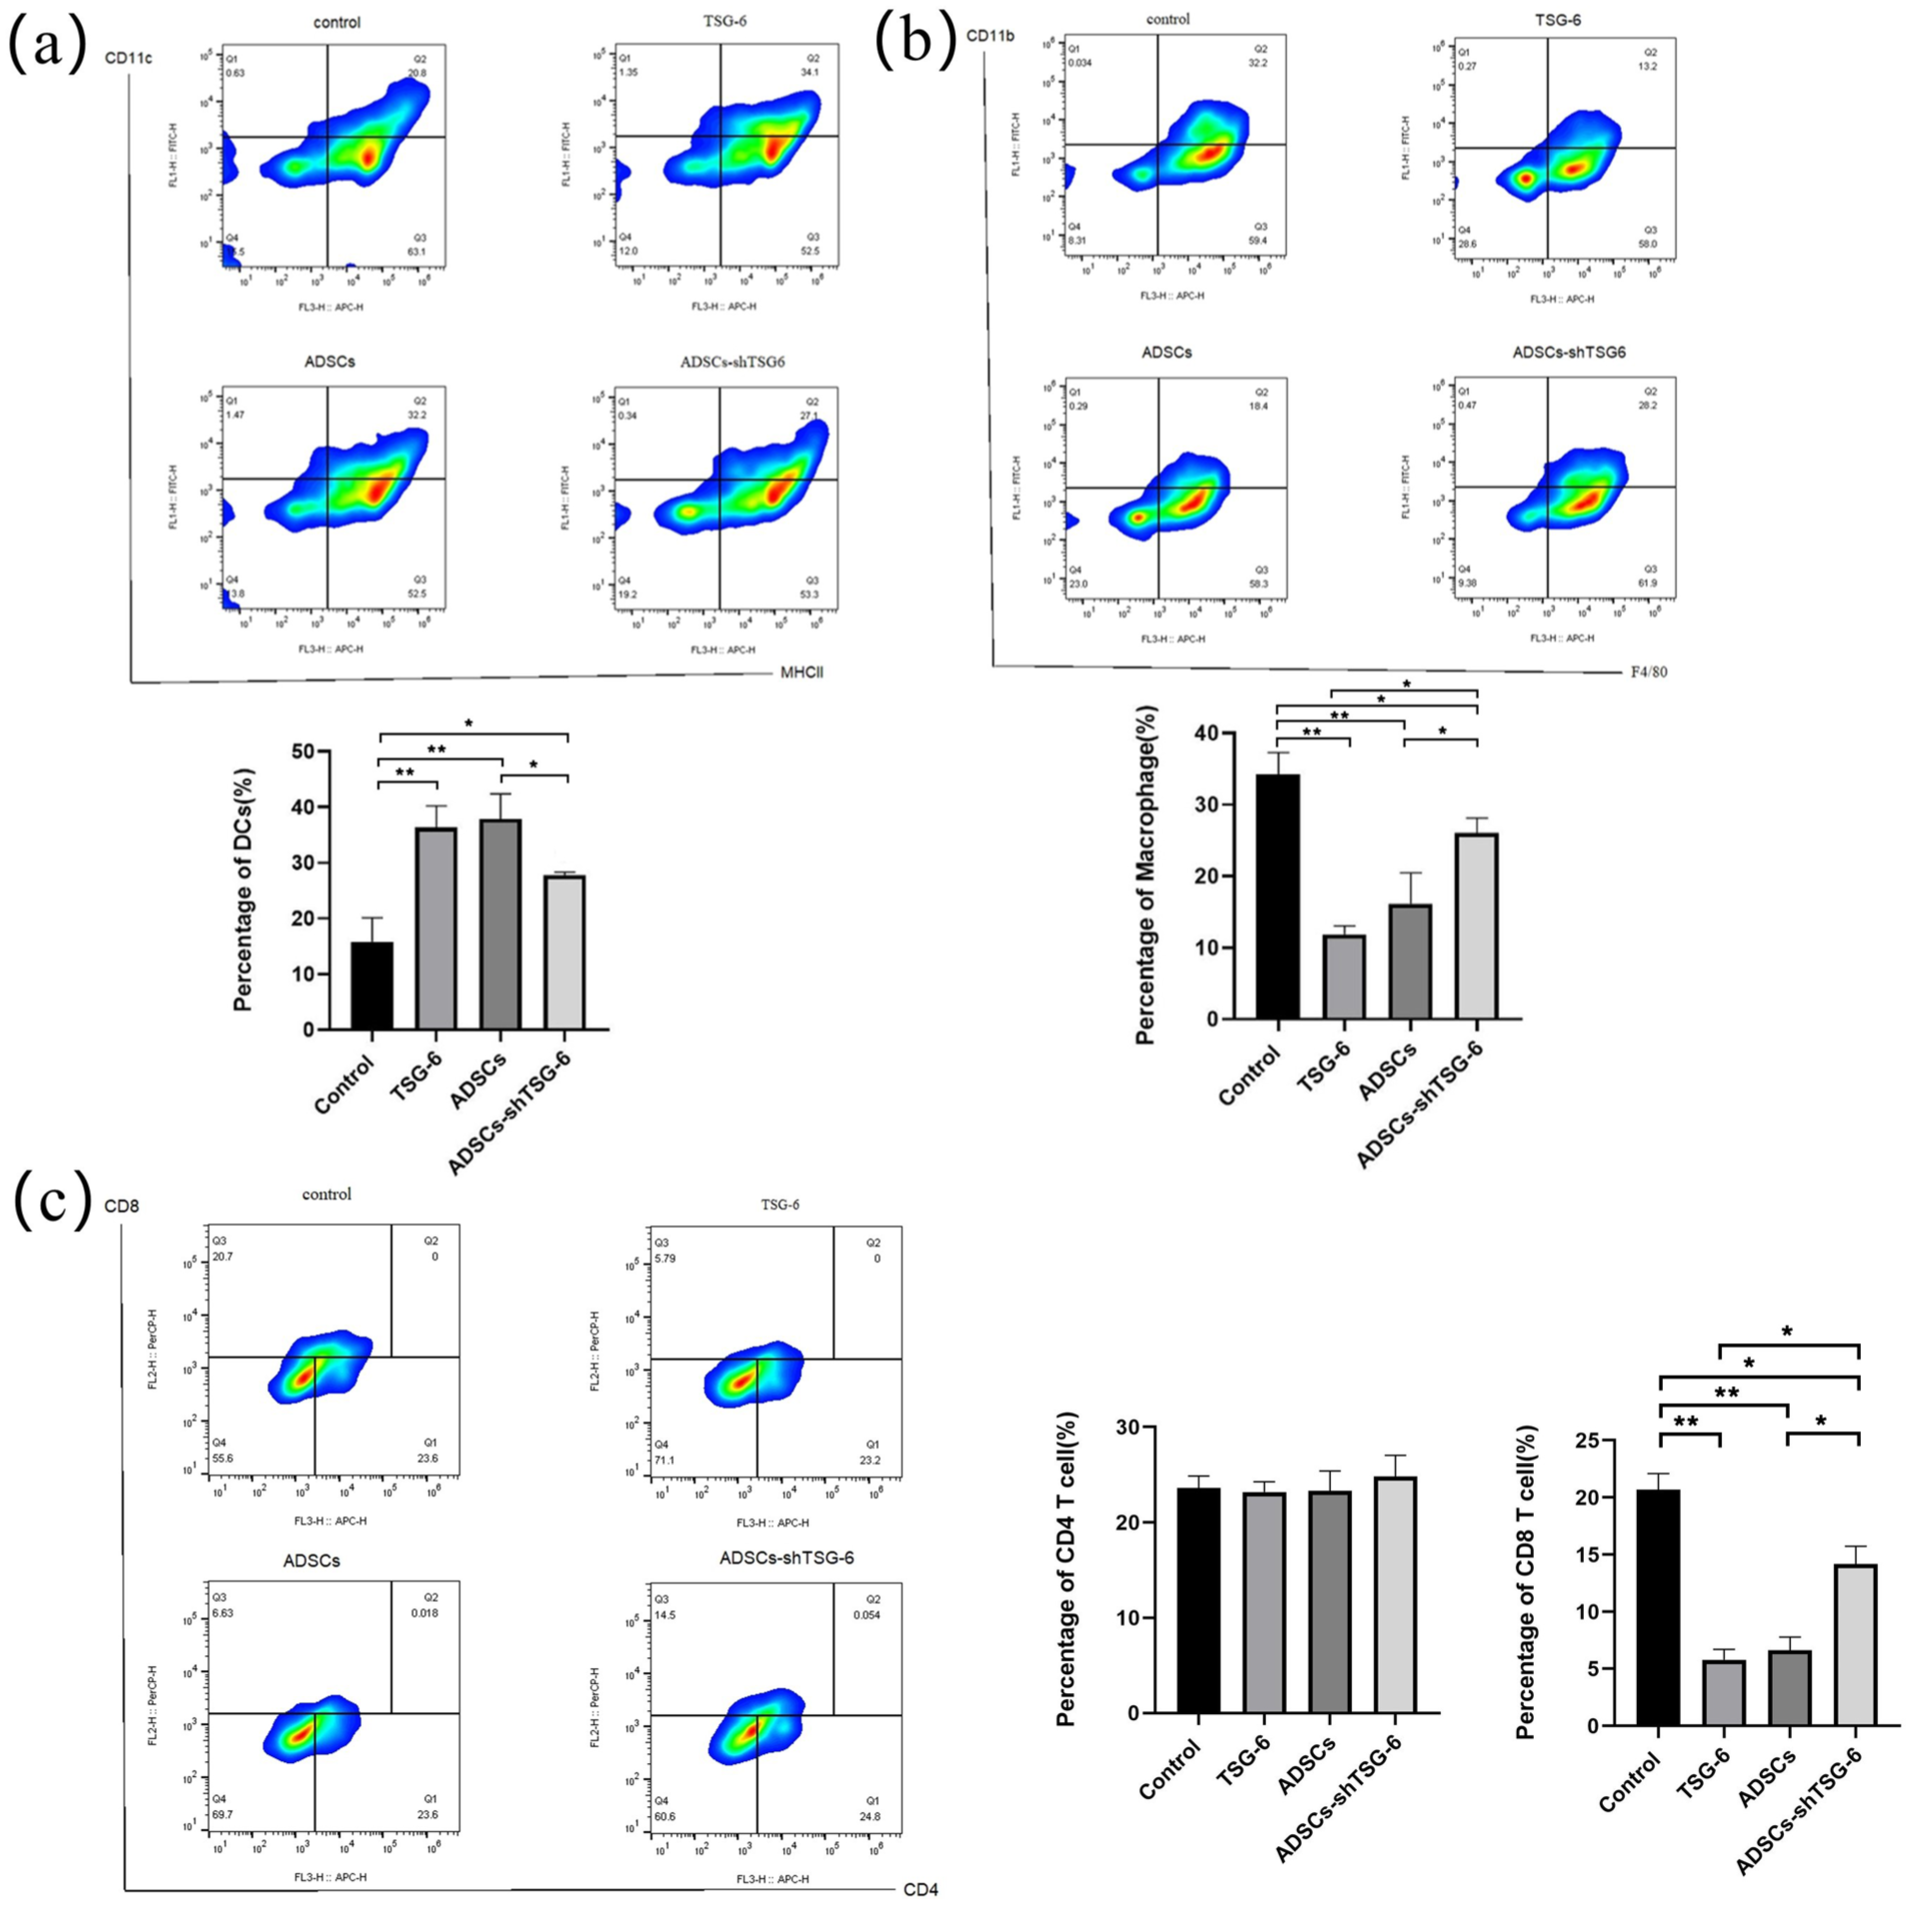
Immune cell expression in spleen tissue. Expression of (a) dendritic cells, (b) microphages, and (c) lymphocytes in the spleen. Data are expressed as fold-changes relative to levels in the control group. Statistically significant differences among groups are reported above the columns (*P < 0.05; **P < 0.01).
Cytokine expression analysis
The expression levels of pro-inflammatory cytokines (TNF-α, IL-6, and IL-1β) in the skin across the groups were evaluated using western blotting (Fig. 7a). The A and T groups had lower pro-inflammatory cytokine levels than control and Sh groups (P < 0.05 or P < 0.01; Fig. 7b). These results suggest that ADSCs, particularly through TSG-6, exerted anti-inflammatory effects in skin allotransplantation by reducing key pro-inflammatory cytokines.

Pro-inflammatory cytokine expression in skin tissue. (a) Protein expression of tumor necrosis factor α (TNF-α), interleukin (IL)-6, and IL-1β. (b) Data are expressed as fold-changes relative to levels in the control group. Statistically significant differences among groups are reported above the columns (*P < 0.05; **P < 0.01).
Migration of DCs in vitro was inhibited by TSG-6
We used a transwell assay to evaluate the effect of TSG-6 on DC migration. After inducing DC migration using CCL19, the cells were co-cultured with varying concentrations of TSG-6 (Fig. 8a). TSG-6 effectively inhibited the migration of DCs, and this inhibitory effect became more pronounced with increasing TSG-6 concentration (P < 0.05; Fig. 8b). To further verify the effect of TSG-6 secreted by ADSCs on DCs, we co-cultured ADSCs or transfected ADSCs with migrating DCs induced by CCL19 and found that the ability of transfected ADSCs to inhibit DC migration was weakened (P < 0.05; Fig. 8c). When we added TSG-6 again, the ability of the transfected ADSCs to inhibit the migration of DCs was restored (Fig. 8d), which also indicates that ADSCs affected the ability of DCs to migrate, with TSG-6 as a key factor. These findings confirm that ADSC-mediated suppression of DC migration was predominantly dependent on TSG-6 secretion.

Tumor necrosis factor-α-stimulated gene 6 secreted by adipose-derived stem cells inhibited dendritic cell migration in vitro. (a, b) Tumor necrosis factor-α-stimulated gene 6 (TSG-6) effectively inhibited the migration of dendritic cells (DCs), and this inhibitory effect became more pronounced with increasing TSG-6 concentrations. (c, d) The ability of transfected adipose-derived stem cells (ADSCs) to inhibit the migration of DCs was weakened. When TSG-6 was added again, the ability of transfected ADSCs to inhibit the migration of DCs was restored (*P < 0.05; **P < 0.01).
Transcriptomic analysis and functional enrichment of DCs under different treatments
To explore the molecular mechanisms by which TSG-6 modulates DC function, we performed transcriptomic analysis of DCs treated with TSG-6 (T), co-cultured with ADSCs (A), or untreated (control, C). Volcano plots revealed significant gene expression changes in both T versus C and A versus C groups (Fig. 9a). RT-qPCR validation confirmed that several DEGs—Adrenomedullin (ADM), Growth Hormone Releasing Hormone (GHRH), Selenium Binding Protein 1 (SELENBP1) and N-myc Downstream Regulated Gene-1 (NDRG1)—were significantly downregulated in the TSG-6 and ADSC groups (Fig. 9b), consistent with the transcriptome results. GO enrichment analysis showed that DEGs in both treatment groups were significantly enriched in immune regulatory processes, such as positive regulation of interferon-beta response, type I interferon signaling pathway, chemokine (C-X-C motif) ligand production, neutrophil chemotaxis, and negative regulation of leukocyte migration. These functions were mainly localized to the cytoplasmic and extracellular compartments and involved activities such as cytokine activity and nucleotide binding (Fig. 9c). EGG pathway enrichment indicated that DEGs in the TSG-6 group were primarily enriched in pathways related to innate immune regulation and ECM remodeling, including retinoic acid–inducible gene I (RIG-I)-like receptor, chemokine signaling, ECM–receptor interaction, and glycosaminoglycan biosynthesis (Fig. 9d). These results suggest that TSG-6 regulated inflammatory signaling and modulated DC migration and immune activation via the ECM-related remodeling.
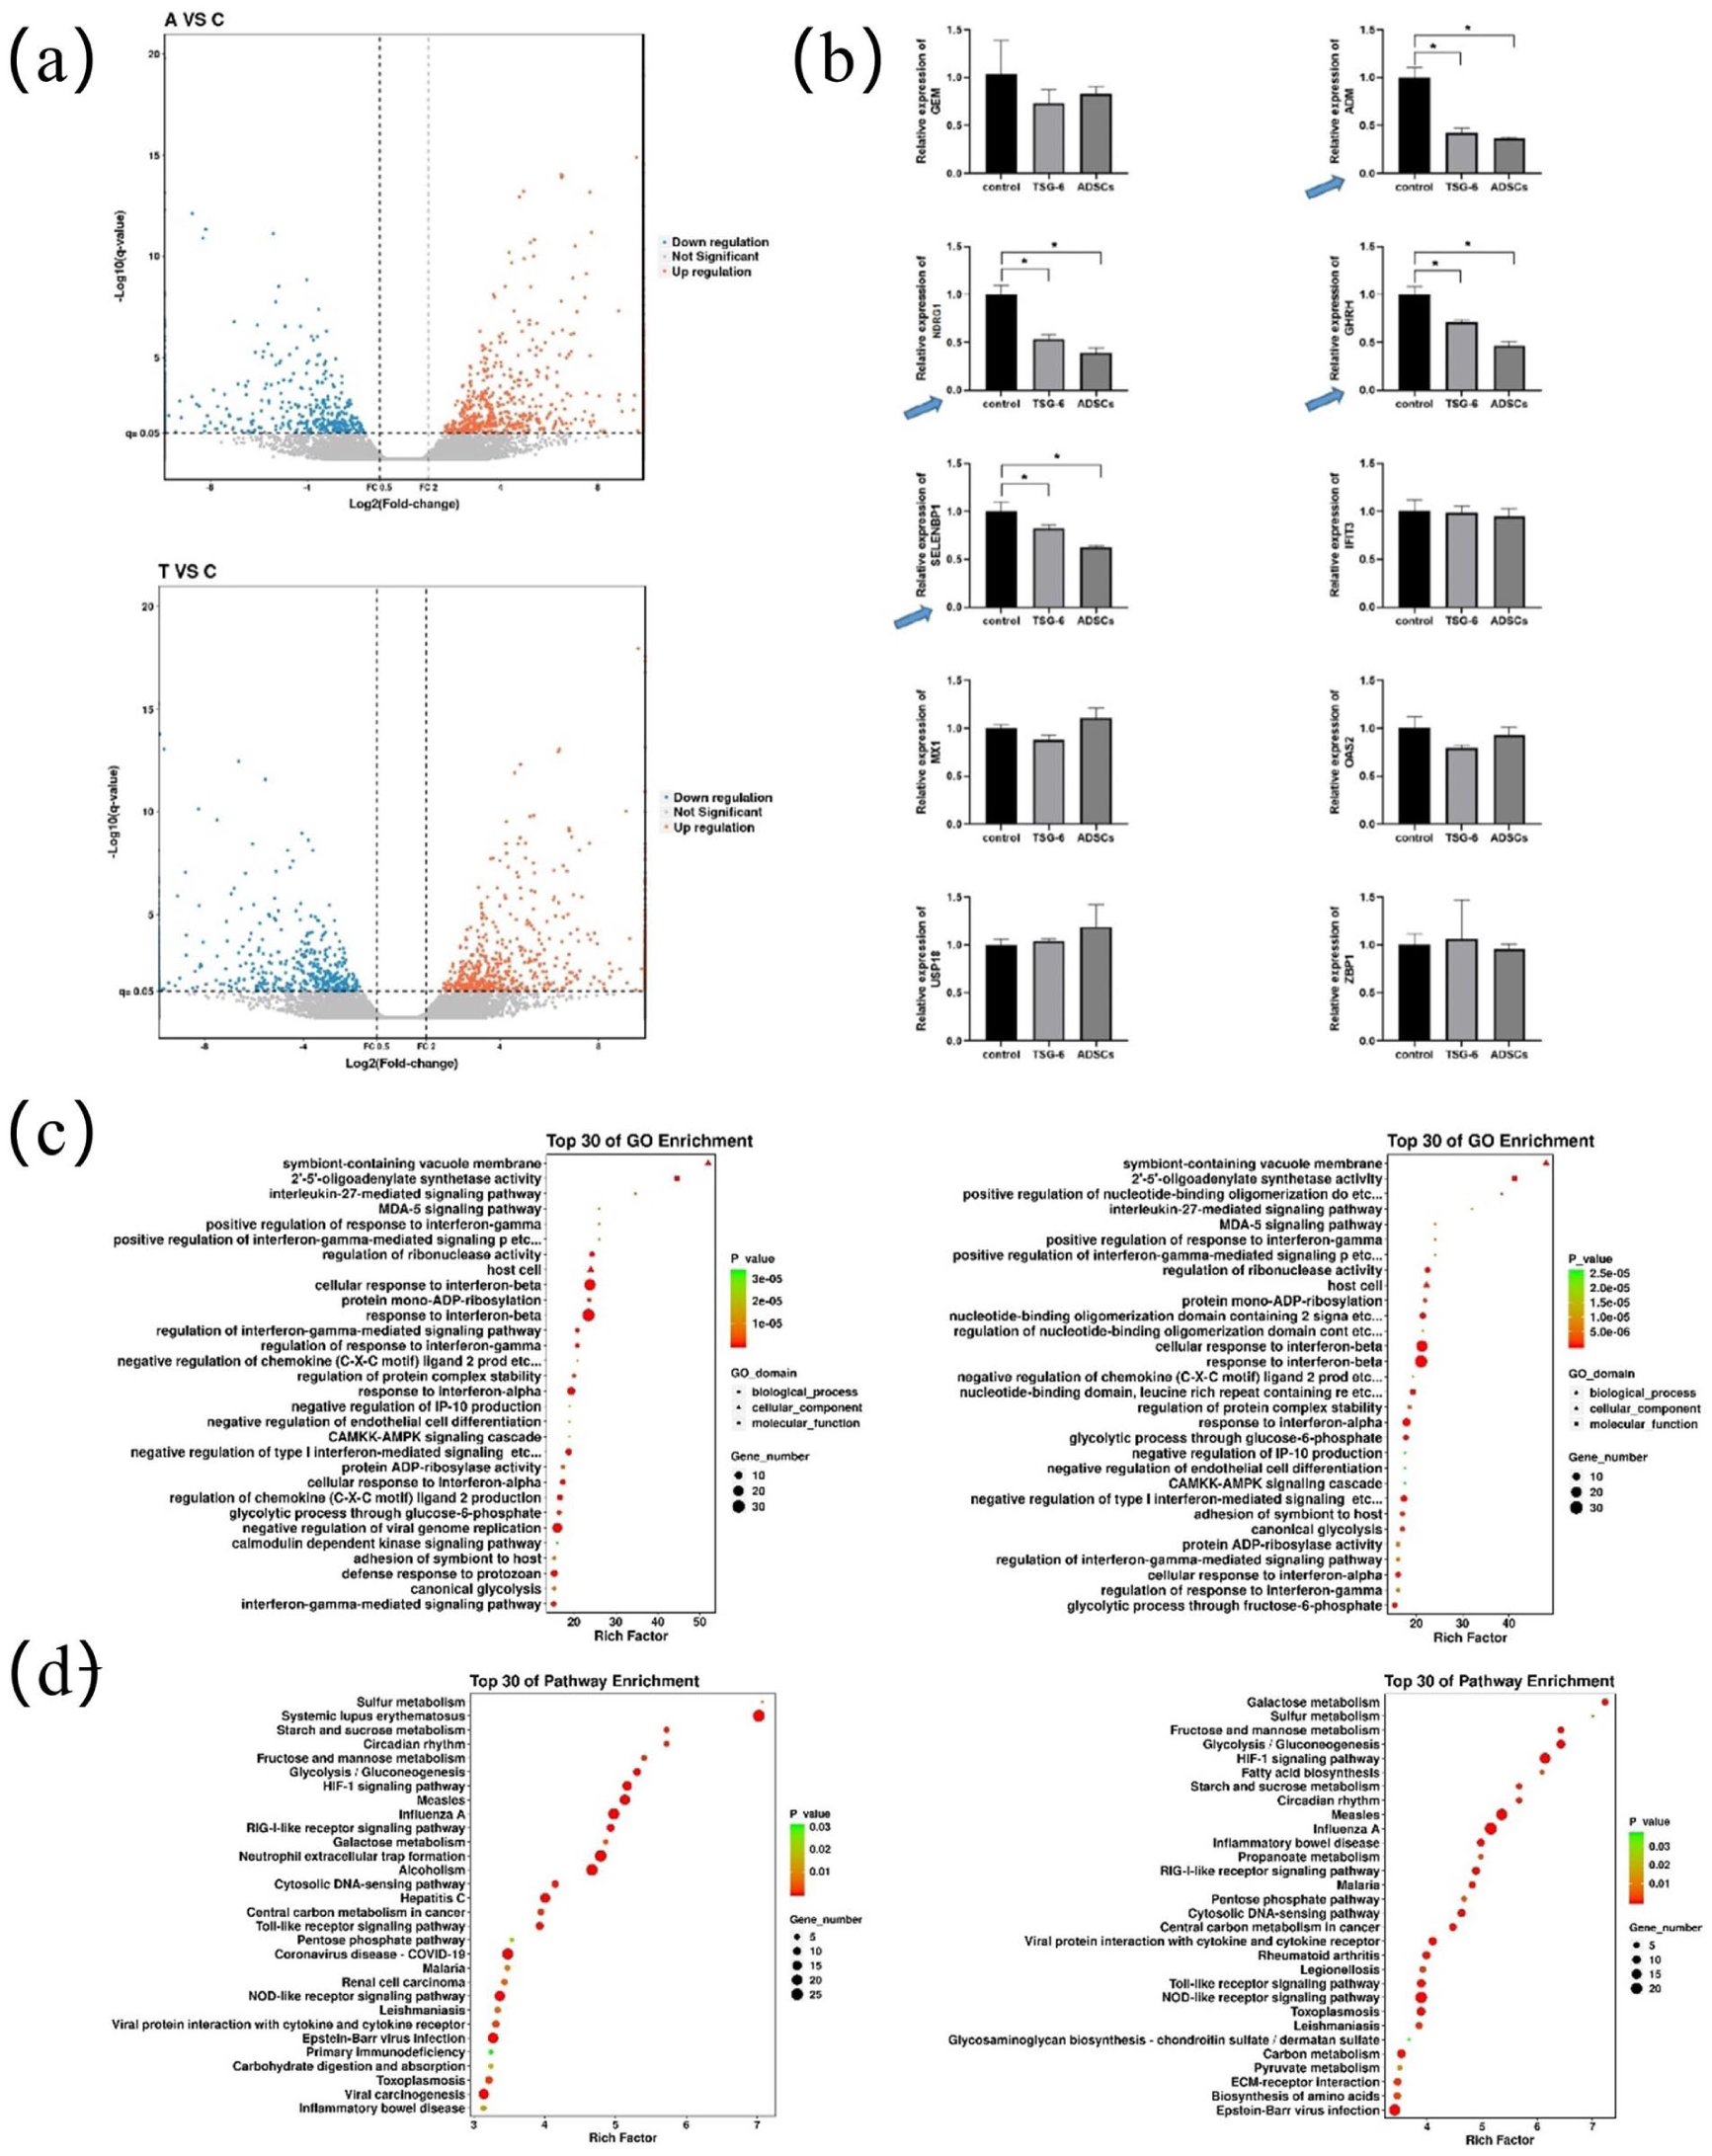
Transcriptomic analysis and functional enrichment of dendritic cells under different treatments. (a) Volcano plots of differentially expressed genes (DEGs) comparing ADSCs versus control (top) and TSG-6 versus control (bottom) groups. Red and blue dots indicate upregulated and downregulated genes, respectively (|log2FC| > 1, P < 0.05). (b) RT-qPCR validation of selected DEGs involved in immune modulation (ADM, GHRH, NDRG1, SELENBP1, etc.) in DCs from control, TSG-6, and ADSC groups (*P < 0.05). (c) GO enrichment analysis of DEGs in the ADSC (left) and TSG-6 (right) groups, showing the top 30 terms from biological processes (BP), molecular functions (MF), and cellular components (CC). (d) KEGG pathway enrichment of DEGs in ADSC (left) and TSG-6 (right) groups. Bubble size indicates gene count, and color represents adjusted p-values (C: control group; A: ADSC group; T: TSG-6 group). ADSC: adipose-derived stem cell; TSG-6: tumor necrosis factor-α-stimulated gene 6; RT-qPCR: real-time quantitative polymerase chain reaction; ADM: adrenomedullin; GHRH: growth hormone–releasing hormone; SELENBP1: selenium binding protein 1; NDRG1: N-myc downstream regulated gene-1; GO: gene ontology; KEGG: Kyoto Encyclopedia of Genes and Genomes.
Discussion
MSCs have been extensively studied in regenerative medicine and tissue engineering. ADSCs are a type of MSC that can self-renew and differentiate into several tissues, including bone, cartilage, stroma, fat, muscle, and tendon 20 . Given the abundant availability of adipose tissue and easy accessibility of ADSCs, ADSCs have garnered significant attention. Furthermore, compelling evidence suggests that ADSCs have immunomodulatory inhibitory capabilities that can augment the allogeneic skin graft survival rate. However, the precise mechanism underlying their immunomodulatory effects remains unresolved9,21. Paracrine effects are believed to be the primary mechanism through which ADSCs exert their immunosuppressive therapeutic effects by secreting diverse immunomodulatory factors that suppress inflammation, prevent apoptosis, promote angiogenesis, and regulate immune responses11,22–24.
Generally, donor skin DCs migrate to the recipient’s secondary lymphoid organs after skin allografting, where they can present the donor antigens. Recipient T cells are directly activated upon recognition of the allogeneic major histocompatibility complex antigen presented by the donor-derived DCs, after which the recipient T cells enter the donor tissue. CD4+ and CD8+ T cells are activated after allogeneic recognition, leading to the proliferation and secretion of pro-inflammatory cytokines and their differentiation into effector cells. These activated effector T cells leave the secondary lymphoid organs and infiltrate the grafts, causing acute rejection 25 . Typically, the inflammatory phase starts from 1–3 days after the injury, and immune rejection occurs 3–5 days after allografting without immune treatment, with visible necrotic signs appearing on the skin 7–10 days later4,26,27.
Recent research has demonstrated that MSCs, including ADSCs, exert immunoregulatory effects primarily through the paracrine secretion of soluble mediators such as HGF, TGFβ, galectin-1, and TSG-628,29. In our preliminary screening, TSG-6 exhibited a markedly stronger inhibitory effect on DC maturation and migration than the other factors tested. This aligns with studies showing that TSG-6 modulates the immune microenvironment by attenuating kappa-light-chain-enhancer of activated B cells (NF-κB) signaling, altering chemokine gradients, and inhibiting leukocyte trafficking 30 . In our in vitro assays, recombinant TSG-6 significantly suppressed DC migration, while knockdown of TSG-6 in ADSCs (ADSCs-shTSG-6) weakened this effect. In vivo, all three treatment groups (ADSCs, TSG-6, and ADSCs-shTSG-6) delayed the onset of immune rejection compared to the control, but immune rejection occurred earlier in the ADSCs-shTSG-6 group. Flow cytometry analysis revealed distinct patterns of DC, macrophage, and T lymphocyte expression in skin and spleen tissues on postoperative Day 7. Notably, TSG-6 reduced DC infiltration in the skin, while exerting variable effects on macrophages and T cells between local and systemic compartments. These results confirm that TSG-6 is a key effector molecule underlying ADSC-mediated immunoregulation in allogeneic transplantation. Compared to other ADSC-derived factors, TSG-6 played a dominant role in shaping immune responses, particularly by targeting DC migration and activity.
TSG-6 is an inflammation-associated secreted protein that has been implicated as having important and diverse tissue protective and anti-inflammatory properties, for example, mediating many of the immunomodulatory and beneficial activities of mesenchymal stem/stromal cells 12 . Numerous animal models have demonstrated the wide-ranging effects of TSG-6, including its ability to inhibit inflammation, reduce tissue damage, promote wound healing by reducing pro-inflammatory cytokines to mitigate atherosclerosis, exert anti-fibrotic effects on wound healing, and enhance autophagy to reduce liver cell apoptosis31–34. Using the allogeneic corneal graft model, Oh et al. 35 observed that MSC injections improved graft survival rates primarily through TSG-6 secretion to attenuate early inflammatory responses. Furthermore, Kato et al. 36 demonstrated that ADSCs suppressed immune rejection in allogeneic renal grafts in rats via the interaction between TSG-6 and CD44. In the present study, we established an allogeneic skin graft model and demonstrated that ADSCs also exhibited immunosuppressive properties by inhibiting DC function, reducing macrophage and lymphocyte expression levels, and reducing the production of pro-inflammatory cytokines (TNF-α, IL-6, and IL-1β).
Numerous studies have demonstrated the ability of TSG-6 to bind diverse chemokines, influencing cellular function 37 . Specifically, TSG-6 binds to chemokine ligand 8, a chemoattractant of neutrophils, and regulates its interaction with heparan sulfate proteoglycans in endothelial cells. This regulatory mechanism inhibits neutrophil migration 13 . Furthermore, MSC-secreted TSG-6 effectively suppresses macrophage activation by downregulating the NF-κB signaling pathway 38 . In vitro experiments have confirmed that MSC-secreted TSG-6 deactivates the MAPK and NF-κB signaling pathways in bone marrow-derived DCs, affecting their functionality39,40.
In the present study, we conducted gene enrichment analysis to identify the common DEGs between ADSCs and TSG-6 affecting DCs. The results indicated that TSG-6 significantly downregulated ADM, SELENBP1, GHRH, and NDGR1 expression. However, further investigations into the potential effects of these genes on signaling pathways have not been conducted. Some studies have indicated that the inducible chemokine CCL17 and its cognate receptor chemokine receptor 4 regulate cutaneous DC migration to the skin-draining lymph nodes41,42.
Therefore, this study elucidates a mechanism of the immunomodulatory capacity of ADSCs, which is attributed to the secretion of TSG-6, a factor that governs diverse immune cell functions. This finding highlights the complexity of ADSCs’ immune regulatory mechanisms. Moreover, TSG-6 demonstrates significant potential for immune modulation, offering promising new avenues for the development of immunosuppressants.
However, several limitations should be acknowledged. While we demonstrated the effects of ADSC-secreted TSG-6 on DC, macrophage, and T cell functionality, we did not investigate whether TSG-6 influences DCs and how this affects or directly modulates T cell function. In addition, we did not explore the specific DC signaling pathways that may be affected by TSG-6. Further studies are warranted to delineate the detailed mechanisms, assess therapeutic efficacy in clinically relevant models, and ensure biosafety prior to clinical application.
Footnotes
Ethical Considerations and Consent to Participate
The experimental protocol was approved by the Laboratory Animal Ethics Committee of the Affiliated First Hospital of Guangzhou Medical University (No. 20230503), Guangzhou, China. And there are no human subjects in this article and informed consent is not applicable.
Author Contributions
Julong Hu, Hang Ji, Wenjing Liao, and Xiaowen Zhang participated in research design. Julong Hu, Wenxu Peng, and Yeltai Nurzat participated in the writing of the paper. Julong Hu, Wenxu Peng, Yeltai Nurzat, Qi Zhang, Zaihuan Lin, Jianlei Xie, and Meiqian Xu participated in the performance of the research. Julong Hu, Wenxu Peng, Yeltai Nurzat, Gang Liang, Zhihua Zhang, Hang Ji, Wenjing Liao, and Xiaowen Zhang participated in data analysis.
Funding
The author(s) disclosed receipt of the following financial support for the research, authorship, and/or publication of this article: This work was financially supported by Academician Workstation of the First Affiliated Hospital of Guangzhou Medical University, National Clinical Key Specialty Construction Project (2021–2024); Guangzhou Medical Key Discipline Construction Project (2021–2023); and Guangzhou Postdoctoral Scientific Research Project (2022–2025).
Declaration of Conflicting Interests
The author(s) declared no potential conflicts of interest with respect to the research, authorship, and/or publication of this article.
Availability of Data and Material
The authors confirm that the data supporting the findings of this study are available within the article.
Statement of Human and Animal Rights
This article does not contain any studies with human or animal subjects.
Statement of Informed Consent
There are no human subjects in this article and informed consent is not applicable.