
Abstract
Autologous nerve transplantation (ANT) remains the gold standard for treating nerve defects. However, its efficacy in nerve repair still requires improvement. Mitochondrial dysfunction resulting from nerve injury may be a significant factor limiting nerve function restoration. This study investigated the impact of supplementing exogenous mitochondria (EM) in ANT and explored its effect on the efficacy of ANT in nerve repair. SD rats were used to prepare a model of a 10 mm sciatic nerve defect repaired by ANT (Auto group) and a model of ANT supplemented with EM (Mito group). At 12 weeks post-operation, functional, neurophysiological, and histological evaluations of the target organ revealed that the Mito group exhibited significantly better outcomes compared with the Auto group, with statistically significant differences (P < 0.05). In vitro experiments demonstrated that EM could be endocytosed by Schwann cells (SCs) and dorsal root ganglion neurons (DRGs) when co-cultured. After endocytosis by SCs, immunofluorescence staining of autophagy marker LC3II and mitochondrial marker Tomm20, as well as adenoviral fluorescence labeling of lysosomes and mitochondria, revealed that EM could promote autophagy in SCs. CCK8 and EDU assays also indicated that EM significantly promoted SCs proliferation and viability. After endocytosis by DRGs, EM could accelerate axonal growth rate. A sciatic nerve defect repair model prepared using Thy1-YFP-16 mice also revealed that EM could accelerate axonal growth in vivo, with statistically significant results (P < 0.05). This study suggests that EM enhances autophagy in SCs, promotes SCs proliferation and viability, and increases the axonal growth rate, thereby improving the efficacy of ANT. This research provides a novel therapeutic strategy for enhancing the efficacy of ANT in nerve repair.
Keywords
Introduction
Peripheral nerve defects are common clinical conditions associated with sensory loss, motor dysfunction, target organ atrophy, and potential lifelong disability, imposing significant burdens on families and society1,2. With the development of tissue engineering, various tissue-engineered nerves have been developed in recent years to repair peripheral nerve defects, demonstrating certain reparative effects3,4. However, the capacity of tissue-engineered nerves to enhance nerve defect repair is limited compared with autologous nerve transplantation (ANT) and may face challenges related to biocompatibility during clinical application. Consequently, ANT remains the predominant treatment modality for peripheral nerve defects5,6.
Although ANT is currently the gold standard for treating large nerve defects, extensive research indicates that it only partially restores nerve function 7 . Animal experiments have shown that in rats with a 1 cm sciatic nerve defect repaired by ANT, overall recovery reaches only 50% to 70% of the unaffected side, and as defect length increases, repair outcomes progressively deteriorate8,9. Similarly, in dogs with a 3 cm tibial nerve defect repaired by ANT, only partial functional recovery is achieved 10 . Clinical cases further suggested that nerve defects resulting from trauma or tumors often lead to muscle atrophy, partial impairment of motor and sensory functions, and significant impacts on patients’ daily lives7,11,12. In human, the recovery grade of motor and sensation function is M3 and S2 after an 8 cm ulnar nerve defect was repaired by anterior interosseous nerve 13 . A meta-analysis including a total of 33 studies and 1,531 cases reveal that only about 45% of adults can recover muscle strength above grade 4 and sensation above grade 3 after ANT 14 . Thus, enhancing the efficacy of ANT is a critical research direction.
After peripheral nerve injury, axonal regeneration entails a series of complex biological processes 15 , with adequate energy supply serving as the foundation for these processes16,17. Regeneration of axons, particularly the synthesis and extension of growth cones 18 , requires substantial energy consumption. However, peripheral nerve injury can lead to transient disturbances in neuronal energy metabolism, which may impede axonal regeneration. Therefore, supplementing exogenous mitochondria (EM) to improve post-injury energy metabolism represents a potential direction for enhancing the efficacy of ANT.
Mitochondria, often referred to as the “powerhouses” of cell metabolism, play crucial roles in tissue regeneration19,20. Studies have shown that following nerve injury, endogenous mitochondria can be transported to damaged sites to enhance local energy metabolism, facilitating axonal regeneration 21 . In addition, increasing mitochondrial transport and improving neuronal energy metabolism significantly promote axonal regeneration after spinal cord injury 22 . Furthermore, studies have demonstrated that transplantation of EM at the site of nerve injury in rodents can notably enhance nerve function recovery 23 . Previous studies from our group have shown favorable outcomes in repairing rat sciatic nerve defects using allogeneic decellularized nerves loaded with EM 24 . These findings collectively suggest that increasing the quantity and quality of mitochondria at the site of injury to augment local energy metabolism can improve the repair of peripheral nerve injuries. However, there is limited literature on whether transplanting EM can influence the efficacy of ANT.
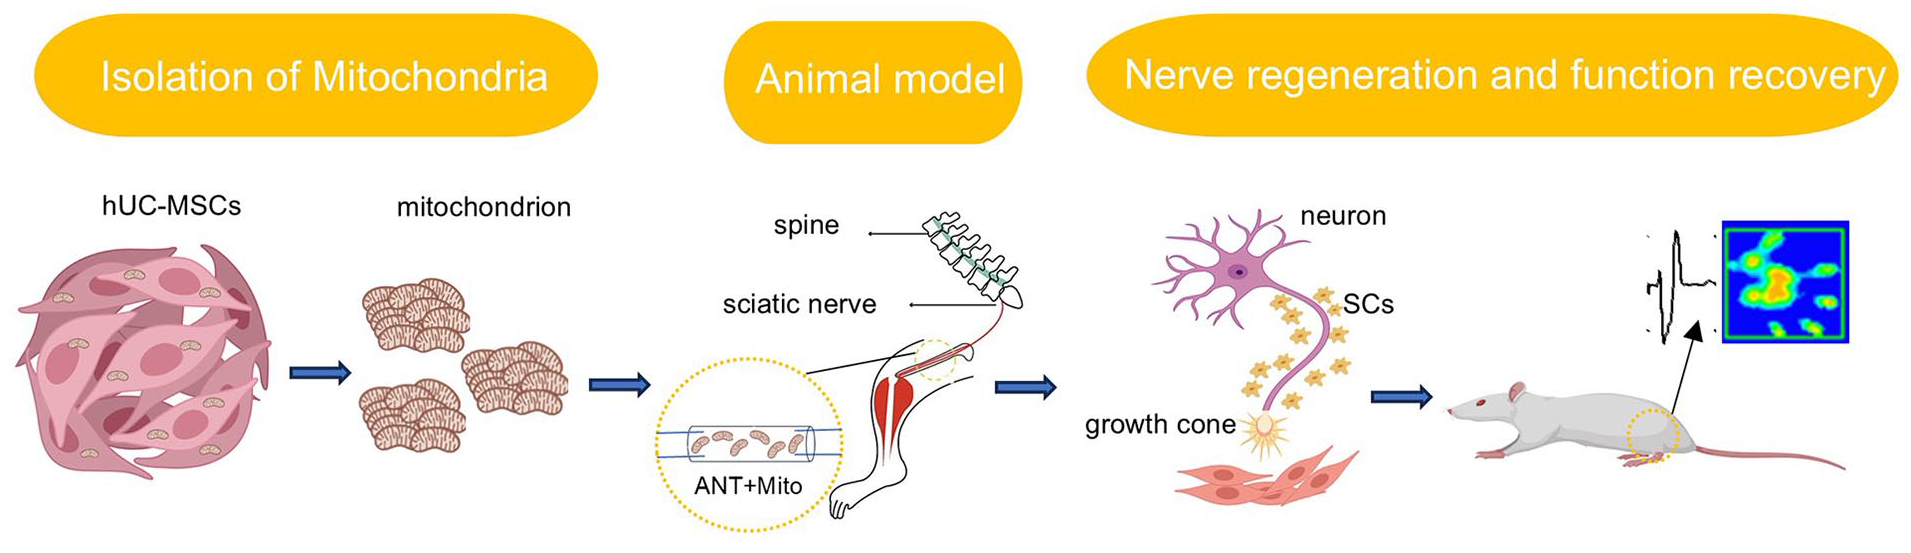
The study investigated the effects of human umbilical cord mesenchymal stem cell-derived mitochondria (hUC-MSCs-Mito) on Schwann cells (SCs) proliferation in vitro at first. Subsequently, these mitochondria will be transplanted into autologous nerve grafts to repair 10 mm sciatic nerve defects in rats, evaluating their reparative effects to elucidate their impact on the efficacy of ANT.
Experiment
Experimental Design
Isolation of mitochondria
Mitochondria were extracted from passage 3 hUC-MSCs using the method described by our previous study 24 . Briefly, hUC-MSCs were cultured and harvested, followed by removal of the supernatant after centrifugation. Then, 800 μL of Mitochondrial Extraction Reagent A (Thermo Fisher, USA) was added to the cell pellet, vortexed for 5 s, and incubated at 4°C for 2 min. Next, 10 μL of Mitochondrial Extraction Reagent B was added, vortexed for 5 s, and incubated at 4°C for 5 min. After centrifugation at 700 × g for 10 min at 4°C, the supernatant was discarded, and the pellet was obtained. The pellet was further centrifuged at 12,000 × g for 15 min at 4°C to obtain purified mitochondria. For fluorescence labeling of mitochondria, MitoTracker Red (Thermo Fisher, USA) was added to the cell suspension at a concentration of 200 nM, followed by incubation for 30 min. The cells were then washed with PBS three times before mitochondria extraction to obtain fluorescently labeled mitochondria. Mitochondrial quantification was performed using the BCA assay kit (Thermo Fisher, USA).
Animal model
Eight-week-old female Sprague-Dawley (SD) rats were purchased from Beijing Vital River Laboratory Animal Technology Co., Ltd. The operation was carried out following the Guidelines for Ethical Review of Animal Welfare in China (GB/T 35892-2018). All experiments were approved by the Experimental Animal Ethics Committee of PLA General Hospital (approval number: 2016-x9-07). The rats were anesthetized with sodium pentobarbital intraperitoneally (Merck, Germany; 30 mg/kg) before random grouping. After satisfactory anesthetization, the right sciatic nerve of the rat was exposed in a sterile environment. Above the nerve bifurcation, a 10 mm sciatic nerve defect was created. In Mito Group, the severed sciatic nerve was flipped, and a microinjector was used to inject 25 µg of mitochondria into it, then the proximal and distal ends of the sciatic nerve were respectively coapted to the proximal and distal ends of the autologous nerve. In Auto group, the severed sciatic nerve was flipped, and a microinjector was used to inject 25 µl of PBS into the autologous nerve, then the proximal and distal ends of the sciatic nerve were, respectively, coapted to the proximal and distal ends of the autologous nerve. To visualize the process of axonal regeneration in vivo, using the same repair method as in rats, we prepared a 5-mm nerve defect and repair model in thy1-gfp mice. After awakening, the rats and mice were fed in groups, and food and drinking water were automatically supplied. A 12:12 light/dark natural circle was adopted in the feeding environment.
Gait analysis
Gait analysis was performed using the CatWalk XT system (Nodus, Netherlands) to assess the motor function of rats at 4, 8, and 12 weeks post-operation. The sciatic functional index (SFI) was calculated to evaluate motor recover. The calculation formula of SFI is 109.5 (ETS–NTS)/NTS – 38.3 (EPL–NPL)/NPL + 13.3 (EIT–NIT)/NIT – 8.8. E: experimental; N: normal; PL: print length from heel to longest toe; TS: total spread, or the transverse distance between the first and the fifth toes; IT: intermediate toes, or the transverse distance between the second and fourth toes.
Neuroelectrophysiological detection
Compound muscle action potentials (CMAPs) of gastrocnemius muscles were recorded using Medlec synergy electrophysiological system (Oxford Instruments Inc., UK) in each group 12 weeks post-operation to assess nerve conduction recovery. At 12 W after operation, rats in each group were anesthetized with pentobarbital sodium and the sciatic nerve was fully exposed. Then the stimulation electrodes were placed at the proximal end of the anastomosis, and the electrical signals of gastrocnemius were recoded. Statistical analysis was subsequently made to evaluate the size of the compound muscle action potential (CMAP) of each group. Rectangular pulse (0.1 ms duration, 0.3 mA intensity, 3 Hz frequency) was used to acquire the CMAP. The ratio of the right to the left CMAP is used as the recovery rate of the CMAP.
Toluidine blue staining of regenerated nerve fibers
At 12 weeks postoperatively, the distal segments of nerve grafts were fixed in paraformaldehyde for 24 h, then 1 μm thick cross-sections were cut using an ultrathin slicer (Daitome Ultra45。, Switzerland). After rinsing with tap water, the sections were immersed in 0.1% toluidine blue staining solution for 5 min, followed by rinsing with water to remove excess dye. Dehydration was performed using alcohol, followed by clearing with xylene, and then slides were sealed. Photographs were taken using a microscope (Nikon), with three random fields selected for each sample. Image Pro Plus software was used to calculate the density of myelinated nerve fibers per unit area and statistical analysis was conducted.
Transmission electron microscopy of regenerated nerve fibers
At 12 weeks postoperatively, the distal segments of nerve grafts were fixed in formaldehyde for 24 h, then ultrathin sections with a thickness of 70 nm were obtained using an ultrathin slicer. Staining was performed using a 3% concentration of lead citrate and uranyl acetate in copper grids with polyvinyl alcohol-coated/carbon support membranes. Transmission electron microscopy (Hitachi HT7800, Japan) was used to observe the myelin sheath under a voltage of 80 kV and a magnification of 1,000 to 5,000x. Three random fields were selected for each sample, and Image Pro Plus software was used to measure the thickness of the myelin sheath and the diameter of the myelinated fibers for statistical analysis.
Weighing and histological observation of the effector muscle
The gastrocnemius of the model and opposite sides were collected from SD rats and weighed. The ratio of the wet weight of the model side muscle to that of the opposite side muscle was calculated. Then, the muscle was placed in 4% paraformaldehyde for fixation overnight, and then dehydrated with 50%, 70%, 90%, and 100% ethanol. The muscle was embedded in paraffin, and sliced into a 10-µm-thick piece. Then Masson staining was performed. After sealing the slide, it was imaged under a microscope (Nikon, Japan). The cross-sectional area of gastrocnemius fibers was calculated using Image J software. Three visual fields of each sample were selected, and the average value was taken as the ultimate muscle fiber cross-sectional area of the sample.
Isolation and culture of dorsal root ganglion (DRG) and SCs
To investigate the effect of EM on SCs and DRG in vitro, DRGs were isolated from embryonic day 15 SD rats, and primary DRG neurons were obtained using a method described in previous literature. SCs were isolated from 72-h-old neonatal SD rats and cultured according to established protocols4,8,24.
Mitochondrial uptake study
Purified mitochondria were co-cultured with primary DRG neurons and P3 SCs in vitro. After 48 h of co-culture, fluorescence microscopy was used to observe the fluorescence expression in the cells treated with fluorescently labeled mitochondria compared with untreated cells.
Simultaneously, in order to investigate the fate of mitochondria in rat nerve grafts, fluorescently labeled mitochondria were introduced into the autologous nerve graft repair model of 10 mm rat sciatic nerve defects. At 3 days, 7 days, and 14 days postoperatively, the transplanted sciatic nerve segments were collected for immunofluorescence detection of the fluorescent signals of EM in SCs, axons, and macrophages, to clarify whether EM can be engulfed by cells in vivo. Details of animal model preparation are provided in the Animal Experiment section, and details of immunofluorescence staining methods are provided in the Immunofluorescence section.
Assessment of SCs proliferation
P3 SCs were seeded in 96-well plates, and mitochondrial group (Mito group) were treated with purified mitochondria (20 µg/ml). Control group were treated with PBS. Cell proliferation was assessed at 24, 48, 72, and 96 h using the Cell Counting Kit-8 assay (Dojindo, Japan). In addition, SCs proliferation was evaluated using the EdU incorporation assay (Beyotime, China) after 48 h of culture with mitochondria.
Axon length measurement
In vitro, DRG tissues were co-cultured with hUC-MSCs mitochondria for 7 days, followed by immunofluorescent staining for NF-100 to measure axon growth length. In vivo, thy1-GFP mice were used to visualize axon regeneration in a 5 mm nerve defect and repair model, and axon growth distance was measured using laser confocal microscopy (Lecia SP8, Germany) after tissue optical clearing 25 at 7, 10, and 21 days post-operation.
Immunofluorescence staining
In the study, for tissue samples, samples were fixed in 4% paraformaldehyde for 12 h. The sample was dehydrated in 20, and 30% sucrose for 12 h, and then sliced to a 10-µm-thick piece by a frozen slicer (Leica CM 1950, German). For cell samples, samples were fixed in 4% paraformaldehyde for 15 min. The samples were rinsed in PBS and incubated in goat serum working solution for 30 min. Then, samples were incubated at 4°C overnight in a primary antibody working solution. The next day, samples were rinsed using PBS and incubated in a secondary antibody working solution for 2 h at 24°C. Furthermore, samples were rinsed thrice using PBS, after which the nuclei were stained with DAPI, sealed with an aqueous sealer, and imaged using a laser confocal microscope. For tissue samples, three visual fields were selected for each sample, and the fluorescence density was calculated. For cell samples, 100 cells were selected for each sample. Fluorescence density was quantified using Image Pro Plus software. The specific antibodies and working concentrations are described (Table 1).
The Working Concentration of Antibody.

Transfection of SCs
SCs were transfected with adenovirus carrying lysosome GFP and mitochondrial keima fluorescence proteins to visualize lysosomes and mitochondria. SCs were transfected with virus for 48 h and then cultured with EM for 48 h. The lysosome GFP was imaged by confocal microscopy (Lecia SP8, Germany) using 488 nm excitation light, and the relative number of lysosome was represented by the fluorescence intensity of the lysosome. Mitochondrial keima was imaged with 488 and 561 nm excitation light. Keima protein is a PH-sensitive fluorescent protein that emits green light in alkaline and neutral environments and red light in acidic environments. Thus, the degree of mitochondrial autophagy can be determined by Keima protein color. The ratio of mitochondrial fluorescence intensity at 561 nm to that at 488 nm was used as the autophagy index. The higher the value was, the stronger the autophagy was. Doctor Chunling Xu (Tsinghua University) donated the adenovirus to the experiment.
Statistical analysis
SPSS 22.0 software (IBM, USA) was used for statistical analysis. One-way analysis of variance followed by the Student-Newman-Keuls test was used for two-group comparison. All data are expressed as mean ± standard deviation (SD), and statistical significance was defined as P < 0.05.
Experimental Results
Sciatic functional index
SFI is a reliable index to evaluate the recovery of nerve function. Gait analysis was performed 1, 2, 3 months after surgery to evaluate the recovery of neurological function at different time. Gait analysis (Fig. 1) revealed that at 4 weeks post-surgery, the SFI of rats in the Mito (n = 6) and Auto (n = 6) groups were −86 ± 4 and −81 ± 3, respectively, showing no significant statistical difference (P > 0.05). At 8 weeks post-surgery, the SFIs of the two groups were −74 ± 3 and −69 ± 3, respectively, with a significant difference observed (P < 0.05). At 12 weeks post-surgery, the SFIs of the two groups were −66 ± 3 and −58 ± 3, respectively, showing a significant difference (P < 0.05), with the Mito group outperforming the Auto group.

(A) Footprints of rats at 12 weeks post-surgery, with LH representing the control side and RH representing the experimental side. (B) Contact area between rat toes and the ground surface at 12 weeks post-surgery. (C) Statistical analysis of sciatic nerve function index at 4, 8, 12 weeks post-surgery. Data are expressed as mean ± SD.
Neuronal regeneration
To assess the quantity and quality of regenerated nerves, at 12 weeks post-surgery, toluidine blue staining (Fig. 2A) revealed that the nerve fiber density per unit area in the Mito(n = 6) and Auto (n = 6) groups was 11,803 ± 697/mm2 and 10,287 ± 653/mm2, respectively. The nerve fiber density (Fig. 2D) in the Mito group was significantly higher than that in the Auto group (P < 0.05). TEM (Fig. 2B) showed that the myelin sheath thickness of myelinated nerve fibers in the Mito (n = 6) and Auto (n = 6) groups was 1.12 ± 0.14 μm and 0.89 ± 0.09 μm, respectively. The myelin sheath thickness of myelinated nerve fibers (Fig. 2E) in the Mito group was significantly greater than that in the Auto group (P < 0.05). Immunofluorescence staining (Fig. 2C) for NF200 showed fluorescence intensity values of 25 ± 4 and 23 ± 3 in the Mito (n = 6) and Auto (n = 6) groups, respectively, with no significant difference between the two groups (P > 0.05, Fig. 2F). Immunofluorescence staining for S100 showed fluorescence intensity values of 55 ± 7 and 40 ± 6 in the Mito(n = 6) and Auto (n = 6) groups, respectively, with a significant difference between the two groups (P < 0.05, Fig. 2F). The results showed that EM could significantly improve the quality and quantity of nerve regeneration.

(A) Toluidine blue staining of regenerated myelinated nerve fibers. (B) TEM scanning of regenerated nerve fibers. (C) Staining of regenerated nerve fibers’ axons and SCs, with green representing axons and red representing SCs. (D) Statistical analysis of myelin density. (E) Statistical analysis of myelin thickness. (F) Statistical analysis of axon fluorescence density. (G) Statistical analysis of SCs fluorescence density. Data are expressed as mean ± SD.
Regeneration of target muscles
To evaluate the innervation of target muscles by regenerated nerves, at 12 weeks post-surgery, the ratio of the CMAP amplitude and wet weight of the affected side to that of the healthy side in the gastrocnemius muscle was measured as an indicator of the recovery rate. In the Mito (n = 6) and Auto (n = 6) groups, the wet weight ratios (Fig. 3A) were 0.64 ± 0.04 and 0.57 ± 0.01, respectively, the CMAP amplitude ratios (Fig. 3C) were 0.60 ± 0.04 and 0.51 ± 0.03, respectively. Evaluation of the gastrocnemius muscle cross-sectional area by Masson staining (Fig. 3B) showed values of 1,654 ± 58 μm2 and 1,534 ± 50 μm2 for the Mito (n = 6) and Auto (n = 6) groups, respectively. The results indicated that at 12 weeks post-surgery, the Mito group exhibited significantly better recovery rates for muscle cross-sectional area (Fig. 3E), wet weight (Fig. 3D), and CMAP (Fig. 3F) compared with the Auto group, with statistically significant differences, P < 0.05. The results showed that EM could improve the innervation ability of regenerated nerve to target muscle.

(A) Gross images of the gastrocnemius muscle at 3 months post-surgery. (B) Masson staining of cross-sections of the gastrocnemius muscle. (C) Compound muscle action potential waveforms of the gastrocnemius muscle. (D) Statistical analysis of wet weight recovery rates of the gastrocnemius muscle. (E) Statistical analysis of cross-sectional areas of muscle fibers in the gastrocnemius muscle. (F) Statistical analysis of CMAP recovery rates of the gastrocnemius muscle. Data are expressed as mean ± SD.
Endocytosis of EM
Endocytosis is the prerequisite for EM to function. In vitro experiments: After culturing with EM for 24 h, fluorescence imaging revealed the presence of fluorescent signals of EM within the cytoplasm of both DRG and SCs (Fig. 4A). Furthermore, when fluorescently labeled mitochondria were injected into the autologous nerves of rats, fluorescence signals of EM (Fig. 4B) were observed in SCs, axons, and macrophages at 3, 7, and 14 days post-surgery, indicating that EM could be internalized by cells both in vitro and in vivo.

Endocytosis of EM. (A) Fluorescence microscopy images showing abundant red fluorescence within the cytoplasm of both neuron and SCs, indicating the presence of exogenous mitochondria. (B) Fluorescence microscopy images of autologous nerve grafts injected with exogenous mitochondria at 3 days post-surgery. The images demonstrate the endocytosis of exogenous mitochondria by SCs (green), macrophages (purple), and axons (yellow). The red fluorescence represents exogenous mitochondria. Fluorescence signals persisted at 14 days post-surgery.
Proliferation and viability assay of SCs
To evaluate the effect of EM on SCs proliferation and viability after endocytosis, after 48 h of culture, EDU staining (Fig. 5A, B) showed that the proliferation rate of SCs in the Mito group (n = 3) was 34% ± 1%, while it was 20% ± 2% in the Auto group (n = 3), indicating a significant statistical difference between the two groups (P < 0.05). CCK8 assay (Fig. 5C) results showed that the OD values of the Mito group (n = 3) and the Auto group (n = 3) at 24 h of culture were 0.132 ± 0.009 and 0.130 ± 0.005, respectively (P > 0.05). At 48 h of culture, the OD values were 0.247 ± 0.003 and 0.199 ± 0.002, respectively (P < 0.05). At 72 h of culture, the OD values were 0.401 ± 0.005 and 0.353 ± 0.006, respectively (P < 0.05). At 96 h of culture, the OD values were 0.624 ± 0.018 and 0.449 ± 0.006, respectively (P < 0.05). These results indicate that there were no significant statistical differences between the two groups at 24 h of culture, but significant differences were observed at 48, 72, and 96 h of culture. The results showed that EM could promote SCs proliferation and vitality in vitro.
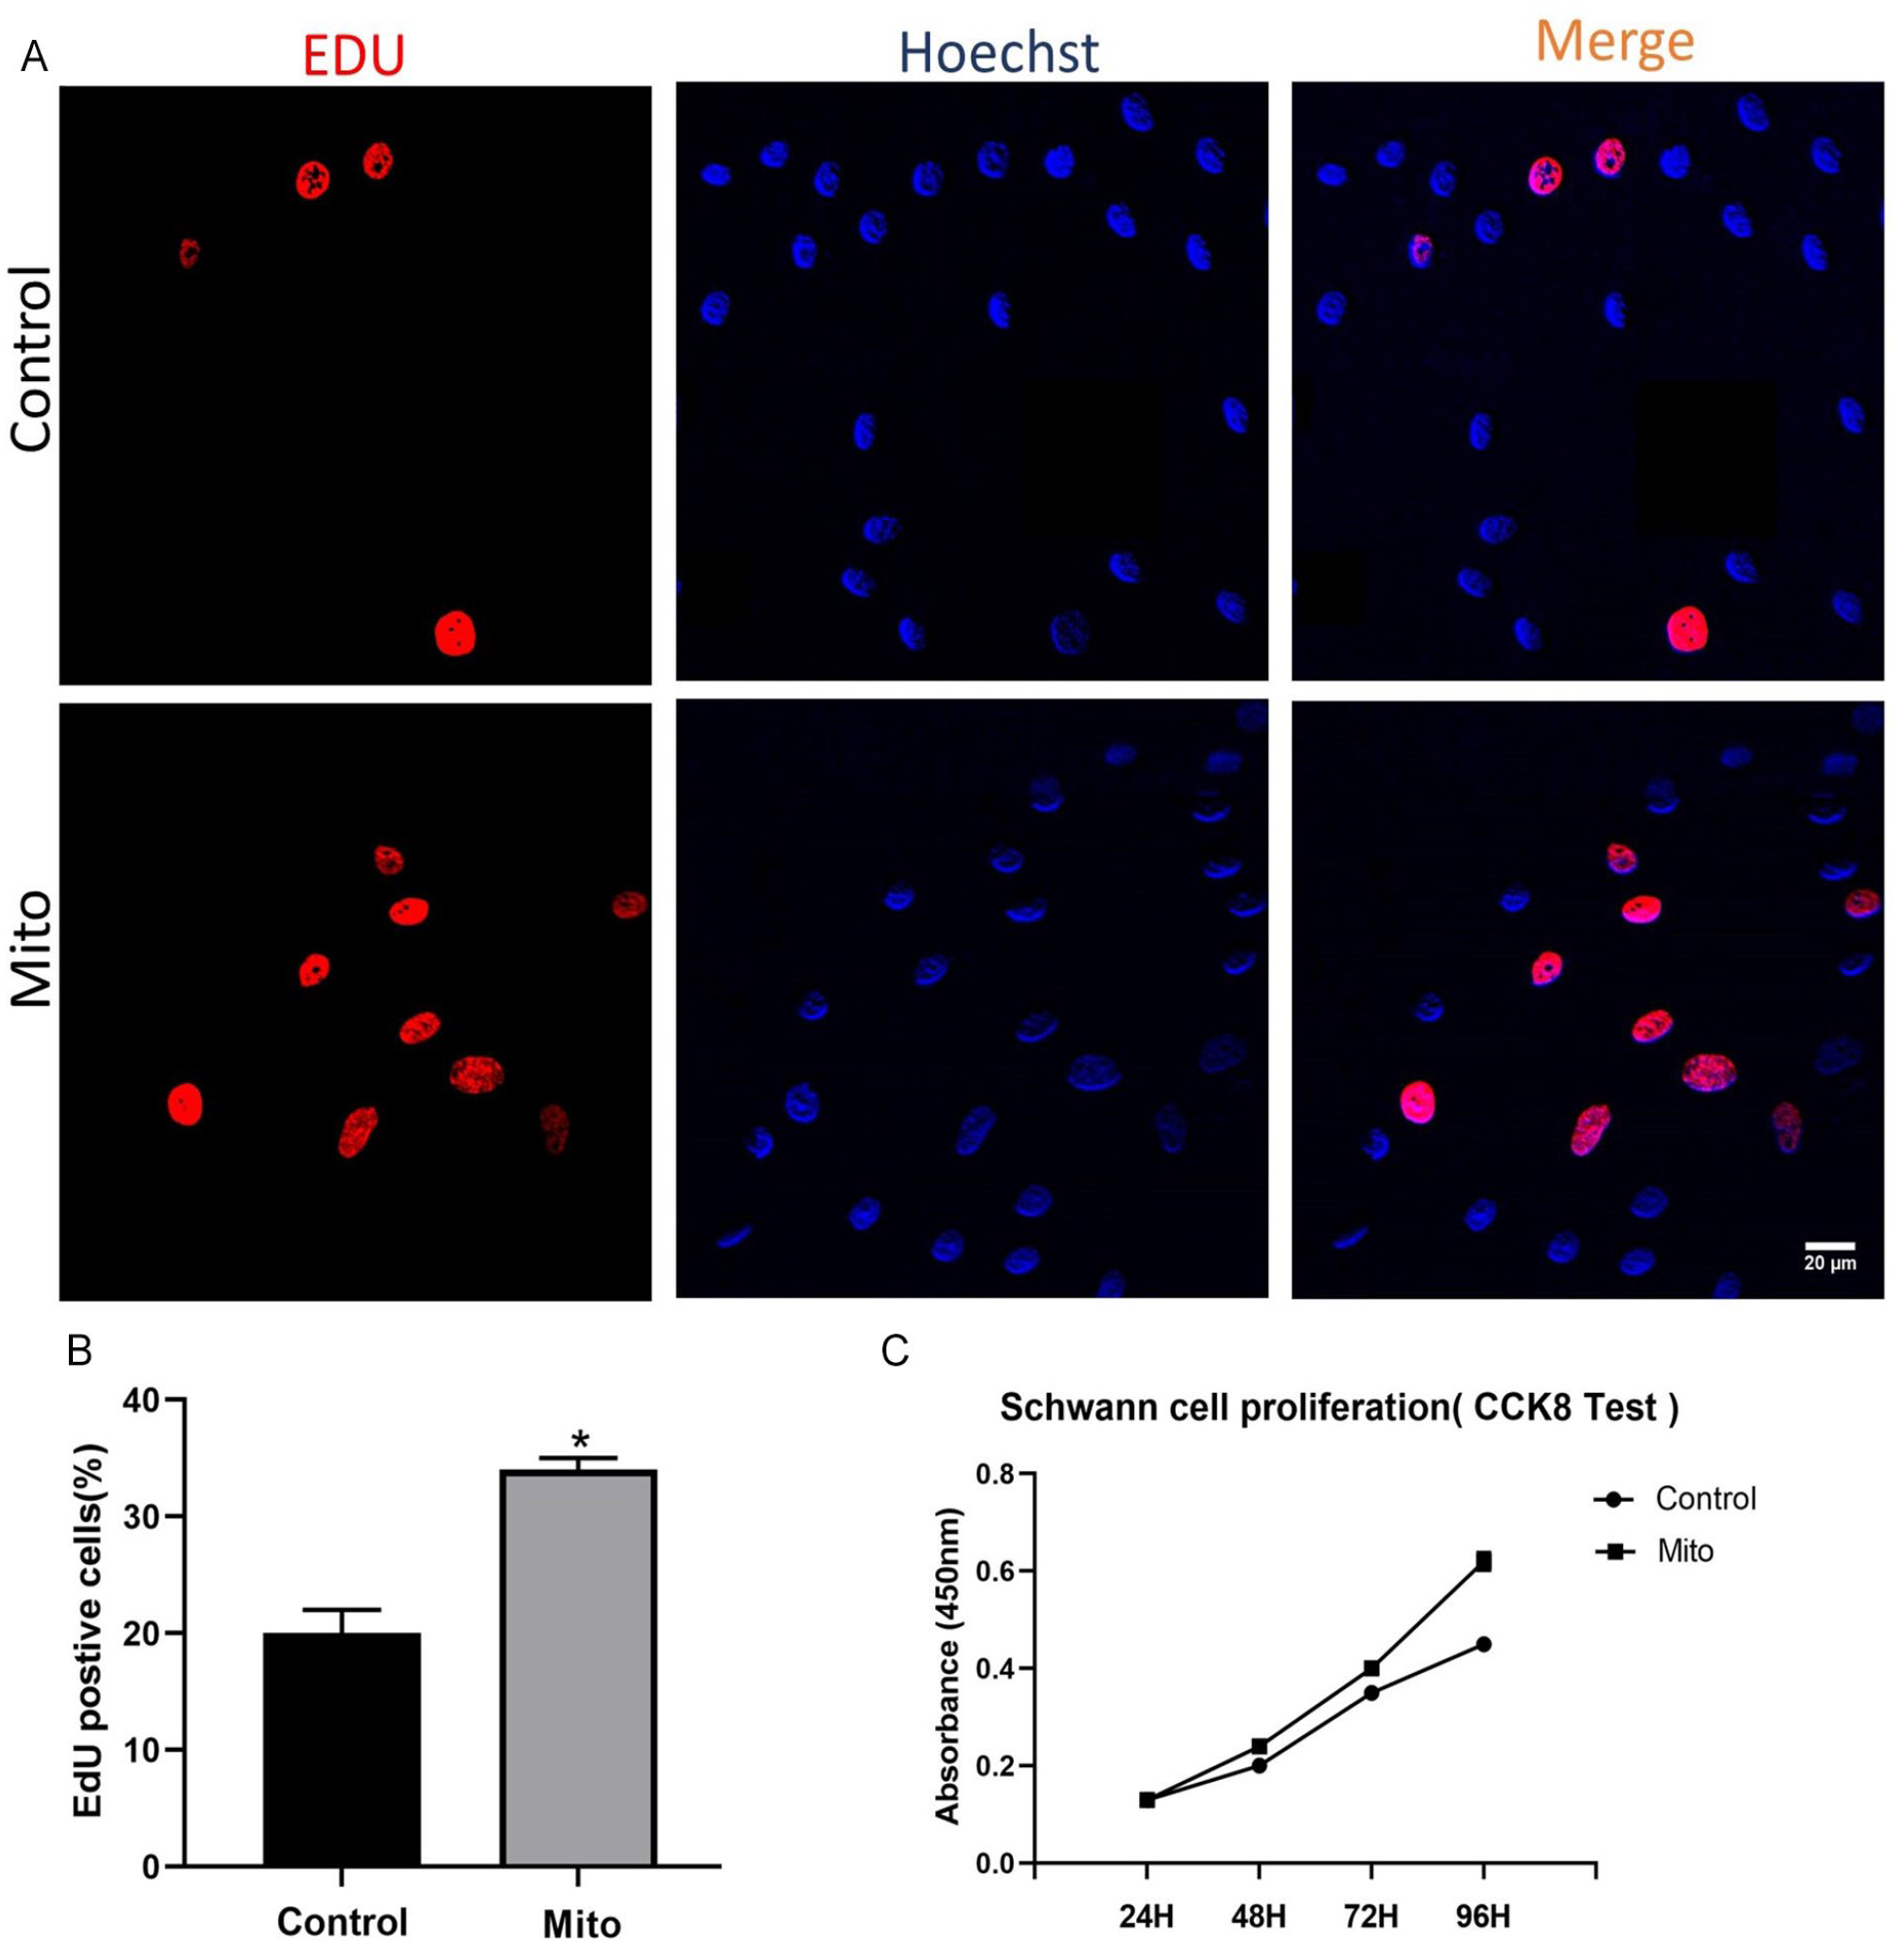
SCs Proliferation Experiment. (A) EdU staining images of SCs, with red representing newly proliferated cells and blue representing all cells. (B) Ratio of double-stained cells (EdU-positive) to the total number of cells. (C) Absorbance values of SCs after CCK8 test at different time points. Data are expressed as mean ± SD.
Axonal length
To evaluate the influence of EM on axonal growth, we conducted NF-200 immunofluorescence staining on DRG co-cultured with mitochondria for 1 week (Fig. 6A). Axonal length was measured, revealing that DRG co-cultured with mitochondria (n = 6) had a mean axonal length of 2,882 ± 102 μm, while the Control group (n = 6) DRG had a mean axonal length of 2,451 ± 220 μm. The difference was statistically significant (P < 0.05, Fig. 6C).

Axonal Growth Length. (A) NF-200 and S100 staining images of DRG and SCs in vitro. Axons are represented in green, while SCs are represented in red. (B) Process of axonal growth in vivo. (C) Statistical analysis of axonal length after 7 days of in vitro culture. (D) Statistical analysis of axonal length after 10 days of neural defect repair in vivo. Data are expressed as mean ± SD.
Moreover, for in vivo visualization of axonal growth rate (Fig. 6B), we prepared a 5 mm sciatic nerve defect repair model using thy1-GFP-16 mice. At 7 days post-surgery, Axonal growth had not yet begun toward the distal end. At 10 days post-surgery, the axonal growth length in the Mito group (n = 6) was 7.30 ± 0.46 mm, while it was 6.27 ± 0.35 mm in the Auto group (n = 6). The difference was statistically significant (P < 0.05, Fig. 6D). At 21 days post-surgery, the axons had extended beyond the range of the harvested nerve tissue, therefore statistical analysis was not conducted at this time point.
Autophagy in SCs
SCs cultured for 12 h showed TOMM20 immunofluorescence (Fig. 7A), with fluorescence intensity in the Mito group (n = 3) and Control group (n = 3) being 50 ± 3 and 31 ± 3, respectively; at 24 h, intensities were 84 ± 6 and 31 ± 3, respectively; at 36 h, intensities were 70 ± 4 and 30 ± 4, respectively. LC3B fluorescence (Fig. 7B) intensity at 12 h of culture was 68 ± 3 and 37 ± 4, respectively; at 24 h of culture, intensities were 172 ± 10 and 37 ± 3, respectively; at 36 h, intensities were 96 ± 7 and 41 ± 4, respectively. Significant differences were observed in TOMM20 (Fig. 7F) and LC3B (Fig. 7G) fluorescence intensities between the Mito and Control groups at each time point (P < 0.05). In addition, 48 h before co-culture with mitochondria, SCs were respectively transfected with GFP-LC3 and mito-keima adenovirus to observe the fluorescence intensity of GFP-labeled LC3 and Kemia-labeled mitochondria in SCs (Fig. 7C). Results showed a significant increase in LC3 expression (Fig. 7D) after co-culture with mitochondria, with fluorescence intensities of 49 ± 2 and 29 ± 3 in the Mito (n = 3) and Auto (n = 3) groups, respectively (P < 0.05). For visualization of mitochondrial autophagy, Keima protein labeled with mitochondria was fluorescently imaged at 488/561 nm excitation, yielding autophagy indices (Fig. 7E) of 1.29 ± 0.11 and 0.13 ± 0.03 in the Mito (n = 3) and Control (n = 3) groups, respectively (P < 0.05).

Induction of autophagy in SCs by exogenous mitochondria. (A) Immunofluorescence staining of the mitochondrial marker protein TOMM20 in SCs. Cell nuclei are shown in blue, and TOMM20 is depicted in red. (B) Immunofluorescence staining of the lysosomal marker protein LC3B in SCs. Cell nuclei are shown in blue, and LC3B is depicted in red. (C) Fluorescence images of SCs transfected with adenovirus carrying LC3-GFP and mito-keima, labeling lysosomal LC3 and mitochondrial keima fluorescent proteins, respectively. After addition of exogenous mitochondria, enhancement of mitochondrial autophagy and increased lysosomal expression are observed in SCs. (D) Statistical analysis of fluorescence intensity after LC3 labeling of lysosomes. (E) Statistical analysis of autophagy index after keima labeling of mitochondria. (F) Statistical analysis of TOMM20 immunofluorescence intensity. (G) Statistical analysis of LC3 immunofluorescence intensity. Data are expressed as mean ± SD.
Discussion
Peripheral nerve injuries are common clinical refractory traumas, resulting in the loss of labor and life capacity for thousands of patients annually26,27. The gold standard for clinical treatment of nerve injuries is ANT28–30. However, its therapeutic effect has not yet reached an ideal state. Therefore, finding methods to enhance the repair effect of ANT is an important approach in treating nerve injuries. This study adopted mitochondrial transplantation to enhance the efficacy of ANT. The results showed that mitochondrial transplantation could regulate SCs autophagy, enhance SCs proliferation, promote axonal elongation, during nerve regeneration, and promote the therapeutic effect of ANT in treating nerve defect.
In vivo experiments found that EM can effectively promote the proliferation of SCs and myelination, accelerating the speed of peripheral nerve regeneration. Continuous observation in rats for 2 weeks in vivo found that endocytosed EM could stably exist in SCs, macrophages, and nerve axons. The study indicates that nerve tissues as well as other tissues are capable of endocytosis EM. However, in terms of the mechanism of uptake EM, Kitani et al. 31 co-cultured EM with human uterine EMCs and the macropinocytosis inhibitor ethyl isopropyl amilorid was added to the medium, then it was found that the ability of human uterine EMCs to endocytosis EM was significantly reduced. If ethyl isopropyl amilorid was not added, human uterine EMCs can endocytosis EM normally. However, Pacak et al. 32 found in cardiomyocytes that mitochondrial transfer was unaffected by pharmacological inhibitors of cardiomyocytes macropinocytosis, clathrin-dependent endocytosis or tunneling nanotube formation but was blocked by inhibition of actin polymerization. Although the mechanism of EM endocytosis is still controversial, the research has proved that cells can endocytosis EM without any controversy, and the successful endocytosis of EM by cells is the prerequisite for its physiological function.
In the study, by measuring the length of axon growth in vivo at 10 days after nerve injury repair, it was found that the regeneration speed of axons in the Mito group was significantly faster than that in the Auto group. TEM scanning and immunofluorescence staining 12w after repair revealed that the myelin thickness of the Mito group and the fluorescence ratio of SCs were significantly better than those of the Auto group, indicating that EM can promote axonal regeneration, SCs proliferation and myelination in vivo. Myelination of axons is crucial for maintaining the information transmission function of axons33,34.
After 3 months of repair, Toluenamine blue staining and immunofluorescence of regenerated axons also revealed that the number and fluorescence density of axons per unit area in the Mito group were significantly higher than those in the Auto group, indicating that supplementing EM can maintain the survival of damaged neurons early on, thereby providing a reserve of neurons for later regeneration. After nerve injury, the survival and regeneration of axons require a large amount of energy supply21,35,36. After nerve injury, due to the self-protection of the body, cells are in a state of low-energy metabolism in the early stage, which will help the survival of neurons. However, continuous low-energy states will be detrimental to axonal regeneration 37 . Studies have shown that after axonal injury, mitochondrial transport will be significantly hindered, and if mitochondrial transport function can be restored within 18 h, injured neurons can survive, while those without restored mitochondrial transport function will undergo apoptosis 38 . Supplementing EM may maintain the survival of damaged neurons. However, whether EM directly maintain the survival of neurons or maintain their survival by promoting the restoration of their transport function was not further explored in this study.
Mitochondrial transplantation can promote the recovery of long-term nerve function. At 12w post-surgery, SFI, gastrocnemius muscle CMAP, cross-sectional area, and wet weight ratio were evaluated and it was found that the Mito group was significantly better than the Auto group, indicating that EM can improve the repair effect of ANT. The reasons for this may be: (1) It can accelerate the growth rate of axons to establish contact with target organs as soon as possible, reducing target organ atrophy, because with the prolongation of nerve loss time, target organs will undergo irreversible atrophy 25 , and timely reinnervation will effectively prevent target organ atrophy; (2) It can maintain the survival of neurons, thereby maintaining more axons effectively connected to target organs to achieve reinnervation; (3) By promoting the proliferation of SCs to enhance myelination of axons, improving the quality of regenerated axons, and thus promoting nerve function recovery from an overall perspective. In our previous study 24 , we used acellular nerve loaded mitochondria to repair peripheral nerve defects, and the repair effect was significantly better than that of acellular nerve group, but it still could not surpass or even reach the repair effect of autologous nerve. We believe that although acellular nerve can simulate the microenvironment of nerve regeneration to a certain extent, it still has some immunogenic properties. More importantly, compared with autologous nerves, the graft lacks nutritional support cells such as SCs, vascular endothelial cells and macrophages required for nerve regeneration, which are crucial for the formation of regenerative microenvironment such as axon extension, myelination and nerve angiogenesis. Nerve regeneration microenvironment is crucial for nerve regeneration. In recent years, some scholars 39 believe that the construction of tissue-engineered artificial nerves by simulating nerve regeneration microenvironment is an important research direction for the treatment of nerve injury. Cai et al. 40 used GelMA/silk graphene conduit with gradient netrin-1 to treat nerve crush injury in diabetic mice, and the nerve function was significantly recovered after surgery.
This study confirmed that EM could enhance the proliferation of SCs and the growth ability of axons. After co-culturing SCs and DRG with EM, it was found through CCK8 and EDU assays that the proliferation ability of SCs was significantly enhanced after endocytosis EM. Evaluation of the length of DRG axons revealed that the growth rate of axons was significantly accelerated after endocytosis EM compared with the Auto group. These findings indicate that EM can promote the proliferation of SCs and accelerate the growth of DRG axons in vitro.
The immunofluorescence results of the autophagy marker LC3II after SCs endocytosis EM showed an increase. In addition, to visually observe the autophagy of SCs, this study used adenovirus carrying LC3-GFP and mito-keima to label lysosomes and mitochondria, respectively. It was found that after adding EM, the fluorescence expression of lysosomal LC3 in SCs was enhanced, and the mitochondrial autophagy index increased. Those indicated that EM could activate autophagy in SCs. However, immunofluorescence results of the mitochondrial marker TOMM20 also showed an increase in protein expression levels. This is different from autophagy caused by non-EMl factors such as hypoxia, where autophagy usually leads to a decrease in TOMM20 protein expression levels 41 . In this study, although EM induced autophagy in SCs, the total amount of mitochondria in SCs increased, indicating that EM can effectively supplement mitochondria in SCs.
Therefore, this study confirmed that EM could activate mitochondrial autophagy in SCs, allowing them to promptly eliminate damaged mitochondria to maintain normal physiological functions 42 . Autophagy is a self-protective mechanism of cells, which can promptly remove damaged mitochondria of cells and thus maintain normal physiological functions43–45. In the pathology of PNI, autophagy has been regarded as a potential molecular mechanism for removal of damaged myelin by SCs46,47. Many evidence also had demonstrated that activating autophagy in periphery or central nerves system was shown to prevent neurodegeneration, axonal atrophy and to accelerate peripheral nerve regeneration48–53. Moreover, by supplementing EM to enhance the energy metabolism of SCs and neurons, the proliferation of SCs and the growth of axons can be improved. Earlier studies by our research group have confirmed a significant improvement in the energy metabolism of SCs after endocytosing EM 24 , and cellular proliferation and axonal regeneration are both energy-consuming processes. Improving energy metabolism may be beneficial for enhancing their regeneration capacity 18 . Other studies have also shown that enhancing energy metabolism will increase the synthetic metabolic capacity of cells, thereby enhancing their regeneration ability54–56.
However, this study preliminarily elaborated on the enhancement effect of mitochondrial transplantation on ANT for the treatment of nerve injuries from in vivo and in vitro. However, the exploration of the mechanism is relatively superficial. There was no further exploration of the mechanism by which EM activate autophagy in SCs, and whether the autophagy process would clear healthy EM. In addition, this study only elucidated the impact of EM on SCs autophagy and did not involve neurons, macrophages, vascular endothelial cells, and so on.
Conclusion
The study suggests that EM promotes SCs proliferation and axonal growth, thereby improving the efficacy of ANT. Inducing SC autophagy may be an effective mechanism to promote functional recovery. This study provides a novel therapeutic strategy for enhancing the efficacy of ANT in nerve repair in clinical practice.
Footnotes
Acknowledgements
The authors wish to thank Chunling Xu of Tsinghua University Medical School for donating adenovirus.
Author Contributions
Study design: YW and JP; experimental implementation: DL, HL, YG, CL, XM, and XX; data analysis: RH, ZJ, LL, and JZ; paper writing: DL and HL. All authors approved the final version of the manuscript.
Ethical Approval
This study was approved by our institutional review board.
Statement of Human and Animal Rights
This article does not contain any studies with human or animal subjects.
Statement of Informed Consent
There are no human subjects in this article and informed consent is not applicable.
Declaration of Conflicting Interests
The author(s) declared no potential conflicts of interest with respect to the research, authorship, and/or publication of this article.
Funding
The author(s) disclosed receipt of the following financial support for the research, authorship, and/or publication of this article: This study was supported by the Natural Science Foundation of Beijing of China, No. L222147 (to YW). The funding source had no role in study conception and design, data analysis or interpretation, paper writing, or deciding to submit this paper for publication.