
Abstract
Melphalan is widely used for hematopoietic stem cell transplantation (HSCT) conditioning. However, the relationship between its pharmacokinetic (PK) and transplantation outcomes in children has not been thoroughly investigated. We prospectively analyzed the relationship between melphalan area under the curve (AUC) and transplantation outcome and examined the development of a predictive model for melphalan clearance in children. This study included 43 children aged 0 to 19 years who underwent HSCT following a melphalan-based conditioning regimen from 2017 to 2021. In univariable analysis, high-melphalan AUC resulted in a significantly lower cumulative incidence of acute graft-versus-host disease and a higher cumulative incidence of thrombotic microangiopathy, although no significant difference was observed in survival. Regression analysis of a randomly selected derivation cohort (n = 21) revealed the following covariate PK model: predicted melphalan clearance (mL/min) = 6.47 × 24-h urinary creatinine excretion rate (CER, g/day) × 24-h creatinine clearance rate (CCR, mL/min) + 92.8. In the validation cohort (n = 22), the measured melphalan clearance values were significantly correlated with those calculated based on the prediction equation (R2 = 0.663). These results indicate that melphalan exposure may be optimized by adjusting the melphalan dose according to CER and CCR.
Keywords
Introduction
Hematopoietic stem cell transplantation (HSCT) is used for a wide range of diseases, including hematologic malignancies, solid tumors, bone marrow failure, primary immunodeficiency, and inherited metabolic disorders. Before HSCT, a conditioning regimen consisting of high-dose-alkylating agents and/or whole-body irradiation is used to eradicate tumor cells and ensure donor cell engraftment. However, the impact of the pharmacokinetics (PK) of alkylating agents widely used for conditioning on transplant outcomes has not been thoroughly investigated. An exception is busulfan, for which a clear correlation between its PK and transplantation outcomes has been confirmed. Thus, busulfan dosage adjustment based on PK studies or replacement with treosulfan, which is a safe alternative for busulfan, is the current standard of care for recipients of allogeneic HSCT1,2.
Melphalan is a frequently used alkylating agent in conditioning regimens for HSCT recipients. Several previous studies have reported an increased incidence of oral mucositis and diarrhea after the administration of melphalan in HSCT recipients with greater area under the curve(AUC)3–5. Furthermore, the HiMEC conditioning regimen, consisting of melphalan, etoposide, and carboplatin, has been associated with the development of thrombotic microangiopathy (TMA), a life-threatening transplant-related complication, in children with neuroblastoma 6 . However, PK analysis of melphalan is clinically difficult because of the extremely rapid rate of drug metabolism in the body 7 . Therefore, the relationship between PK of melphalan and transplantation outcome has not been fully clarified, particularly in pediatric patients. Consequently, we prospectively analyzed the relationship between melphalan PK and transplant outcomes in pediatric patients. In addition, we examined the development of a predictive model for melphalan PK in children.
Subjects and Methods
Study Design
We conducted a prospective observational study to evaluate the impact of melphalan PK on transplantation outcomes and identify the clinical factors that affect melphalan PK. This study was approved by the Ethics Committees of the Nagoya University Graduate School of Medicine and Japanese Red Cross Aichi Medical Center Nagoya First Hospital.
Patients
The characteristics of the 43 (21 females and 22 males) participants are summarized in Table 1 and Supplemental Table 1. The study included 43 children aged between 0 and 19 years who underwent autologous (n = 7) or allogeneic (n = 36) HSCT for malignant diseases (n = 34), bone marrow failure (n = 4), primary immunodeficiencies (n = 3), or inherited metabolic disorders (n = 2). Based on standardized conditioning classifications 8 , reduced-intensity conditioning was used in 15 patients and myeloablative conditioning in 28 patients. Subjects were recruited into the study from 2017 to 2021. Written informed consent and/or assent was obtained from the patients or their guardians.
Patient Characteristics.
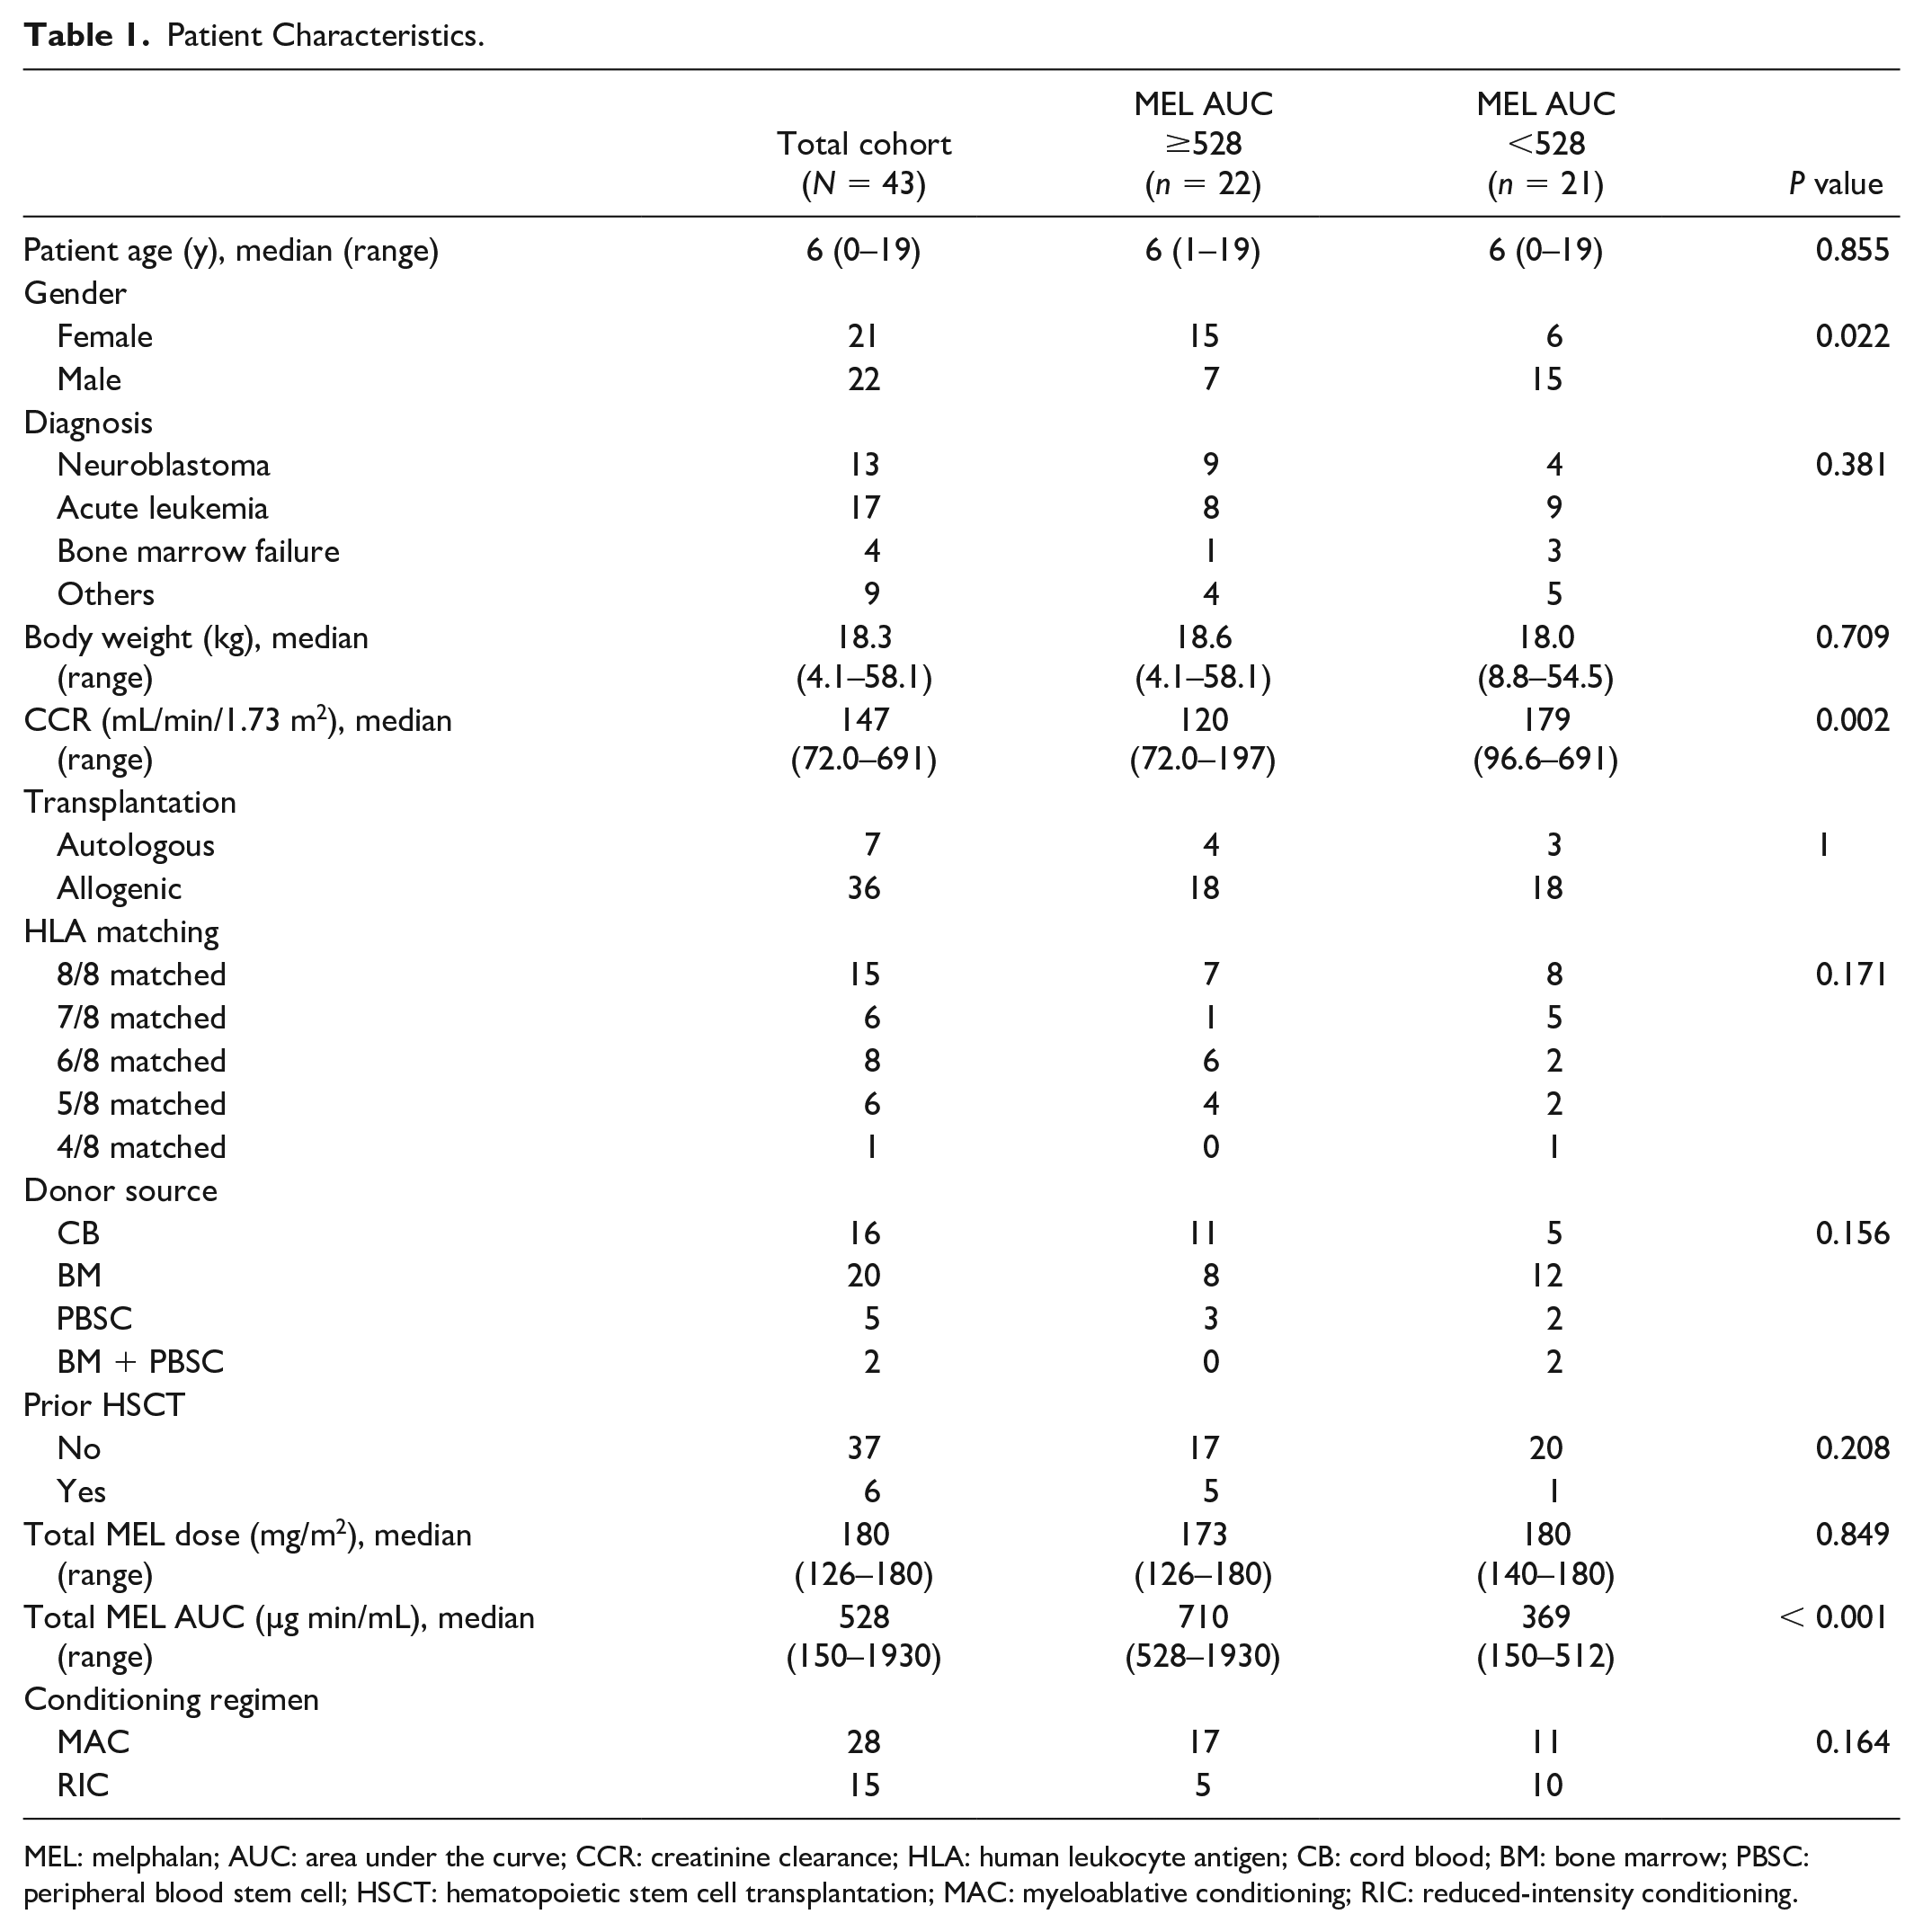
MEL: melphalan; AUC: area under the curve; CCR: creatinine clearance; HLA: human leukocyte antigen; CB: cord blood; BM: bone marrow; PBSC: peripheral blood stem cell; HSCT: hematopoietic stem cell transplantation; MAC: myeloablative conditioning; RIC: reduced-intensity conditioning.
The entire cohort was randomly divided into the derivation cohort (n = 21) and the validation cohort (n = 22). The characteristics of the children in both groups were similar, except for a higher rate of cord blood (CB) transplantation in the validation cohort (Supplemental Table 2).
Regression Models Describing the Relationships Between the Influential Covariates and Melphalan Clearance.

CI: confidence interval; MEL-CL: melphalan clearance (mL/min); CER: 24-h urinary creatinine excretion rate (g/day); CCR: 24-h creatinine clearance (mL/min); BW: body weight (kg); HT: height (cm); BSA: body surface area (m2).
Drug Administration and Blood Sampling
Melphalan was administered by intravenous infusion over 30 min as part of divided dose schedules (3 days of 50–70 mg/m2/day or 2 days of 62.5–90 mg/m2/day). PK blood samples were collected after the first (n = 17), second (n = 18), or third (n = 8) dose of melphalan. In addition, blood samples were collected before (for the second and third dose cases only), at the end of, and 30/120/180 (n = 27) or 60/150/210 (n = 16) min after the infusion of melphalan. As previously described, melphalan concentrations were determined by high-performance liquid chromatography using plasma samples that were separated and cryopreserved immediately after blood collection 9 . The limit of quantification for the measurement of melphalan concentration in blood was 0.01 µg/mL. The AUC and clearance of melphalan were calculated by non-compartmental analysis using the PK analysis software Phoenix® WinNonlin® 7.0 (Certara LP, Princeton, NJ, USA). As melphalan rapidly disappears from the blood and reaches the quantification limit 24 h after the start of the administration, we defined total melphalan AUC as the product of calculated melphalan AUC and numbers of fractionated doses.
Statistical Analysis
Continuous variables were expressed as median (range), and the Mann–Whitney U test was used for comparison between the two groups. For comparison of categorical variables, the chi-square or Fisher’s exact test was used. Significance was set at P < 0.05 for all tests. Overall survival (OS) and event-free survival (EFS; an event was defined as a relapse of disease or death or second HSCT was used as a treatment for graft failure) were calculated using the Kaplan–Meier estimates. Cumulative incidence curves were used to estimate the probabilities of relapse, transplantation-related mortality (TRM), engraftment, acute and chronic graft-versus-host disease (GVHD), and TMA 10 . Death and a second HSCT were defined as competing risks for each cumulative incidence curve analysis.
Univariable analyses were performed using the log-rank test for OS and EFS, whereas the Gray’s test was used to compare cumulative incidence estimates for relapse, TRM, engraftment, acute and chronic GVHD, and TMA. In addition, receiver operating characteristic (ROC) curve analysis was used to determine optimal cutoff points for continuous variables for TMA risk assessment. All statistical analyses were performed using SPSS 28.0 (IBM Corp., Armonk, NY, USA) and EZR (Saitama Medical Center, Jichi Medical University, Saitama, Japan) 11 .
Development of Model for Predicting Melphalan Clearance
Pearson’s correlation test was used to determine the relative importance of different patient covariates in explaining the variability in the melphalan clearance. These covariates included body weight, height, body surface area, estimated lean body mass (LBM), 24-h urinary creatinine excretion rate (CER, g/day), and 24-h creatinine clearance (CCR, mL/min). Estimated LBM was determined using the equations of Janmahasatian et al. 12 CER and CCR were calculated based on a 24-h urine collection.
Using the derivation cohort, simple linear regression models were developed to predict melphalan clearance. The model was evaluated using a goodness-of-fit plot based on data from the validation cohort.
Results
Melphalan Concentration and AUC
Melphalan PK studies were conducted on the first (n = 17), second (n = 18), or third day (n = 8) of melphalan administration. Melphalan was undetectable in blood samples collected before melphalan administration on the day of examination in all patients who underwent the study on days 2 and 3.
The highest melphalan blood concentration showed a 15.0-fold variation (ratio of highest to lowest value) with a median of 2.98 (range: 1.21–18.2) µg/mL. No linear relationship between dose and maximum blood concentration of melphalan was found over the dose range of 50–90 mg/m2. The median elimination half-life of melphalan was 37.7 (range: 20.0–98.1) min. No significant difference was found in the change in blood melphalan concentration with dosage (Fig. 1A).

Melphalan pharmacokinetics in the model derivation and model validation cohorts. (A) Melphalan (MEL) concentration–time profile in patients whose blood samples were collected at the end of MEL infusion and 30/120/180 min after infusion (n = 27) with various MEL doses (50–90 mg/m2). *In one case, the blood concentration was below the limit of quantification at 180 min after the administration of melphalan. (B) Scatterplot showing the association between total MEL area under the curve and total MEL dose in the total cohort (n = 43). (C) Scatterplot showing the associations between total melphalan plasma clearance (MEL-CL) and the covariate of 24-h urinary creatinine excretion rate (CER) ×creatinine clearance (CCR) in the derivation cohort (n = 21). (D) Scatterplot showing the associations between observed MEL-CL and predicted MEL-CL in the validation cohort (n = 22).
The total AUC showed a 12.8-fold variation, with a median AUC of 528 (range: 150–1926.4) µg min/mL. No significant difference was observed in the total melphalan AUC between the 140 mg/m2 and 180 mg/m2 groups (Fig. 1B). The total melphalan AUC was significantly high in female patients, those with low creatinine clearance, and those who received myeloablative conditioning (Supplemental Fig. 1).
Furthermore, no significant difference was observed in the total dose of melphalan between the high-AUC (total melphalan AUC ≥ 528 µg min/mL) and low-AUC groups (<528 µg min/mL). Creatinine clearance and the proportion of males in the low-AUC group were significantly higher than those in the high-AUC group (Table 1).
Survival Outcome
After a median of 312 days of follow-up, 9 of 43 (21%) patients died, whereas 10 of 34 (29%) patients with malignant diseases relapsed. At 1 year, OS and EFS were 77.3% [95% confidence interval (CI): 59.2%–88.1%] and 66.2% (95% CI: 48.5%–79.0%), respectively, for the total cohort (Fig. 2A, B). In univariable analyses, no patient or transplant characteristics significantly affected OS or EFS. The cumulative incidence of relapse on 2 years and TRM on day +100 were 33.3% (95% CI: 16.7%–50.8%) and 4.8% (95% CI: 0.8%–14.4%), respectively. No statistically significant correlations were observed between major clinical factors and recurrence or TRM (Supplemental Table 3).

Transplantation outcomes of the total cohort. Kaplan–Meier curves show the probability of (A) overall survival (OS)and (B) event-free survival (EFS) of the total cohort.
Engraftment and GVHD
The cumulative incidence of neutrophil engraftment (absolute neutrophil count ≥ 0.5 × 10 9 /L) was 93.0% (95% CI: 77.8%–97.9%) on day +60. In univariate analysis, the cumulative incidence of neutrophilic engraftment was significantly lower in patients who received CB as a source of stem cells ( P = 0.010), whereas no significant association was found between the cumulative incidence of neutrophilic engraftment and melphalan AUC (Supplemental Table 3).
The day +100 cumulative incidence of acute GVHD in allogeneic transplantation (n = 36) was 22.2% (95% CI: 10.3%–37.0%). The cumulative incidence of acute GVHD was significantly lower in female patients (P = 0.043) and in patients who received CB as stem cell sources than in others (P = 0.027). Compared with the low-melphalan AUC group (total melphalan AUC < 528 µg min/mL), the cumulative incidence of acute GVHD was significantly lower in the high-melphalan AUC group (P = 0.009). Moreover, similar results were observed in patients with acute leukemia (Supplemental Table 4). The cumulative incidence of chronic GVHD in allogeneic transplantation (n = 36) at 2 years was 7.7% (95% CI: 1.2%–22.8%). We did not find any statistically significant correlation between chronic GVHD and major clinical factors (Supplemental Table 3) or between major transplantation outcomes and melphalan exposure in patients with neuroblastoma (Supplemental Table 5).
Thrombotic Microangiopathy
In our total cohort, three (7.0%) patients developed TMA. The primary disease in all these three patients was neuroblastoma. Two of the three patients underwent low-dose (2 Gy) total body irradiation as a conditioning regimen. The area under the ROC curve for total melphalan AUC and developing TMA was 0.708 (P = 0.026). A total cutoff melphalan AUC ≥ 576 µg min/mL had a sensitivity of 100% and a specificity of 60.0% for TMA development (Fig. 3A). The AUC for age at HSCT and developing TMA was 0.842 (P < 0.001). More than or equal to 5 years of cutoff age at HSCT was associated with a sensitivity of 100% and a specificity of 72.5% for TMA development (Fig. 3C). The cumulative incidence of TMA in patients with either or both factors (young age or high AUC) was significantly higher than that in other patients (young age: P = 0.010; high AUC: P = 0.046; both: P < 0.001) (Fig. 3B, D, and E). No statistically significant correlation was observed between TMA and other major clinical factors (Supplemental Table 6).

Relationships between melphalan (MEL) exposure level or age and the development of thrombotic microangiopathy (TMA). (A) Receiver operating characteristic (ROC) curve for total MEL area under the curve (AUC) and developing TMA. (B) Comparison of the cumulative incidence (CI) of TMA in two groups divided by the cutoff value of the total MEL AUC (576 µg min/mL). (C) ROC curve for patients’ age and developing TMA. (D) Comparison of the CI of TMA in two groups divided by the cutoff value of patients’ age (5 years old). (E) Comparison of the CI of TMA in two groups divided by the combination of total MEL AUC and patients’ age cutoff value.
Development of a Prediction Model for Melphalan Clearance
Among the randomly selected derivation cohort (n = 21), melphalan clearance had a significant positive correlation with CER (R2 = 0.666; P < 0.001), estimated LBM (R2 = 0.541; P < 0.001), body weight (R2 = 0.429; P = 0.001), body surface area (R2 = 0.417; P = 0.002), height (R2 = 0.412; P = 0.002), and CCR (R2 = 0.364; P = 0.004) (Supplemental Fig. 2A–F).
We performed regression analysis to develop a melphalan clearance prediction model by selecting one or two variables. We excluded the following combinations of variables with significant multicollinearity [variance inflation factor (VIF) >5]: height and body surface area (VIF = 34.0), body weight and body surface area (VIF = 21.6), body weight and estimated LBM (VIF = 15.8), body surface area and estimated LBM (VIF = 13.8), height and estimated LBM (VIF = 11.6), height and body weight (VIF = 8.58), and estimated LBM and CER (VIF = 5.04). The top six models with the highest R2 values among all variable combinations are shown in Table 2. These results showed that the combination of CER and CCR had the greatest impact on melphalan clearance. The following equation can be used to predict melphalan clearance (mL/min): 6.47 × CER (g/day) × CCR (mL/min) + 92.8 (Fig. 1C). In the validation cohort (n = 22), the measured melphalan clearance values correlated significantly with the melphalan clearance values calculated based on the prediction equation (R2 = 0.663; P < 0.001; Fig. 1D).
Discussion
In the present study, we investigated the association between melphalan PK and transplantation outcomes in Japanese pediatric patients and developed a new equation for predicting melphalan clearance by CER and CCR. This may allow us to adjust the optimal melphalan dose to reduce transplant complications without increasing engraftment failure or disease relapse. A greater melphalan AUC resulted in a significantly lower cumulative incidence of acute GVHD and a higher cumulative incidence of TMA, although no significant difference was observed between high-melphalan AUC and survival. Thus, optimizing melphalan exposure according to the predictive equation may improve the post-transplantation quality of life.
Nath et al. 13 reported an equation for estimating melphalan clearance in children based on body weight, glomerular filtration rate, and prior carboplatin administration. Although comparing the results of two separate studies is impossible, the goodness-of-fit of our predictive model (R2 = 0.663) does not seem to be lower than that of the Nath et al. model (R2 = 0.579). In addition, the CER may reflect the effect of patients’ height on melphalan clearance more sensitively than their body weight, even in patients with atypical body composition.
We identified CER (R2 = 0.666) and CCR (R2 = 0.364) as the most important clinical factors affecting melphalan clearance. Previous studies have reported estimated LBM, glomerular filtration rate, concomitant use of total body irradiation/carboplatin, and hematocrit as factors affecting melphalan clearance13–15. Among these factors, the estimated LBM (R2 = 0.541) was significantly correlated with melphalan clearance in the present study and was strongly correlated with CER as previously reported 16 ; thus, we adopted CER in our prediction equation.
This study had some limitations. First, the relatively small number of patients and events and the variety of graft cell sources and conditioning regimens hindered the full assessment of the impact of melphalan clearance on transplant outcomes using multivariable analyses in this cohort. In particular, patients with neuroblastoma who received conditioning regimen including melphalan are at high risk of developing TMA/hemolytic uremic syndrome6,17, and TMA events were only documented in three neuroblastoma patients in the current study, so the association between high-melphalan exposure and TMA development is unclear. Second, when we assessed the melphalan clearance estimated by the formula versus the melphalan clearance observed in a goodness-of-fit plot (Supplemental Fig. 3A–F), we found a trend toward poor goodness-of-fit in patients with acute leukemia and those with a history of steroid administration. In these patients, LBM measured directly by dual-energy X-ray absorptiometry may be a better parameter for estimating melphalan clearance than CER, which should be investigated in future studies. Third, we calculated the total AUC of melphalan as the product of the AUC from one day and consecutive doses. However, given the daily dose variability, multiple sampling over 2–3 days is required to accurately calculate the total AUC. This could be a significant physical and psychological burden for pediatric patients and was therefore not used in this study.
In summary, we developed a prediction equation for melphalan clearance in Japanese pediatric patients using CER and CCR as parameters. In patients with a small physique and poor renal function, melphalan exposure may be optimized by reducing the dose of melphalan based on this prediction equation.
Supplemental Material
sj-docx-1-cll-10.1177_09636897221143364 – Supplemental material for Clinical Impact of Melphalan Pharmacokinetics on Transplantation Outcomes in Children Undergoing Hematopoietic Stem Cell Transplantation
Supplemental material, sj-docx-1-cll-10.1177_09636897221143364 for Clinical Impact of Melphalan Pharmacokinetics on Transplantation Outcomes in Children Undergoing Hematopoietic Stem Cell Transplantation by Ryo Maemura, Manabu Wakamatsu, Kana Matsumoto, Hirotoshi Sakaguchi, Nao Yoshida, Asahito Hama, Taro Yoshida, Shunsuke Miwata, Hironobu Kitazawa, Kotaro Narita, Shinsuke Kataoka, Daisuke Ichikawa, Motoharu Hamada, Rieko Taniguchi, Kyogo Suzuki, Nozomu Kawashima, Eri Nishikawa, Atsushi Narita, Yusuke Okuno, Nobuhiro Nishio, Koji Kato, Seiji Kojima, Kunihiko Morita, Hideki Muramatsu and Yoshiyuki Takahashi in Cell Transplantation
Footnotes
Acknowledgements
The authors acknowledge all clinicians, patients, and their families and thank Ms. Yoshie Miura, Ms. Chie Moriyama, Ms. Hiroko Ono, and Ms. Chie Amahori for their valuable assistance.
Author Contributions
RM and MW performed the research, analyzed the data, and wrote the paper. HM designed and analyzed the data, led the project, and wrote the paper. HS, NY, AH, and YT designed and led the project. KMa and KMo contributed to PK analysis. TY, SM, HK, KN, SKa, DI, MH, RT, KS, NK, EN, AN, YO, NN, KK, and SKo collected the clinical sample and data. All authors reviewed and approved the final version of the manuscript.
Ethical Approval
The study was approved by the Ethics Committees of the Nagoya University Graduate School of Medicine and Japanese Red Cross Aichi Medical Center Nagoya First Hospital (Protocol ID 2019-0181, 2016-129).
Statement of Human Rights
All procedures in the study were conducted in accordance with the Institutional Ethics Committee’s approved protocols (Protocol ID 2019-0181, 2016-129).
Statement on Informed Consent
Written informed consent was obtained from all the study participants. The consent document was approved by the Ethics Committees of the Nagoya University Graduate School of Medicine and Japanese Red Cross Aichi Medical Center Nagoya First Hospital.
Declaration of Conflicting Interests
The author(s) declared no potential conflicts of interest with respect to the research, authorship, and/or publication of this article.
Funding
The author(s) disclosed receipt of the following financial support for the research, authorship, and/or publication of this article: This work was supported by management expenses grant from the Ministry of Education, Culture, Sports, Science and Technology.
Supplemental Material
Supplemental material for this article is available online.
References
Supplementary Material
Please find the following supplemental material available below.
For Open Access articles published under a Creative Commons License, all supplemental material carries the same license as the article it is associated with.
For non-Open Access articles published, all supplemental material carries a non-exclusive license, and permission requests for re-use of supplemental material or any part of supplemental material shall be sent directly to the copyright owner as specified in the copyright notice associated with the article.