
Abstract
Stomach adenocarcinoma (STAD) is a highly heterogeneous disease. Due to the lack of effective molecular markers and personalized treatment, the prognosis of gastric cancer patients is still very poor. The ABSOLUTE algorithm and cancer cell fraction were used to evaluate the clonal and subclonal status of 349 TCGA (The Cancer Genome Cancer Atlas)-STAD patients. Non-negative matrix factorization was used to identify the mutation characteristics of the samples. Univariate Cox regression analysis was used to determine the relationship between clonal/subclonal events and prognosis, and the Spearman correlation was used to evaluate the relationship of clonal/subclonal events to tumor mutation burden (TMB) and neoantigens. The evolution pattern of STAD demonstrated great tumor heterogeneity. TP53, USH2A, and GLI3 appeared earliest in STAD and may drive STAD. CTNNB1, LRP1B, and ERBB4 appeared the latest in STAD, and may be related to STAD’s progress. Univariate Cox regression analysis identified four early genes, eight intermediate genes, and seven late genes significantly associated with overall survival. The number of subclonal events in the T stage was significantly different. The N stage, gender, and histological type were significantly different for clonal events, and there was a significant correlation between clonal/subclonal events and TMB/neoantigens. Our results highlight the importance of systematic evaluation of evolutionary models in the clinical management of STAD and personalized gastric cancer treatment.
Introduction
Stomach adenocarcinoma (STAD) is one of the four most common cancers worldwide, and the second leading cause of cancer-related deaths 1 . Despite some gastric cancer treatment progress in recent years, prognoses are still poor 2–3 . Therefore, there is an urgent need to explore its etiology and pathogenesis.
Cancer is a disease caused by the gradual accumulation of genomic variation, primarily by single-nucleotide variations (SNVs) and somatic copy number alterations (SCNAs) 4,5 . Comprehensive analysis of genetic and clinical studies shows that some genes driving SNV or SCNA may be potential biomarkers 6 that play an important role in tumor occurrence and development.
The gradual accumulation of somatic changes drives cancer development, and the mutations obtained at different stages of tumor development may be related to different clinical outcomes 7 . However, the chronology of somatic events acquired during the evolution of STAD and its potential clinical effects have not been thoroughly studied.
Genomic variation is distinct in different cancer cell samples; this phenomenon is called tumor heterogeneity 8 . Cancer evolution and intratumoral heterogeneity have attracted increasing attention in the field of cancer research. The activity of these highly heterogeneous tumor cells leads to different bodily responses to specific treatments 9,10 . Full exon sequencing has shown significant tumor heterogeneity in somatic mutations between primary gastric cancer and its associated lymph node metastases 11 . In addition, studies of the sequenced gastric cancer genome have revealed variable histology and two mutant subtypes. The prognoses and treatment responses of patients in these two subtypes are significantly different 12 . An in-depth understanding of tumor heterogeneity helps reveal the mechanism of tumor formation and evolution.
There are one or more subclonal driving events in different subclonal tumors. Multiple subclones show genetic changes in the same gene or genes that play a role in the same pathway for a small number of tumor types. Previous studies have shown that it is possible to reconstruct a single tumor biopsy clone by estimating the cancer cell fraction (CCF) carrying SCNA or SNP (single-nucleotide polymorphism) 13 –15 . However, they demonstrated limited ability to quantify the CCF of both SCNAs and SNVs in STAD.
In this study, we used TCGA-STAD genomic data to analyze the clonal and subclonal composition of each SNV and SCNA tumor sample. Some prognostic markers related to clonal or subclonal events were identified, and the relationship between clonal or subclonal events, tumor mutation burden (TMB), mismatch repair genes (MMRs), and new antigen was characterized. These characteristics will deepen our understanding of the mechanism of STAD tumorigenesis.
Materials and Methods
Data Download and Preprocessing
We used the GDC API to download the gastric cancer data set from TCGA. These data included the copy number variation (CNV) data set excluding germline differences, the mutation data set processed by Mutect2 software, and clinical characteristics of each sample (Supplemental Table S1).
The following steps of preprocessing were conducted on the clinical sample: (1) samples without clinical information or overall survival (OS) < 30 days were removed; (2) normal sample were removed.
The SNVs were preprocessed in the following steps: (1) silent and intron mutated sites are removed; (2) hypermutated samples were removed. Hypermutated samples were defined as samples with more than 11.4 mutations per Mb 16 .
The following steps were performed on the CNV: (1) data with the interval > 500 kb were removed; (2) gencode.v 22 of the GRh38 version was applied to map the CNV interval to the corresponding genes. The statistics information of the preprocessed TCGA-STAD is shown in Table 1.
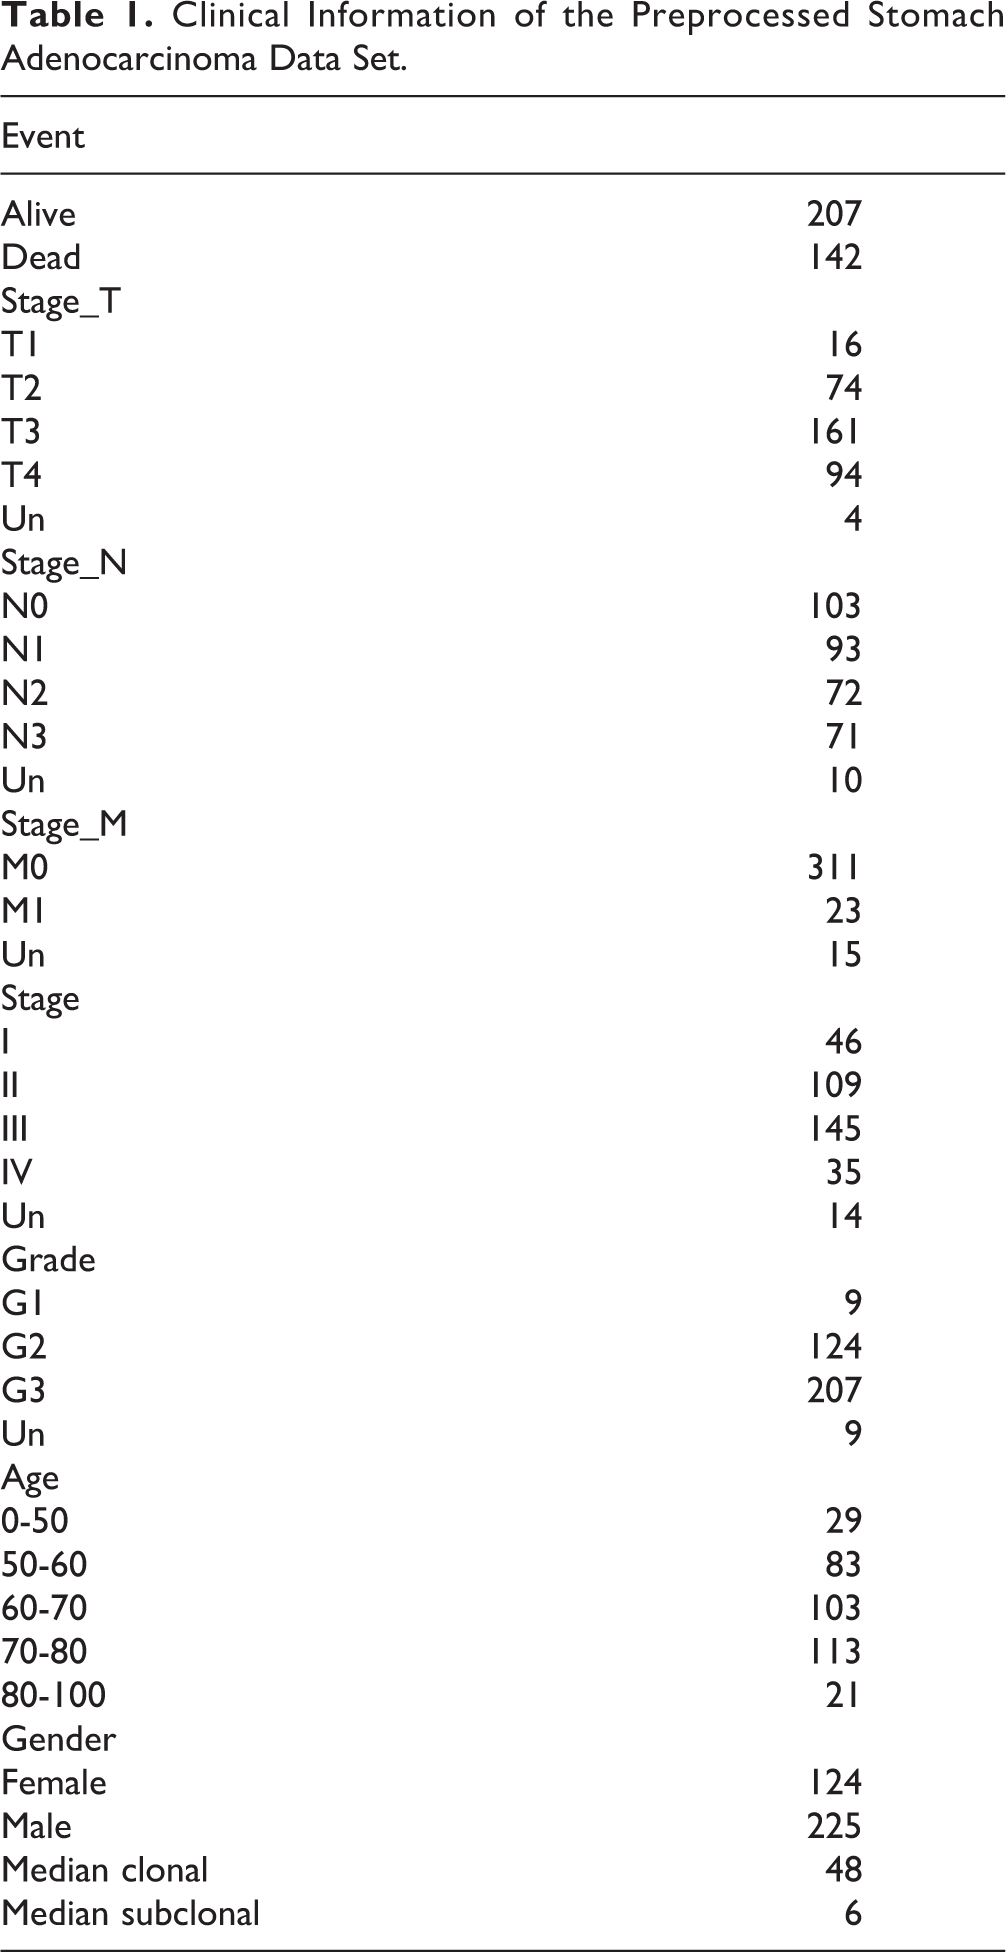
Clinical Information of the Preprocessed Stomach Adenocarcinoma Data Set.
Clonal Status Classification of SNV
The ABSOLUTE algorithm was used to calculate the purity, ploidy, and absolute DNA copy number of each sample 17 . The RunAbsolute function was used to set the parameters as follows: max.sigma.h = 0.2, min.ploidy = 0.95, max.ploidy = 10, max.non.clonal = 1, copy_num_type = “total,” min.mut.af = 0.05, platform = “SNP_6.0,” sigma.p = 0, max.as.seg.count = 1,500, and max.neg.genome = 0. The evaluation results of each patient are shown in Supplemental Table S2.
For each mutated site, including SCNAs and SNVs, the numbers of mutated reads, unmutated reads, tumor purity, and local SCNA could be used to evaluate the probability distribution density of the CCF. The tumor DNA proportion was calculated first, and then the allele fraction (AF) probability was calculated according to the binomial probability density distribution. In this step, the influence of normal cell components was cleared and the p(AF) was obtained. The second step was to integrate all possible mutation multiplicities (m: 1 to local absolute copy number) and evaluate CCF’s probability by p(AF). If the p (CCF ≥ 0.85) is greater than 0.5, the SNV and SCNA are defined as clones; otherwise, they are defined as subclones.
Mutation Feature Analysis
Non-negative matrix factorization (NMF) is an unsupervised clustering method widely used to discover tumor molecular subtypes based on genomics 18,19 . After the mutation characteristics in STAD were further observed, the NMF method was used to cluster the samples based on SNVs to identify the mutation characteristics of the samples, in which the NMF method selected the standard “Brunet algorithm” for 50 iterations. The cluster number k was set to 2 to 10, the seed set to 123,456, and the average contour width of the common member matrix was calculated using the NMF package 20 .
The minimum member of each subclass was set to 10. The cophenetic, dispersion, and rss indexes of k = 2 to 10 were evaluated. According to these three indicators, we finally determined three SNV signatures, and the scores of those signatures in each sample are shown in Supplemental Table S3. To evaluate the heterogeneity of mutant signatures, we calculated the contribution of each mutant signature to each sample, using the 30 known mutant signatures provided by COSMIC. We calculated the similarity between mutant signatures and COSMIC mutational signatures 21 .
Analysis of Genomic Variation in Clonal and Subclonal Events
To observe the relationship between clonal, subclonal, and CNV, the SCNA of each sample obtained by ABSOLUTE was identified and the SCNA interval satisfying the following conditions was retained: (1) modal CN ≤2 (loss) or modal CN ≥2 (gain); (2) SCNA interval <1 Mb. Then the SCNA was mapped to the gene using the coordinate position of gencode, and the relationships between cloned and subcloned genes and CNV were analyzed.
Analysis of Chronological Relationship Between Mutations and Tumor Evolution
A sample’s clonal and subclonal events were used to construct the possible chronology of tumor evolution mutations. When clonal and subclonal events appeared in the same sample, an edge was established between the two to analyze all the samples in the same manner. Finally, a gene network with a specific direction was obtained. The network node represented the gene, and the edge indicated a clonal and subclonal relationship between the two genes.
Enrichment analysis was performed according to the number of in-edges and out-edges of each node (gene), Fisher’s exact test was used to assess significance, and the Benjamini–Hochberg (BH) method was used to calculate false discovery rate (FDR). For SNV and SCNA, the nodes (genes) with FDR <0.05 and out-edges >in-edges were defined as early genes; similarly, the nodes with FDR <0.05 and in-edges >out-edges were defined as late genes, and the genes of other cases were defined as intermediate genes. Because we calculated the genes that produced SCNA based on the CNV interval and gff interval of the chip data, some SCNA genes might present “false positives,” affecting the SNV results. We, therefore, inferred the temporal order of SCNA and SNV. To facilitate the display, we removed some conflicting edges and, finally, obtained SCNA pairs and SNV pairs.
Sample Collection
STAD and adjacent tissues were collected from three patients, immediately placed in liquid nitrogen, and preserved at −80°C. Patients and their families involved in this study were fully informed, and informed consent was obtained from the participants. This study was approved by the Ethics Committee of Heping Hospital, affiliated with Changzhi Medical College.
Western Blotting
Western blotting was conducted according to the standard protocols. We used primary antibodies raised against glyceraldehyde 3-phosphate dehydrogenase (GAPDH; Santa-Cruz Biotechnology, Foster City, CA, USA), DYNC2H1, GLI3, PPP1R1B, USH2A (Cell Signaling Technology, Danvers, MA, USA), NEUROD2, and OBSCN (Proteintech, Shanghai, China). Goat anti-mouse and anti-rabbit antibodies conjugated with horseradish peroxidase were used as secondary antibodies (Jackson ImmunoResearch, West Grove, PA, USA), and we detected the blots using enhanced chemiluminescence (Dura, Pierce, NJ, USA).
RNA Extraction and Real-Time Polymerase Chain Reaction Assay
Total RNA was extracted using TRIzol reagent (Invitrogen, Carlsbad, CA, USA) following the manufacturer’s protocol and was reverse transcribed into complementary DNA using a Superscript Reverse Transcriptase kit (Transgene, Illkirch, Strasbourg, France). A Super SYBR Green Kit (Transgene) was used to carry out real-time polymerase chain reaction (PCR) in an ABI7300 real-time PCR system (Applied Biosystems).
The primer pairs were DYNC2H1 forward 5′TCCAACACGATTGAGTTTGGTG3′, reverse 5′GGTGCGAATACTTGCCGTACT3′; GLI3 forward 5′GAAGTGCTCCACTCGAACAGA3′, reverse 5′GTGGCTGCATAGTGATTGCG3′; PPP1R1B forward 5′CAAGTCGAAGAGACCCAACCC3′, reverse 5′GCCTGGTTCTCATTCAAATTGCT3′; USH2A forward 5′CTTTTCCCAAGGCTGGAGAAC3′, reverse 5′CAGTGTAGGTAGGGTGTGAAGA3′; NEUROD2 forward 5′TGCTACTCCAAGACGCAGAAG3′, reverse 5′CACGTAGGACACTAGGTCTGG3′; OBSCN forward 5′CGGTTCCCTTCAAAAAGCGG3′, reverse 5′CCTCCTCGATGCCGTACTTG3′; GAPDH forward 5′GAGAGACCCTCACTGCTG3′, reverse 5′GATGGTACATGACAAGGTGC3′. The relative gene expression levels for protein were normalized against those of GAPDH in each sample, and each sample was run in triplicate and the results averaged.
Statistical Analysis
The Kaplan–Meier method was used to construct survival curves for the subgroups in each data set, and the log-rank test was used to determine if differences were statistically significant (assigned at P <0.05). The chi-squared test was used to test the significance of sample overlap between clinical features and clonal or subclonal events. The BH method converts the P-value to an FDR. All of the above analyses were completed using R software (v. 3.5.1).
Results
Genomic Mutant Signature Analysis of STAD
We estimated the CCF of each SNV and SCNA in all samples (see Materials and Methodology) (Supplemental Table S4). There were 24,359/10,480 clonal/subclonal events (69.9%) obtained for SNV and 129048/5191 clonal/subclonal events (96.1%) for SCNA.
Mutated signatures can reflect the potential effects of previous exposure to different carcinogens and some characteristic changes associated with DNA damage and repair in STAD. The Brunet algorithm in NMF was used to identify the SNV signature. To ensure that the optimal number of SNV signatures could be identified, we evaluated cophenetic and rss when k = 2 to 10. Finally, according to the trinucleotide mutation pattern, three SNV signatures (k = 3) were chosen as the optimal quantity (Supplemental Fig. S1). They were defined as signatures A-C. According to the base mutation pattern, signature A was mainly composed of C > T, signature B was mainly composed of C > A, C > G, and C > T, and the mutation pattern of C > G only appeared in signature B. Signature C mainly consisted of T > G (Fig. 1A). No significant difference was observed between the clonal and subclonal contributions to the three SNV signatures (Supplemental Fig. S2A), demonstrating that clonal events and subclonal events had a similar mutation pattern.
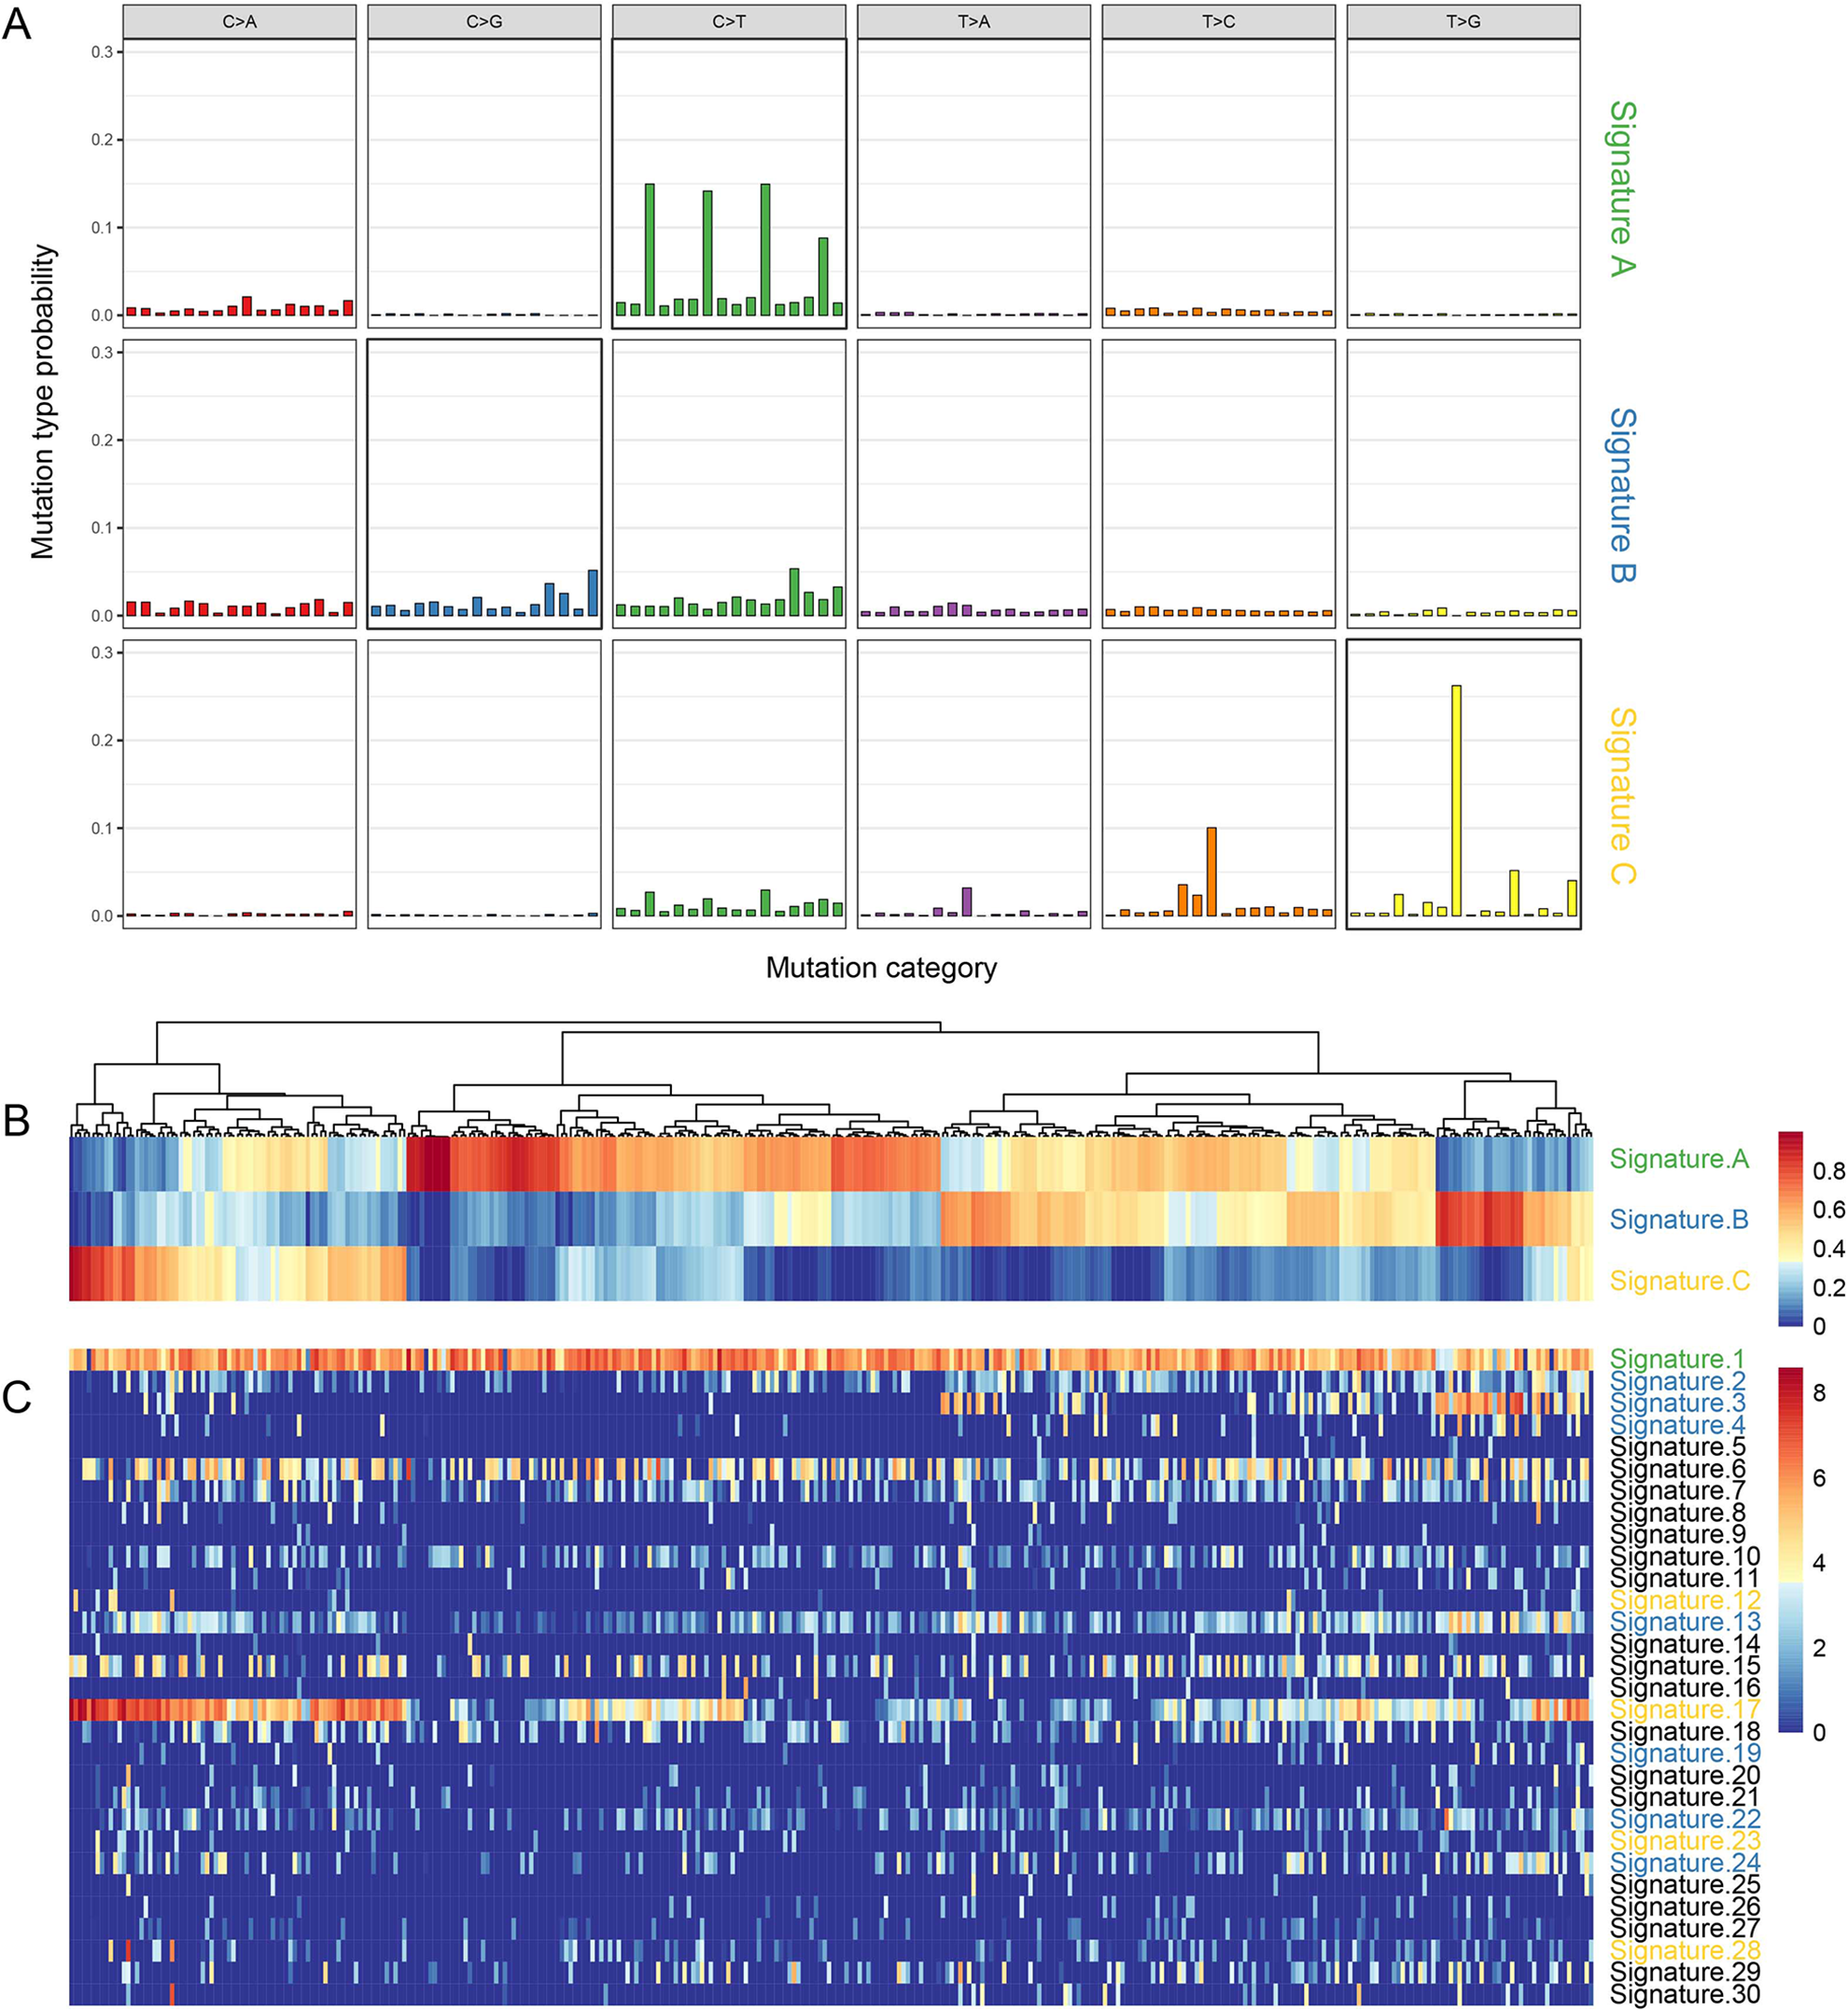
Distribution of mutant signatures of the TCGA STAD samples. A. The three mutant signatures identified by NMF; B. the composition of the three signatures in STAD samples; C. the composition of 30 signatures in COSMIC STAD samples.
The contributions of signatures A-C were calculated in each sample to evaluate the heterogeneity of SNV signatures (the larger the contribution, the higher the proportion of the signature in the sample). Signature A accounted for a large proportion in most samples, while signatures B and C accounted for a high proportion only in specific samples (Fig. 1B). Using the known 30 mutational signatures provided by COSMIC (https://cancer.sanger.ac.uk/cosmic), we calculated the cosine similarity between three signatures and COSMIC mutational signatures. Signature B had high similarity with signatures 3, 13, C, and 17 (Fig. 1C). The similarity between signature A and signature 1 was the strongest (Supplemental Fig. S2B). We systematically analyzed the relation between the three SNV signatures and clinical features of tumor–necrosis–metastasis (TNM) stage, clinical stage, grade, gender, and age, and found no association between the three SNV signatures and all variables except the M stage and age. The scores of signature B and signature C in M0 samples were significantly higher than those in the M1 stage (Supplemental Fig. S3A), and signature A was positively correlated with age (Supplemental Fig. S3B).
Variation Analysis of Clonal and Subclonal Genomes
The clonal and subclonal events of CNV and SNV were integrated. The CNV and SNV genes with more than 5% occurrence times in all samples were selected, and we obtained 46 CNV genes and 101 SNV genes (Supplemental Table S5), respectively, with the highest occurrence frequency. The top 30 genes are shown in Fig. 2. TP53, TTN, and MUC16 genes showed the highest number of mutations (>20%), and the major mutation was clonal events (Supplemental Fig. S4, enrichment P < 0.05, Supplemental Table S6), indicating that these genes were more likely to occur as early mutation events. The number of clonal and subclonal mutations in oncogenes such as PIK3CA was relatively small (<10%).
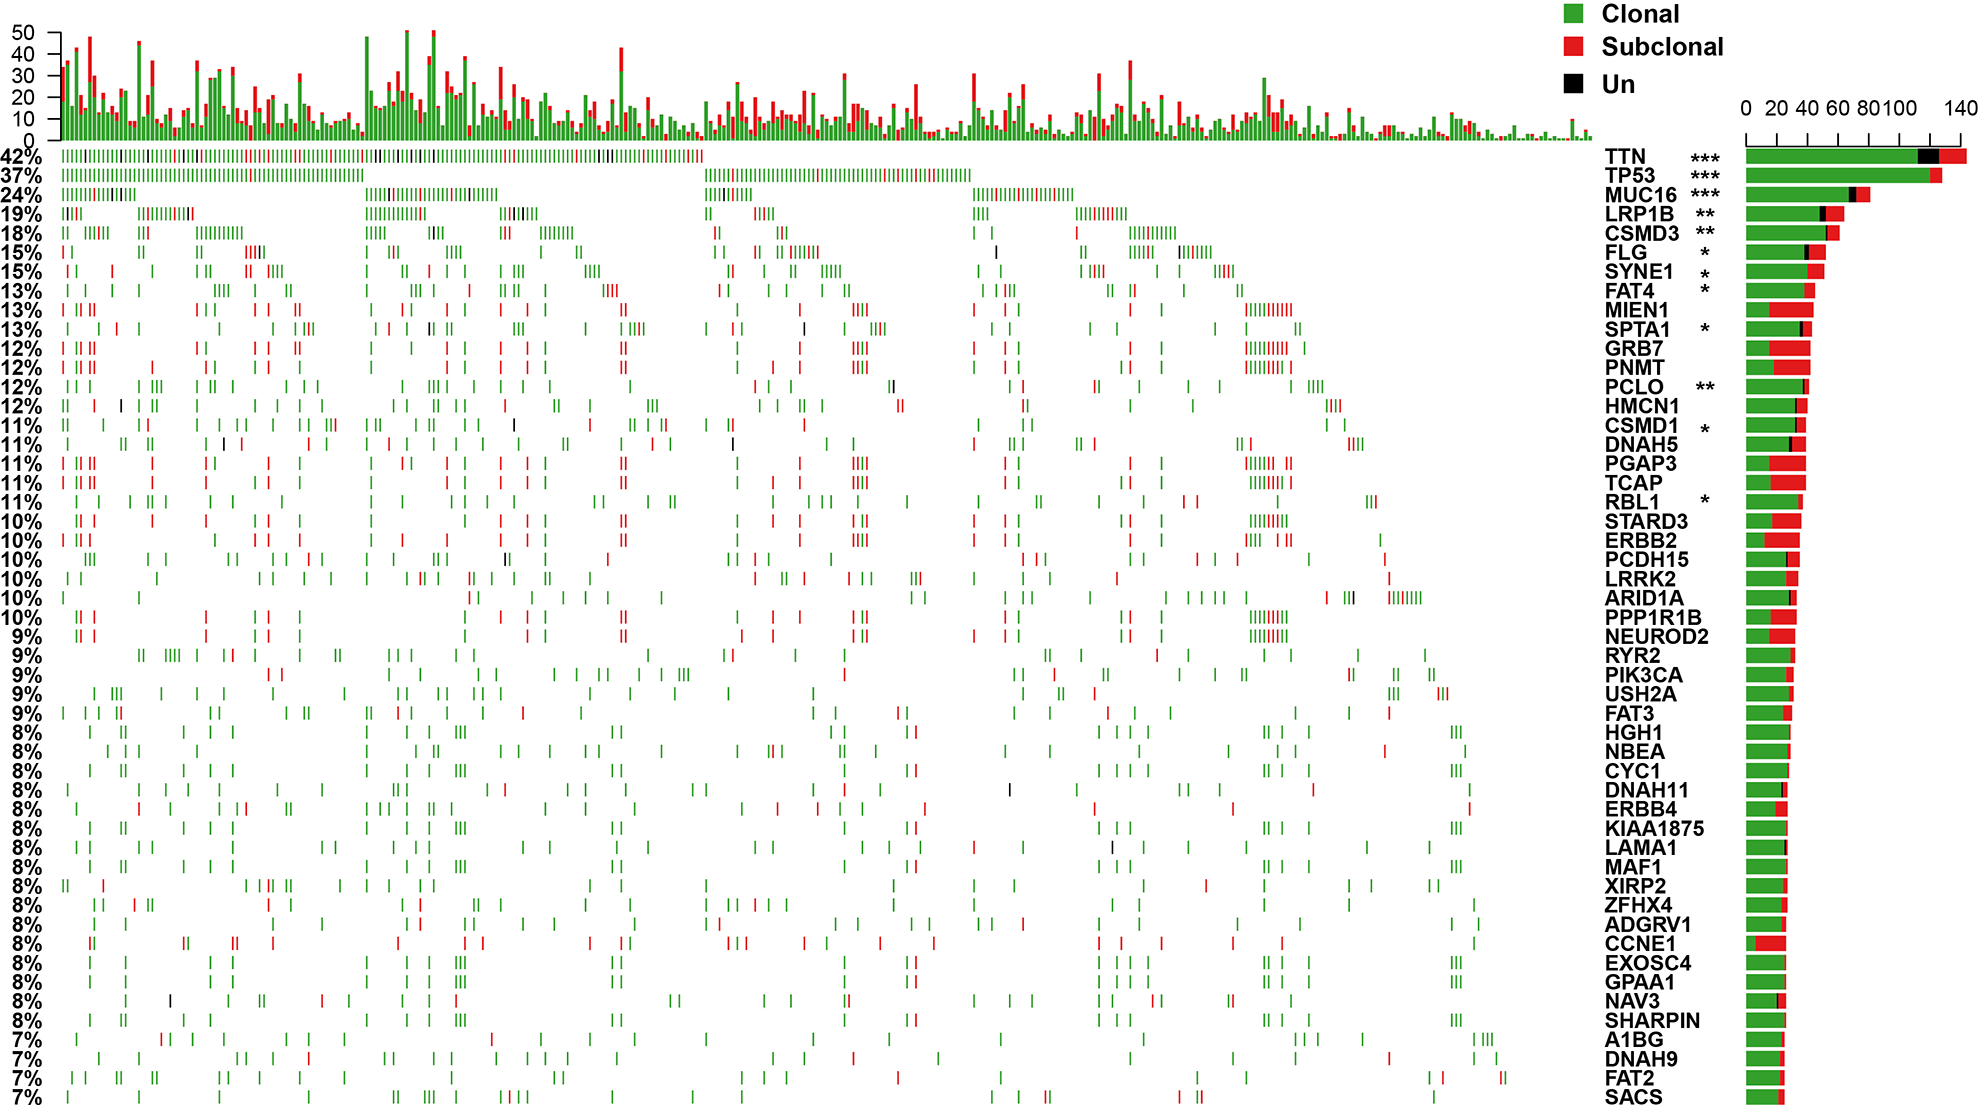
Frequency distribution of clonal and subclonal events in STAD samples (showing the first 30 genes). Top panel: quantitative statistics of clonal and subclonal events. Bottom panel: the clonal and subclonal status of the STAD samples. The genes tagged with stars represent that they have significant difference in clonal/subclonal events. Un indicates that the identification of clonal or subclonal events cannot be made.
Chronological Relationship Between Mutation and Tumor Evolution
To analyze the mutations involved in the occurrence and development of STAD, 46 CNVs and 101 SNVs with the highest mutation frequencies were sorted according to CCF (Fig. 3A). Overall, the CCF of CNV was significantly higher than that of SNV (rank test P <1e-5, mean value of CCF 0.9287/0.9003). The CNV gain/loss was very high (gain/loss:1214/3).
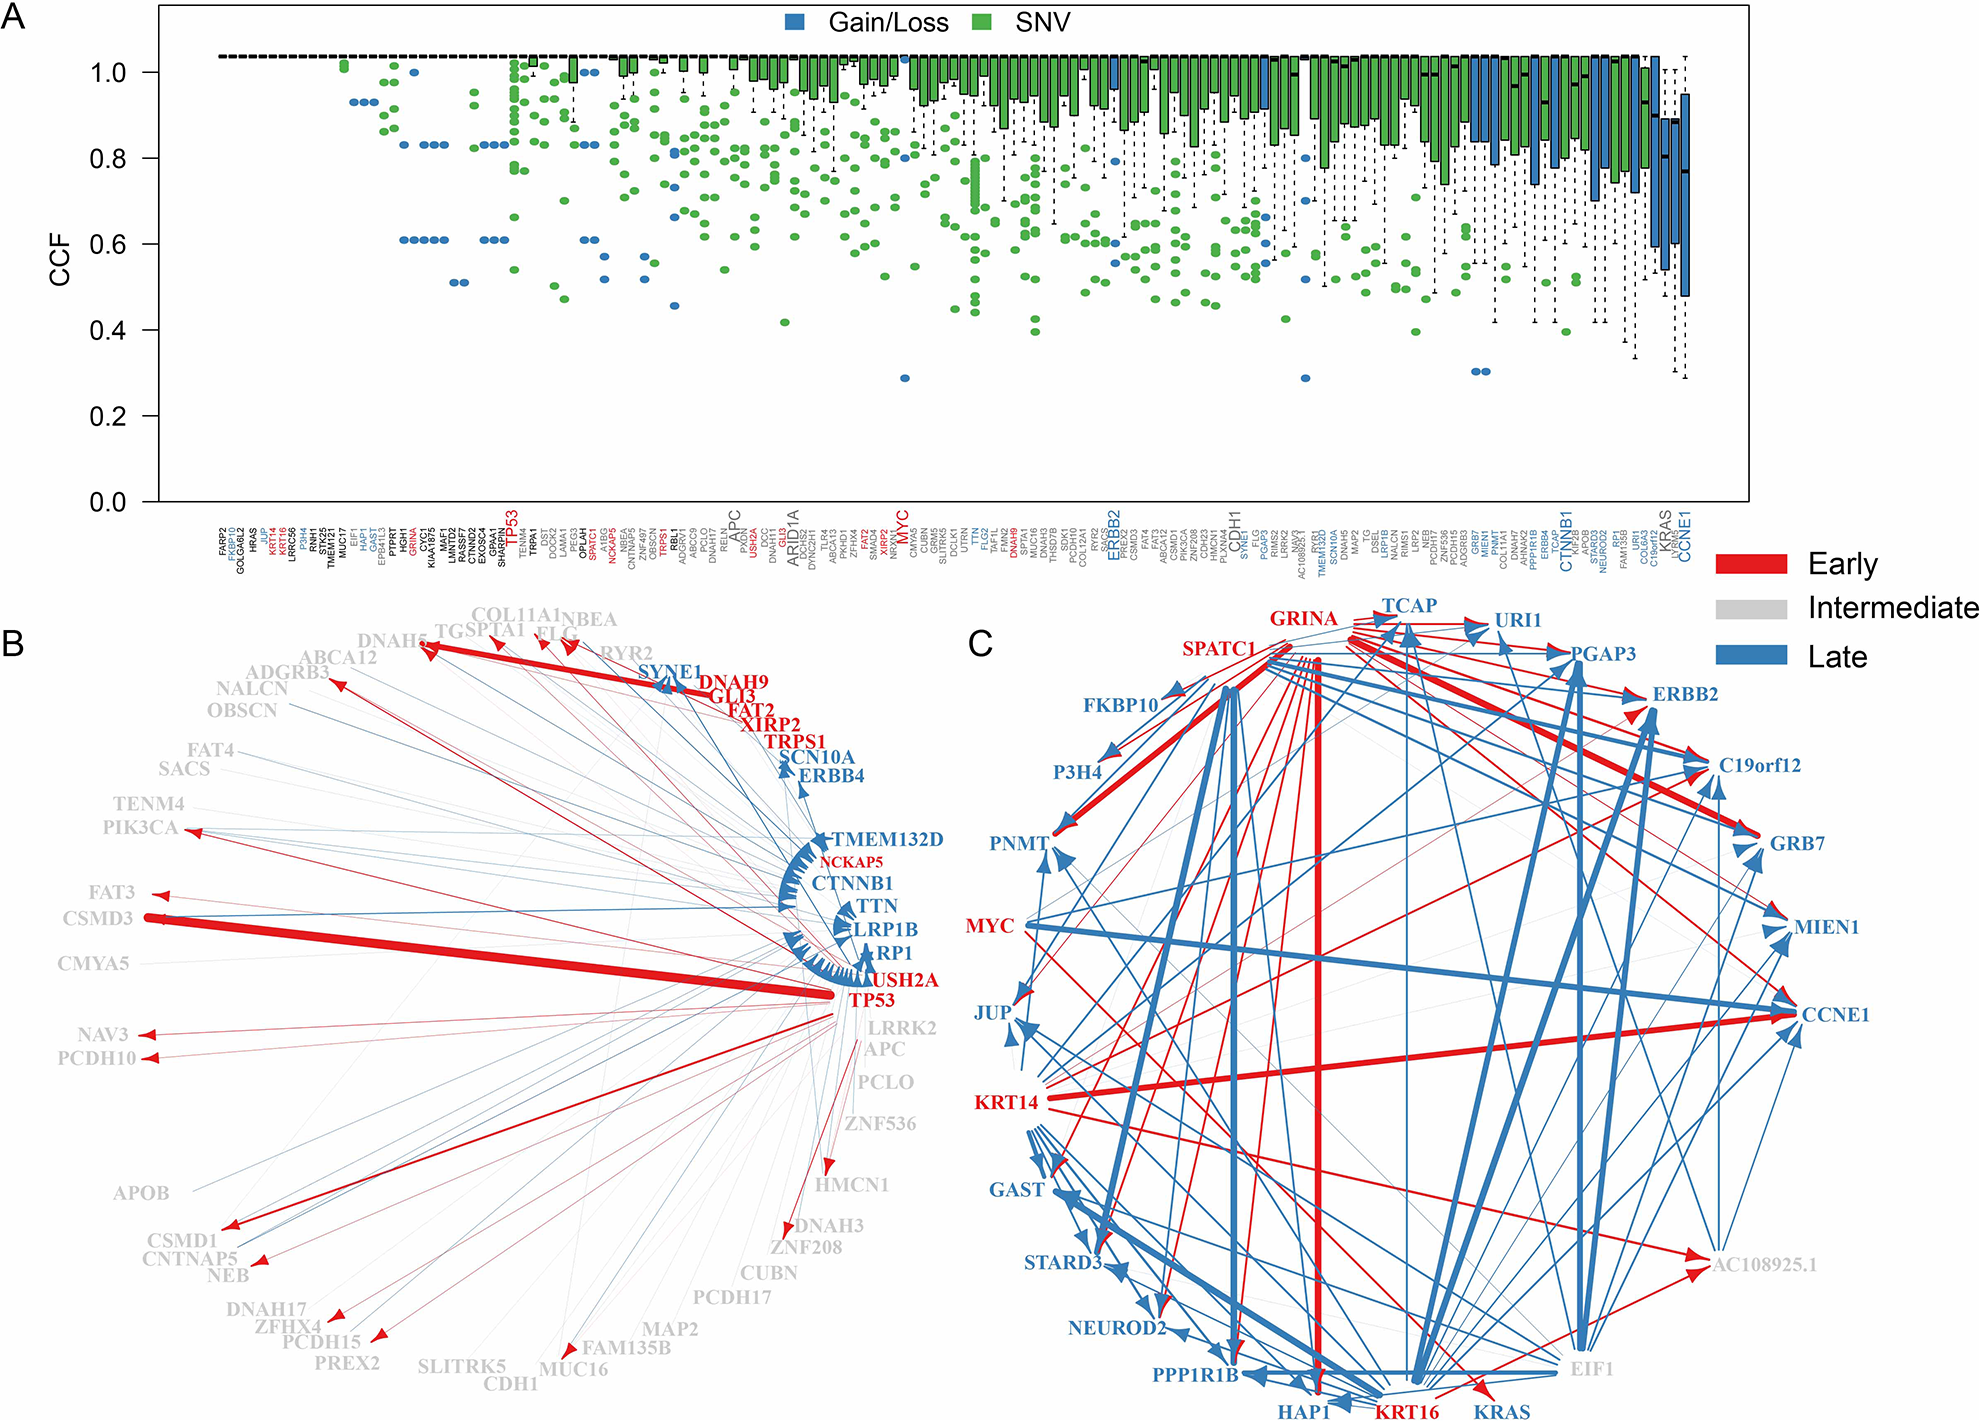
The temporal order of mutation acquisitions during STAD evolution. A. CCF distribution of top 5% mutant genes. Genes with only clonal mutations are removed. B. The temporal maps of SNV acquisitions in STAD. C. The temporal maps of CNV acquisitions in STAD. B and C diagrams delete some genes without edges. The arrow indicates that the two genes appeared in the same sample, and the arrow width indicates the number of times the event occurred. The genes labeled red correspond to the early genes, the gray correspond to the intermediate genes, and the blue correspond to the late genes. FDR <0. 05 was selected for temporal order significance test.
We used clonal and subclonal events from a sample to construct the sequence of possible mutations during tumor evolution and obtained 369 CNV pairs (Supplemental Table S7) and 119 SNV pairs (Supplemental Table S8). Five early CNV genes and eight early SNV genes (Supplemental Tables S9 and S10) were obtained by edge enrichment analysis. For SNV, TP53, USH2A, and GLI3 appeared the earliest in STAD, indicating they could be STAD drivers. CTNNB1, LRP1B, and ERBB4 appeared the latest in STAD, which might be related to STAD’s progress (Fig. 3B). CNV, MYC, KRT14, and KRT16 were identified as early genes and metaphase genes, and KRAS, ERBB2, and CCNE1 were identified as late genes (Fig. 3C).
Validation of the Prognostic Genes in Clonal/Subclonal Events in the Database
The univariable Cox analysis was performed on the 46 high-frequency CNV genes and 101 SNV genes to study the effect of clonal and subclonal events on patient survival. We selected the first two genes with the most significant prognostic significance in the early stage (USH2A, GLI3) (Fig. 4A, B), the middle stage (DYNC2H1, OBSCN) (Fig. 4C, D), and the late-stage (PPP1R1B, NEUROD2) (Fig. 4E, F). We also used the GEPIA database to analyze the correlation between genes and clinical stage and found that only DYNC2H1 and OBSCN expressions were positively correlated with the clinical stage. The higher the clinical stage, the more the gene expression. Subsequently, we used three pairs of gastric cancer and paracancerous tissue samples to verify the gene’s protein expression, and the results were consistent with our analysis (Fig. 4G, H).
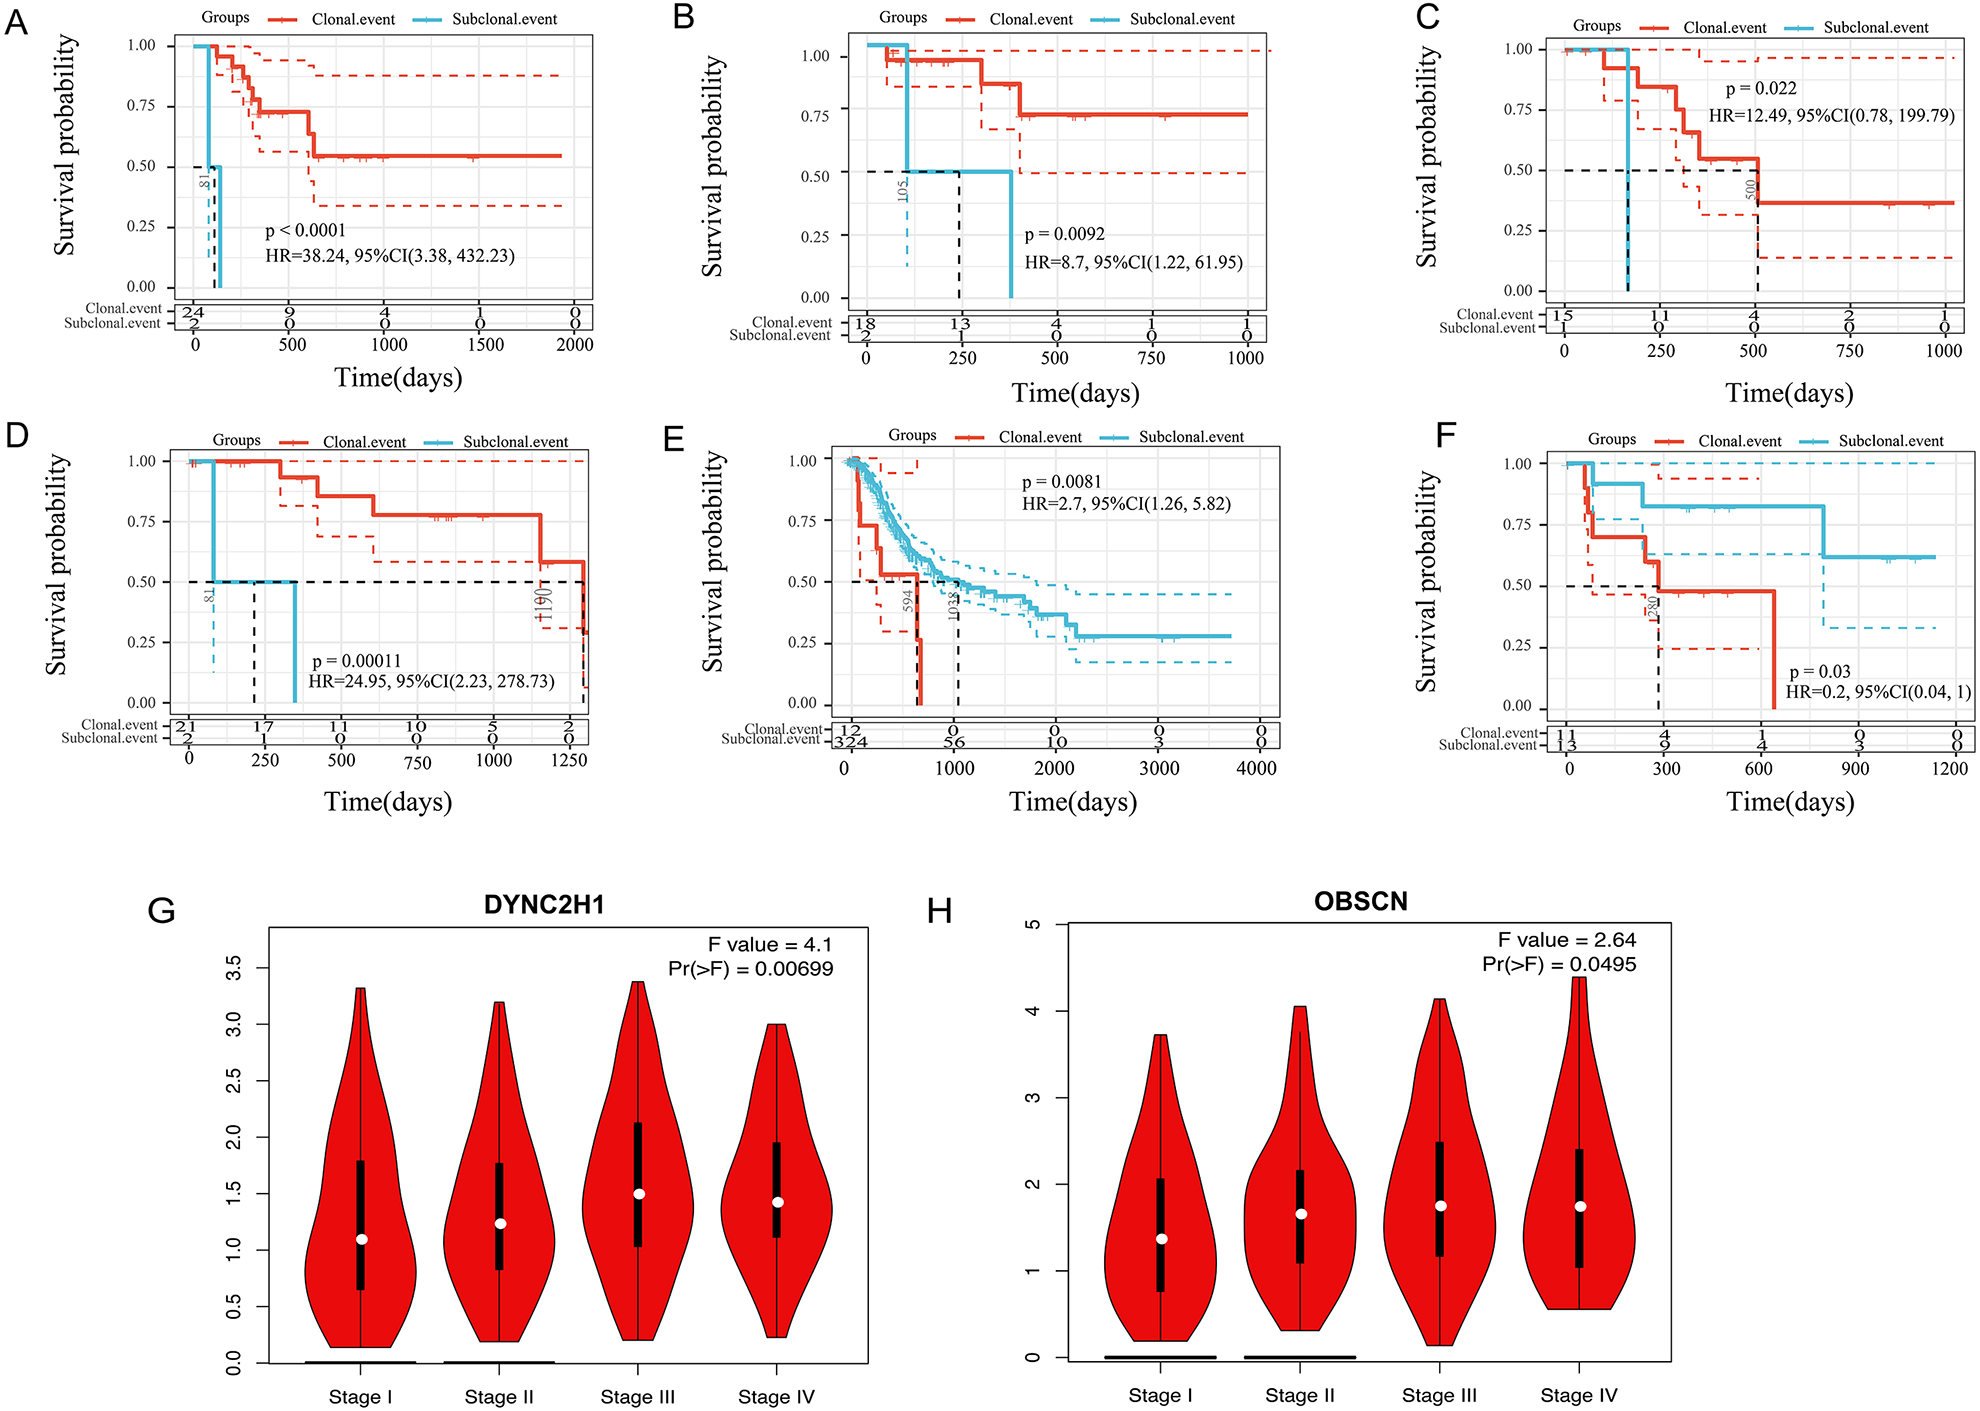
Relationship between clonal/subclonal status and overall survival rate of CNV and SNV. A, B: the KM curve of clonal/subclonal status and OS of early genes; C, D: the KM curve of clonal/subclonal status and OS of intermediate genes; E, F: the KM curve of clonal/subclonal status and OS of late genes. P values are calculated by log-rank test. G-H: genes expression in GEPIA database.
In the Oncomine database, our screening criteria were “THRESHOLD (P VALUE) <0.05.” PPP1R1B, USH2A, OBSCN, and NEUROD2 were highly expressed in cancer tissues, especially PPP1R1B, highly expressed in all gastric cancer studies. DYNC2H1 is expressed in both cancer and paracancerous tissues (Fig. 5A).
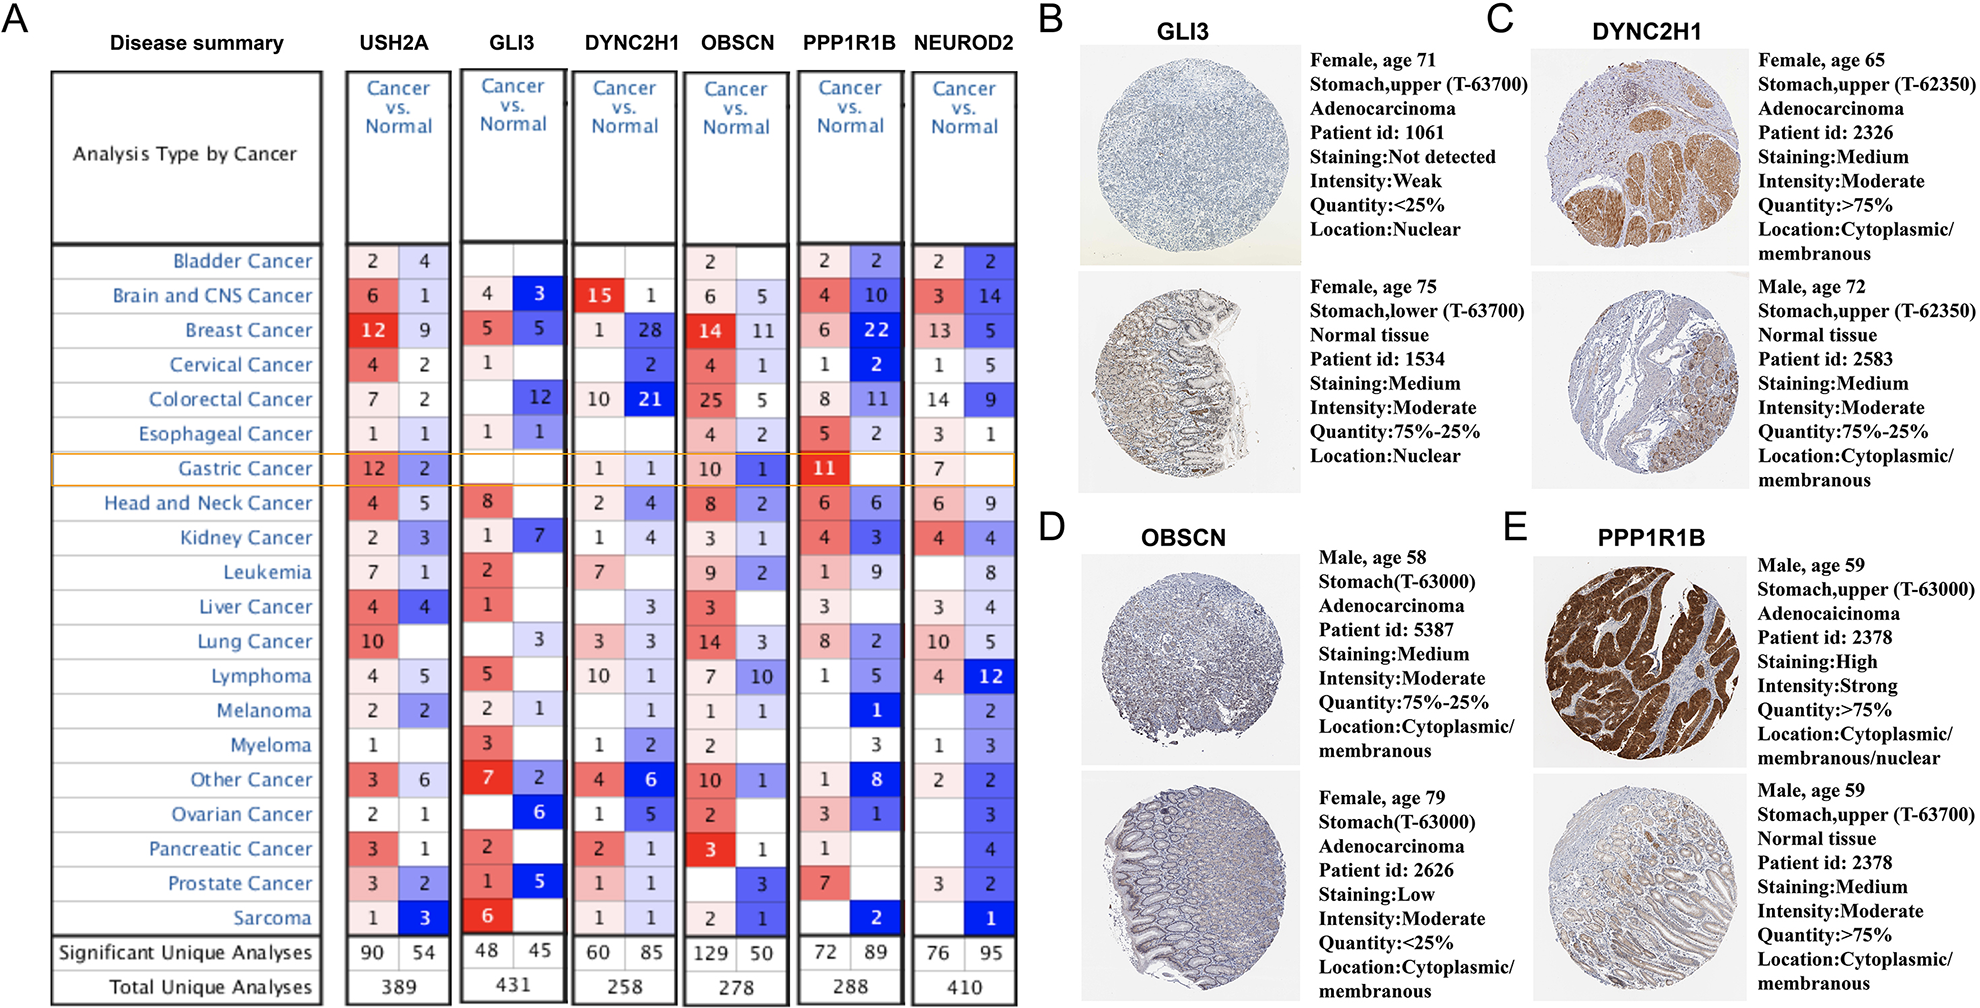
A. Genes expression in Oncomine database; B: GLI3 expression in HPA database; C: DYNC2H1 expression in HPA database; D: OBSCN expression in HPA database; E: PPP1R1B expression in HPA database.
We selected some of the gastric cancer microarray data sets for difference analysis. Supplemental Fig. S5A–E shows the expression of DYNC2H1, OBSCN, NEUROD2, USH2A 22 –24 , and PPP1R1B in the Oncomine database (GLI3 demonstrated no significant difference). We used TCGA-STAD data to further analyze the expression of USH2A, GLI3, DYNC2H1, OBSCN, NEUROD2, and PPP1R1B 25 . The GLI3 gene expression was significantly lower in TCGA cancer tissues, and USH2A and PPP1R1B were significantly highly expressed in TCGA cancer tissues compared to normal tissues (Supplemental Fig. S5F–H).
The Human Protein Atlas (https://www.proteinatlas.org/) provides information on the tissue and cell distribution of 26,000 human proteins. It primarily uses specific antibodies to study protein expression in cell lines, normal tissues, and tumor tissues. We explored the expression of four genes: GLI3, DYNC2H1, OBSCN, and PPP1R1B in normal and tumor tissues (there was no information in the database on genes USH2A and NEUROD2). The expression of PPP1R1B and OBSCN was significantly high in cancer tissues, and the expression of DYNC2H1 in cancer tissues was stronger than that in para-cancerous tissues. GLI3 was significantly high in normal samples (Fig. 5B–E).
Protein and mRNA Validation of the Prognostic Genes In Vivo
We analyzed three pairs of STAD tissues and para-cancerous controls to validate the protein and mRNA levels of prognostic genes. The expression of PPP1R1B, USH2A, and OBSCN was significantly higher in tumor tissues. DYNC2H1 was expressed in both cancer and para-cancerous tissues. GLI3 was significantly higher in normal tissues. The trends of our experimental results were mostly consistent with those of the database (Fig. 6).
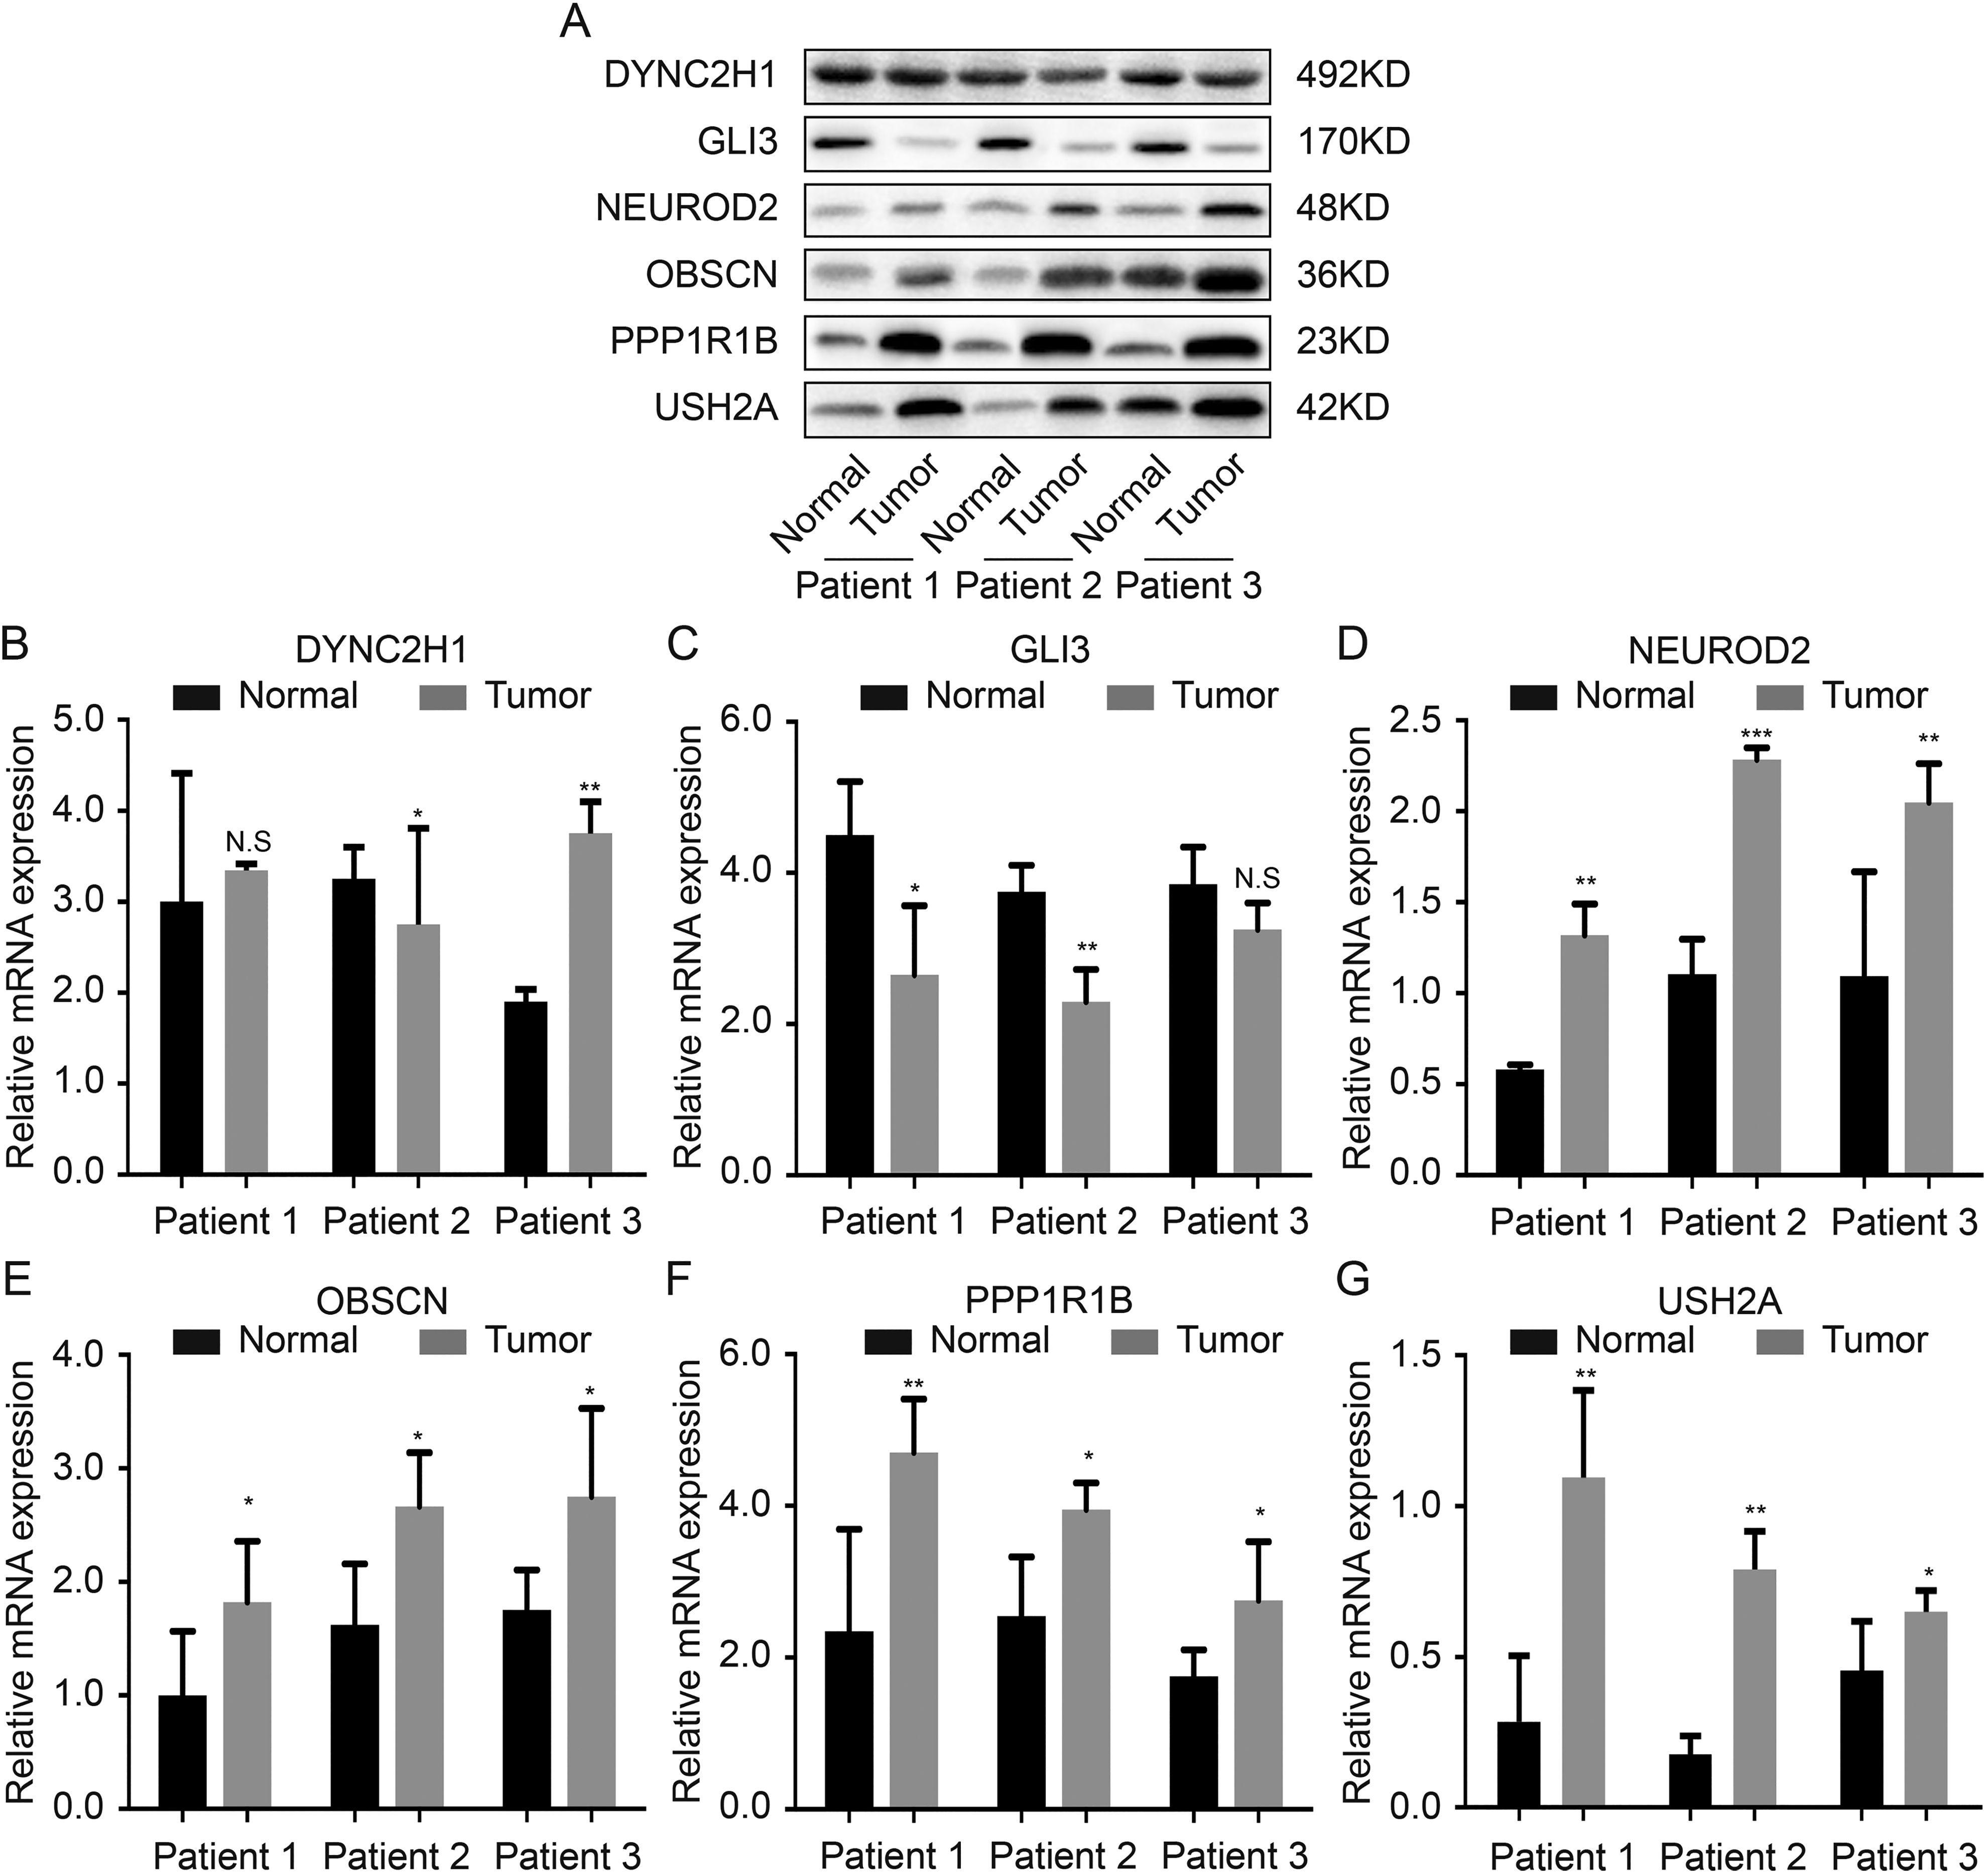
Protein and mRNA validation of the prognostic genes in vivo. A. Protein expression of six genes in western blot; B. mRNA expression of six genes in polymerase chain reaction.
Analysis of the Correlation Between Clonal or Subclonal Events and Clinical Characteristics
The differences between clonal and subclonal events by the TNM stage, clinical stage, age, gender, and histological type were analyzed. There were significant differences in the number of subclonal events in the T stage (Fig. 7A), whereas the N stage, gender, and histological type were significantly different in clonal events (Fig. 7B–D). The risk of gastric adenocarcinoma is reportedly higher in males than females, consistent with our observation that clonal events in males were significantly higher than females (Fig. 7C). Papillary and tubular types were significantly higher than those in other types (Fig. 7D). There was no significant difference observed in the clonal/subclonal events and M stage, clinical stage, age, or grade (Supplemental Fig. S6).
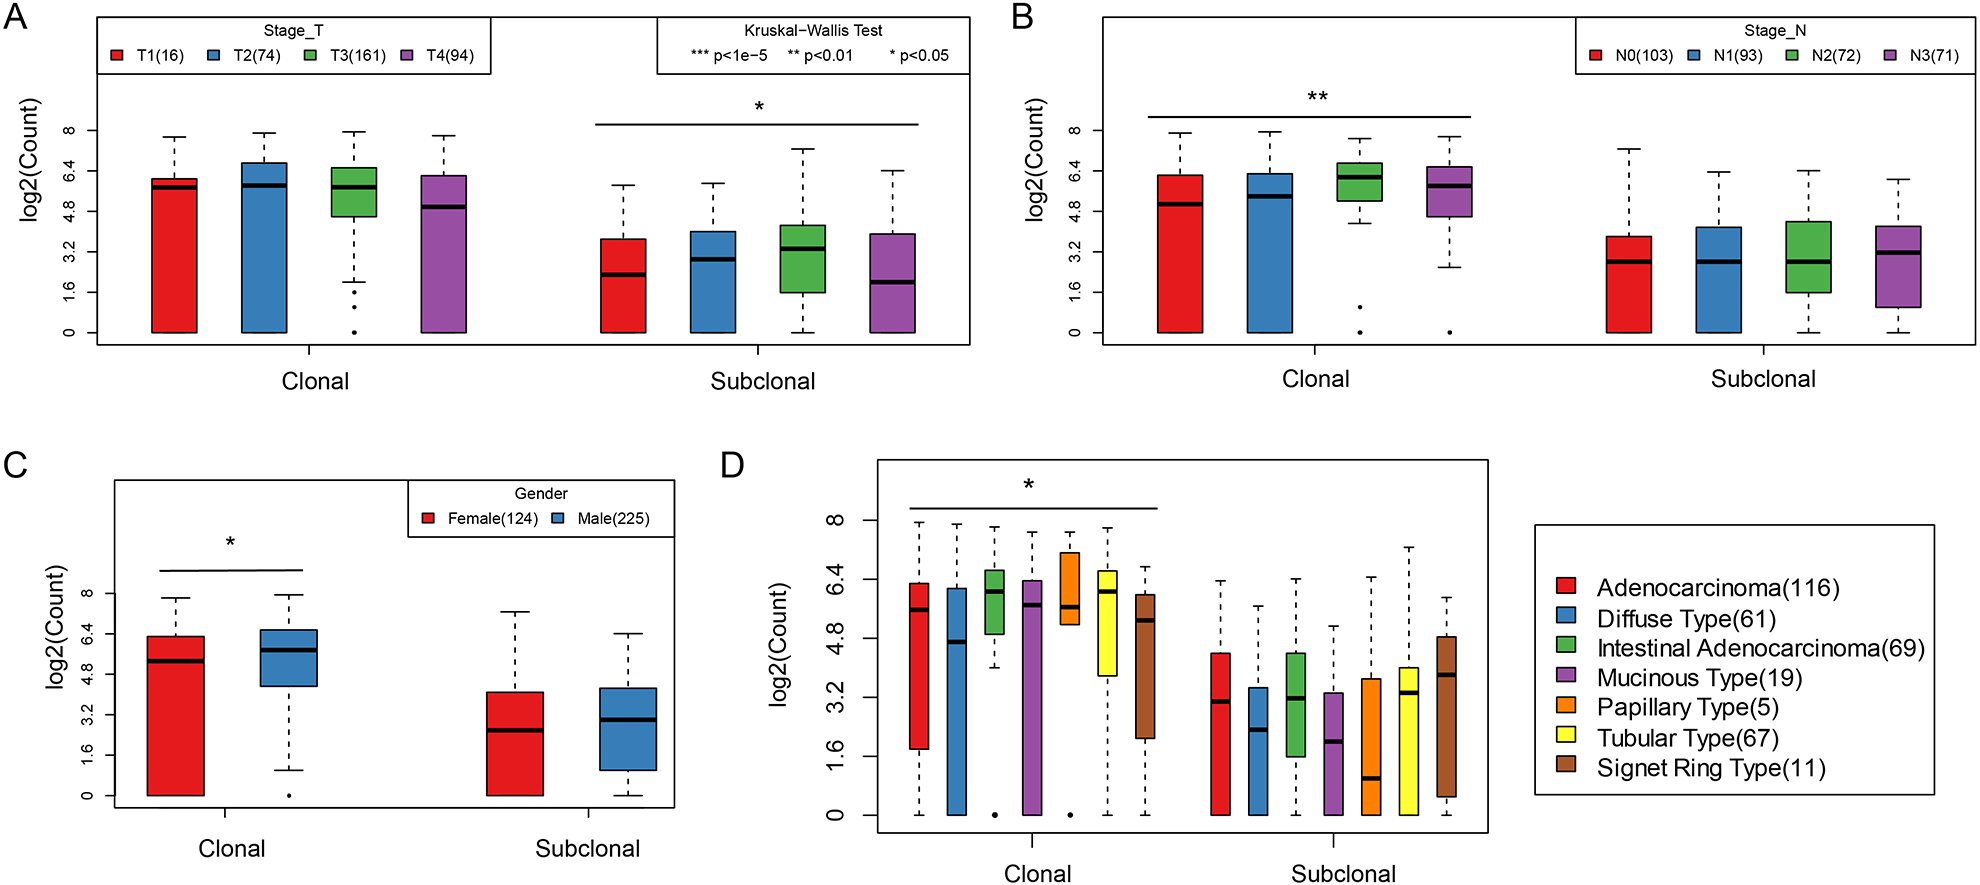
A. The quantitative distribution of clonal events and subclonal events on T stage; B. the quantitative distribution of clonal events and subclonal events on N stage; C. the quantitative distribution of clonal events and subclonal events on gender; D. the quantitative distribution of clonal events and subclonal events on different tissue types.
Relationship Between Clonal /Subclonal Events and TMB/Neoantigens
The TMB and neoantigens are important biomarkers in immune checkpoint therapy, and clonal/subclonal events also substantially affect the occurrence and progression of tumors. In evaluating the relationship between clonal/subclonal events and TMB and neoantigens, we found the distributions of TMB, neoantigen, and clonal/subclonal events were non-normal (Shapiro test P < 1e-5). The Spearman method was, therefore, used to evaluate the correlations among them. The results showed a highly significant relationship between clonal events and TMB and neoantigen (Fig. 8A–C), but a weak correlation between subclonal events and TMB and neoantigen (Fig. 8D).
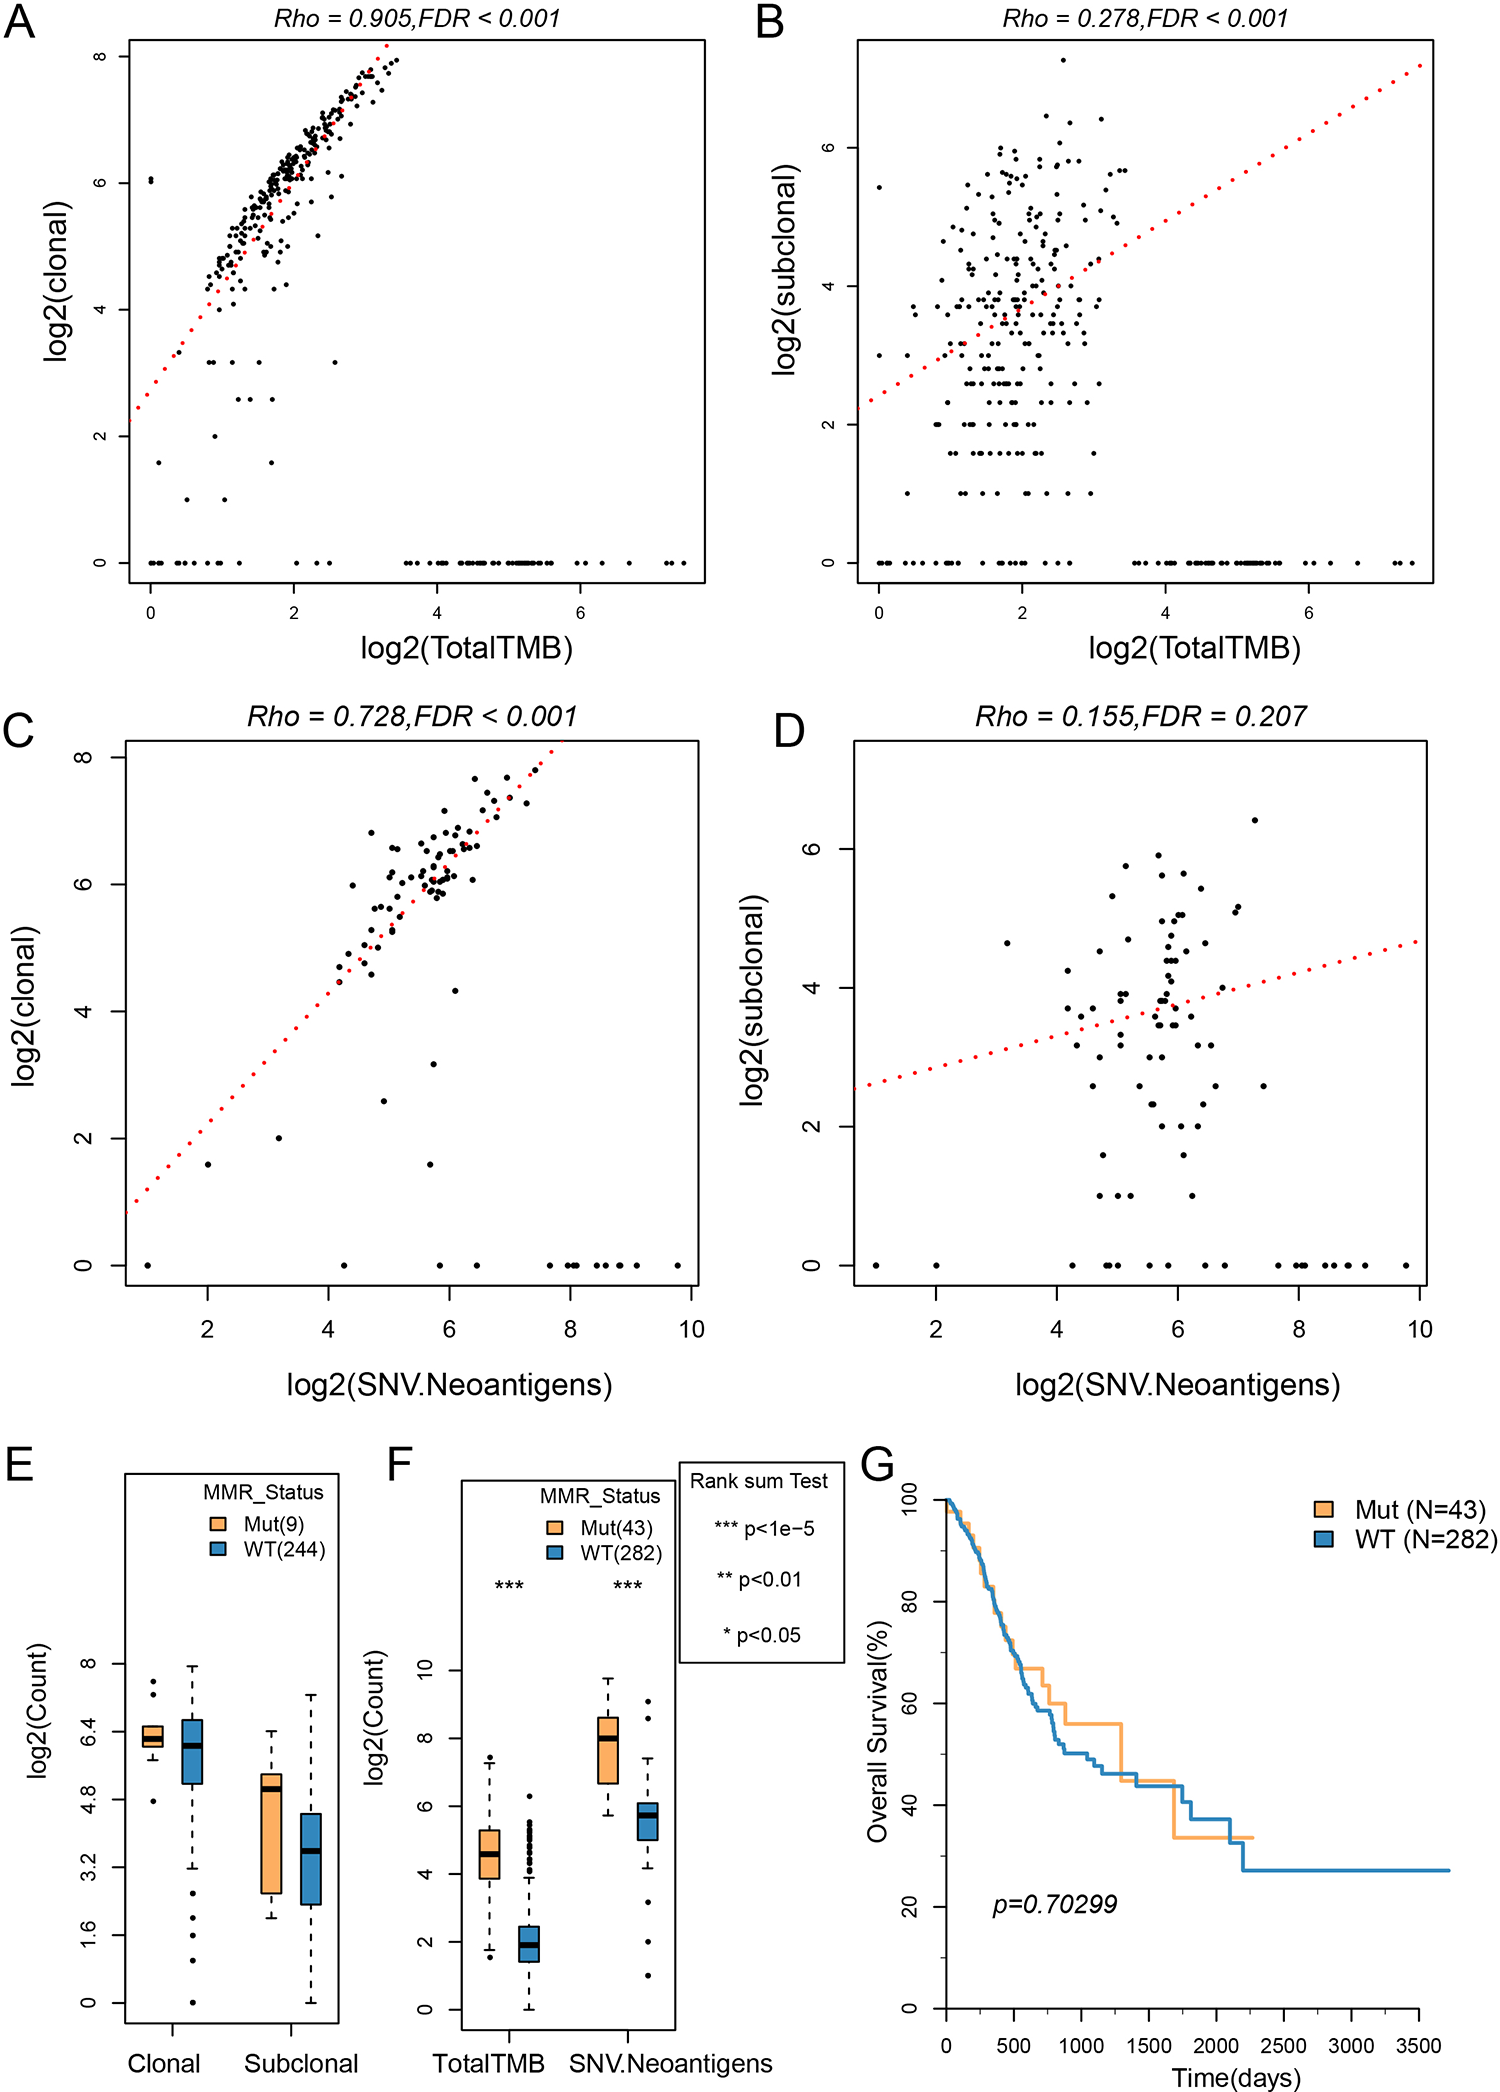
The correlation between clonal/subclonal events and TMB and neoantigens. A: The scatter diagram of clonal events and TMB; B: the scatter diagram of subclonal events and TMB; C: the scatter diagram of clonal events and neoantigens; D: the scatter diagram of subclonal events and neoantigens; E: clonal/subclonal events comparison between the MMR Mut group and the WT group; F: comparison of TMB and neoantigens between the MMR Mut group and the WT group; G: the OS KM curves of the MMR Mut group and the WT group. The correlation test used the Spearman method (Rho value).
The mutation of MMRs has an important effect on the mutation burden of the genome. The clonal/subclonal difference between MMR-mutated samples (Mut) and nonmutated samples (wild type [WT]) was further evaluated. The clonal/subclonal events in the Mut group were higher than that in the WT group, but the differences were not significant, which might be related to the smaller sample size of the Mut group (Fig. 8E). The TMB and neoantigens in the Mut group were significantly higher than those in the WT group (Fig. 8F), but there was no significant difference between them in OS (Fig. 8G).
Discussion
In recent years, researchers have studied the molecular mechanism of STAD and the genomic variation in gastric cancer. Second-generation sequencing, as a high-throughput method, can systematically identify genomic variations in the cancer genome 26 . Studies have reported genomic mutations in gastric cancer, such as TP53, PIK3CA, CTNNB1, and CDH1 27 . In addition, 59% of gastric cancer has mutations in chromatin remodeling genes such as ARID1A, PBRM1, and SETD2 28 . As two important genomic variation sources, SNV and SCAN have played an important role in gastric cancer.
Although many studies have utilized bioinformatics methods to find key molecules and potential regulatory pathways related to tumor prognosis or diagnosis, few studies have been based on tumor evolution analysis to provide effective prognosis and other related information, especially in gastric cancer. To the best of our knowledge, our research is the first to explore the biological significance and potential target molecules of tumor evolution in gastric cancer.
In this study, we obtained three SNV signatures (A–C) based on the trinucleotide mutation pattern, and these signatures were found to be similar to known mutant signatures provided by COSMIC. It is found that signature B and signature 3, and signature C and signature 17 have high similarity, Signature A and signature 1 demonstrated the best similarity. For example, signature 3 is associated with the repair failure of double-strand breaks of homologous recombined DNA, mainly found in breast, ovarian, and pancreatic cancers. Apart from gastric cancer, signature 17 has also been found in esophageal cancer, breast cancer, liver cancer, lung adenocarcinoma, B-cell lymphoma, and melanoma, but its relationship with tumors is still unknown. Signature 1 had been found in all cancer types and most cancer samples. It is generated by the endogenous mutation caused by the spontaneous deamination of 5-methylcytosine. Further, we systematically analyzed the relation between the three SNV signatures and clinical features; it showed that the scores of signature B and signature C in M0 samples were significantly higher than those in the M1 stage, and signature A was positively correlated with age.
Tumorigenesis is a process of dynamic evolution, and tumor heterogeneity originates from the evolution of different subclones in tumor evolution. In the process of occurrence and development of tumors, due to the accumulation of mutations, the clonal type of tumor cells constantly changes 29 . This study attempted to explore the evolutionary model of clonal and subclonal in gastric cancer. First, 46 SCNA and 101 SNVs with high-frequency mutations were obtained. As the number of mutations in TP53, TTN, and MUC16 genes was the highest among all samples (>20%) and mainly clonal events, these genes are more likely to appear as early events. In contrast, the number of clonal and subclonal mutations in common proto-oncogenes, such as PIK3CA, is relatively small (<10%). However, the CNV gain of MIEN1, GRB7, and PNMT genes were the highest (>10%) among all samples.
We analyzed the relations between mutation and tumor evolution in clonal/subclonal events. A group of genes with mutations in the early, intermediate, and late stages of tumor evolution were obtained, and the expressions of significantly prognostic genes were verified with clinical samples (USH2A, GLI3, DYNC2H1, OBSCN, NEUROD2, and PPP1R1B). The time of occurrence of these gene mutations may have an important impact on tumor occurrence and progression.
Finally, we focused on the TMB and neoantigens as important biomarkers for immune checkpoint therapy 30 . Tumors with high mutational burden are more likely to respond to anti-immunosuppressive strategies based on a checkpoint blockade 31 –34 . Our results show that the emergence of clonal events is an important contributor to the TMB and neoantigens. The mutation of the MMR’s key gene has an important effect on the genome’s mutation load. We found that TMB and neoantigens in the mutation group were significantly higher than those in the WT group, but there was no significant difference in prognosis. Although the abnormality of MMR can have an important impact on genome stability, it has a complex relationship with prognosis.
Although we have systematically analyzed the mutation characteristics in gastric cancer evolution in large samples by bioinformatics, additional research with larger sample sizes is needed. We detected data with both exome and CNVs. Furthermore, the data with clinical follow-up only existed in the TCGA cohort, so it is difficult for our results to be verified in other cohorts. We expect future data collection and analyses to support our conclusions.
In conclusion, we obtained the whole-genome sequencing data of 349 patients from TCGA. We analyzed the chronology, mutation characteristics, and evolutionary patterns of frequent somatic events in gastric cancer, evaluated their clinical correlation with patients, and verified the expression of mutant genes with significant prognoses. Our results revealed specific mutation characteristics and tumoral heterogeneity changes during the evolution of gastric cancer. Furthermore, we proposed an evolutionary model of gastric cancer development, and found some clonal or subclonal events as potential prognostic markers.
Supplemental Material
Supplemental Material, sj-jpg-1-cll-10.1177_0963689721989606 - Clonal Architectures Predict Clinical Outcome in Gastric Adenocarcinoma Based on Genomic Variation, Tumor Evolution, and Heterogeneity
Supplemental Material, sj-jpg-1-cll-10.1177_0963689721989606 for Clonal Architectures Predict Clinical Outcome in Gastric Adenocarcinoma Based on Genomic Variation, Tumor Evolution, and Heterogeneity by Chenxia Ren, Cuiling Wu, Niuniu Wang, Changhong Lian and Changqing Yang in Cell Transplantation
Supplemental Material
Supplemental Material, sj-jpg-2-cll-10.1177_0963689721989606 - Clonal Architectures Predict Clinical Outcome in Gastric Adenocarcinoma Based on Genomic Variation, Tumor Evolution, and Heterogeneity
Supplemental Material, sj-jpg-2-cll-10.1177_0963689721989606 for Clonal Architectures Predict Clinical Outcome in Gastric Adenocarcinoma Based on Genomic Variation, Tumor Evolution, and Heterogeneity by Chenxia Ren, Cuiling Wu, Niuniu Wang, Changhong Lian and Changqing Yang in Cell Transplantation
Supplemental Material
Supplemental Material, sj-jpg-3-cll-10.1177_0963689721989606 - Clonal Architectures Predict Clinical Outcome in Gastric Adenocarcinoma Based on Genomic Variation, Tumor Evolution, and Heterogeneity
Supplemental Material, sj-jpg-3-cll-10.1177_0963689721989606 for Clonal Architectures Predict Clinical Outcome in Gastric Adenocarcinoma Based on Genomic Variation, Tumor Evolution, and Heterogeneity by Chenxia Ren, Cuiling Wu, Niuniu Wang, Changhong Lian and Changqing Yang in Cell Transplantation
Supplemental Material
Supplemental Material, sj-jpg-4-cll-10.1177_0963689721989606 - Clonal Architectures Predict Clinical Outcome in Gastric Adenocarcinoma Based on Genomic Variation, Tumor Evolution, and Heterogeneity
Supplemental Material, sj-jpg-4-cll-10.1177_0963689721989606 for Clonal Architectures Predict Clinical Outcome in Gastric Adenocarcinoma Based on Genomic Variation, Tumor Evolution, and Heterogeneity by Chenxia Ren, Cuiling Wu, Niuniu Wang, Changhong Lian and Changqing Yang in Cell Transplantation
Supplemental Material
Supplemental Material, sj-jpg-5-cll-10.1177_0963689721989606 - Clonal Architectures Predict Clinical Outcome in Gastric Adenocarcinoma Based on Genomic Variation, Tumor Evolution, and Heterogeneity
Supplemental Material, sj-jpg-5-cll-10.1177_0963689721989606 for Clonal Architectures Predict Clinical Outcome in Gastric Adenocarcinoma Based on Genomic Variation, Tumor Evolution, and Heterogeneity by Chenxia Ren, Cuiling Wu, Niuniu Wang, Changhong Lian and Changqing Yang in Cell Transplantation
Supplemental Material
Supplemental Material, sj-jpg-6-cll-10.1177_0963689721989606 - Clonal Architectures Predict Clinical Outcome in Gastric Adenocarcinoma Based on Genomic Variation, Tumor Evolution, and Heterogeneity
Supplemental Material, sj-jpg-6-cll-10.1177_0963689721989606 for Clonal Architectures Predict Clinical Outcome in Gastric Adenocarcinoma Based on Genomic Variation, Tumor Evolution, and Heterogeneity by Chenxia Ren, Cuiling Wu, Niuniu Wang, Changhong Lian and Changqing Yang in Cell Transplantation
Supplemental Material
Supplemental Material, sj-jpg-7-cll-10.1177_0963689721989606 - Clonal Architectures Predict Clinical Outcome in Gastric Adenocarcinoma Based on Genomic Variation, Tumor Evolution, and Heterogeneity
Supplemental Material, sj-jpg-7-cll-10.1177_0963689721989606 for Clonal Architectures Predict Clinical Outcome in Gastric Adenocarcinoma Based on Genomic Variation, Tumor Evolution, and Heterogeneity by Chenxia Ren, Cuiling Wu, Niuniu Wang, Changhong Lian and Changqing Yang in Cell Transplantation
Supplemental Material
Supplemental Material, sj-txt-1-cll-10.1177_0963689721989606 - Clonal Architectures Predict Clinical Outcome in Gastric Adenocarcinoma Based on Genomic Variation, Tumor Evolution, and Heterogeneity
Supplemental Material, sj-txt-1-cll-10.1177_0963689721989606 for Clonal Architectures Predict Clinical Outcome in Gastric Adenocarcinoma Based on Genomic Variation, Tumor Evolution, and Heterogeneity by Chenxia Ren, Cuiling Wu, Niuniu Wang, Changhong Lian and Changqing Yang in Cell Transplantation
Supplemental Material
Supplemental Material, sj-txt-10-cll-10.1177_0963689721989606 - Clonal Architectures Predict Clinical Outcome in Gastric Adenocarcinoma Based on Genomic Variation, Tumor Evolution, and Heterogeneity
Supplemental Material, sj-txt-10-cll-10.1177_0963689721989606 for Clonal Architectures Predict Clinical Outcome in Gastric Adenocarcinoma Based on Genomic Variation, Tumor Evolution, and Heterogeneity by Chenxia Ren, Cuiling Wu, Niuniu Wang, Changhong Lian and Changqing Yang in Cell Transplantation
Supplemental Material
Supplemental Material, sj-txt-2-cll-10.1177_0963689721989606 - Clonal Architectures Predict Clinical Outcome in Gastric Adenocarcinoma Based on Genomic Variation, Tumor Evolution, and Heterogeneity
Supplemental Material, sj-txt-2-cll-10.1177_0963689721989606 for Clonal Architectures Predict Clinical Outcome in Gastric Adenocarcinoma Based on Genomic Variation, Tumor Evolution, and Heterogeneity by Chenxia Ren, Cuiling Wu, Niuniu Wang, Changhong Lian and Changqing Yang in Cell Transplantation
Supplemental Material
Supplemental Material, sj-txt-3-cll-10.1177_0963689721989606 - Clonal Architectures Predict Clinical Outcome in Gastric Adenocarcinoma Based on Genomic Variation, Tumor Evolution, and Heterogeneity
Supplemental Material, sj-txt-3-cll-10.1177_0963689721989606 for Clonal Architectures Predict Clinical Outcome in Gastric Adenocarcinoma Based on Genomic Variation, Tumor Evolution, and Heterogeneity by Chenxia Ren, Cuiling Wu, Niuniu Wang, Changhong Lian and Changqing Yang in Cell Transplantation
Supplemental Material
Supplemental Material, sj-txt-4-cll-10.1177_0963689721989606 - Clonal Architectures Predict Clinical Outcome in Gastric Adenocarcinoma Based on Genomic Variation, Tumor Evolution, and Heterogeneity
Supplemental Material, sj-txt-4-cll-10.1177_0963689721989606 for Clonal Architectures Predict Clinical Outcome in Gastric Adenocarcinoma Based on Genomic Variation, Tumor Evolution, and Heterogeneity by Chenxia Ren, Cuiling Wu, Niuniu Wang, Changhong Lian and Changqing Yang in Cell Transplantation
Supplemental Material
Supplemental Material, sj-txt-5-cll-10.1177_0963689721989606 - Clonal Architectures Predict Clinical Outcome in Gastric Adenocarcinoma Based on Genomic Variation, Tumor Evolution, and Heterogeneity
Supplemental Material, sj-txt-5-cll-10.1177_0963689721989606 for Clonal Architectures Predict Clinical Outcome in Gastric Adenocarcinoma Based on Genomic Variation, Tumor Evolution, and Heterogeneity by Chenxia Ren, Cuiling Wu, Niuniu Wang, Changhong Lian and Changqing Yang in Cell Transplantation
Supplemental Material
Supplemental Material, sj-txt-6-cll-10.1177_0963689721989606 - Clonal Architectures Predict Clinical Outcome in Gastric Adenocarcinoma Based on Genomic Variation, Tumor Evolution, and Heterogeneity
Supplemental Material, sj-txt-6-cll-10.1177_0963689721989606 for Clonal Architectures Predict Clinical Outcome in Gastric Adenocarcinoma Based on Genomic Variation, Tumor Evolution, and Heterogeneity by Chenxia Ren, Cuiling Wu, Niuniu Wang, Changhong Lian and Changqing Yang in Cell Transplantation
Supplemental Material
Supplemental Material, sj-txt-7-cll-10.1177_0963689721989606 - Clonal Architectures Predict Clinical Outcome in Gastric Adenocarcinoma Based on Genomic Variation, Tumor Evolution, and Heterogeneity
Supplemental Material, sj-txt-7-cll-10.1177_0963689721989606 for Clonal Architectures Predict Clinical Outcome in Gastric Adenocarcinoma Based on Genomic Variation, Tumor Evolution, and Heterogeneity by Chenxia Ren, Cuiling Wu, Niuniu Wang, Changhong Lian and Changqing Yang in Cell Transplantation
Supplemental Material
Supplemental Material, sj-txt-8-cll-10.1177_0963689721989606 - Clonal Architectures Predict Clinical Outcome in Gastric Adenocarcinoma Based on Genomic Variation, Tumor Evolution, and Heterogeneity
Supplemental Material, sj-txt-8-cll-10.1177_0963689721989606 for Clonal Architectures Predict Clinical Outcome in Gastric Adenocarcinoma Based on Genomic Variation, Tumor Evolution, and Heterogeneity by Chenxia Ren, Cuiling Wu, Niuniu Wang, Changhong Lian and Changqing Yang in Cell Transplantation
Supplemental Material
Supplemental Material, sj-txt-9-cll-10.1177_0963689721989606 - Clonal Architectures Predict Clinical Outcome in Gastric Adenocarcinoma Based on Genomic Variation, Tumor Evolution, and Heterogeneity
Supplemental Material, sj-txt-9-cll-10.1177_0963689721989606 for Clonal Architectures Predict Clinical Outcome in Gastric Adenocarcinoma Based on Genomic Variation, Tumor Evolution, and Heterogeneity by Chenxia Ren, Cuiling Wu, Niuniu Wang, Changhong Lian and Changqing Yang in Cell Transplantation
Footnotes
Authors Note
Chenxia Ren and Cuiling Wu contributed equally to this work.
Ethical Approval
This study was approved by the Ethics Committee of Heping Hospital, affiliated with Changzhi Medical College.
Statement of Human and Animal Rights
All patients provided written informed consent prior to the study.
Statement of Informed Consent
There are no human subjects in this article and informed consent is not applicable.
Declaration of Conflicting Interests
The author(s) declared no potential conflicts of interest with respect to the research, authorship, and/or publication of this article.
Funding
This study was supported by the Fund for Shanxi “1331 Project” Key Innovative Research Team and College Students’ Innovation Project (No.D2018385).
Supplemental Material
Supplemental material for this article is available online.
References
Supplementary Material
Please find the following supplemental material available below.
For Open Access articles published under a Creative Commons License, all supplemental material carries the same license as the article it is associated with.
For non-Open Access articles published, all supplemental material carries a non-exclusive license, and permission requests for re-use of supplemental material or any part of supplemental material shall be sent directly to the copyright owner as specified in the copyright notice associated with the article.