
Abstract
Glioblastomas are the most common primary central nervous system malignancy tumor in adults. Glioblastoma patients have poor prognosis, with an average survival period of approximately 14 mo after diagnosis. To date, there are a limited number of effective treatment methods for glioblastoma, and its molecular mechanisms remain elusive. In this article, we analyzed the key biomarkers and pathways in glioblastoma patients based on gene expression and DNA methylation datasets. The 60 hypomethylated/upregulated genes and 110 hypermethylated/downregulated genes were identified in GSE50923, GSE50161, and GSE116520 microarrays. Functional enrichment analyses indicated that these methylated-differentially expressed genes were primarily involved in collagen fibril organization, chemical synaptic transmission, extracellular matrix-receptor interaction, and GABAergic synapse. The hub genes were screened from a protein–protein interaction network; in selected genes, increased NMB mRNA level was associated with favorable overall survival, while elevated CHI3L1, POSTN, S100A4, LOX, S100A11, IGFBP2, SLC12A5, VSNL1, and RGS4 mRNA levels were associated with poor overall survival in glioblastoma patients. Additionally, CHI3L1, S100A4, LOX, and S100A11 expressions were negatively correlated with their corresponding methylation status. Furthermore, the receiver-operator characteristic curve analysis indicated that CHI3L1, S100A4, LOX, and S100A11 can also serve as highly specific and sensitive diagnostic biomarkers for glioblastoma patients. Collectively, our study revealed the possible methylated-differentially expressed genes and associated pathways in glioblastoma and identified four DNA methylation-based biomarkers of glioblastoma. These results may provide insight on diagnostic and prognostic biomarkers, and therapeutic targets in glioblastoma.
Introduction
Primary central nervous system (CNS) tumors include a wide range of tumors, and 80% of CNS tumors are gliomas 1 . Glioblastomas (GBM) arise from glial or precursor cells and are the most common primary CNS malignant tumors in adults, with an average survival period of approximately 14 mo after diagnosis 2,3 . The World Health Organization (WHO) has classified GBM as a grade IV astrocytoma, the highest grade of malignancy, based on the histopathological and clinical features of this tumor 4 . The therapeutic methods commonly used are surgical resection, radiotherapy, and chemotherapy. Unfortunately, there are no standard treatment methods for GBM, and its underlying molecular mechanisms remain unclear 5 . Therefore, it is crucial to explore novel diagnostic and prognostic biomarkers, establish prediction methods, and provide insights into therapeutic targets in GBM.
Epigenetics mechanisms, such as DNA methylation and histone acetylation, depict the changes in gene expression without potential modification of the genome sequence 6 . It is well established that alterations of DNA methylation play a key role in pathogenesis and progression of various tumors, including GBM 7,8 . In addition, altered methylation patterns in DNA sequences, including hypomethylated oncogenes and hypermethylated suppressors, are significantly correlated with patient survival in various cancers 9,10 . Thus, the identification of differentially methylated genes (DMGs) combined with differentially expressed genes (DEGs) will significantly benefit the exploration of molecular mechanisms and establishment of effective biomarkers of GBM.
There are evidences that indicate identification of valuable biomarkers using transcriptomics 11 –13 . Although some studies have revealed aberrant DNA methylation in GBM, limited research has been conducted on the comprehensive analysis of gene expression, methylation, and underlying molecular mechanisms 14,15 . Thus, integrated analyses of methylated-differentially expressed gene (MDEG) profiles are beneficial for the development of therapeutic strategies for GBM.
This study aimed to explore DNA methylation-based diagnostic and prognostic biomarkers in GBM patients. Gene methylation profiling microarrays (GSE50923) and gene expression microarrays (GSE50161 and GSE116520) were analyzed using various bioinformatics tools. These MDEGs may provide insight into therapeutic targets and diagnostic biomarkers for GBM.
Materials and Methods
Microarray Datasets
DNA methylation microarray (GSE50923) and gene expression microarrays (GSE50161 and GSE116520) were obtained from the Gene Expression Omnibus (GEO; National Institutes of Health, Bethesda, MD, USA; https://www.ncbi.nlm.nih.gov/geo/). GSE50923 dataset contains 24 control brain tissues and 54 GBM samples obtained using the GPL8490 Platform (HumanMethylation27 BeadChip, Illumina Inc., San Diego, CA, USA). Gene expression profiling of the GSE50161 dataset was performed using the GPL570 platform (Human Genome U133 Plus 2.0 Array, Affymetrix, Inc., Santa Clara, CA, USA) that included 13 nontumor brain tissues and 34 GBM tumor tissues. Gene expression profiling of the GSE116520 dataset was conducted using the GPL10558 platform (HumanHT-12 V4.0 expression Beadchip, Illumina), including 8 nontumor brain tissues and 17 GBM tumor tissues.
Data Processing
We identified DEGs and DMGs using GEO2 R (National Institutes of Health; http://www.ncbi.nlm.nih.gov/geo/geo2r/). The adjusted P < 0.05 and |logfold change| ≥ 2 were selected for DEGs, and the threshold of adjusted P < 0.05 and |t| > 2 were selected for DMGs. Subsequently, hypomethylated/upregulated genes and hypermethylated/downregulated genes were intersected by a Venn diagram.
Functional Enrichment Analyses
Functional enrichment analyses were performed using the Database for Annotation, Visualization and Integrated Discovery (DAVID; National Cancer Institute, Frederick, MD, USA; http://david.abcc.ncifcrf.gov/) database, including Gene Ontology (GO) terms and Kyoto Encyclopedia of Genes and Genomes (KEGG) pathway analyses. An enrichment threshold of P < 0.05 was considered significant.
Construction of Protein–Protein Interaction Network and Identification of Hub Genes
Protein–Protein Interaction (PPI) network was analyzed using the STRING database (European Molecular Biology Laboratory, Meyerhofstrasse, Heidelberg, Germany; Version 11.0, http://www.string-db.org), and the network was visually constructed using Cytoscape software (National Institute of General Medical Sciences, San Diego, CA, USA; Version 3.7.1, http://www.cytoscape.org/). Additionally, CytoHubba, a plugin app of Cytoscape, was used to identify the hub genes.
Survival Analysis of Hub Genes
The prognostic values of hub genes were assessed using gene expression profiling interactive analysis (GEPIA) (Biomedical Pioneering Innovation Center Peking University, Beijing, China; http://gepia.cancer-pku.cn). Samples were divided into two groups (low and high expression) based on mRNA levels using a hazard ratio and log-rank P-value to analyze the overall survival (OS) of GBM patients. Log-rank P-value <0.05 was considered statistically significant.
Expression and Correlation Analysis of Hub Genes
GEPIA (Biomedical Pioneering Innovation Center Peking University; http://gepia.cancer-pku.cn) is a RNA sequencing database derived from analysis of 9,736 tumors and 8,587 healthy samples from The Cancer Genome Atlas and Genotype-Tissue Expression datasets. The hub gene mRNA levels between tumor and normal samples were analyzed using GEPIA. P < 0.01 was considered significant. In addition, the cBioPortal was used for analysis of genetic alterations in hub genes and validation of correlation between gene expression and DNA methylation.
Validation of mRNA Levels In Vitro
Human gliocyte HEB cell lines and human GBM LN229 cells were purchased from Shanghai Bioleaf Biotech Co., Ltd., Shanghai, China. The cells were grown in Dulbecco’s modified Eagle’s medium containing 10% fetal bovine serum and incubated at 37°C in an atmosphere of 5% carbon dioxide in a humidified incubator. The medium was changed every 2 d.
Total RNA was extracted from the cell lines using TRIzol (Invitrogen, Carlsbad, CA, USA) according to manufacturer’s protocol. cDNA was synthesized based on standard protocols of EasyScript First-Strand cDNA Synthesis SuperMix (TransGen Biotech, Beijing, China). Quantitative polymerase chain reaction (PCR) analysis was performed using the StepOne Real-Time PCR System (Thermo Fisher Scientific, Rockford, IL, USA). The program was performed as follows: denaturation at 95°C for 15 min, followed by 40 cycles of 10 s at 95°C for annealing, and 32 s at 60°C for extension. The melting curve started at 95°C for 15 s, followed by 60°C for 1 min and ended with 15 s at 95°C. The primers were shown in supplemental Table S1. The 2−ΔΔCt method was used for the relative quantification of gene expression levels following the quantitative real time polymerase chain reaction experiments.
Diagnostic Analysis of Hub Genes
We evaluated the diagnostic effectiveness of hub genes using the receiver-operator characteristic (ROC) curve analysis with GSE50161 expression profiling. GraphPad prism (GraphPad, San Diego, CA, USA) was used to construct the ROC curve, and the area under the ROC curve exceeding 0.8 was considered significant.
Statistical Analysis
Experimental values are expressed as mean ± standard deviation of three independent experiments. The statistical significance of differences was obtained by Student’s t-test in GraphPad Pro (GraphPad). Differences were considered statistically significant when P-value was lower than 0.05.
Results
Identification of MDEGs
For the methylation microarray GSE50923, 12,059 DMGs were obtained, comprising 5,633 hypermethylated genes and 6,426 hypomethylated genes (supplemental Tables S2 and S3). In the expression microarrays, 876 upregulated genes and 1,241 downregulated genes were identified in GSE50161, and 214 upregulated genes and 469 downregulated genes were identified in GSE116520. A total of 60 hypomethylated/upregulated genes were obtained by overlapping the hypomethylation genes and the upregulated genes, and 110 hypermethylated/downregulated genes were obtained by overlapping the hypermethylation genes and the downregulated genes (Fig. 1A, B). The volcano plots of the expression microarray are presented in Fig. 1C, D. Lastly, heat maps of gene expression values were constructed using color patterns indicating the variability in gene expression between normal and GBM groups (Fig. 2A, B).

The methylated-differentially expressed genes. (A) Venn diagram of hypomethylation/high-expression genes. (B) Venn diagram of hypermethylation/low-expression genes. (C) Volcano plot for differentially expressed mRNA in GSE50161. (D) Volcano plot for differentially expressed mRNA in GSE116520.
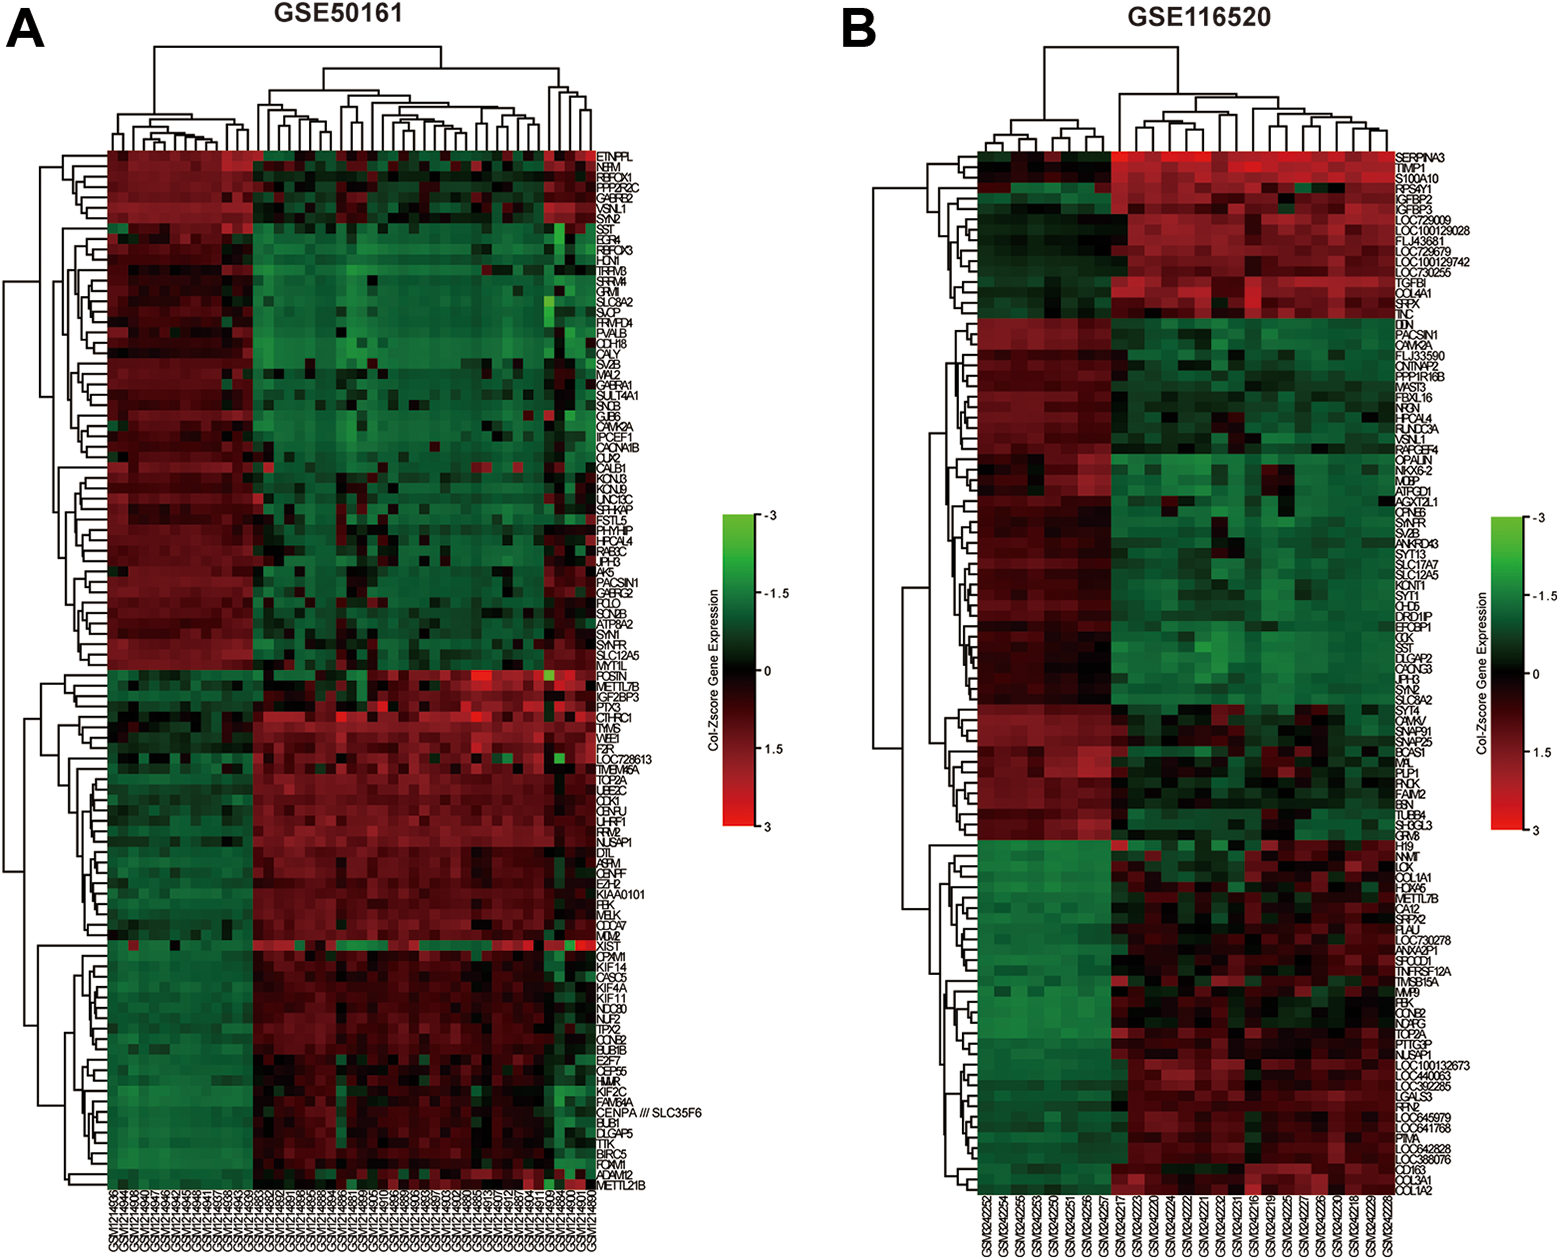
The heatmap of DEGs. (A) Top 100 DEGs in GSE50161 datasets. (B) Top 100 DEGs in GSE116520 datasets. Red: upregulation; Green: downregulation. DEGs: differentially expressed genes.
GO and Pathway Functional Enrichment Analysis
GO and KEGG pathway enrichment analysis were performed using DAVID database to predict the biological function of and pathways followed by the MDEGs. For hypomethylated/upregulated genes, as presented in Table 1 and Fig. 3, the GO was observed to be enriched in collagen fibril organization, extracellular matrix organization, collagen catabolic process, cell division, and cell adhesion in the BP category (Fig. 3A); extracellular space, extracellular matrix, extracellular region, extracellular exosome, and perinuclear region of cytoplasm in the CC category (Fig. 3B); and extracellular matrix structural constituent, cadherin binding involved in cell–cell adhesion, enzyme binding, protein homodimerization activity, and calcium-dependent protein binding in the MF category (Fig. 3C). Besides, as presented in Table 2 and Fig. 3D, hypomethylated/upregulated genes were enriched in selected cancer-associated pathways, such as PI3K-Akt signaling pathway, microRNAs in cancer, and proteoglycans in cancer. The detailed MDEGs related to the top five enriched pathways are shown in supplemental Table S4.
GO Enrichment Analysis of MDEGs Related With GBM Patients.

GBM: glioblastomas; GO: Gene Ontology; MDEGs: methylated-differentially expressed genes.

Functional enrichment analyses of hypomethylated/upregulated genes. (A) Significantly enriched GO terms based on biological process. (B) Significantly enriched GO terms based on cellular component. (C) Significantly enriched GO terms based on molecular function. (D) Significantly enriched KEGG pathway. GO: Gene Ontology; KEGG: Kyoto Encyclopedia of Genes and Genomes.
KEGG Pathway Analysis of MDEGs Related With GBM.

ECM: extracellular matrix; GBM: glioblastomas; KEGG: Kyoto Encyclopedia of Genes and Genomes; MDEGs: methylated-differentially expressed genes.
For hypermethylated/downregulated genes, as presented in Table 1 and Fig. 4, we observed that the GO was enriched in chemical synaptic transmission, neurotransmitter secretion, long-term synaptic potentiation, axonogenesis, and learning in the BP category (Fig. 4A); cell junction, axon, dendrite, perinuclear region of cytoplasm, and myelin sheath in the CC category (Fig. 4B); and phospholipase binding, GABA-A receptor activity, extracellular ligand-gated ion channel activity; GTPase activator activity, and amino acid transmembrane transporter activity in the MF category (Fig. 4C). Similarly, hypermethylated/downregulated genes were also enriched in some pathways, including GABAergic synapse, morphine addiction, retrograde endocannabinoid signaling, nicotine addiction, and synaptic vesicle cycle (Table 2 and Fig. 4D).
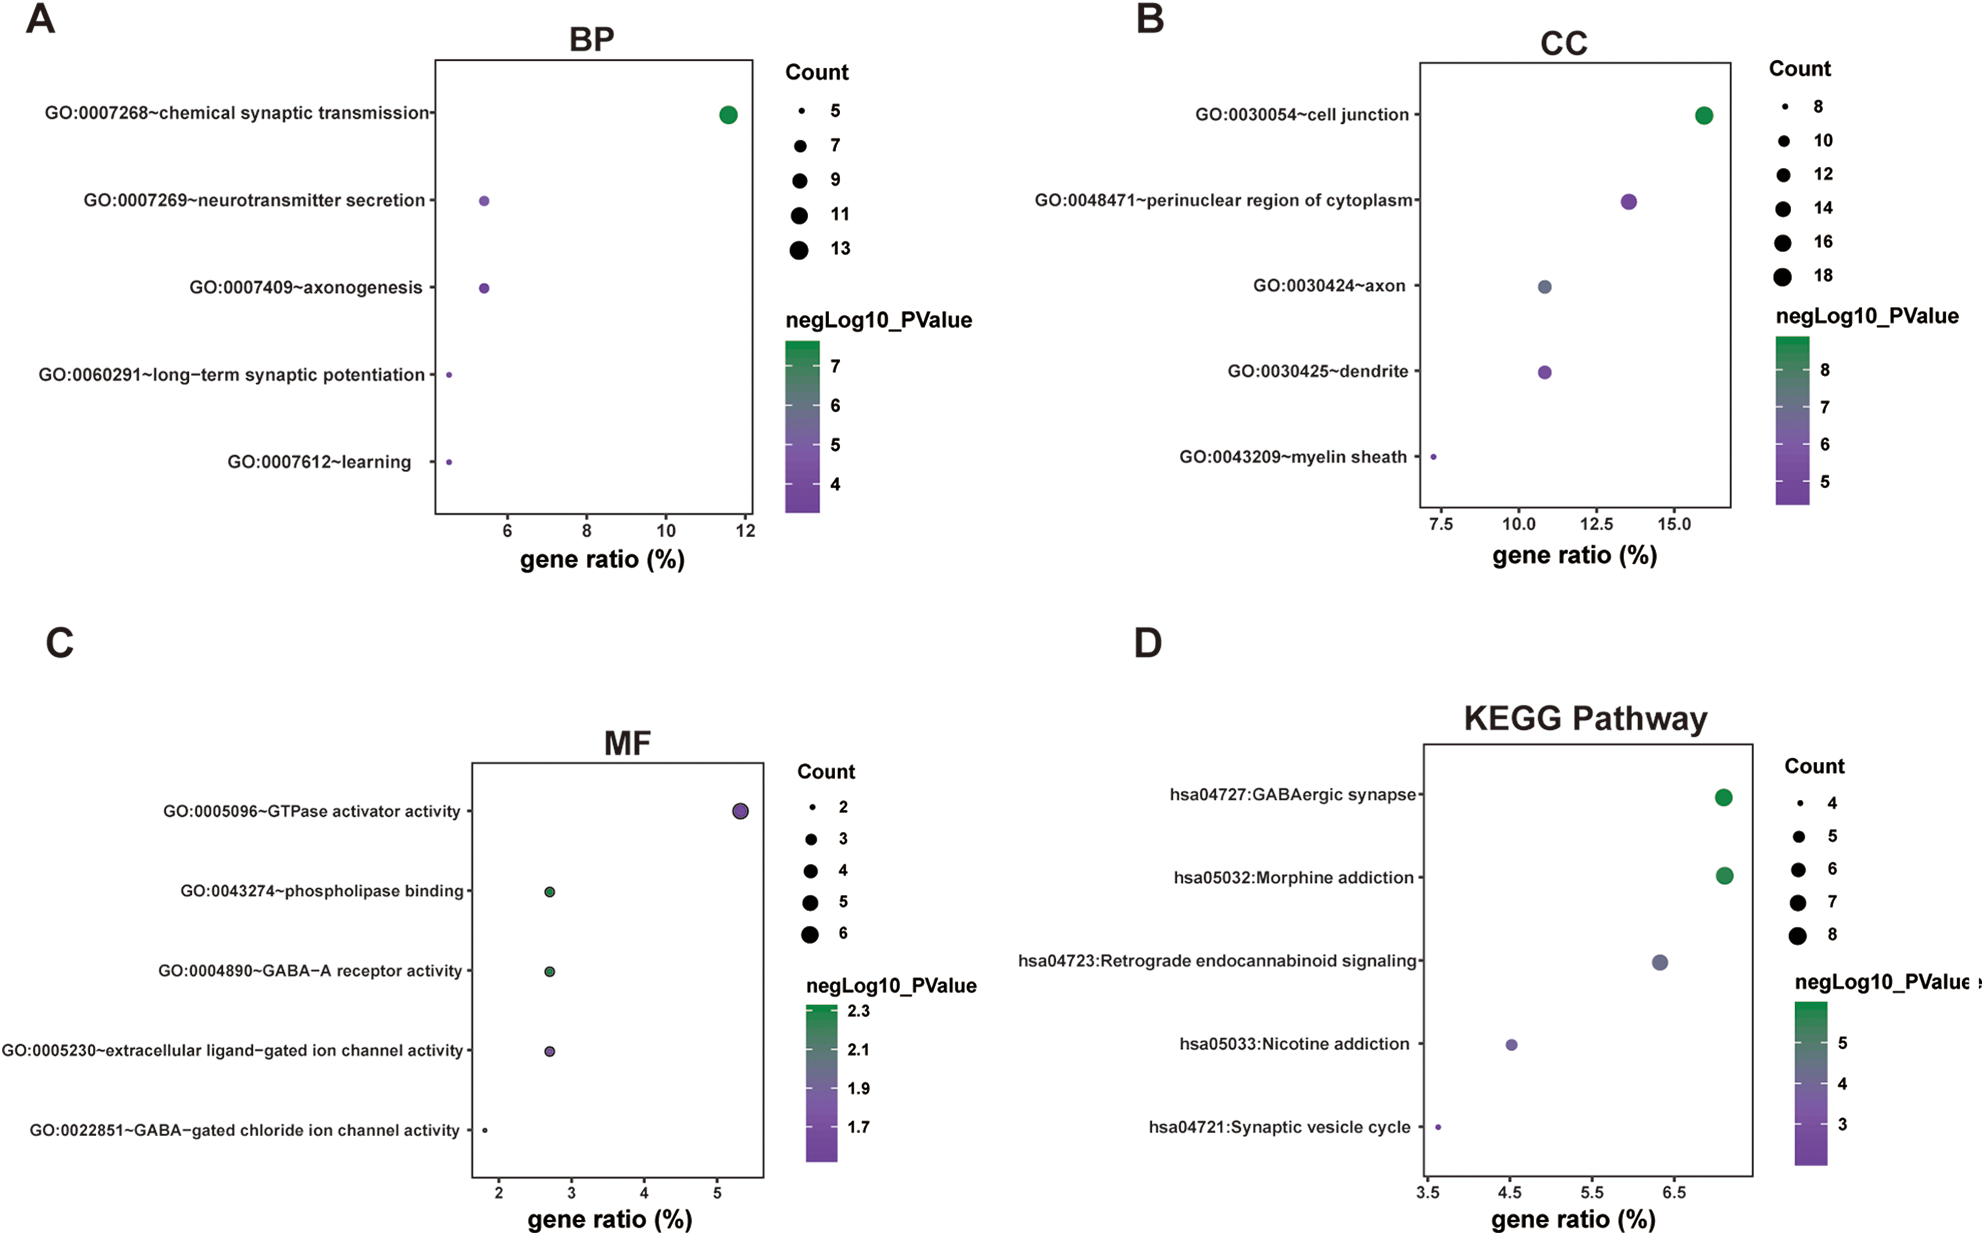
Functional enrichment analyses of hypermethylated/downregulated genes. (A) Significantly enriched GO terms based on biological processes. (B) Significantly enriched GO terms based on cellular components. (C) Significantly enriched GO terms based on molecular function. (D) Significantly enriched KEGG pathway. GO: Gene Ontology; KEGG: Kyoto Encyclopedia of Genes and Genomes.
PPI Network Construction and Hub Gene Analysis
For hypomethylated/upregulated genes, the PPI network contained 48 nodes and 161 edges (Fig. 5A), while 76 nodes and 282 edges were established in the hypermethylated/downregulated genes networks (Fig. 5C). We next selected hub genes in the PPI networks using CytoHubba. The top 40 hub genes in two datasets were constructed using Cytoscape. The interactions of the top 40 hub hypomethylated/upregulated genes and hypermethylated/downregulated genes are presented in Fig. 5B, D, respectively.

Top 40 hub genes identified in PPI networks. (A) PPI network of hypermethylation/low-expression genes. (B) Top 40 hub genes of the significant hypermethylation/low-expression genes. (C) PPI network of hypermethylation/low-expression genes. (D) Top 40 hub genes of the significantly hypermethylated/low-expression genes. PPI: protein–protein interaction.
Kaplan–Meier Analysis and Validation of Hub Genes
We investigated the prognostic values of identified hub genes using Kaplan–Meier analysis. For the complete cohort, increase in NMB mRNA was significantly associated with favorable OS, while elevated CHI3L1, POSTN, S100A4, LOX, S100A11, IGFBP2, SLC12A5, VSNL1, and RGS4 mRNA levels were associated with unfavorable OS in GBM patients (Fig. 6). The remaining hub genes were insignificantly associated with OS (data not shown).
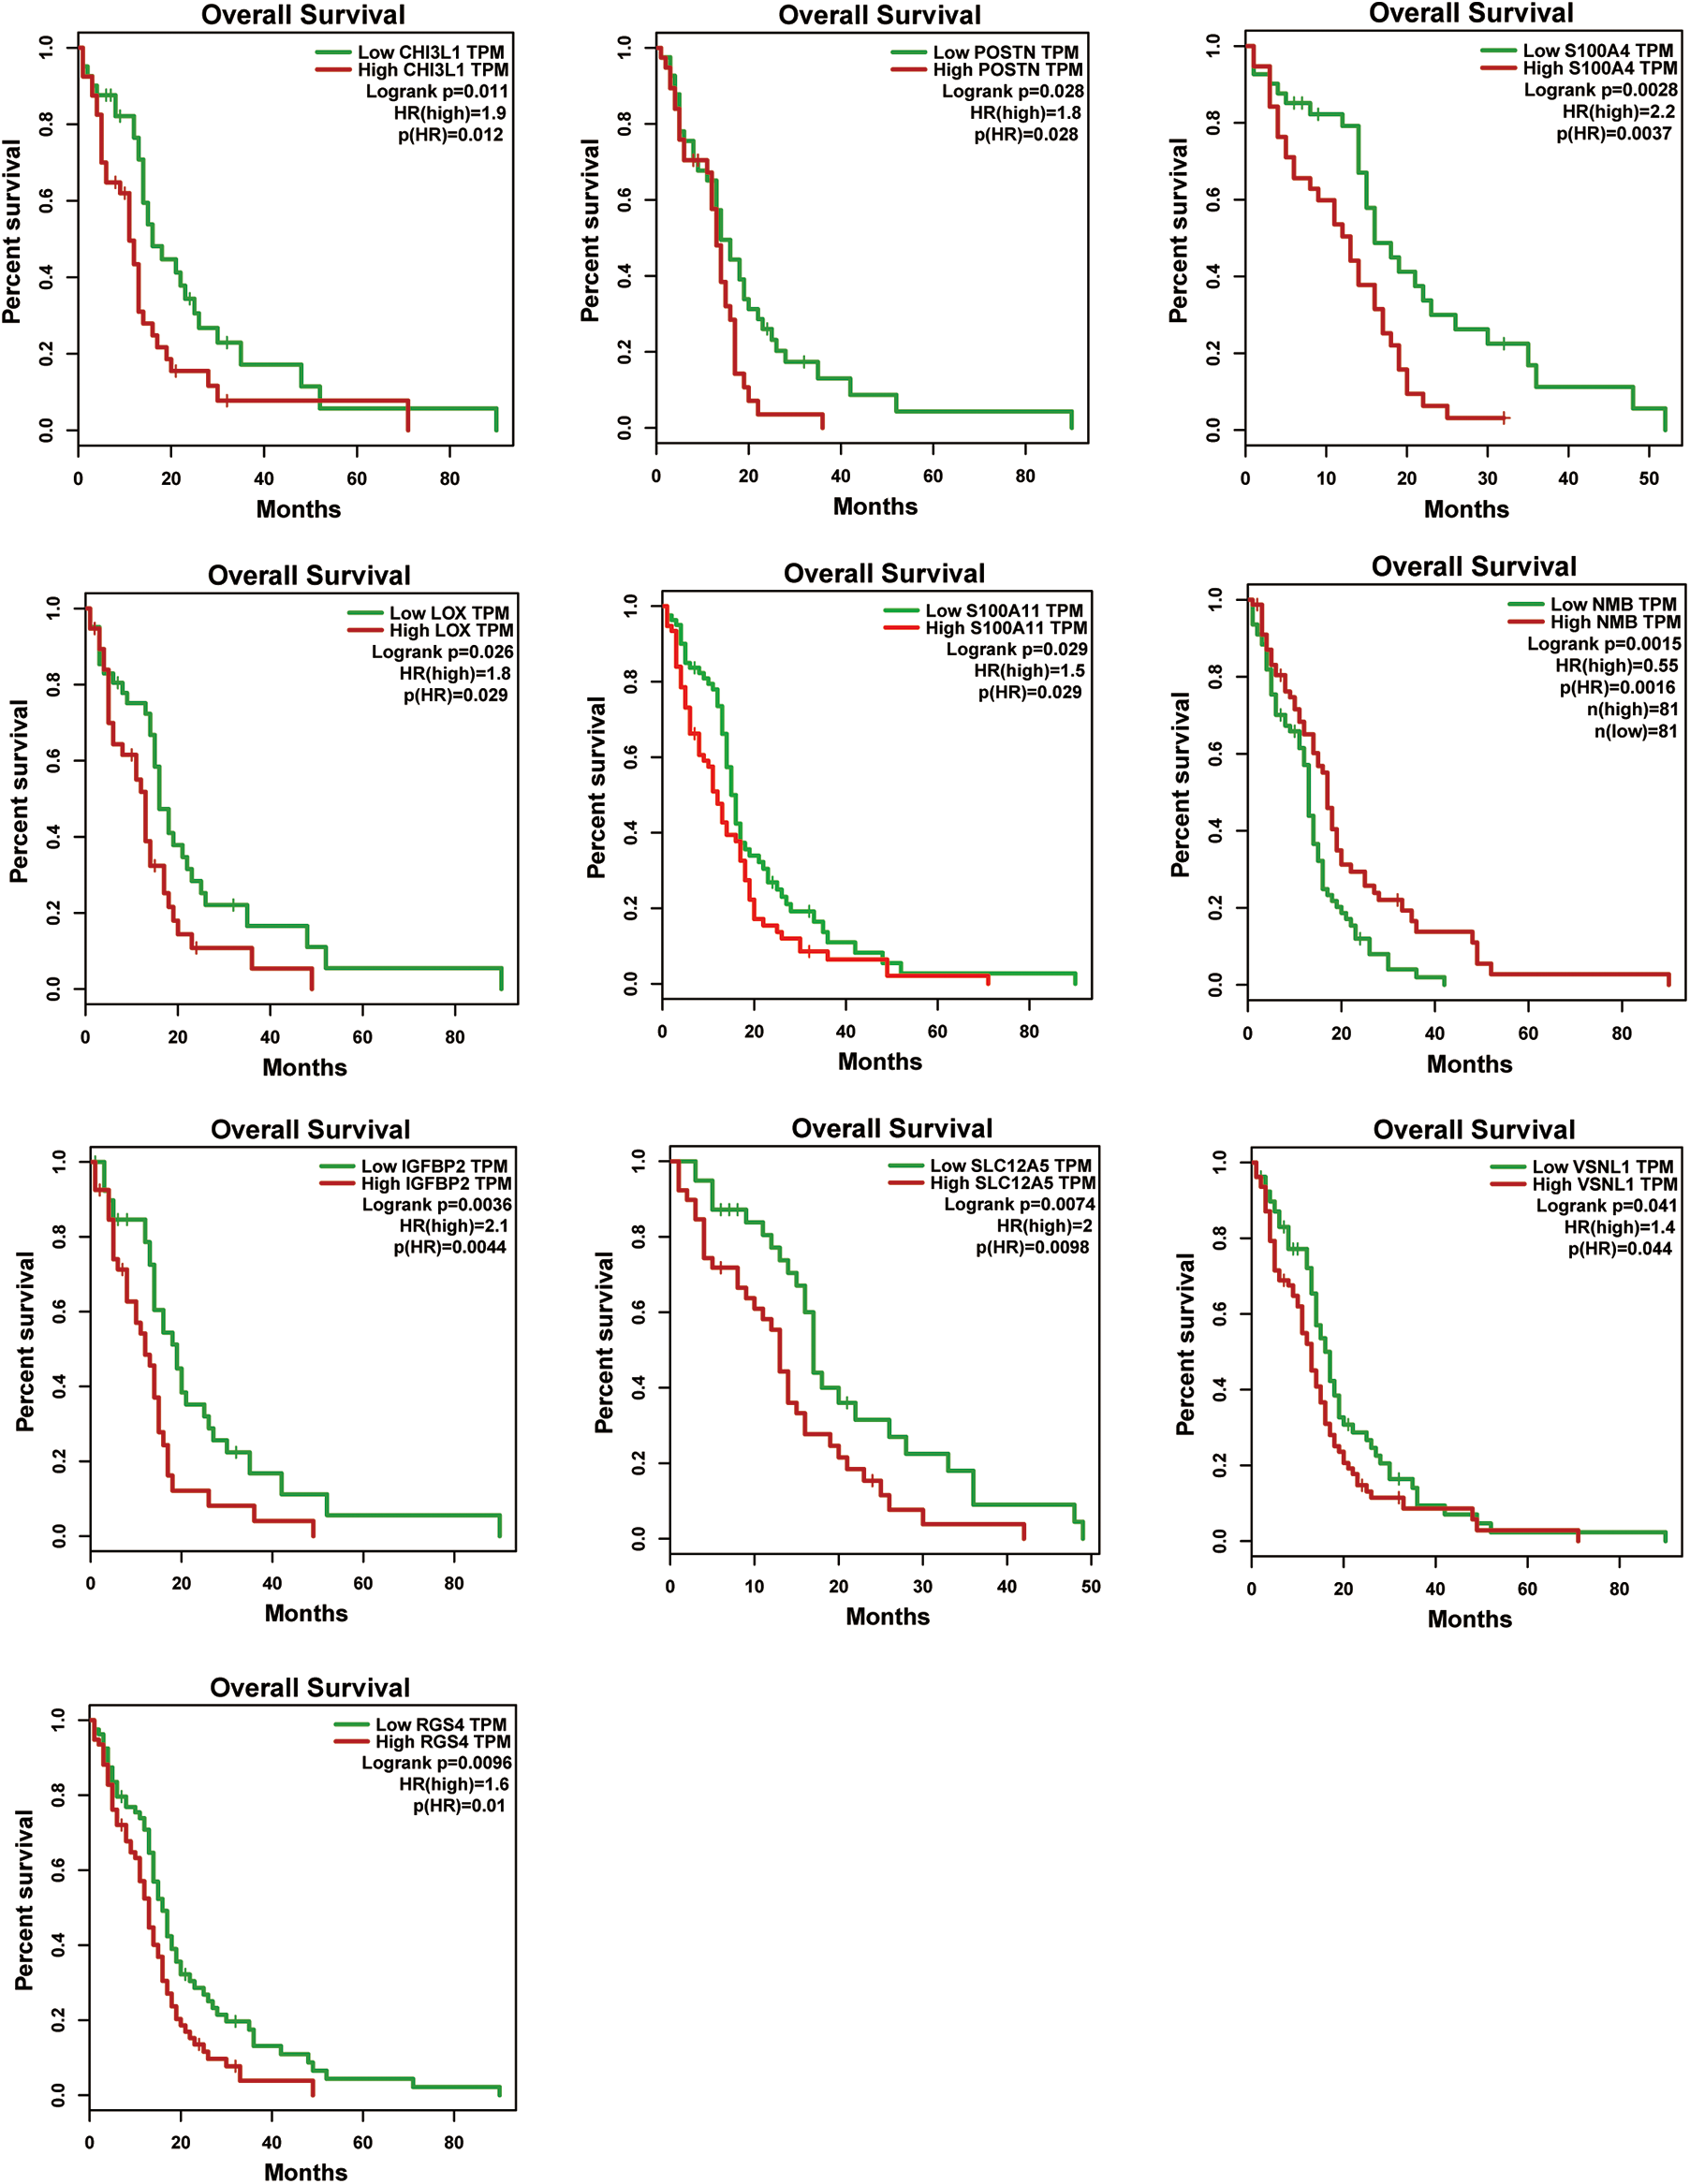
Identification of hub genes by prognosis analyses. The association between CHI3L1, POSTN, S100A4, LOX, S100A11, NMB, IGFBP2, SLC12A5, VSNL1, and RGS4 mRNA levels and overall survival in GBM patients. GBM: glioblastomas.
Additionally, we validated the relative mRNA expression of the 10 hub genes in GBM samples and control samples using GEPIA analysis. Compared to healthy brain tissues, CHI3L1, POSTN, S100A4, LOX, S100A11, NMB, and IGFBP2 mRNA levels were significantly higher, while SLC12A5, VSNL1, and RGS4 mRNA levels were significantly lower in GBM tissues (Fig. 7A). To validate the hub genes in cell lines, we also performed real-time quantitative PCR to validate the mRNA level in vitro (Fig. 7B). It was found that most mRNA levels of the survival related hub genes in tumor cells were consistent with the results in GEO and GEPIA database.
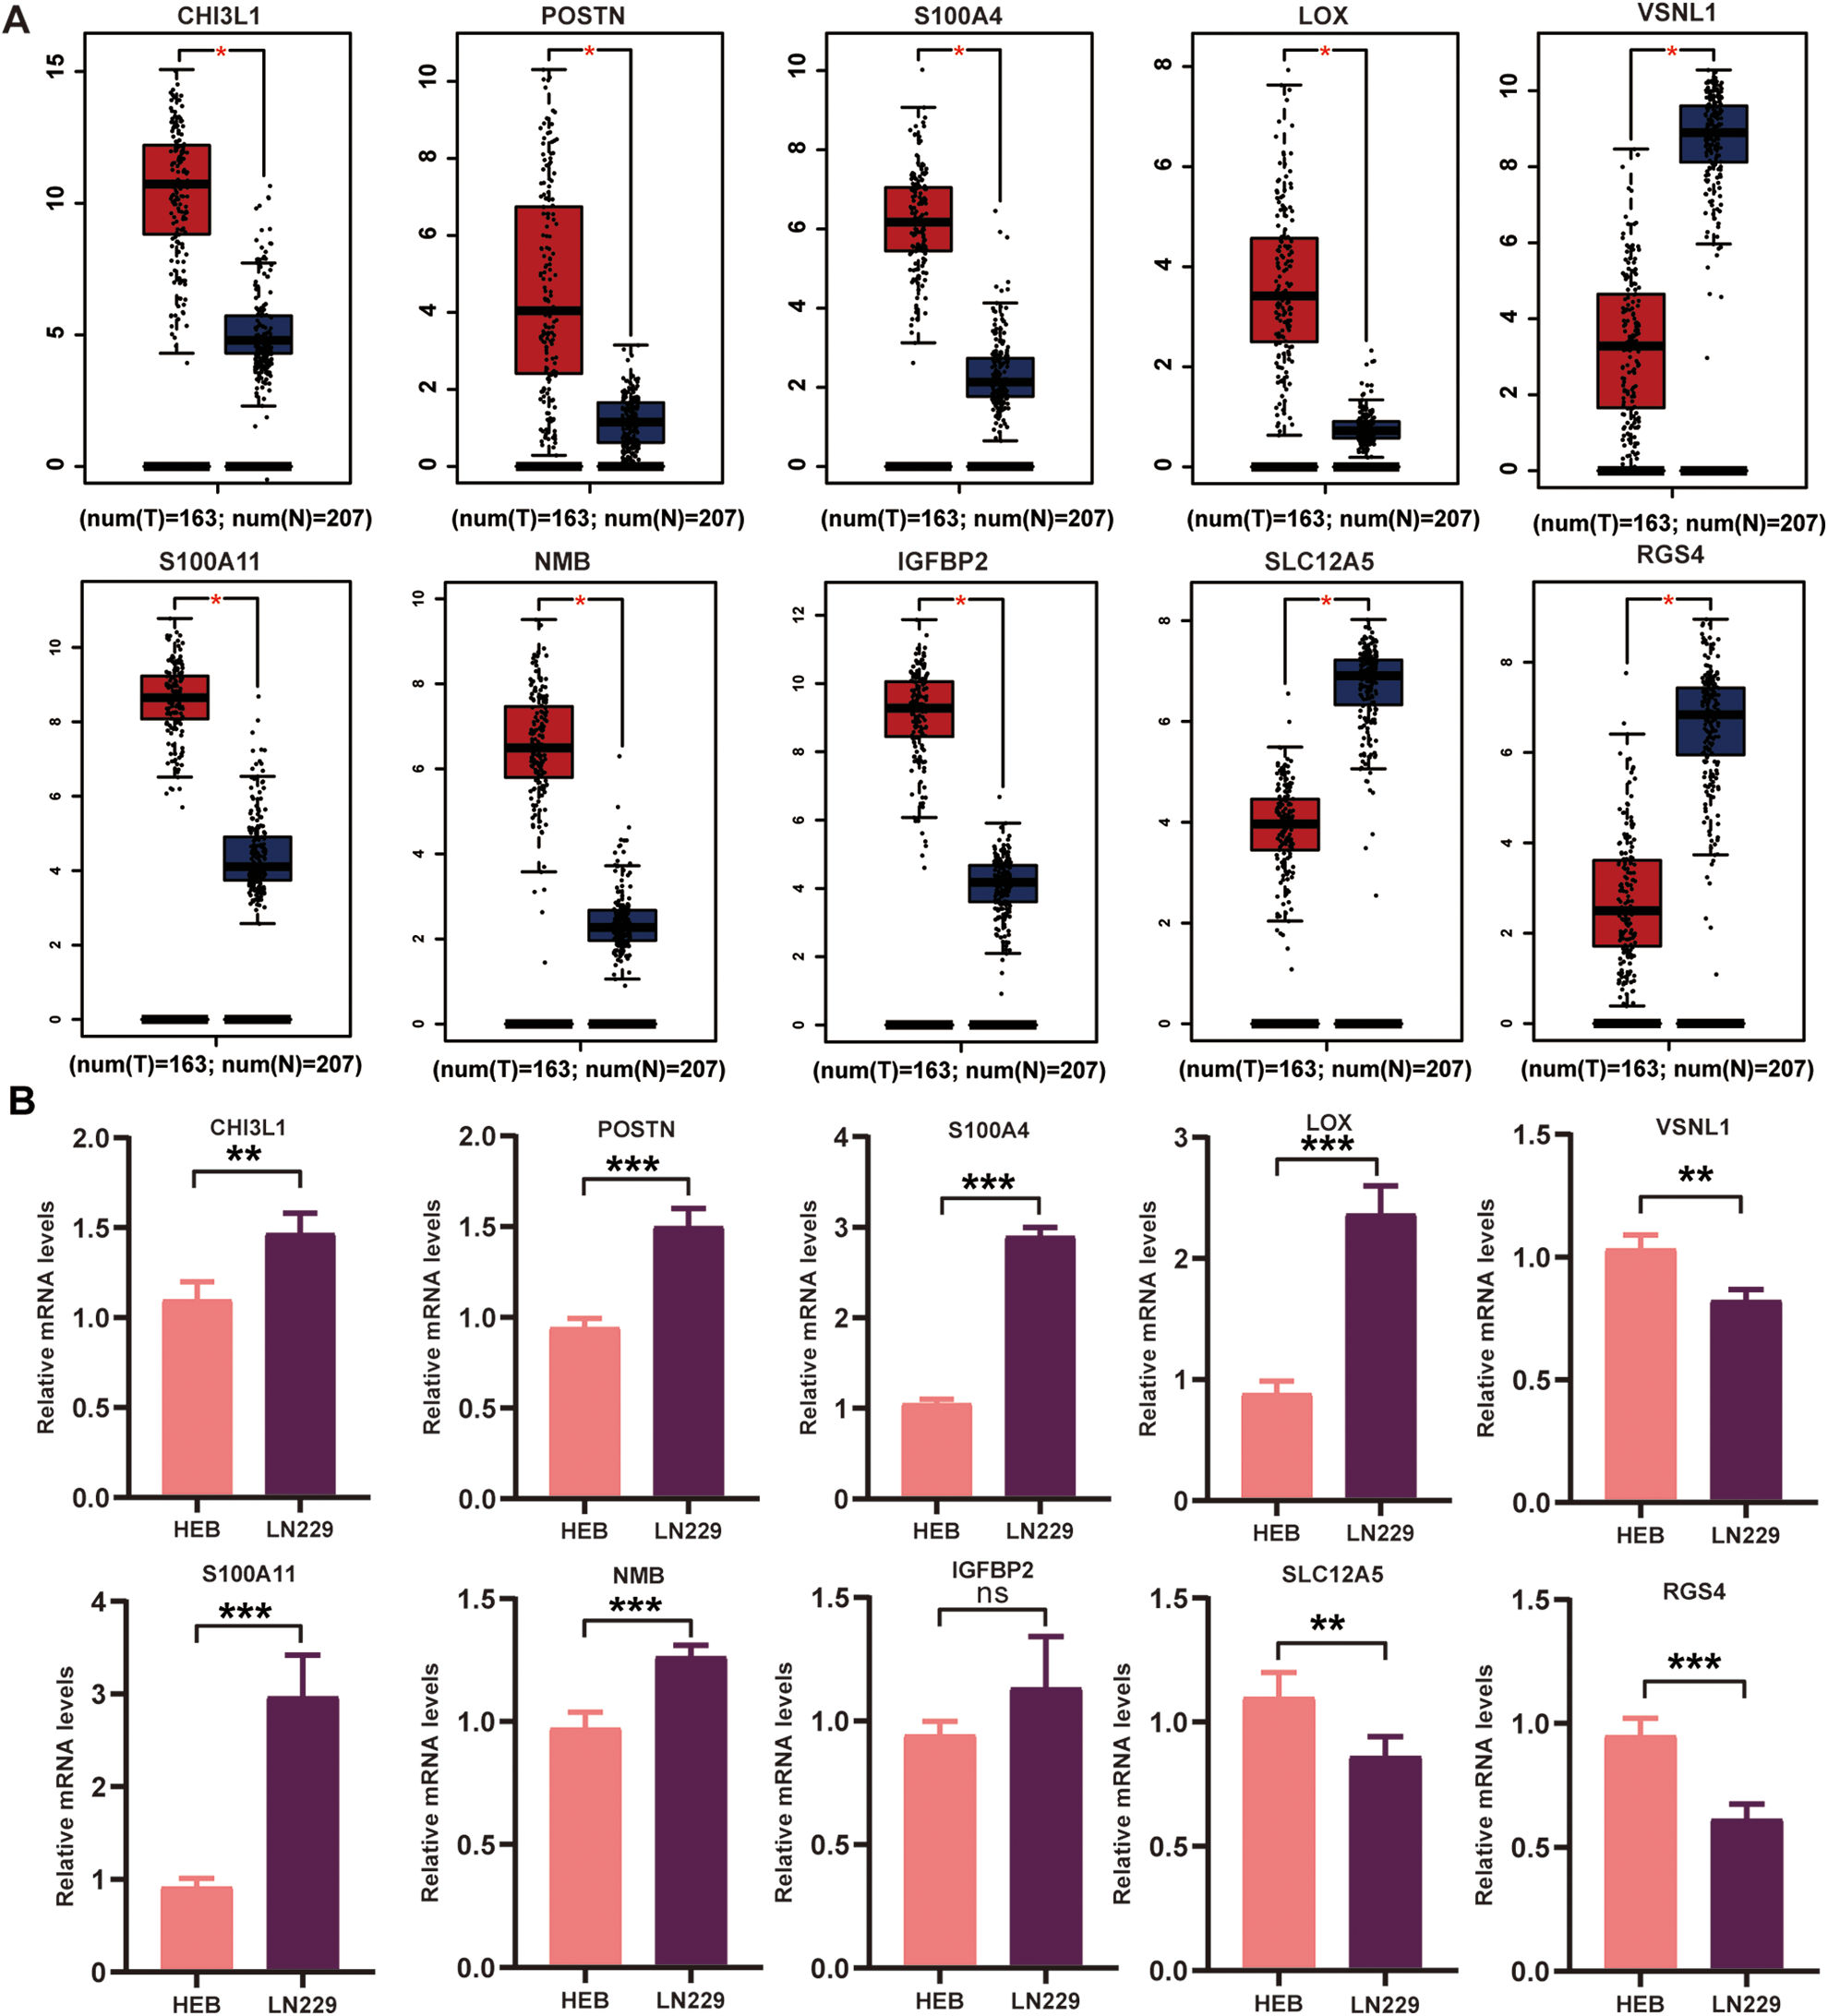
Validation of the mRNA levels of selected hub genes. CHI3L1, POSTN, S100A4, LOX, S100A11, NMB, IGFBP2, SLC12A5, VSNL1, and RGS4 mRNA expressions in GBM patients. (A) Validation in GEPIA database. (B) Validation in HEB cell lines (control) and LN229 cell lines (tumor). The data are expressed as the mean ± SD of three independent experiments (*P < 0.05, **P < 0.01, ***P < 0.001). GBM: glioblastomas; SD: standard deviation.
We analyzed the genetic alterations present in hub genes in GBM using cBioPortal. Among the datasets analyzed, the frequency of gene alterations, including mutations, fusions, amplifications, deep deletions, and multiple alterations ranged from 0% to 1%, with mutations, amplifications, and deep deletions being the most commonly observed alterations (Fig. 8A).
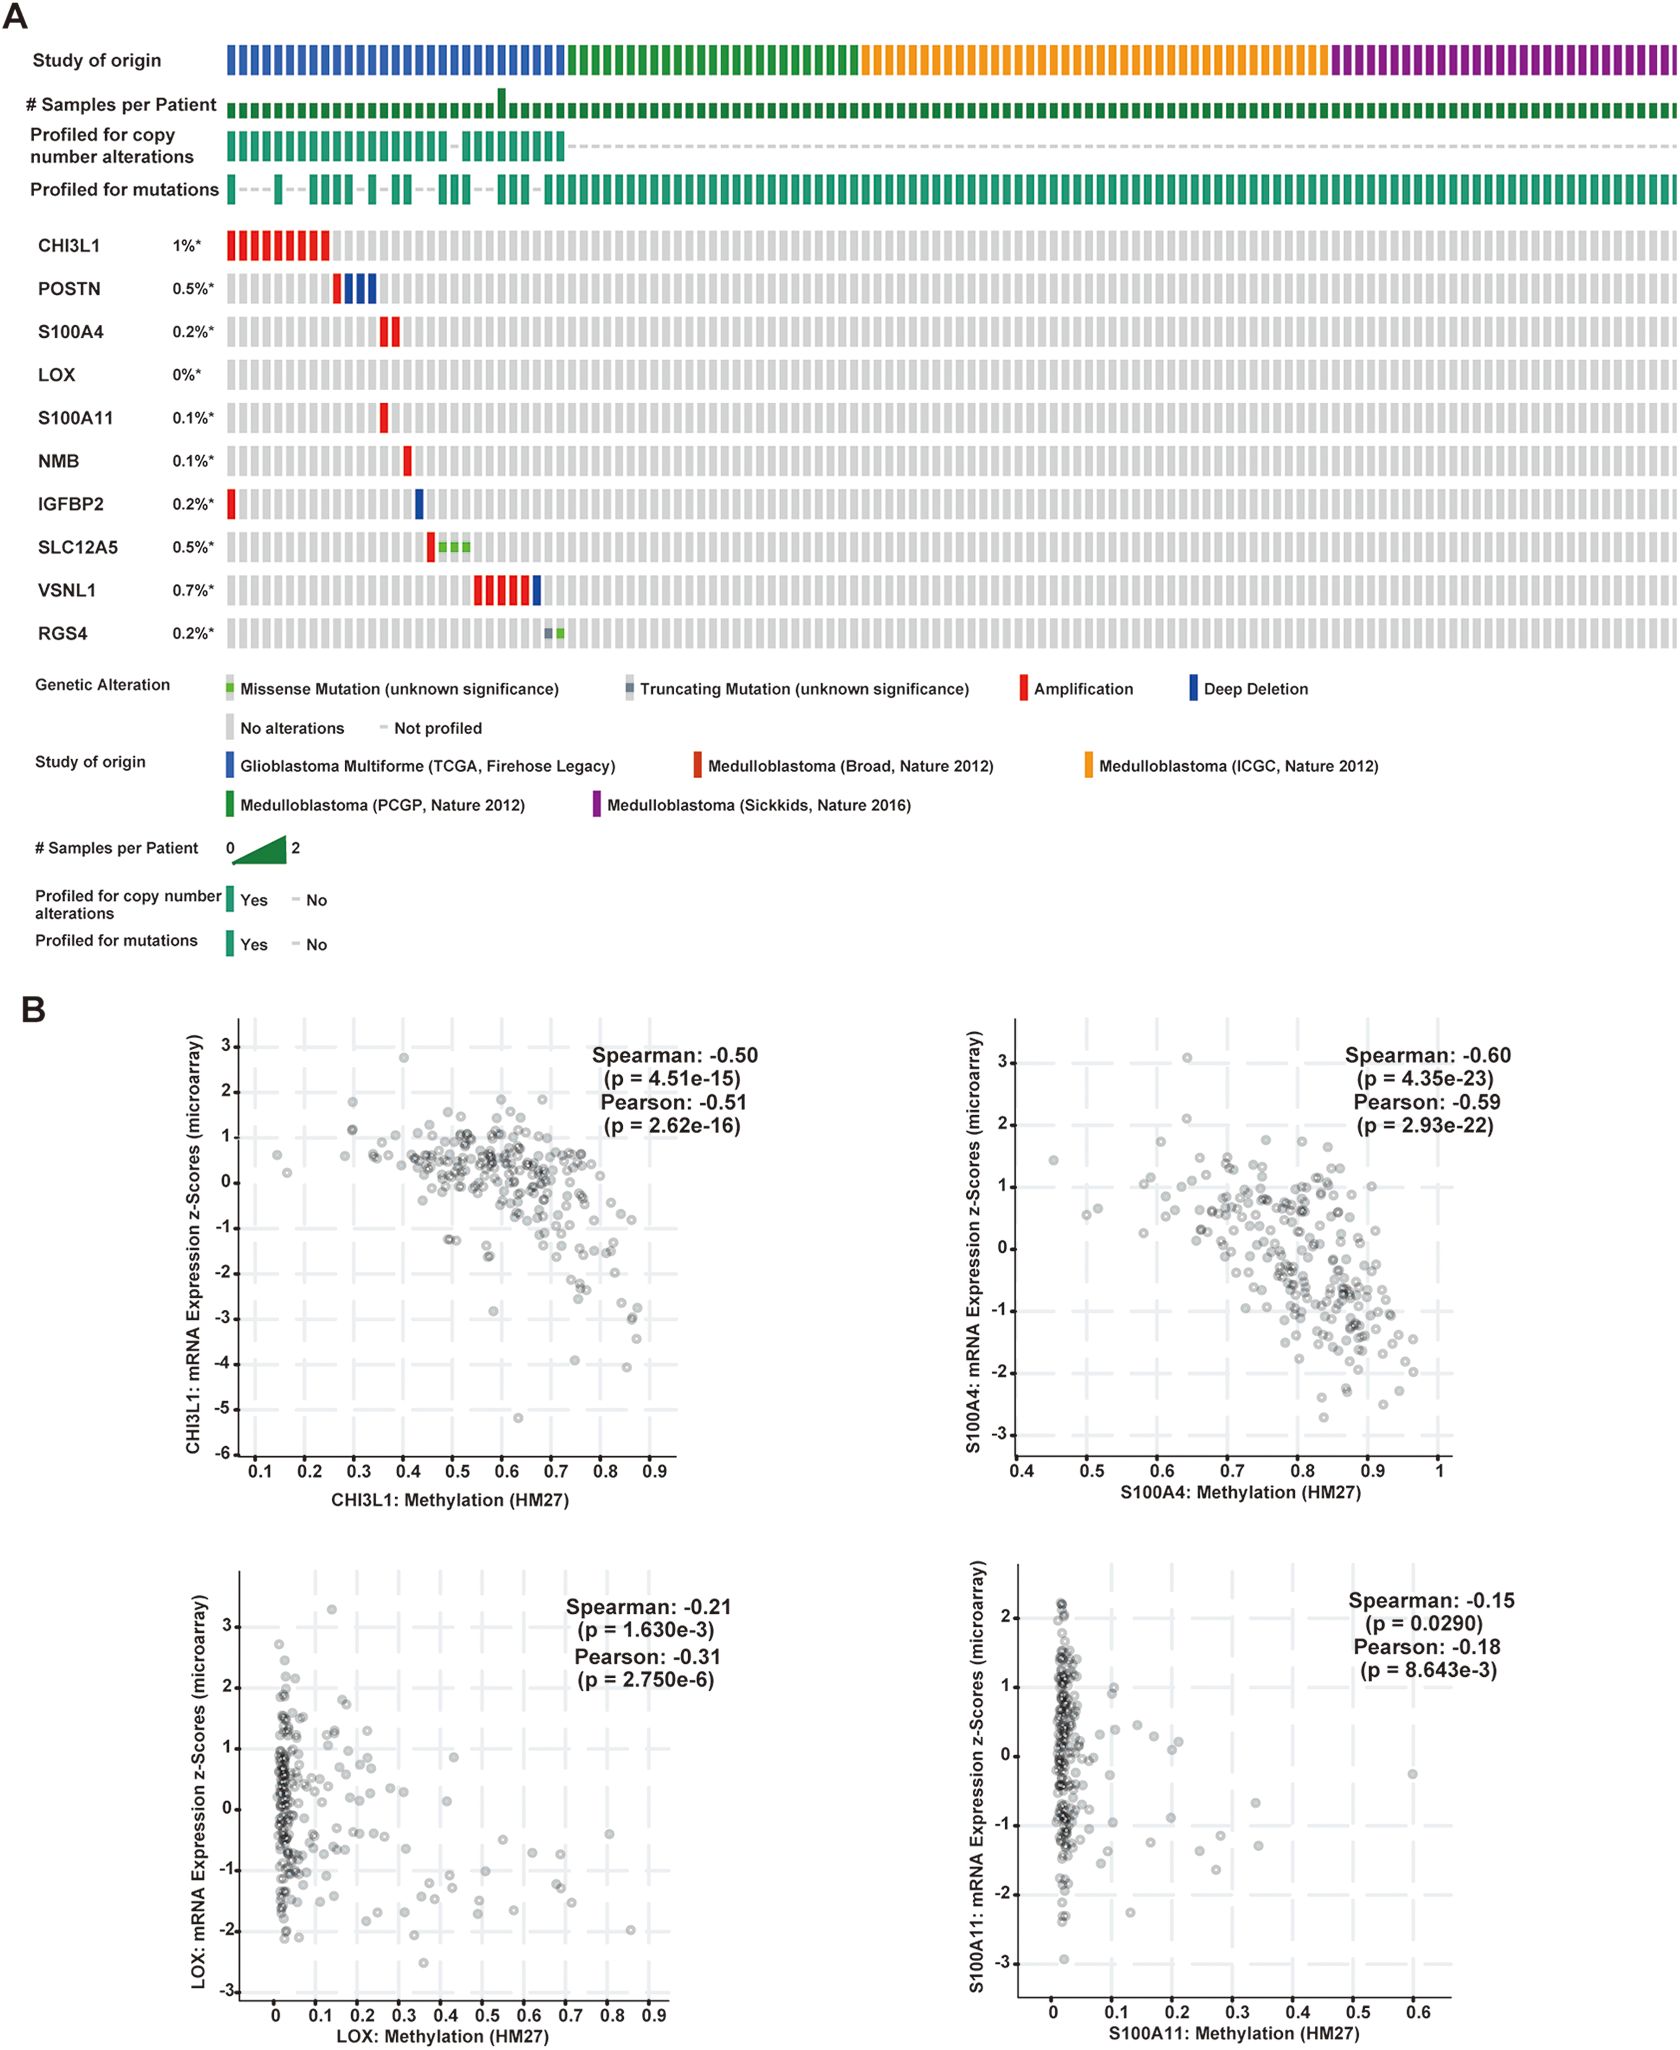
Genetic alteration of hub genes and the association between mRNA expression and DNA methylation. (A) A visual summary of alteration based on a query of the 10 hub genes. (B) Correlation between mRNA and methylation of CHI3L1, S100A4, LOX, and S100A11 in GBM patients. GBM: glioblastomas.
Following this, we verified the association between the methylation status and the expression of these hub genes (Fig. 8B). It was found that CHI3L1, S100A4, LOX, and S100A11 mRNA levels were negatively associated with their corresponding methylation status, and were selected the further analysis. IGFBP2, SLC12A5, VSNL1, and RGS4 mRNA levels were not significantly associated with the methylation status, and the data of POSTN and NMB were unavailable in the cBioPortal.
ROC Curve Analysis
We further investigated the diagnostic effectiveness of the four identified hub genes (CHI3L1, S100A4, LOX, and S100A11) using ROC curves. ROC curve analysis revealed that the area under the curve (AUC) was 0.8032 (95% confidence interval [CI], 0.68–0.9264) for CHI3L1, 0.8439 (95% CI, 0.734–0.9538) for S100A4, 0.9751 (95% CI, 0.9383–1.012) for LOX, and 0.8824 (95% CI, 0.7878–0.9769) for S100A11. These results suggested that four hypomethylated/upregulated genes (CHI3L1, S100A4, LOX, and S100A11) can serve as prognostic biomarkers for distinguishing GBM patients from healthy controls (Fig. 9).

ROC curves of hub genes for GBM diagnosis. The X-axis represents false-positive rate, presented as “1-Specificity.” The Y-axis represents true positive rate, presented as “Sensitivity”. GBM: glioblastomas; ROC: receiver-operator characteristic.
Discussion
DNA methylation can alter gene expression, and subsequently influence the development and progression of carcinomas, including GBM 16,17 . With advancements in high-throughput technologies, including microarray and ChIP array, it has become feasible to analyze the expression levels. Identifying novel biomarkers of GBM will contribute to improvement in diagnostic, treatment, and prognostic assessment of GBM patients. In the present study, 60 hypomethylated/upregulated and 110 hypermethylated/downregulated overlapping genes, which may be associated with molecular mechanisms underlying important pathways associated with tumor formation, were identified in GBM tissues compared to normal brain tissues from microarray datasets GSE50923, GSE50161, and GSE116520.
GO analysis indicated that the hypomethylation/high-expression genes were primarily enriched in functions associated with collagen fibril organization, extracellular space, and extracellular matrix structural constituent, indicating that hypermethylation primarily affected genes associated with the extracellular matrix. This finding is consistent with the fact that the extracellular matrix participates in pathophysiological process of GBM 18,19 . The hypermethylation/low-expression genes were primarily enriched in functions associated with chemical synaptic transmission, cell junction, and phospholipase binding, suggesting that GBM tumorigenesis may be associated with these biological functions. The KEGG pathway analysis of hypomethylation/high-expression genes indicated that these were enriched in functions associated with extracellular matrix (ECM)-receptor interaction, PI3K-Akt signaling pathway, microRNAs in cancer, protein digestion and absorption, and proteoglycans in cancer. The hypermethylation/low-expression genes were primarily enriched in functions associated with GABAergic synapse, morphine addiction, retrograde endocannabinoid signaling, nicotine addiction, and synaptic vesicle cycle. Among the enriched KEGG pathways, several terms play crucial roles in tumorigenesis. For instance, ECM-receptor interaction pathway is involved in the proliferation and invasion of cancer cell 20 . PI3K-Akt signaling pathway is one of the major cellular signaling pathways that play a significant role in basic intracellular functions and is a therapeutic target in human cancer 21 .
The PPI network constructed using identified MDEGs led to the identification of high-degree hub genes in the local network. Lastly, CHI3L1, POSTN, S100A4, LOX, S100A11, NMB, IGFBP2, SLC12A5, VSNL1, and RGS4 were identified as the key genes high connectivity degree through survival analysis. Increase in NMB mRNA was significantly associated with unfavorable survival, while elevated CHI3L1, POSTN, S100A4, LOX, S100A11, IGFBP2, SLC12A5, VSNL1, and RGS4 mRNA levels were associated with unfavorable OS in GBM patients. Moreover, we validated the expression of these hub genes in GBM and observed that the results were consistent with our previous microarray data. We also validated the mRNA levels of the hub genes using the GEPIA database and real-time quantitative PCR, and confirmed that the expression levels of most of the genes matched the results from GEO database. However, the expression of IGFBP2 was not completely consistent with GEO data. This may be due to the difference between in vivo and in vitro studies. Among the hub genes, CHI3L1, S100A4, LOX, and S100A11 mRNA levels correlated negatively with their corresponding methylation status and were selected for further analysis. However, the negatively association between methylation and matched mRNA levels of IGFBP2, SLC12A5, VSNL1, and RGS4 were not be observed. This may be due to DNA methylation is not the main mechanism of regulation of these gene’s expression. It is widely acknowledged that epigenetic regulation is involved in tumor-related gene expression including transcriptional regulation (DNA methylation, histone modification, chromatin remodeling, and X chromosome inactivation) and post-transcriptional regulation (microRNA or long noncoding RNA). These genes may be regulated by other epigenetic regulations. Furthermore, we also observed that CHI3L1, S100A4, LOX, and S100A11 methylation are potential diagnostic probes for GBM detection that are highly sensitive and specific.
CHI3L1, also known as YKL-40 or HC-gp39, plays a role in cell proliferation, differentiation, apoptosis, angiogenesis, inflammation, and extracellular tissue remodeling 22 . Numerous inflammatory and malignant diseases possibly contribute to the serum levels of CHI3L1. It is also one of the significantly induced genes in GBM 23,24 . However, the exact biological role of CHI3L1 in the GBM pathogenesis has not been elucidated yet. Hormigo’s study demonstrated that it can be used as a predictor of survival of GBM patients 25 . However, there are data that indicate that CHI3L1 has no significant impact on survival of GBM patients 26,27 . However, majority of these studies had a small sample size. In our study, we observed that mRNA expression of CHI3L1 was significantly higher in GBM tissues, and reduced CHI3L1 mRNA levels were associated with favorable OS. Moreover, ROC curve analysis indicated that it could serve as a valuable biomarker for distinguishing patients with GBM from healthy controls.
S100A4 is a gene encoding small calcium-binding proteins that interact with other proteins 28 . A growing body of evidence indicates that 100A4 plays a significant role in the progression and metastasis of various types of tumors, including breast cancer, colorectal cancer, cervical cancer, and lung cancer 29 –32 . S100A4 downregulation can suppress in vitro and in vivo GBM tumor progression, suggesting that S100A4 may be an effective therapeutic target 33 . S100A4 has been regarded as a biomarker and regulator of glioma stem cells that is critical for mesenchymal transition in GBM 34 . However, there are limited studies that have assessed the diagnostic and prognostic value of S100A4. In the current study, we observed that 100A4 could function as a highly specific and sensitive biomarker for GBM diagnosis and predict poor survival.
LOX is associated with crucial biological processes, including cell motility, cell signaling, and gene regulation. It is a secretory amine oxidase that plays a vital role in modifying the primary tumor microenvironment by cross-linking collagen and elastin in the ECM 35 . Previous studies have revealed that the mRNA expression of LOX was significantly higher in GBM patients, and increased expression and activity of LOX had positive correlation with the malignant grade of astrocytomas 36 . Consistent with the findings of this study, we observed that the mRNA expression of LOX was significantly higher in GBM tissues. In addition, we also observed that the increased LOX mRNA levels associated with unfavorable OS and LOX have diagnostic value in GBM treatment.
S100A11, a lesser-known protein of the S100 family, is upregulated in various cancers, including lung cancer, bladder cancer, and liver cancer 37 –39 . Previous studies have demonstrated that S100A11 may enhance proliferation and invasion of gastric cancer 40 . To date, the significance of the role of S100A11 in GBM remains undetermined. To further investigate the DNA methylation-based diagnosis and prognosis of S100A11, we conducted ROC curve analysis and survival analysis. The results indicated that S100A11 could function as a highly specific and sensitive biomarker for GBM diagnosis, and lower mRNA expression of S100A11 was associated with better survival, suggesting it could be used as a biomarker for GBM patients in the future.
In conclusion, we have developed 10 MDEGs expression that accurately predict survival and prognosis of GBM patients. Furthermore, CHI3L1, S100A4, LOX, and S100A11 provide helpful information for the selection of therapeutic strategies.
Supplemental Material
Supplemental Material, Table_S1 - DNA Methylation-based Diagnostic and Prognostic Biomarkers for Glioblastoma
Supplemental Material, Table_S1 for DNA Methylation-based Diagnostic and Prognostic Biomarkers for Glioblastoma by Yunliang Tang, Cheng Qing, Jiao Wang and Zhenguo Zeng in Cell Transplantation
Supplemental Material
Supplemental Material, Table_S2 - DNA Methylation-based Diagnostic and Prognostic Biomarkers for Glioblastoma
Supplemental Material, Table_S2 for DNA Methylation-based Diagnostic and Prognostic Biomarkers for Glioblastoma by Yunliang Tang, Cheng Qing, Jiao Wang and Zhenguo Zeng in Cell Transplantation
Supplemental Material
Supplemental Material, Table_S3 - DNA Methylation-based Diagnostic and Prognostic Biomarkers for Glioblastoma
Supplemental Material, Table_S3 for DNA Methylation-based Diagnostic and Prognostic Biomarkers for Glioblastoma by Yunliang Tang, Cheng Qing, Jiao Wang and Zhenguo Zeng in Cell Transplantation
Supplemental Material
Supplemental Material, Table_S4 - DNA Methylation-based Diagnostic and Prognostic Biomarkers for Glioblastoma
Supplemental Material, Table_S4 for DNA Methylation-based Diagnostic and Prognostic Biomarkers for Glioblastoma by Yunliang Tang, Cheng Qing, Jiao Wang and Zhenguo Zeng in Cell Transplantation
Footnotes
Data Availability Statement
Ethical Approval
Ethical approval is not applicable for this article.
Statement of Human and Animal Rights
This article does not contain any studies with human or animal subjects.
Statement of Informed Consent
There are no human subjects in this article and informed consent is not applicable.
Declaration of Conflicting Interests
The author(s) declared no potential conflicts of interest with respect to the research, authorship, and/or publication of this article.
Funding
The author(s) disclosed receipt of the following financial support for the research, authorship, and/or publication of this article: This work was supported by the National Natural Science Foundation of China (Nos. 81760351 and 81460015).
Supplemental Material
Supplemental Material for this article is available online.
References
Supplementary Material
Please find the following supplemental material available below.
For Open Access articles published under a Creative Commons License, all supplemental material carries the same license as the article it is associated with.
For non-Open Access articles published, all supplemental material carries a non-exclusive license, and permission requests for re-use of supplemental material or any part of supplemental material shall be sent directly to the copyright owner as specified in the copyright notice associated with the article.