
Abstract
This study investigated the safety of a novel cell-labeling technology with mKATE and Renilla reniformis luciferase (mKATE-renLUC) and assessed the efficacy on tracking implanted human placental stromal cells (PSC) in an erectile dysfunction (ED) animal model. Human PSC were labeled with mKATE-renLUC using a lentivirus. Cell viability, apoptosis, proliferation, migration, surface marker expression and differentiation potential of the labeled PSC were evaluated and compared with non-labeled PSC. The paracrine profile of labeled cells was examined using an angiogenesis protein array. The brightness and duration of labeled cells with different densities were evaluated. An ED rat model was established and labeled PSC were injected into cavernosal tissue of the penis. The migration and distribution of transplanted PSC were monitored using an IVIS imaging system in real time. Implanted PSC were identified in isolated tissues via detection of mKATE fluorescence. The cell viability, morphology, proliferation, migration, surface marker expression and differentiation potential of mKATE-renLUC-labeled PSC were similar to those of non-labeled cells in vitro (no statistical difference p>0.05). Similar expressions of trophic factors were found between labeled and non-labeled PSC. The migration and distribution of PSC expressing renLUC were tracked in vivo using IVIS imaging system. mKATE-positive PSC were detected in penile, kidney, prostate and hepatic tissues using histological methods. This labeling technology provides a safe and effective cell-tracking approach with a brighter fluorophore and codon-optimized luciferase.
Introduction
Despite great progress in cell therapy for erectile dysfunction, the exact mechanism remains unclear. Previous studies 1,2 have demonstrated that cell therapy significantly improved erectile function; however, few cells could be found in the injected site of penile cavernous tissue 1 week after exogenous cell implantation 3 . In contrast, the myocardial ischemia literature suggests 0.1%–10% of stem cells engrafted into the myocardium were observed a few weeks after transplantation 4 . In the treatment of erectile dysfunction, the ultimate site of intracavernosally injected cells is currently unknown. Therefore, it is critical to determine the number of cells and the duration of survival of the implanted cells after intra-cavernous injection of cells for the treatment of erectile dysfunction. Monitoring the fate and function of implanted cells could help to develop an optimal cell therapy for erectile dysfunction.
Bioluminescence is a natural light source produced by the catalyzed reaction of luciferase and its substrate 5 . Bioluminescence images have become increasingly used for biomedical research in addition to fluorescence and chemiluminescence detection strategies. Luciferase enzymes isolated from different animal species show inherent variability in light emission, allowing two or more luciferase enzymes to be used in combination for multiplex analyses, including in vivo imaging, cell viability and single and dual-spectral luciferase reporter assays. Bioluminescence images provide a method for the long-term non-invasive monitoring of implanted cells. However, since the most commonly used firefly luciferase generates a relatively low bioluminescent signal, these applications face challenges in the detection of low numbers of luciferase-expressing cells in vivo. In addition, this diminished signal makes it difficult to detect expressing cells located in deep tissues, which impedes its application of cell tracking in preclinical research of cell therapy 6 . To improve luciferase brightness, a new codon-optimized luciferase from Renilla reniformis (renLUC) has been developed with a red-shifted emission peak wavelength of 617 nm (as compared with 550 nm [Luc] and 590 nm [Luc2]) and approximately 100-fold higher signal intensity compared with firefly luciferases 7 .
Fluorescence is another type of emitted light commonly used in biological research and is the product of a fluorophore, a molecule that absorbs the energy from a light source and then emits light at a different wavelength. mKATE, a highly bright far-red fluorescent protein variant, is a superior fluorescent tag for imaging in living tissues 8 .
Therefore, we combined the two cellular tracking methods to monitor the fate of the implanted cells in a rodent model of erectile dysfunction by bioluminescence imaging and in situ fluorescence for detection of the grafted cells. To clarify the fate and contribution of the implanted cells in vivo, it is necessary to study in vivo cell survival, proliferation, migration, paracrine effect and life-span of mKATE-renLUC-expressing human placental stromal cells (PSC) before implantation. The goal of this study was to investigate the safety of a novel cell-labeling technology combining mKATE and a new codon-optimized luciferase (renLUC) using a lentivirus vector, as well as the efficacy on tracking implanted PSC in an animal erectile dysfunction model.
Materials and Methods
Lentivirus Infection
Human PSC at passage 8 were acquired from the Regenerative Medicine Clinical Center 9 (Wake Forest Institute for Regenerative Medicine, Wake Forest School of Medicine, Winston-Salem, NC). PSC were plated at 50,000 cells/well in a 6-well plate and cultured with Placental complete growth medium containing 65% Alpha MEM medium, 17% Aminomax Basal medium, 2% Aminomax supplement, 1% Glutamax (Thermo Fisher Scientific, Waltham, MA, USA) and 15% fetal bovine serum (Sigma-Aldrich, Saint Louis, MO, USA) at 37°C and 5% CO2. The lentivirus encoding mKATE and renLUC was established previously by our colleague in Dr. Frank Marini 10 . When reaching approximately 60% confluence, cells were exposed to 2 mL of viral supernatant at a titer of 1×10⁵ TU/mL in each well (Multiplicity of infection: 1 TU/cell), and then the well-plates were centrifuged for 90 min at 1000×g. After the spin inoculation, the cells were incubated at 37°C, 5% CO2 for another 72 h without changing medium. The mKATE-renLUC-labeled cells were observed under a fluorescent microscope. The cells were then sorted by a BD FACS Aria Sorter (BD Sciences, San Diego, CA, USA) to select the mKATE-positive cell population (>95% enrichment) for expansion and use in the in vitro and in vivo experiments. The changes in cell morphologies (i.e., size, shape and contents of cells) of both labeled and non-labeled cells were analyzed using bright light microscopy.
Fluorescent Imaging In Vitro
The mKATE-renLUC-labeled PSC at different passages were seeded into a 60 mm culture plate and cultured to reach 70% confluence. Culture medium was removed and fresh medium with 10 μg/mL Hoechst 33258 (Sigma-Aldrich) was added. After incubation for 30 min, cells were observed using a fluorescent microscope (Zeiss, Oberkochen, Germany). The percentages of mKATE-positive cells were calculated manually.
Bioluminescence Imaging In Vitro
In vitro bioluminescence imaging was performed on mKATE-renLUC-expressing PSC in 6-well plates using a Xenogen IVIS 200 bioluminescence/fluorescence optical imaging system (Caliper Life Sciences, Hopkinton, MA, USA) at various time points (5, 15, 30, 60, 120 and 180 min) and different cell densities (0.3×10⁵, 1×10⁵ and 3×10⁵ per well) to determine the optimal cell-labeling condition. To each well 3 μL of 50 µg/mL Coelenterazine-h (Sigma-Aldrich) was added 5 min prior to imaging. The density of bioluminescent signal in wells over time was evaluated by measuring the average pixel density using the built-in software.
Surface Marker Expression
CD markers of PSC were identified before and after transfection. PSC were detached, centrifuged, washed and resuspended in stain buffer containing saturating concentrations (1:100 dilution) of the following conjugated mouse IgG1,κ anti-human monoclonal antibodies: CD45-PE, CD73-PE and CD90-PE (BD Biosciences, San Jose, CA, USA) for 1 h at 4°C. Cell suspensions were washed twice and resuspended in stain buffer for analysis with BD Influx™ flow cytometer (BD Biosciences, San Diego, CA, USA) using the inbuilt Cell Quest ProTM software.
Differentiation Potential
PSC were seeded in 12-well plates, grown to 50–60% confluence, and incubated in the StemPro™ osteogenesis differentiation medium, adipogenesis differentiation medium and chondrogenesis differentiation medium (Thermo Fisher Scientific), respectively. After 14–21 days induction, cells were fixed using 4% paraformaldehyde for 30 min. For adipogenic differentiation, cells were stained with 2% Oil Red O for 10 min. For osteogenic differentiation, cells were stained with 1% Alizarin Red S for 3 min. For chondrogenic differentiation, cells were stained with 1% Alcian Blue solution prepared in 0.1 N HCl for 30 min. The images were visualized under a bright-field microscope.
Cell Viability
The influence of transfection on PSC viability was assessed by trypan blue dye exclusion. Labeled PSC and non-labeled cells as control were seeded in 60 mm culture dishes and collected after a 3-day culture. The relative number of viable cells was calculated after 0.4% trypan blue dye (Gibco, Gaithersburg, MD, USA) staining. The cells stained blue were considered as non-viable cells. The assays were performed in triplicate.
Apoptosis Analysis
Cell apoptosis was analyzed using Hoechst 33258 staining. Apoptotic cells demonstrate increased uptake of Hoechst 33258, and show strong fluorescence as described previously 11 . Viable non-apoptotic cells do not uptake Hoechst 33258 and show only weak fluorescence. Labeled and non-labeled PSC were stained with 10 μg/mL Hoechst 33258 in culture medium. Apoptotic cells were examined and recorded using a fluorescence microscope. The results were repeated with at least in three independent batches of experiments. The average percentages of apoptotic cells were calculated by counting apparent apoptotic cells in at least 10 random fields at 200× magnification for each category. The assays were performed in triplicate.
Cell Proliferation
Cell proliferation was evaluated in labeled and non-labeled cells using the cell counting kit-8 (CCK-8, Dojindo, Rockville, MD, USA) according to the manufacturer’s instructions. Briefly, cells were seeded into 96-well plate (1×10³ cells/well). At days 0, 1, 2, 3, 4, 5 and 7, original culture medium was removed, and 100 μL fresh medium plus 10 μL CCK-8 solution was added into each well. The plate was incubated for 2 h, and the absorbance at 450 nm was measured with a microplate reader (Thermo Fisher Scientific). Each experiment was performed using eight wells per experimental condition. The assays were performed in triplicate.
Cell Migration
To test the impact of duel labeling technology on migration of PSC, in vitro wounding/migration was performed. Briefly, PSC were seeded in 6-well plates, and a scratch was made with sterile micro-pipette tips when the cells reached 70–80% confluence. After 8 and 24 h, the wound healing status at approximately the same locations was recorded under a bright-field microscope. Each assay condition was performed in triplicate. The areas of cell-free regions were acquired and calculated using Photoshop CS6 software at different time points. The assays were performed in triplicate.
Analysis of Trophic Factor Secretion
To compare angiogenic trophic factors secreted by PSC before and after viral transfection, labeled and non-labeled PSC were seeded into 100 mm culture plates and incubated with serum-free culture medium under normal condition (5% CO2, 37°C) for 24 h after reaching 70% confluence. Conditioned media derived from labeled and non-labeled PSC were analyzed with human angiogenesis array kit (R&D Systems, Minneapolis, MN, USA) according to the manufacturer’s instructions. Briefly, the membrane containing 55 angiogenesis-related antibodies were blocked with bovine serum albumin for 1 h on a rocking platform at room temperature. The membrane was incubated with conditioned media, along with detection antibody cocktail overnight on a rocking platform at 4°C. The membrane was incubated with streptavidin horse radish peroxidase conjugate antibody and detected using an X-ray machine (Fujifilm Las 3000, Fujifilm Global, Tokyo, Japan) following exposure to chemiluminescent reagents. Pixel density was analyzed by Image J software (NIH, Bethesda, MD, USA) and was normalized to the mean pixel density from reference spots on the membrane.
Animal Model
Investigation of in vivo cell survival and distribution of the labeling PSC was performed in an animal model of erectile dysfunction. After being anesthetized with 2.5% isoflurane, the rat was placed on a heating pad to control body temperature and eye lubricant applied. A midline incision was made in the skin of the lower abdomen. The cavernous nerve and major pelvic ganglion (MPG) were identified and isolated on bilateral prostate dorsal leaves. After 4 min of local lidocaine (7 mg/kg) anesthetic, the nerves were crushed for 1 min per side at approximately 5 mm from their origin in the MPG. Then an incision was made over the perineal area to expose the internal pudendal bundles. Both internal pudendal bundles were isolated and ligated with 5-0 non-absorbable suture. The skin incisions were closed with an interrupted 3-0 non-absorbable suture and clips. A total of 2.5×10⁶ mKATE-renLUC PSC were injected to penile cavernous tissue in a total volume of 200 μL phosphate-buffered saline. As the control, other rats received non-labeled PSC transplantation and were imaged at the same time points as animals that received the labeled cells.
IVIS Imaging In Vivo
Coelenterazine-h was used as substrate at a dose of 200 µg/kg. The IVIS images were captured beginning 5 min after intraperitoneal substrate administration. Exposure times ranged from 20 sec to 1 min. The gray scale photograph and pseudocolor luminescent images were superimposed for identification of the location of any bioluminescent signal of the labeled cells. Optical images were displayed and analyzed with IVIS Living Image software packages. Regions of interest (ROI) were drawn to assess relative signal intensity emitted. Bioluminescent signal was expressed as photon intensity, in units of photons/second (p/s) within the ROI.
Immunofluorescent Staining
Animals were euthanized by CO2 inhalation and bilateral thoracotomy. The penis, kidney, liver, lung, heart, skin, prostate, testis and spleen were excised, embedded with Optimal Cutting Temperature compound (Leica, Wetzlar, Germany) and immediately frozen by liquid nitrogen. To detect labeled cells histologically, sections from these tissues were cut using a cryostat (Leica) and incubated with primary antibody for mKATE (1:500 rabbit polyclonal Anti-tRFP antibody, #AB233, Evrogen, Farmingdale, NY, USA) overnight at 4°C. Sections were then incubated with a secondary antibody (1:200 Texas Red goat anti-rabbit IgG, Life Technologies, Grand Island, NY, USA) for 1 h at room temperature. Slides were counter-stained with DAPI (Sigma-Aldrich) and mounted with Dako Fluorescent Mounting Medium (Dako, Carpinteria, CA, USA). Slides were visualized with the Leica DM4000B fluorescent microscope to determine presence of mKATE-labeled cells. The relative number of transplanted cells in the different tissues was compared by calculating red pixel region using Image J software.
Statistical Analysis
The data were analyzed statistically with one-way ANOVA followed by Tukey's post-hoc test or t-test using SPSS 22.0 software (IBM SPSS, Chicago, IL, USA). A value of p<0.05 was considered statistically significant.
Results
Cell Morphology, Proliferation, Viability and Apoptosis
The size, shape and contents of PSC did not change after lentivirus transfection and cell sorting. Both mKATE-renLUC-labeled and non-labeled PSC showed the fibroblastic appearance and epithelioid shapes (Fig. 1A). After labeling with mKATE-renLUC, PSC showed a satisfactory rate of viable cells (>95%) when cultured in dishes. No difference in percentages of dead or apoptotic cells between mKATE-renLUC-labeled and non-labeled PSC was noted (p>0.05) (Figs. 1B and C). mKATE-renLUC-labeled PSC displayed a similar proliferation curve with non-labeled PSC (Fig. 1D).

The morphology, viability, proliferation, paracrine profile and migration of mKATE-renLUC labeled and non-labeled placental stromal cells. (A) Morphology. Bar 50 µm. The average cell length and width did not change after viral transfection. (B) Cell viability. (C) Cell apoptosis. (D) Proliferation curves. (E) Paracrine profile of angiogenic trophic factors. (F) Migration abilities. Bar = 50 µm.
Paracrine Profile and Cell Migration Ability
The result of antibody array showed labeled and non-labeled PSC had nearly the same paracrine profile of angiogenic trophic factors (p>0.05) (Fig. 1E). Cell migration assay showed no significant difference in the degree of migration as a function of time between labeled and non-labeled PSC (p>0.05) (Fig. 1F). The labeled cells occupied 39.9±3.8% of the original cell-free area while non-labeled PSC occupied 44.1±3.9% at 24 h.
CD marker Expression and Differentiation Potential
After differentiation induction, PSC can differentiate into osteoblast, adipoblast and chondroblast cells (Fig. 2A). Both non-labeled and labeled PSC expressed the phenotypes of CD73, CD90 positively and CD45 negatively (Fig. 2B). Viral transfection did not influence cell surface marker expression and differentiation potential.
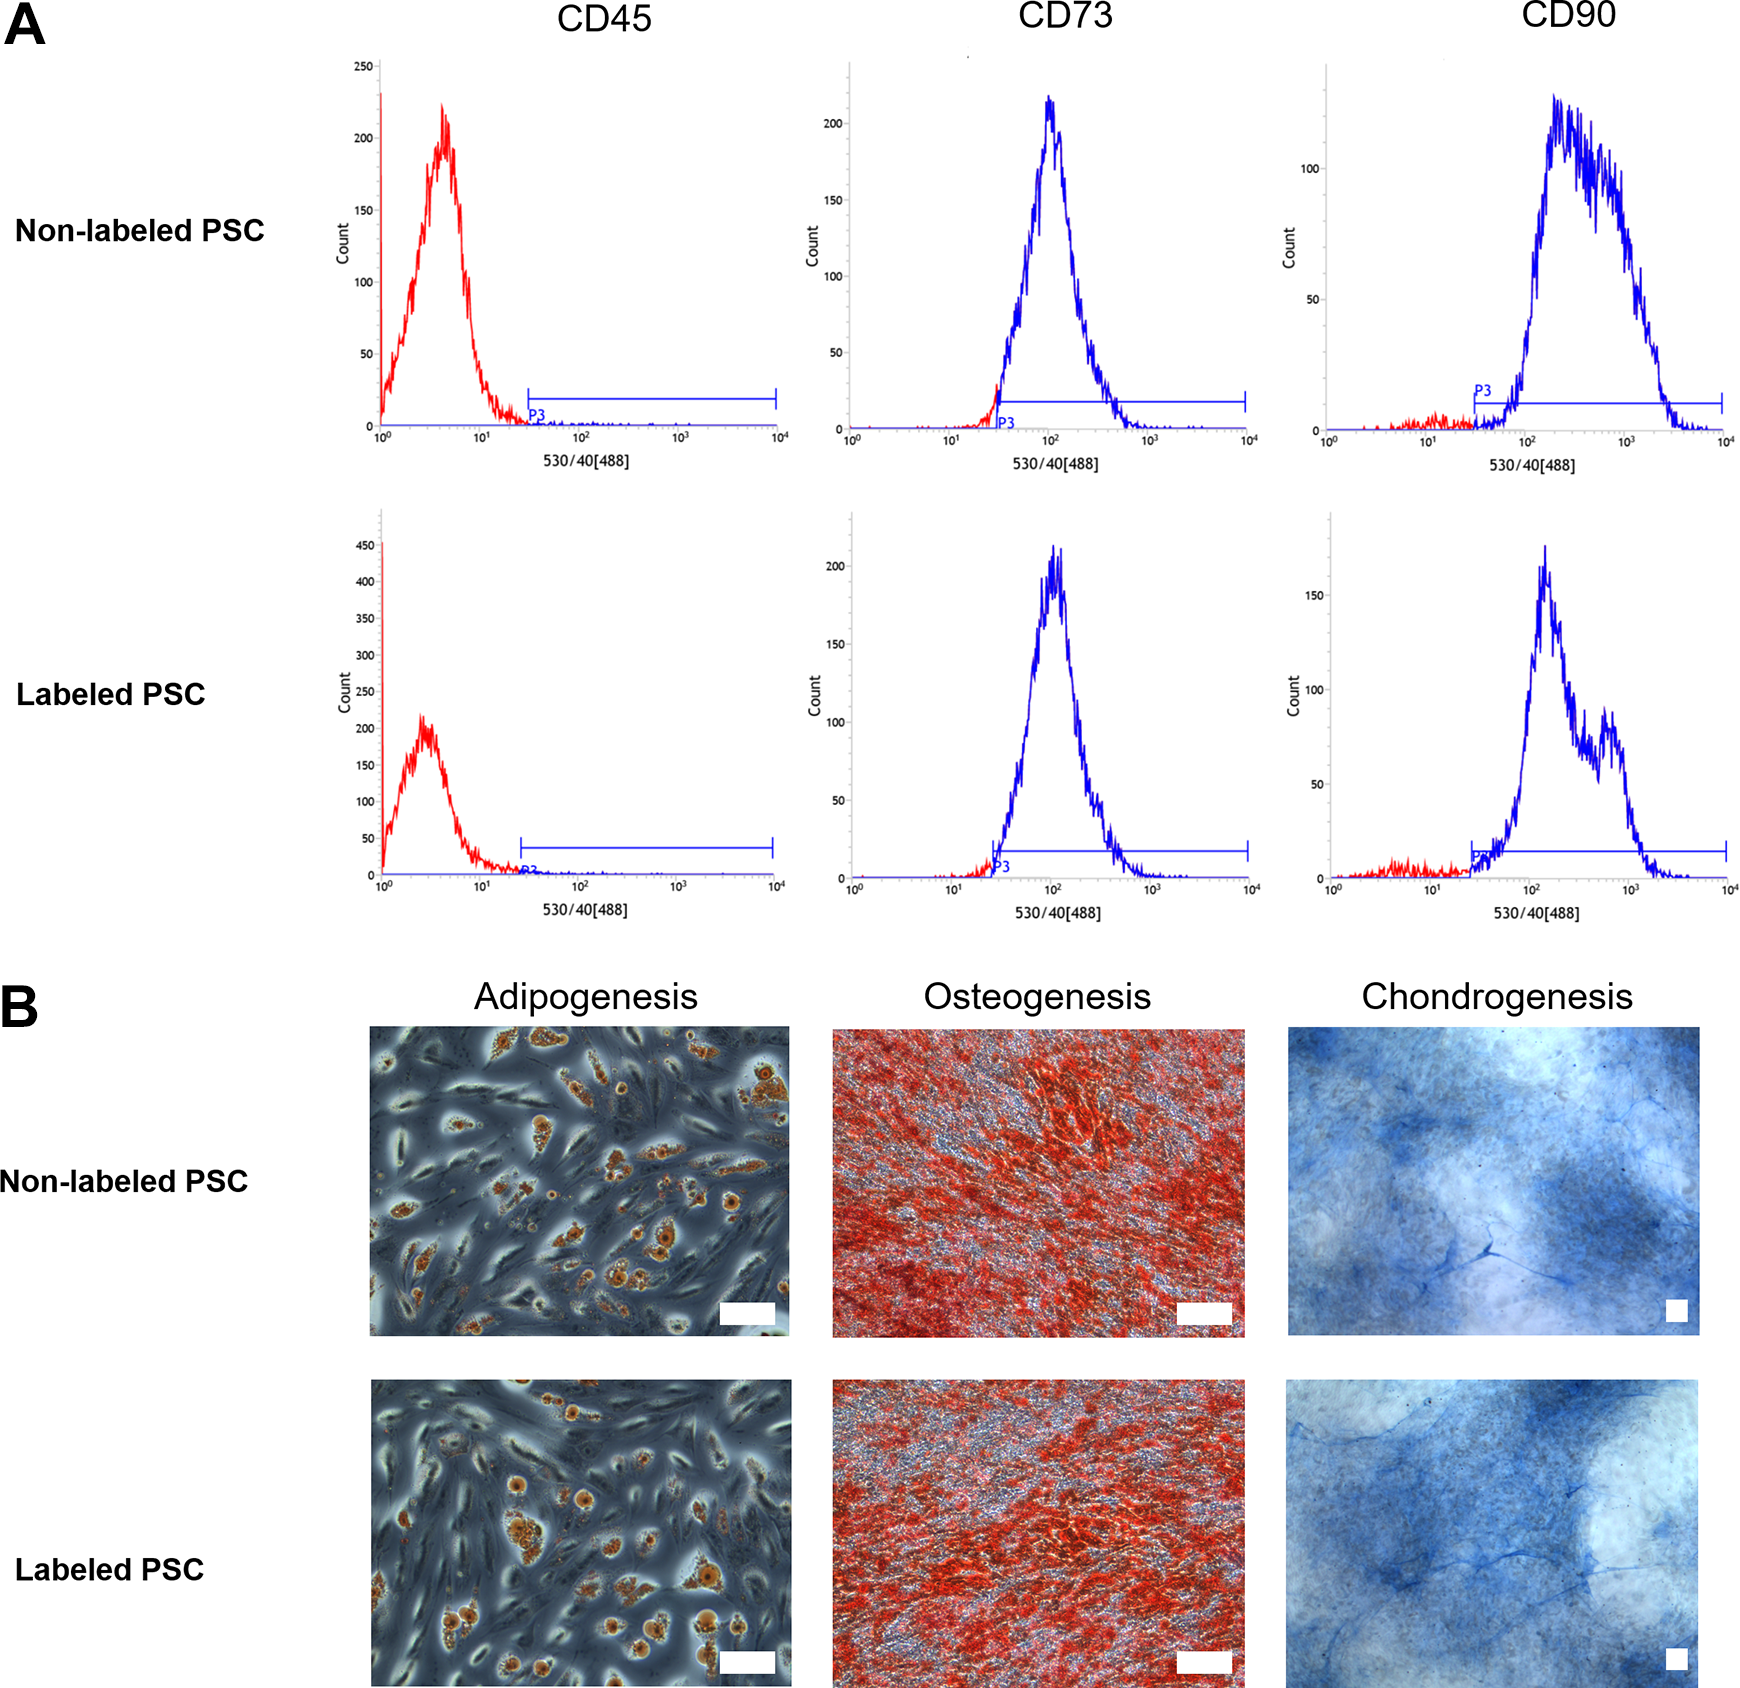
The CD marker expression and differentiation potential of mKATE-renLUC-labeled and non-labeled placental stromal cells. (A) Both labeled and non-labeled cells express CD73, CD90 positively, and CD45 negatively. (B) Multi-differentiation ability, bar 50 µm.
Expression of mKATE and renLUC with Passaging
The mKate and renLUC gene was strongly integrated to the DNA of PSC after lentivirus infection. Labeled cells did not lose mKATE expression from p9 to p13 (Fig. 3A). The labeled PSC displayed brighter bioluminescence (i.e. pixel density) when cell concentration reached 3×10⁵ cells (Fig. 3B). The bioluminescence was maintained for 2 h after addition of the substrate, after which it began to diminish (Fig. 3C).

The fluorescent and bioluminescent images of mKATE-renLUC-labeled placental stromal cells in vitro. (A) The fluorescent expression of transfected PSC with passaging, bar 20 µm. (B) Bioluminescent signal emitted by PSC with different cell densities in vitro. (C) The dynamic change of bioluminescent signal in vitro after a single dose of substrate.
Labeled PSC were Tracked using IVIS Detection System
Five minutes after substrate was injected intraperitoneally, the migration and distribution of injected mKATE-renLUC-expressing PSC were detected with the IVIS system (Fig. 4). IVIS imaging in vivo showed at the time of cellular injection, the transplanted PSC immediately assembled around the para-penile region. Thereafter, an early migration of the majority of injected cells to the abdominal area was observed. It was also noted that some cells moved to the lower limb, lateral side of trunk and tail area. Almost no cells remained in the penile area about 1 h after intra-cavernous injection of labeled cells, while most of cells aggregated in the lower abdomen. The implanted cells stably located in the lower belly or penis area 1 day after cell transplantation. No bioluminescent signal was detected with the same dose of substrate injection on postoperative day 3.
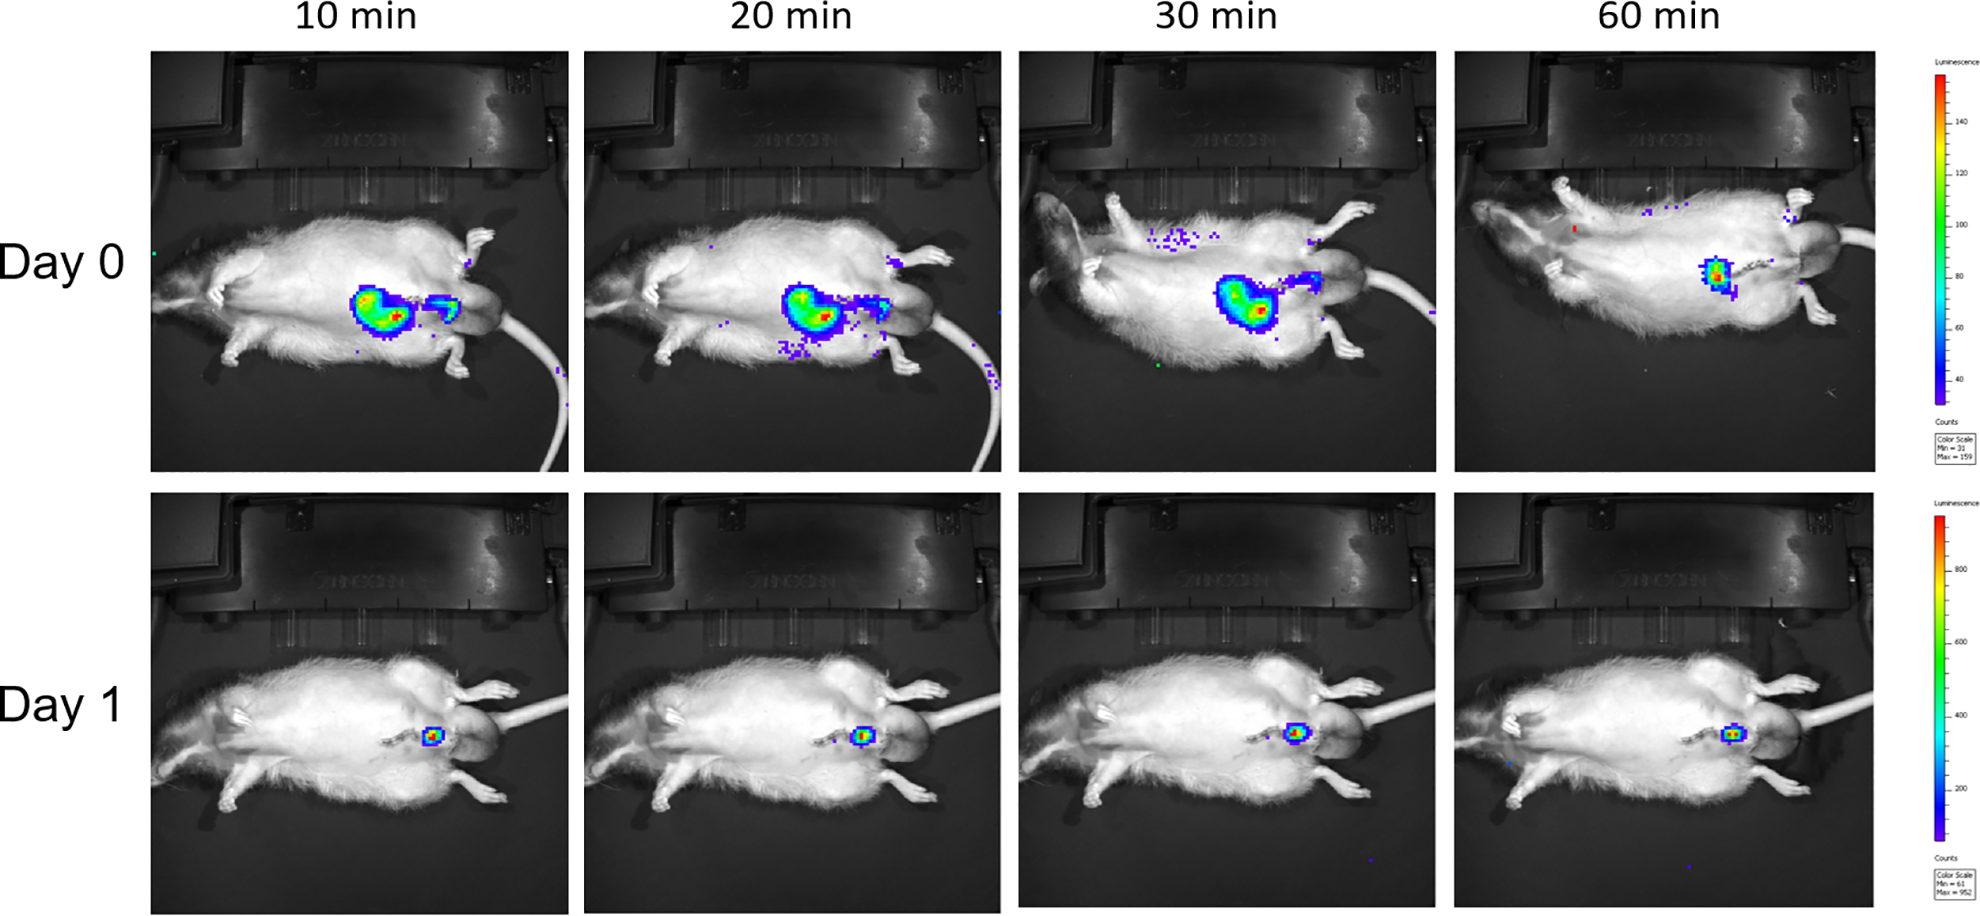
Real-time bioluminescence images of mKATE-renLUC-labeled placental stromal cells in erectile dysfunction rat model.
Migration of Labeled PSC In Vivo
mKATE-renLUC-labeled PSC can be tracked in the harvested tissues using histological methods. To identify if the implanted cells survived and migrated, the tissues of penis, prostate, testis, kidney, liver, spleen, lung, heart and skin were harvested for mKATE immunostaining at day 1, 3 and 7 after cell transplantation. The mKATE-positive PSC were detected in the penile, kidney, prostate and hepatic tissues (Fig. 5). No mKATE-positive cells were detected in the control group or other organs, such as the heart, lungs and testis.
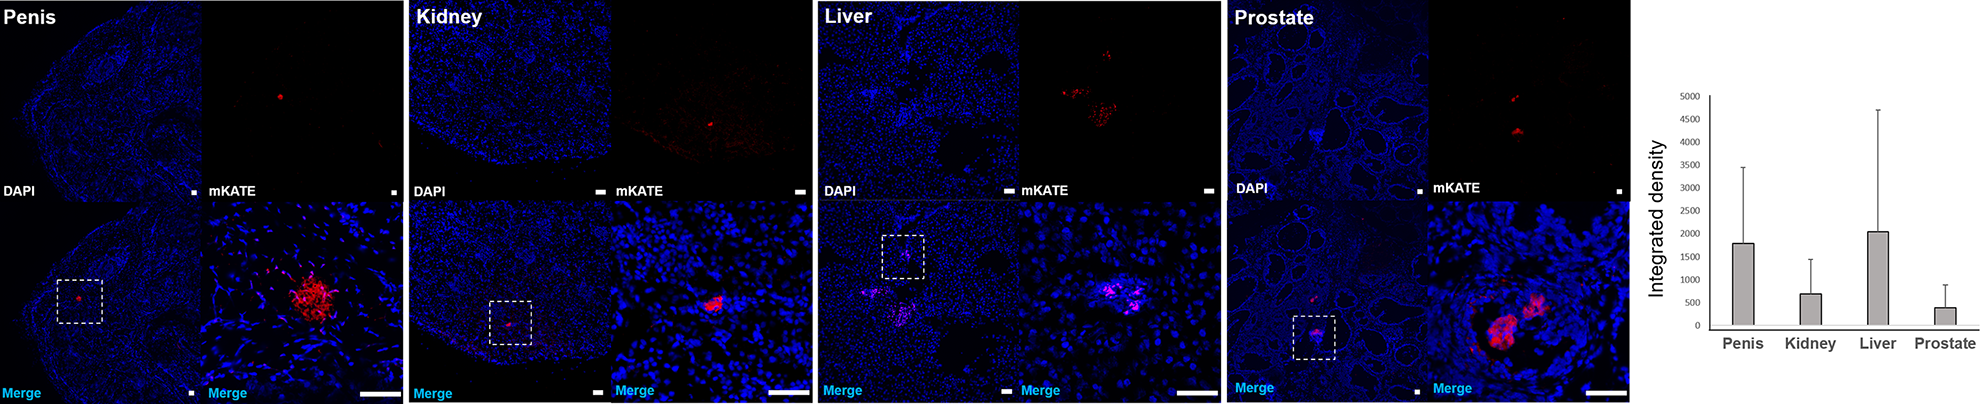
Detection of injected placental stromal cells in the harvested rat tissues. The injected mKATE-renLUC-labeled PSC were detected in penis, kidney, liver and prostate. Bar = 50 µm.
Discussion
To track the implanted cells longitudinally, a lentivirus vector combining mKATE and renLUC was used. Transfection did not significantly affect the phenotype, differentiation ability, viability, apoptosis, proliferation, migration and paracrine profile of the PSC, which proved the biological safety of this vector. The in vivo animal study demonstrated that this dual labeling technology was effective in tracking implanted PSC. Bioluminescence imaging based on renLUC provides a reliable method for locating implanted cells in vivo in “real time.”
A huge challenge remains to identify and track transplanted cells in cell-based therapy. A thorough understanding of the migration, function and fate of administered cells in vivo is critical in the development of better applications for stem cell therapy. Bioluminescence provides extraordinary sensitivity because of the absence of endogenous luciferase expression in mammalian cells and the low background luminescence emitted from animals. Only metabolically active cells can display bioluminescence, which prevents artifacts produced by severely damaged or dead cells 12 . Bioluminescence is considered to be suitable for longitudinal monitoring of cell survival in vivo in real time 13,14 .
Luciferase and luciferin are two essential elements in bioluminescent lighting. In some situations, luciferin concentration is not constant over time and the signal disappears within minutes. Therefore, luciferin has to be applied repeatedly for long-term imaging, which complicates the quantification of the signal. It was equally important to choose a luciferin which is enzymatically optimal for renLUC. To enhance the sensitivity and brightness of bioluminescence, Coelenterazine-h was used as the luciferin in the current study. It is a synthetic coelenterazine analog that confers different Ca2+ affinities and spectral properties on the aequorin complex. Like native coelenterazine, these five novel derivatives can be used to reconstitute the aequorin complex both in vivo and in vitro 15 . Coelenterazine-h displays favorable biodistribution to access renLUC-expressing cells and can produce 10 times higher luminescence intensity than native coelenterazine 16 . By adding 50 µg/mL Coelenterazine-h solution, bioluminescent lighting can last at least 2 h in vitro or 70 min in vivo, which can avoid repeated injections of luciferin and enhance real-time detection of luciferase within a certain time period. The present study demonstrated that an early migration of injected PSC from the penis to the lower abdomen was observed in real time with a single injection of substrate. A further study might use the brightness obtained in vitro to estimate the density of cells seen over time in vivo.
Many methods 17 –19 , such as magnetic resonance imaging (MRI) have been used to monitor the fate of the implanted cells in vivo. Different from conventional imaging, MRI uses a magnetic field instead of ionizing radiation. Furthermore, it has unlimited depth of penetration because of the low attenuation of the magnetic field in tissue 20 . However, it does not show functional, metabolic and molecular information. It is also time consuming and costly, which limits its wide use in clinics and laboratories 17 . Compared with tracking methods using MRI, the only devices needed for this current dual labeling technology are a sensitive camera (cooled CCD) and a fluorescent microscope. On the other hand, the relatively low transmission of light in the body reduces the depth of detection and thus limits the application of bioluminescence in in vivo studies of large animals.
The brightness and tissue penetration of the bioluminescent signal has limited its wide application in vivo. In previous studies 12,21 –23 , nearly all in vivo cell-tracking experiments with bioluminescence used a small animal (mouse or zebrafish, etc.) as research model. In this current study we used a rat model, weighting 10–20 times as much as mouse, and attempted to expand the extent of bioluminescence application. Although the brightness and sensitivity of codon-optimized renLUC was obviously improved compared with firefly luciferases, it was still a challenge to obtain a bioluminescent signal from transplanted cells in deep organs, particularly when very few cells survived. Increasing bioluminescence brightness intensity is a trend in the associated research. Yuan et al. 21 designed and synthesized pro-substrates to enhance the improved light signal, and found that butyryloxymethyl luciferin 7 can serve as a promising long-term bioluminescence imaging probe. Gregor et al. 12 reported the generation of an improved bacteria luciferase with an approximately 7-fold increased brightness. Another study 24 developed an improved firefly luciferase using a red-shifted and highly deliverable luciferin analog to establish an all-engineered bioluminescence in vivo imaging system. It reportedly produced emissions in vivo that were brighter by a factor of 100 to 1000 than conventional systems, allowing non-invasive visualization of single cells deep inside freely moving animals. Although major progress was made in bioluminescent signaling, tumor cells were used as target cells in that study 24 , the biological properties of which are much different from stem cells. Therefore, the luciferase and luciferin described in that paper could be applicable in the field of tumor research but not necessarily in stem cell-based therapy. The development of brighter, cheaper, more stable and more permeable bioluminescence systems suitable for tracking stem cells is still required in the field of regenerative medicine.
Conclusion
The present study demonstrated that the dual labeling technology using mKATE-renLUC provides a safe and effective cell-tracking approach with brighter fluorophores and codon-optimized luciferase for stem cell therapy, allowing us to monitor injected cells noninvasively for longer periods in vivo.
Supplemental Material
Supplemental_figure - Non-Invasive Cell Tracking with Brighter and Red-Transferred Luciferase for Potential Application in Stem Cell Therapy
Supplemental_figure for Non-Invasive Cell Tracking with Brighter and Red-Transferred Luciferase for Potential Application in Stem Cell Therapy by Lei Dou, Ethan L. Matz, Xin Gu, Fangpeng Shu, Jennifer Paxton, Jinlin Song, James Yoo, Anthony Atala, John Jackson and Yuanyuan Zhang in Cell Transplantation
Footnotes
Acknowledgments
This work was supported by the Army, Navy, NIH, Air Force, VA and Health Affairs to support the AFIRM II effort, under Award No. W81XWH-13-2-0052. The U.S. Army Medical Research Acquisition Activity, 820 Chandler Street, Fort Detrick MD 21702-5014 is the awarding and administering acquisition office. Opinions, interpretations, conclusions and recommendations are those of the author and are not necessarily endorsed by the Department of Defense. We thank Frank Marini and his group for the mKATE-renLUC lentivirus and bioluminescent image.
Ethical Approval
This study was approved by the Wake Forest University Health Sciences Animal Care and Use Committee (A16-089).
Statement of Human and Animal Rights
All procedures in this study were conducted in accordance with the Wake Forest University Health Sciences Animal Care and Use Committee approved protocols.
Statement of Informed Consent
There are no human subjects in this article and informed consent is not applicable.
Declaration of Conflicting Interests
The author(s) declared no potential conflicts of interest with respect to the research, authorship, and/or publication of this article.
Funding
The author(s) received no financial support for the research, authorship, and/or publication of this article.
Data Availability Statement
The data that support the findings of this study are available from the corresponding author upon reasonable request.
Supplemental Material
Supplemental material for this article is available online.
References
Supplementary Material
Please find the following supplemental material available below.
For Open Access articles published under a Creative Commons License, all supplemental material carries the same license as the article it is associated with.
For non-Open Access articles published, all supplemental material carries a non-exclusive license, and permission requests for re-use of supplemental material or any part of supplemental material shall be sent directly to the copyright owner as specified in the copyright notice associated with the article.