
Abstract
The human placenta is an important source of stem cells that can be easily collected without ethical concerns since it is usually discarded after childbirth. In this study, we analyzed the amniotic membrane (AM) from the human placenta with the aim of mapping different regions with respect to their morpho-functional features and regenerative potential. AMs were obtained from 24 healthy women, undergoing a caesarean section, and mapped into 4 different regions according to their position in relation to the umbilical cord: the central, intermediate, peripheral, and reflected areas. We carried out a multiparametric analysis focusing our attention on amniotic epithelial cells (AECs). Our results revealed that AECs, isolated from the different areas, are a heterogeneous cell population with different pluripotency and proliferation marker expression (octamer-binding transcription factor 4 [OCT-4], tyrosine-protein kinase KIT [c-KIT], sex determining region Y-box 2 [SOX-2], α-fetoprotein, cyclic AMP response element binding [CREB] protein, and phosphorylated active form of CREB [p-CREB]), proliferative ability, and osteogenic potential. Our investigation discloses interesting findings that could be useful for increasing the efficiency of AM isolation and application for therapeutic purposes.
Introduction
The human placenta is a discoid-shaped organ made up of both fetal and maternal components. The fetal components include the placental disc, the amniotic and chorionic membranes (often referred to as the fetal membranes), the chorionic villi, and the umbilical cord 1 ; the maternal side is comprised of the decidua 1 . Different cell types with stem/progenitor properties have been isolated from the maternal decidua 2,3 , the umbilical cord matrix 4,5 , the chorionic villi 6 –8 , and the fetal membranes 1,9 .
Of particular interest is the human amniotic membrane (AM) that has a long history of clinical applications. The AM has proven to be a precious resource for tissue engineering and has been shown to possess anti-inflammatory properties and low immunogenicity 10 –12 , making it an attractive and widely studied tissue for diverse therapeutic applications 13 –15 .
More recently, decellularized AM has been employed for postinfarct left ventricular remodeling 16 and for the repair of an oroantral communication 17 , thus generating new questions as to the therapeutic potential of the different regions and/or cells in the AM. Indeed, only a handful of reports have characterized and studied the phenotype of the cells comprising the AM in situ 18,19 . A recently published paper demonstrated that placental and reflected AM differ in morphology and functional activity, as the placental region has significantly higher mitochondrial activity, yet significantly fewer reactive oxygen species (ROS) 20 .
The AM is composed of 2 layers, an epithelial layer, containing 2 epithelial cell types of cuboid or columnar shape called amniotic epithelial cells (AECs), and a stromal avascularized layer, containing amniotic mesenchymal stromal cells (AMSCs) 21 . Evidence of plasticity of AECs has substantiated their interest for various applications in regenerative medicine. In vitro, AECs have been shown to differentiate into cells of all the 3 germ layers 21 , and after 5 to 10 passages in culture, they change their phenotype from cuboidal epithelial to mesenchymal and fibroblast-like 22 and reduce their differentiation potential 23,24 . AECs have also been shown to express pluripotency markers, including stage-specific embryonic antigen-4 (SSEA-4) 25 , octamer-binding transcription factor 4 (Oct-4), Nanog, sex-determining region Y-box 2 (Sox2), and Rex-1 26 .
Thus, given the reports showing AEC plasticity and stemness, the aim of this study was to map the human AM under physiological conditions with respect to the structure and phenotype, to analyze AECs in situ from 4 different areas of AM, and to perform CFU and differentiation assays after cell isolation to identify the region where AECs with the highest stemness potential/characteristics could be found.
Materials and Methods
Subjects and Sample Preparation
Human term placentas (n = 24) were collected from healthy women (mean age ± standard deviation [SD] = 31.4 ± 5.2) after vaginal delivery or caesarean section at the Fondazione Poliambulanza-Istituto Ospedaliero, Brescia, or at the Hospital SS. Annunziata, Chieti. Samples were collected after obtaining informed written consent according to the guidelines set by the Ethics Committee for the Institution of Catholic Hospitals or the G. d’Annunzio University of Chieti–Pescara.
We dissected the placentas to isolate samples of AM from 4 different regions according to their position relative to the umbilical cord. The first area, closer to umbilical cord, was named the central area; the second, in the middle, was considered the intermediate area; the third was named the peripheral area; and the fourth, the reflected area, corresponded to the chorion laeve.
Light and Electron Microscopy Procedures
Samples of AM were fixed with 4% formaldehyde (Carlo Erba Reagents, Milan, Italy) or 3% paraformaldehyde (PFA) in 1× phosphate-buffered saline (PBS) for 2 to 3 h. Both groups of samples were then dehydrated in a series of graded increases in alcohol concentrations, embedded in paraffin, and cut on a microtome (Leica, RM 2265, Nussloch, Germany). Sections were routinely stained with hematoxylin–eosin (H&E) and Mallory trichrome staining solutions, mounted in Bio Mount, and observed under a ZEISS Axioskop 40 (Carl Zeiss, Gottingen, Germany) light microscope equipped with a Coolsnap videocamera (Photometrics, Tucson, AZ, USA).
For electron microscopy, samples were fixed with 2.5% glutaraldehyde in 0.1 M cacodylate buffer, pH 7.2–7.4, for 2 to 3 h at 4 °C. They were washed in cacodylate buffer and postfixed in 1% osmium tetroxide for 1 to 2 h at 4 °C. After dehydration in increasing alcohol gradients, samples were embedded in Spurr resin and cut at the ultramicrotome (C. Reichert-Jung Ultracut, Wien, Austria). Semithin sections were stained with 1% toluidine blue for light microscopy analysis. Observations were carried out under a ZEISS Axioskop 40 (Carl Zeiss) light microscope equipped with a Coolsnap videocamera (Photometrics).
Immunohistochemistry
The expression of different markers of pluripotency and proliferation of the 4 placental areas was evaluated through immunohistochemistry. The tissue sections fixed in 3% PFA were deparaffinized with Bio-Clear (BioOptica, Milano, Italy), dehydrated in decreasing alcohol gradients, and washed in distilled water. After washing with PBS, antigenic unmasking was performed with 0.05% trypsin in PBS for 5 min. Sections were then incubated with Ultravision Hydrogen Peroxide Block (Ultravision Quanto Detection System, Thermo Scientific) for 10 min and washed with PBS. After blocking with Ultravision Protein Block for 5 min, sections were incubated with the primary antibody overnight at 4 °C. The working dilutions were 1:500 for OCT-4 (polyclonal antibody rabbit, Thermo Scientific), c-KIT (monoclonal antibody mouse, Santa Cruz, Dallas, TX, USA), and α-fetoprotein (monoclonal antibody mouse, Thermo Scientific); 1:600 for SOX-2 (monoclonal antibody mouse, Thermo Scientific); and 1:400 for CREB (monoclonal antibody rabbit, Cell Signaling, Danvers, MA, USA) and phosphorylated active form of CREB (p-CREB; polyclonal antibody rabbit, Cell Signaling). After washing with PBS, the sections were incubated with Primary Antibody Amplifier Quanto (Ultravision Quanto Detection System, Thermo Scientific, Runcorn, UK) for 10 min followed by HRP Polimer Quanto (Ultravision Quanto Detection System, Thermo Scientific) for 10 min. The reaction was developed by incubating sections with the Quanto Chromogen-Dab Quanto Substrate mix (Ultravision Quanto Detection System, Thermo Scientific) for 5 min. Slides were mounted with glycerol and observed under a ZEISS Axioskop 40 (Carl Zeiss) light microscope, equipped with a Coolsnap videocamera (Photometrics). MetaMorph Software System (Universal Imaging Inc., Bedford Hills, NY, USA; Molecular Devices Sunnyvale, CA, USA; Crisel Instruments, Rome, Italy) was used to acquire, visualize, and analyze digital images.
In some cases, cytospins of purified AECs were fixed in 3% PFA in 1× PBS for 20 min at 4 °C. All cytospins were permeabilized with 0.1% Triton in 1× PBS for 2 min and incubated with anti-OCT-4, c-KIT, SOX-2, α-fetoprotein, and CREB monoclonal/polyclonal antibodies and further processed following the above-mentioned immunohistochemistry protocol.
Morphometric Analysis
Tissue sections, cytospins, and toluidine blue-stained semithin sections were subjected to morphometric computerized image analysis. MetaMorph Software System (Universal Imaging Inc., Molecular Devices Crisel Instruments) was used to acquire digital images, to quantitate the amount of labeling and the number of positive cells, and to measure the extent of cell area occupied by granules. Morphometric computerized analysis of the specific areas was performed after calibrating the MetaMorph 6.1r6 program (Universal Imaging Inc.,) for the objective lens magnification used (×20). Image analysis of sections processed for immunohistochemistry and of semithin sections was performed by making 3 shots at ×20 and ×40 magnification for each area and by setting the range to measure the positivity for each antibody. The selected area for each sample was 3,000 μm2 for immunohistochemistry reactions and 2,400 μm2 for semithin sections. Image analysis of the amount of labeling in immunohistochemistry reactions and of cell granules area in semithin sections was performed by establishing a discrimination threshold and by setting the desired intensity of positive AECs and AMSCs and granules present inside the AECs. The threshold granule area was measured for each cell and expressed as a percentage of whole cell area. The threshold range settings were kept constant for the different experimental groups. MetaMorph data were logged to Microsoft Excel to calculate mean values and SD.
Isolation of Human Amniotic Epithelial Cells (hAECs)
The AM was manually separated from the chorion, extensively washed and treated with antibiotic and antifungal solutions. hAECs from different regions were prepared as described by Magatti et al.
25
Briefly, AM fragments were incubated in 1× PBS (Sigma-Aldrich, St. Louis, MO, USA) containing 0.5 mM ethylenediaminetetraacetic acid (EDTA) (Sigma-Aldrich) and 100 U/mL penicillin plus 100 mg/mL streptomycin (P/S, Sigma-Aldrich) for 10 min at 37 °C and then in 1× trypsin/EDTA solution (Sigma-Aldrich; 10 mL for each fragment) for 5 min at 37 °C. After discarding debris, the fragments were incubated once more in fresh trypsin/EDTA solution for 10 min at 37°C, after which the tissue was carefully shaken and the trypsin was inactivated by adding 3 to 4 volumes of Roswell Park Memorial Institute (RPMI) 1640 medium (Sigma-Aldrich), supplemented with 10% heat-inactivated fetal bovine serum (FBS, Sigma-Aldrich), 2 mM
Flow Cytometry
AECs isolated from different placental regions were washed with FACS buffer (0.1% sodium azide [Sigma-Aldrich] and 0.1% FBS [Sigma-Aldrich] in PBS) and then incubated for 20 min at 4 °C with anti-human fluorescein isothiocyanate (FITC), phycoerythrin (PE), or allophycocyanin (APC)-conjugated monoclonal antibodies, or isotype-matched controls specified below, together with 20 mg/mL polyglobin (Kiovig, Baxter, Kiogiv, Baxter, Deerfield, IL, USA), which was prepared in PBS with 1% bovine serum albumin (BSA) and added to block nonspecific binding.
The clones and suppliers of the antibodies used in this study were as follows: monoclonal antibodies against CD90 (5E10), CD105 (266), CD73 (AD2), CD140b (28D4), CD146 (P1H12), CD45 (2D1), human leukocyte antigen (HLA)-ABC (G46-2.6), HLA-DR (TU36), stage-specific embryonic antigen (SSEA)-4 (MC813-70) (all purchased from BD Biosciences); CD326 (HEA-125) and CD324 (67A4) (both purchased from Miltenyi Biotec, Bergisch Gladbach, Germany); TRA-1-60 (TRA-1-60, purchased from Millipore); and CD49a (TS2/7, purchased from AbD Serotec, Oxford, UK).
FITC/PE/APC/Alexa-488 or Alexa-647-conjugated mouse IgG1, IgG2b, and rat IgG2a were used as isotype controls; all antibodies were obtained from BD Biosciences, except for Alexa-488 and APC-conjugated mouse IgG2b and Alexa-647-conjugated rat IgG2a and IgG3 isotype control, which were purchased from AbD Serotec.
Colony-Forming Unit (CFU) assay
CFU assays were performed in 6-well plates using freshly isolated AECs from 4 different placental regions. Cells were seeded at 2 different densities (1 × 10⁴ and 2×10⁴ cells/well) in Dulbecco's modified Eagle's medium (DMEM) F-12 (Gibco Life Technologies, Thermo Fisher Scientific, Waltham, MA, USA) supplemented with 10% FBS, 100 U/mL penicillin, 100 μg/mL streptomycin, 2 mM
Osteogenic Differentiation of AECs
AECs were seeded in 48-well plates at a density of 5×10⁴/cm2 in DMEM F-12 (Life Technologies) supplemented with 10% FBS, 100 U/mL penicillin, 100 μg/mL streptomycin, 2 mM
Statistical Analysis
Data are expressed as mean ± standard deviation (SD). Student t
Results
The Histological Structure of Human AM
We first performed a morphological study of the whole AM in correspondence of the chorion frondosum and chorion laeve. Figure 1A shows a 2-D reconstruction of the placenta structure, from the superficial to the innermost layers. The superficial layer is the AM, including an epithelial layer and an underlying connective tissue. The epithelial layer contains cells of different height with nuclei in central or apical position (Fig. 1B). These cells are named hAECs, while human AMSCs are detected below the basement membrane. As shown in Figure 1B, AECs display different morphological features in the different areas of AM. In all the areas of AM, the amniotic epithelium appears multilayered except for the intermediate area (Fig. 1B). In the central area, the nuclei of epithelial cells are located in a higher position than in the other areas and, occasionally, budding or detaching cells are present (Fig. 1B). Interestingly, apoptotic cells, which were completely detached from AM and with apoptotic bodies in the cytoplasm, were mainly observed in the central area (Fig. 1B), although budding and detaching cells were present also in other areas, including the reflected area (Fig. 1B).

(A) The histological structure of the human placenta. Representative 2-D reconstruction of the human placenta, stained with trichrome Mallory solution (original magnification: ×2.5), and schematic representation of the placental structure. AE, amniotic epithelium; AM, amniotic mesenchyme; Ch, chorion; D, decidua. In the right panels, details are shown at a higher magnification (×10 and ×40). (B) The histological structure of the different areas of the human amniotic membrane. The pictures show the amniotic epithelium and the underlying connective tissue of the central, intermediate, peripheral, and reflected areas. Black arrows point at apoptotic cells, arrowheads point at multilayered epithelium and detaching cells, and green arrows point at budding cells. Sections were stained with hematoxylin–eosin solution (original magnification: ×20).
In Situ Mapping of the AM and Quantification of Pluripotency and Proliferation Markers
We also evaluated the in situ expression of different proteins with the aim to map AM and, eventually, to identify the presence of different cell populations. Specifically, we investigated the expression of OCT-4, c-KIT, SOX-2, α-fetoprotein, CREB, and p-CREB with immunohistochemistry. OCT-4 was detectable at both nuclear and cytoplasmic levels in AECs belonging to all the 4 areas of AM. Moreover, it was clearly expressed by AMSCs from all the different areas (Fig. 2). By contrast, c-KIT was detectable only in the peripheral and reflected areas mainly at cytoplasmic level (Fig. 2); SOX-2 and α-fetoprotein were also expressed at cytoplasmic level, but in all the areas and in both cell populations (AECs and AMSCs; Fig. 2). Interestingly, we observed that AECs express CREB, a nuclear transcription factor involved in cell apoptosis, proliferation, and differentiation, at the nuclear level in the central and intermediate area (Fig. 2) and both at the cytoplasmic and nuclear levels in the peripheral and reflected areas (Fig. 2). In all the areas, p-CREB was expressed at the nuclear level (Fig. 2). AMSCs from all the areas were also positive for CREB and occasionally positive for p-CREB (Fig. 2). To exclude the presence of unspecific reactions, we labeled sections from liver or renal tissue in parallel with AECs isolated from the 4 areas of AM. The results obtained confirmed the specificity of the in situ immunohistochemical reactions (data not shown).

Immunohistochemistry in light microscopy. Photomicrographs depicting the immunohistochemical reaction for OCT-4, c-KIT, SOX-2, α-fetoprotein, CREB, and p-CREB in the central, intermediate, peripheral, and reflected areas (original magnification: ×40). Black arrows point at human amniotic mesenchymal stromal cells (AMSCs). The insets show the negative control of the reaction for all antibodies (original magnification: ×40).
We quantified the immunohistochemical reactions through a morphometric analysis with MetaMorph analysis software (Fig. 3A and B). We selected for each labeled sample the same area (3,000 μm2) and applied the same discrimination threshold in order to have comparable results (Fig. 3A). In particular, the labeling for OCT-4 was higher in the peripheral area followed by the reflected area in comparison with both the central (P < 0.05) and intermediate areas (Supplementary Fig. 1S). Similarly, both c-KIT and SOX-2 expression reached the highest level in the peripheral area, and c-KIT expression was less intense in the intermediate area than in the central and reflected areas, while SOX-2 expression was less intense in the reflected area than in the central and intermediate areas (Supplementary Fig. 1S). Instead, the highest α-fetoprotein expression was found both in the central and in the peripheral areas (P < 0.05; Supplementary Fig. 1S). Consistently, both total CREB and p-CREB expression were found to be increased in the peripheral area in comparison to the central (P < 0.05), intermediate, and reflected areas (Supplementary Fig. 1S). In conclusion, the highest expression of OCT-4, c-KIT, SOX-2, and CREB was in the peripheral area, while the α-fetoprotein highest expression was in the central area. In particular, the highest positivity for OCT-4 and CREB in the peripheral area indicates that mostly in this area AECs have properties of stemness, proliferation, and differentiation capability. In line with these observations, morphometric analysis on semithin sections displayed a progressively increasing content of lipid granules toward the peripheral area (Supplementary Fig. 2S).

Quantification and statistical analysis of immunohistochemical reactions. (A) Light microscopy image representative of the method used for quantitative analysis of the immunohistochemical reactions with MetaMorph analysis software (original magnification: ×40). The selected area for each sample was 3,000 μm2. (B) Bar graph representation of the immune labeling for OCT-4, SOX-2, c-KIT, α-fetoprotein, CREB, and p-CREB in the central (C), intermediate (I), peripheral (P), and reflected (R) areas of the amniotic membrane. Values reported in the bar graphs are the means ± standard deviation (SD) of labeled area from at least 3 different experiments.*P < 0.05: OCT-4 central area versus peripheral area, α-fetoprotein intermediate area versus peripheral area, and CREB central area versus peripheral area.
Phenotypic Markers of Cells Isolated from Different Placental Regions
After having observed differences in AECs in situ, we isolated AECs from distinct regions of the AM and performed flow cytometry analysis. AECs were isolated from different placental regions and analyzed for typical cell surface protein expression (Table 1) of (a) epithelial cell markers: CD324 (E-cadherin), CD326 (EpCAM), and CD73; (b) embryonic markers: SSEA-4 and human stem cell marker TRA-1-60; (c) mesenchymal markers: CD90 (Thy-1) and CD105 (endoglin); (d) pericyte-associated markers: CD146 and CD140b (platelet-derived growth factor receptor [PDGFRb]) (e) integrin CD49a; (f) HLA-ABC class I histocompatibility antigens and HLA-DR class II histocompatibility antigens; and (g) the hematopoietic marker CD45.
Phenotype of AECs Isolated from Different Regions of the Human Amniotic Membrane.

Note: Percentage of positive amniotic epithelial cells (AECs) for the indicated markers. Mean and standard deviation (SD) of at least 3 experiments.
In line with our previous reports, AECs from all the 4 regions expressed CD324, CD326, CD73, and SSEA-4 and TRA-1-60 (Table 1). Furthermore, AECs had low/absent expression of mesenchymal markers CD90, CD105, pericyte-associated markers CD146 and CD140b (PDGFRb), and CD49a integrin. We also confirmed that AECs do not express the hematopoietic marker CD45 but are positive for HLA-ABC, also in line with previous reports. No significant differences were observed between regions for any markers analyzed.
CFU Ability of AECs from Different Regions of the AM
CFU assays were performed using AECs from all 4 placental regions to analyze their clonogenic potential (Fig. 4A). The results obtained show that for both AEC concentrations seeded (1 × 10⁴ and 2 × 10⁴), cells found in the reflected area had a higher mean CFU value compared to the other 3 areas (Fig. 4). This difference was significant versus the peripheral, intermediate, and central areas when the lower AEC concentration was tested (P < 0.01 vs. peripheral and intermediate; P < 0.05 vs. central) versus the peripheral and intermediate areas when the highest AEC concentration was used (P < 0.05 vs. peripheral; P < 0.01 vs. intermediate).
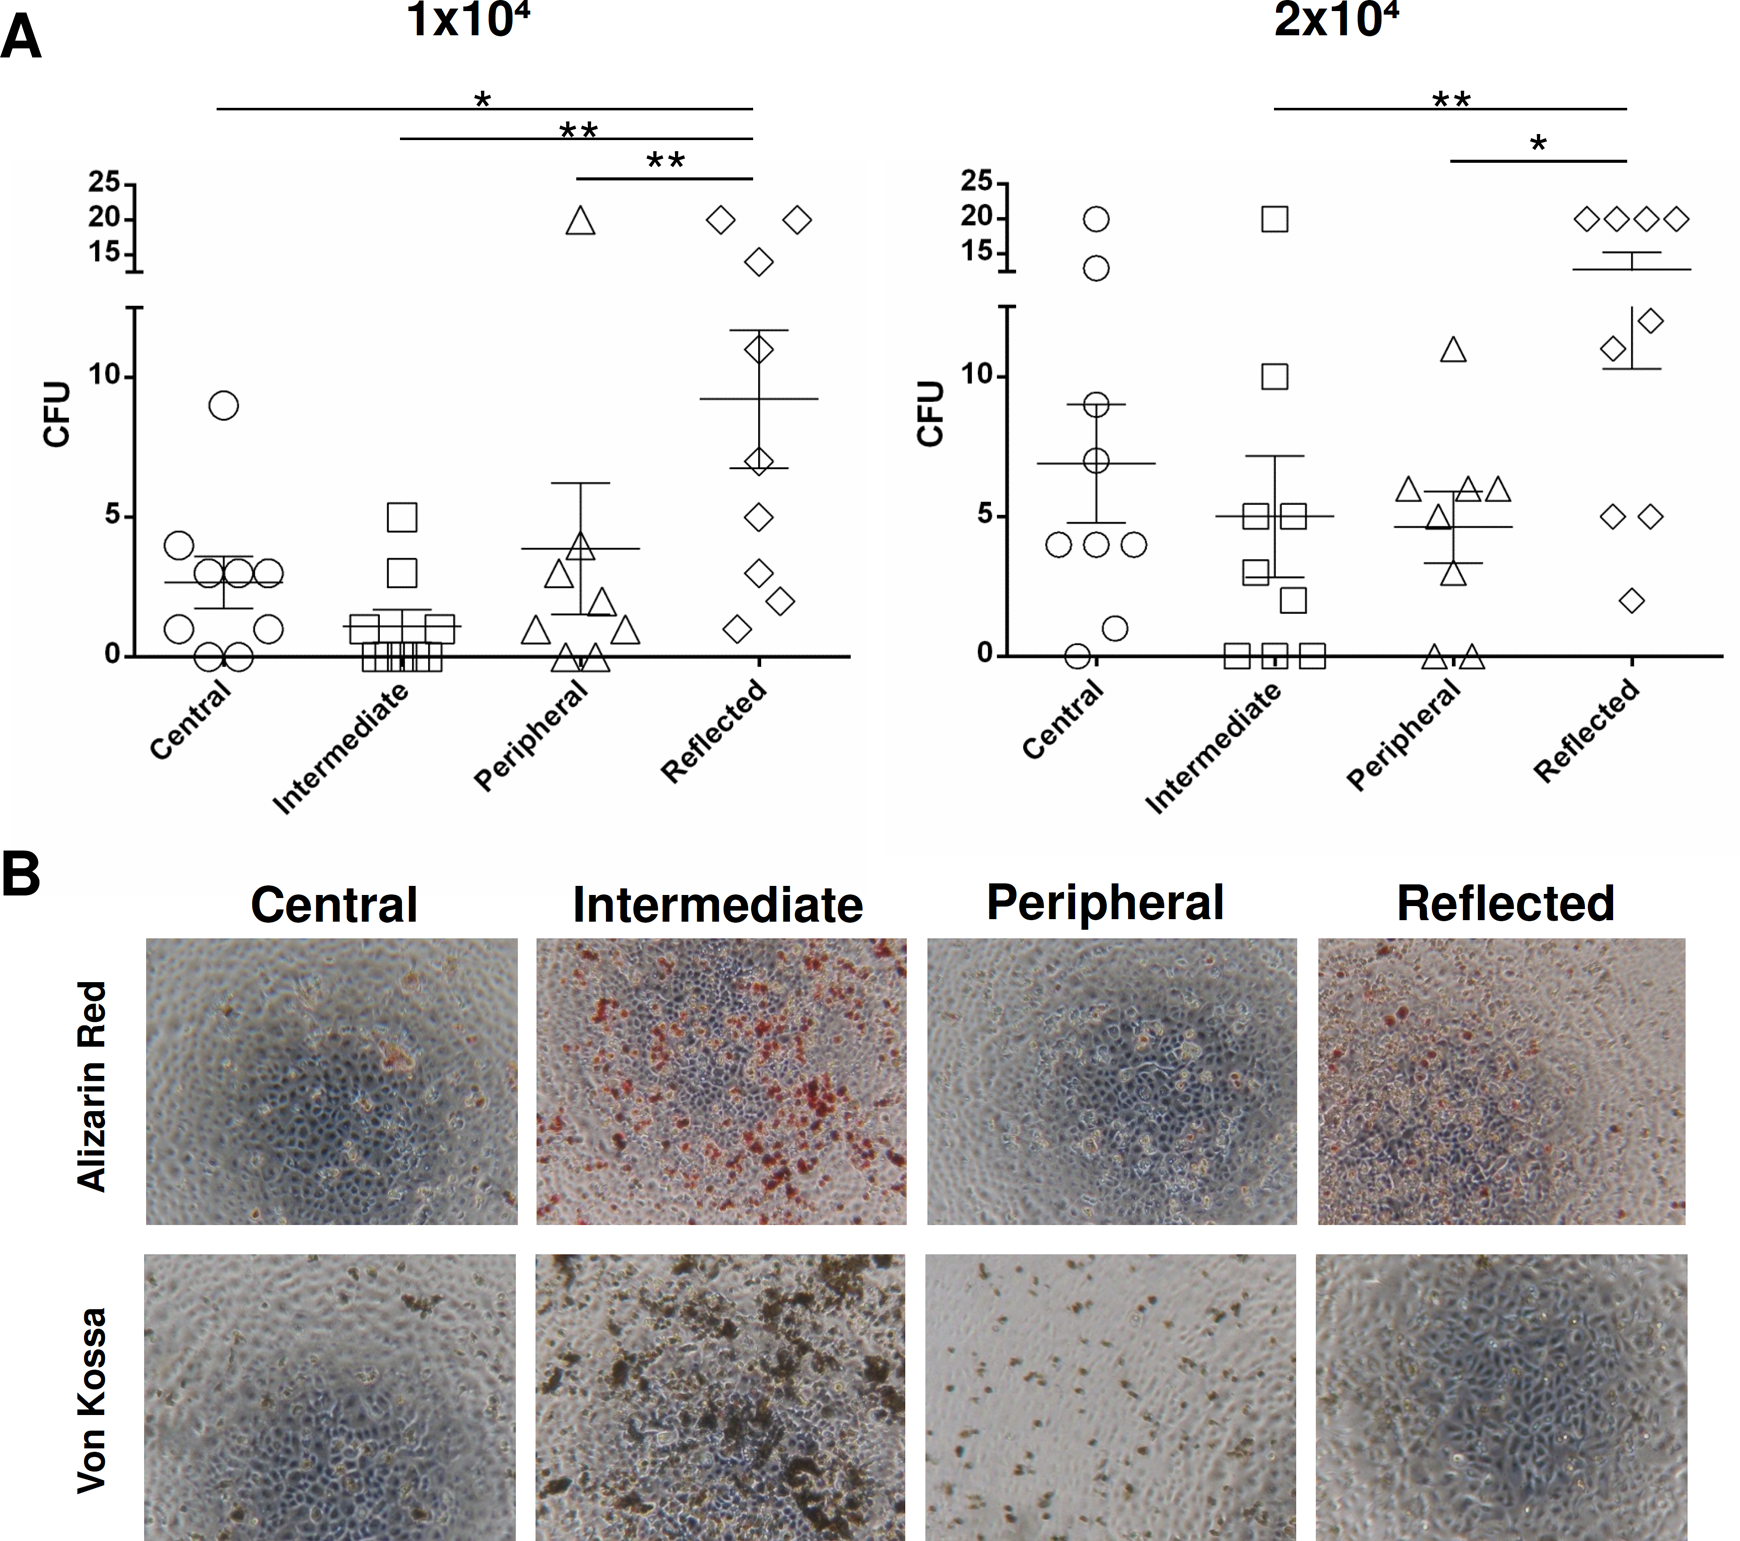
(A): Colony-forming unit assay of amniotic epithelial cells (AECs) isolated from different regions of the amniotic membrane: 1 × 10⁴ or 2 × 10⁴ AECs were seeded per well. Graphs represent mean and standard error mean (SEM). Statistical analysis was performed using GraphPad v6 by a 1-way analysis of variance followed by the Bonferroni multicomparisons test. (B) Osteogenic differentiation of AECs isolated from different regions of the amniotic membrane. Representative images of osteogenic differentiation of AECs evaluated through calcium deposit staining with Alizarin red and Von Kossa staining methods (original magnification: ×4).
Osteogenic Differentiation of AECs from Different Regions of the AM
AECs were also investigated for their capacity to differentiate into osteoblasts through Alizarin red staining. AECs from all the 4 regions showed positive Alizarin red and Von Kossa staining, with the exception of the central and peripheral areas, which macroscopically had less positive staining (Fig. 4B). According to morphometric analysis, AECs were able to undergo osteogenic differentiation more in the intermediate area than in the other areas (Fig. 4B). The differentiation potential was also significantly higher in the reflected area, whereas the peripheral area (P < 0.05) showed the lowest osteogenic potential (Fig. 4B).
Discussion
Herein, we sought to map different areas of the human AM in situ and also characterize epithelial cells isolated from different regions of the AM. It has been widely recognized that AM can exert anti-inflammatory, antiangiogenic, antifibrotic, and antimicrobial effects 12,27 . A number of clinical studies have used the AM for applications in regenerative medicine 17,28 –30 , but it has yet to be elucidated whether the different areas of the placenta have the same plasticity and differentiation potential. One study has recently demonstrated that placental amnion possesses a slightly higher metabolic activity and significantly lower ROS content, when compared to reflected amnion, which could suggest diverse cell differentiation capacities between the 2 regions 20 . To map the AM in situ, we established 4 different regions according to their position relative to umbilical cord: the first area, closer to umbilical cord, was named the central area; the second, in the middle, was considered the intermediate area; the third was the peripheral area (all the 3 areas were part of the chorion frondosum); and the fourth, the reflected area, corresponded to the chorion laeve. Our results demonstrate the presence of a multilayered epithelium in different areas of the AM, except for the intermediate area, with a number of budding or detaching cells as well as apoptotic cells, especially in the central area. Remarkably, the central area, located near the umbilical cord, showed many morphological differences in comparison with other areas of AM. We evaluated the expression of different proteins and observed that the peripheral and reflected areas have the highest OCT-4 and SOX-2 expression in situ, well-known indicators of pluripotency. These observations are consistent with results obtained using CFU assays and have been shown in previous reports 31 –33 . Furthermore, the peripheral area also expressed the highest levels of CREB and its active form p-CREB, well known for its key role in a number of processes including proliferation, differentiation, and apoptosis 34 –36 . According to electron microscopy preparations, the AECs from the peripheral area display the highest quantity of lipid granules in the cytoplasm. Although further studies are needed to characterize granule content, our findings suggest that this area could be the most capable of immune-modulatory effects since a number of reports have attributed these effects to prostaglandin E secretion by AM 37,38 . Interestingly, high levels of α-fetoprotein were found in the central area and, to a lesser extent, in the peripheral area, suggesting that these areas could be more prone to hepatic differentiation. There are a number of published studies demonstrating the capability for AECs to differentiate into hepatocytes in vitro and in vivo and their translational use in the treatment of hepatic diseases 24,39,40 . We can speculate that enhanced effects could be obtained by inducing hepatocyte differentiation using an enriched population selected from the central area of the AM. To characterize the differentiation potential of the different areas of the AM, AECs were first isolated and phenotypically characterized demonstrating the expression of typical epithelial cell markers (CD324, CD326, and CD73) as well as of embryonic markers (SSEA-4 and TRA-1-60) with no significant differences among the different areas. This finding could suggest that AECs are a relatively homogeneous population, at least at the cell surface antigen level or rather that the technical procedures used herein to isolate AECs from AM could in some way artifactually unify the phenotypic pattern. Actually, when induced osteogenically, AECs from the intermediate area showed the highest osteogenic potential in terms of in vitro mineralization assays. This feature has already been demonstrated by other authors concerning the whole AM 41 –44 together with the capability to differentiate into cells derived from all the 3 germ layers both in vitro and in vivo.
Our innovative findings highlight that AECs belonging to the AM are a heterogeneous stem cell population since they display (i) different expression of pluripotency and proliferation (OCT-4, c-KIT, SOX-2, α-fetoprotein, CREB, and p-CREB) markers, (ii) different proliferation capability, and (iii) different osteogenic potential in the different areas. This should be taken into account to increase efficiency of AM application within a therapeutic context.
Conclusion
Our study is the first to perform a detailed in situ phenotypic mapping of AM of human placenta and to demonstrate that epithelial cells in different areas of AM possess different characteristics. In fact, AECs from 4 distinct areas of AM have different morphology, expression of pluripotency markers and differentiation capabilities. On the one hand, this study consolidates the evidence of the already reported heterogeneity of the AEC population. On the other hand, our study provides important information on cell localization and distinct features which can be attributed to these cells and, if demonstrated to correlate with different therapeutic potential, could suggest the use of cells from a specific region described herein for regenerative medicine purposes.
Supplemental Material
Supplemental Material, supp - Mapping of the Human Placenta: Experimental Evidence of Amniotic Epithelial Cell Heterogeneity
Supplemental Material, supp for Mapping of the Human Placenta: Experimental Evidence of Amniotic Epithelial Cell Heterogeneity by Lucia Centurione, Francesca Passaretta, Maria Antonietta Centurione, Silvia De Munari, Elsa Vertua, Antonietta Silini, Marco Liberati1, Ornella Parolini, and Roberta Di Pietro in Cell Transplantation
Footnotes
Authors’ Note
Lucia Centurione and Francesca Passaretta contributed equally to this work.
Acknowledgments
The authors wish to thank Dr. Fabio Marongiu for helpful discussions. We thank all the amniotic membrane donors and the Hospitals of Chieti and Brescia for their kind cooperation.
Author Contributions
L. Centurione contributed to conception and design and collection of data; F. Passaretta contributed to collection of data and manuscript writing; M. Antonietta Centurione contributed to collection of data; S. De Munari performed experiments; E. Vertua performed experiments; A. Silini contributed to data analysis and manuscript preparation; M. Liberati contributed to helping in the provision of amniotic membrane samples; O. Parolini contributed to data analysis and interpretation and final approval of the manuscript; R. Di Pietro contributed to data analysis and interpretation and manuscript critical revision.
Ethical Approval
This study was approved by our institutional review board.
Statement of Human and Animal Rights
Samples were collected after obtaining informed written consent according to the guidelines set by the Ethics Committee for the Institution of Catholic Hospitals or the G. d'Annunzio University of Chieti–Pescara.
Statement of Informed Consent
Samples were collected after obtaining informed written consent according to the guidelines set by the Ethics Committee for the Institution of Catholic Hospitals or the G. d'Annunzio University of Chieti–Pescara.
Declaration of Conflicting Interests
The author(s) declared no potential conflicts of interest with respect to the research, authorship, and/or publication of this article.
Funding
The author(s) disclosed receipt of the following financial support for the research, authorship, and/or publication of this article: This work was supported by MIUR (Italian Ministry of University and Research) funds granted to Professor Roberta Di Pietro in 2014 and 2015 and by Fondazione Poliambulanza-Istituto Ospedaliero, Brescia, Italy.
Supplemental Material
The online data supplements for this article are available online.
References
Supplementary Material
Please find the following supplemental material available below.
For Open Access articles published under a Creative Commons License, all supplemental material carries the same license as the article it is associated with.
For non-Open Access articles published, all supplemental material carries a non-exclusive license, and permission requests for re-use of supplemental material or any part of supplemental material shall be sent directly to the copyright owner as specified in the copyright notice associated with the article.