
Abstract
The impact of gestational age on mammalian neural progenitor cells is potentially important for both an understanding of neural development and the selection of donor cells for novel cell-based treatment strategies. In terms of the latter, it can be problematic to rely entirely on rodent models in which the gestational period is significantly shorter and the brain much smaller than is the case in humans. Here, we analyzed pig brain progenitor cells (pBPCs) harvested at 2 different gestational ages (E45 and E60) using gene expression profiles, obtained by microarray analysis and quantitative polymerase chain reaction (qPCR), across time in culture. Comparison of the global transcriptome of pBPCs from age-matched transgenic green flourescent protein (GFP)-expressing fetuses versus non-GFP-expressing fetuses did not reveal significant differences between the 2 cell types, whereas comparison between E45 and E60 pBPCs did show separation between the data sets by principle component analysis. Further examination by qPCR showed evidence of relative downregulation of proliferation markers and upregulation of glial markers in the gestationally older (E60) cells. Additional comparisons were made. This study provides evidence of age-related changes in the gene expression of cultured fetal porcine neural progenitors that are potentially relevant to the role of these cells during development and as donor cells for transplantation studies.
Introduction
Cells proliferate for a time during development before exiting the cell cycle and undergoing terminal differentiation into mature cell types. Various studies have examined different aspects of gene expression during the developmental process in utero, for instance, signaling pathways related to myogenesis in fetal pigs 1 and related to growth factor expression in rat retinal progenitor cells. 2 Focusing on neural development in the pig, brain development in this species serves as both a model of large animal cortical brain development 3 and a viable source of proliferative stem or progenitor cells. 4 When derived from green fluorescent protein (GFP) transgenic sources, these cells are of great interest for use in transplantation studies. Nevertheless, questions remain about the equivalence of GFP-expressing versus non-GFP-expressing cells, as well as the equivalence of such cells derived from tissue of different gestational ages and grown for different lengths of time under different culture conditions. Whole-genome expression analysis of cells derived from the developing porcine brain has lagged behind other species, due to a variety of challenges, despite the advantages of swine as a large animal model.
In addition to changes related to developmental age, proliferating cells in culture can also change their genetic expression over time, and eventually senesce. Studies of various cell lines, such as human retinal pigment epithelial cells, 5 human brain progenitor cells, 6 and even mouse germ cells, 7 have shown varying degrees of senescence with time in culture, accompanied by changes in the gene expression profile. One set of genes that are activated as cells senesce are checkpoint genes that regulate the mitotic cycle, in addition to other genes being turned on or off that are cell type–specific. Activation of the p53 gene in particular has been noted to relate to the length of time cells remain in culture, possibly as a result of aggregate DNA damage from stressors in the culture environment. 8 It therefore becomes important to determine the number of passages permissible for a cell in culture before the p53 apoptotic pathway activates since that can compromise potential therapeutic effects following transplantation.
One means of slowing the rate of senescence is by altering culture media conditions. The addition of growth or trophic factors is important for maintaining cell proliferation in the absence of serum and is one way of limiting the rate of differentiation and senescence in progenitor cell populations. One study 6 on human brain progenitor cells found that addition of leukemia inhibitory factor (LIF) inhibited the observed cellular senescence versus non-LIF-treated cultures. Another culture medium that has been purported to help maintain neural cells in culture is UltraCULTURE serum-free medium (UL). Several studies have used UL as the preferred medium, 9,10 but little has been published regarding the efficacy of UL in comparison to other culture media.
In the present study, we analyzed pig brain progenitor cells (pBPCs) based on gene expression across time in culture. Comparisons included GFP transgenic versus non-GFP-expressing E45 pBPCs, as well as E45 versus E60 pBPCs. A further comparison was between E45 pBPCs treated in either UL or another serum-free medium. The impact of time in culture was also examined.
Materials and Methods
Donor Animals
Fetal pigs were harvested from timed-pregnant sows at gestational ages of 45 and 60 d. Donor sows were under general anesthesia and terminated without waking. The process was performed in accordance with the National Institutes of Health Guide for the Care and Use of Laboratory Animals (NIH Publications No. 80-23, revised 1978). GFP-expressing and non-GFP-expressing fetuses were collected from each sow and sorted using UV illumination. The GFP transgenic swine line 11 used was NT5, developed and provided by the National Swine Resource and Research Center (University of Missouri, Columbia, MO, USA) (RRID: NSRRC_0010). All live animal work was performed in accordance with Institutional Animal Care and Use Committee (IACUC) -approved protocols and in compliance with NIH and institutional guidelines (University of Missouri, Columbia, MO, USA).
Cell Isolation and Culture
Fetal pigs were transported on ice to the laboratory and dissected in a laminar flow hood approximately 8 h after extraction from maternal donor. The cranium was opened and the forebrain removed. Forebrains were broken up mechanically, followed by digestion in 0.05% TrypLE™ Express (Invitrogen, Carlsbad, CA, USA) for 5 min at 37°C. Tissue fragments were gently triturated using a 1-mL fire-polished glass pasteur pipette to release single cells and then repeating this process for 2 cycles. The resulting cell suspension of pBPCs was centrifuged at 1,000 rpm for 5 min and then resuspended in fresh culture medium comprised of standard medium (SM; Dulbecco’s modified eagle medium: nutrient mixture F-12 [DMEM/F-12 Invitrogen] with 2 mM GlutaMAX [Invitrogen], N2 supplement [1%; Invitrogen], 20 ng/mL epidermal growth factor [EGF; Invitrogen], 20 ng/mL basic fibroblast growth factor [bFGF; Invitrogen], and 50 U/mL penicillin–streptomycin [Invitrogen]). Cell viability was assessed with trypan blue (Sigma-Aldrich, MO, USA), and cells were plated in uncoated 75-cm 2 flasks at a cell density of 6.7 × 10 4 /cm 2 , followed by incubation at 37°C under 5% CO2. Five percent fetal bovine serum (FBS) was included in the medium overnight to promote cellular viability and adherence. Thereafter, cells were cultured using either SM or UltraCulture Medium (UL) (UltraCULTURE serum-free medium [Cambrex, East Rutherford, NJ, USA] with 2 mM GlutaMAX [Invitrogen], N2 supplement [1%, Invitrogen], 20 ng/mL EGF [Invitrogen], 20 ng/mL bFGF [Invitrogen], and 50 U/mL penicillin–streptomycin [Invitrogen]). Cells were fed by exchanging 90% of the medium for fresh medium every 2 d and passaged at 80% confluence, every 4 to 5 d, by using 0.05% TrypLE™ Express. Images of the cultured cells were recorded by using a Nikon inverted microscope, ECLIPSE TS100, with Nikon DXM1200C camera (Nikon, Tokyo, Japan).
RNA Extraction
Total RNA was extracted from E45 SM-treated nongreen pBPCs, E45 SM green pBPCs, E45 UL nongreen pBPCs, E45 UL green pBPCs, and E60 SM nongreen pBPCs. Samples were processed by using an RNeasy Mini kit (Qiagen, Germantown, MD, USA), following the manufacturer’s instructions for samples obtained at several experimental days in culture. RNA was quantified by spectrophotometer (ND-1000; NanoDrop Technologies, Inc., Wilmington, DE, USA), with optical density (OD) absorption ratio OD260 nm/OD280 nm of 2.00 to 2.10 and OD260 nm/OD230 nm of 2.00 to 2.20.
Microarray Analysis
RNA samples were checked for quality by transferring a small amount of each sample (100 ng/well) onto an RNA Lab-Chip® (Caliper Technologies Corp., Mountain View, CA, USA) for evaluation via an Agilent Bioanalyzer 2100 (Agilent Technologies, Palo Alto, CA, USA). Single-stranded, then double-stranded (ds), complementary DNA (cDNA) was synthesized from the poly(A)+ messenger RNA present in the isolated total RNA (5.0 μg total RNA starting material per sample) using the SuperScript ds cDNA synthesis kit (Invitrogen) and poly (T)-nucleotide primers that contained a sequence recognized by T7 RNA polymerase. A part of the resulting double-stranded cDNA was used as a template to generate biotin-tagged complementary RNA (cRNA) from an in vitro transcription reaction, using the Bioarray High Yield® RNA transcript labeling kit (T7; Enzo Diagnostics, Inc., Farmingdale, NY, USA). A 15 μg sample of the resulting biotin-tagged cRNA was fragmented into strands of 35 to 200 bases in length following prescribed protocols (Affymetrix GeneChip Expression Analysis Technical Manual). Subsequently, 10 μg of this fragmented target cRNA was hybridized at 45°C with rotation for 16 h (Affymetrix GeneChip Hybridization Oven 640) to probe sets present on an Affymetrix GeneChip Porcine Genome Array (Affymetrix, Santa Clara, CA, USA). The GeneChip arrays were washed and then stained (streptavidin phycoerythrin) on an Affymetrix Fluidics Station 450 and then scanned on an Affymetrix GeneChip 3000 Scanner 7G. The results were normalized by using the sketch-quantile method (Expression Console ver. 1.1 software; Affymetrix, Inc.).
Real-Time PCR Assay
Selection of candidate markers was based on the results from our previous work with cells of this type, along with potential relevance to the current study. Emphasis was placed on markers associated with immature cells of neural lineage, as well as markers for neural and glial differentiation. Constraints imposed by species specificity limit the individual markers available for work on porcine material. The gene-specific primers used in this study are shown in Supplemental Table 1.
Genes of Interest in the E60 pBPCs in SM Normalized to the E45 pBPC Cell Line in SM.

Abbreviations: pBPC, pig brain progenitor cells; SM, standard medium; CNS, central nervous system.
Two micrograms of total RNA from the sample preparation were reverse-transcribed with Omniscript® reverse transcriptase kit (Qiagen) and 10 µM random primers (Sigma), according to the manufacturer’s instructions. Quantitative PCR was performed by using a 7500 Fast Real-Time PCR System (Applied Biosystems, Irvine, CA, USA) using Power SYBR Green (Applied Biosystems). Resolution of the product of interest from nonspecific product amplification was achieved by melting curve analysis. β-Actin was used as an endogenous control to normalize gene expression. The following real-time PCR protocol was used: denaturation program (95°C for 10 min), quantification program (95°C 15 sec and 60°C 1 min) repeated 40 cycles, melting curve program (95°C 15 s and 60°C 1 min with continuous fluorescence measurements), and finally a cooling program down to 40°C. Each reaction was performed in triplicate.
Statistical Analyses
Microarray data were evaluated using Extraction of Differential Gene Expression software version 1.0 (University of Washington, Seattle, WA, USA) as a time course study using a bootstrap method, 12 with a false-discovery rate (FDR) cutoff of α < 0.05. 13 The resulting data table was annotated using the annotation by Tsai et al. 14 Graphs of single cell line time courses and principal component analysis (PCA) of comparisons between cell lines were run in JMP Genomics 4.1 (SAS Americas, Cary, NC, USA). Time course cluster graphs of each cell line were generated in Expander 5.1 (Tel Aviv University, Tel Aviv, Israel) using the Cluster identification via connectivity kernels (CLICK) analysis method, as this analysis does not make any prior assumptions about the underlying structure of the data, 15 and clusters are numbered based on the size of the cluster. Individual gene expression changes were considered significant when fold change > |±2-fold| and α < 0.05.
PCR analyses were performed by the ΔΔCt method (7500 Fast System software 1.4 and DataAssist 2.0; Applied Biosystems), and graphs were generated using JMP software 4.1 (SAS Americas). All data points are expressed as mean ± standard error (SE). Statistical difference was determined using a Student’s t test. Data were considered significantly different when P < 0.05.
Results
E45 GFP Transgenic versus Nontransgenic (Wild-Type Control)
Comparison of the E45-derived GFP transgenic cell cultures to the E45 nontransgenic cultures showed little change in gene expression between the 2 cell populations, regardless of treatment. A PCA comparing the GFP transgenic and wild-type cells showed no separation between data clusters for the cell populations (Fig. 1). Direct comparison of individual gene expression changes showed only 4 genes were upregulated in the E45 GFP transgenic pBPCs versus the nontransgenic cells and only 8 genes were downregulated. Upon splitting both the GFP transgenic and nontransgenic cells into SM-treated and UL-treated subgroups, a similar lack of substantial gene expression changes was observed. PCA for both the E45 GFP transgenic and nontransgenic cells in SM- versus UL-cultured groups did not show separation between the cell populations (data not shown). Direct comparison of significant gene expression changes also showed few changes: E45 cells grown in SM were compared to those grown in UL (including both GFP transgenic and nontransgenic cells in both cases). The cells grown in SM had 48 significant gene expression changes, and the cells grown in UL had 62 significant gene expression changes.
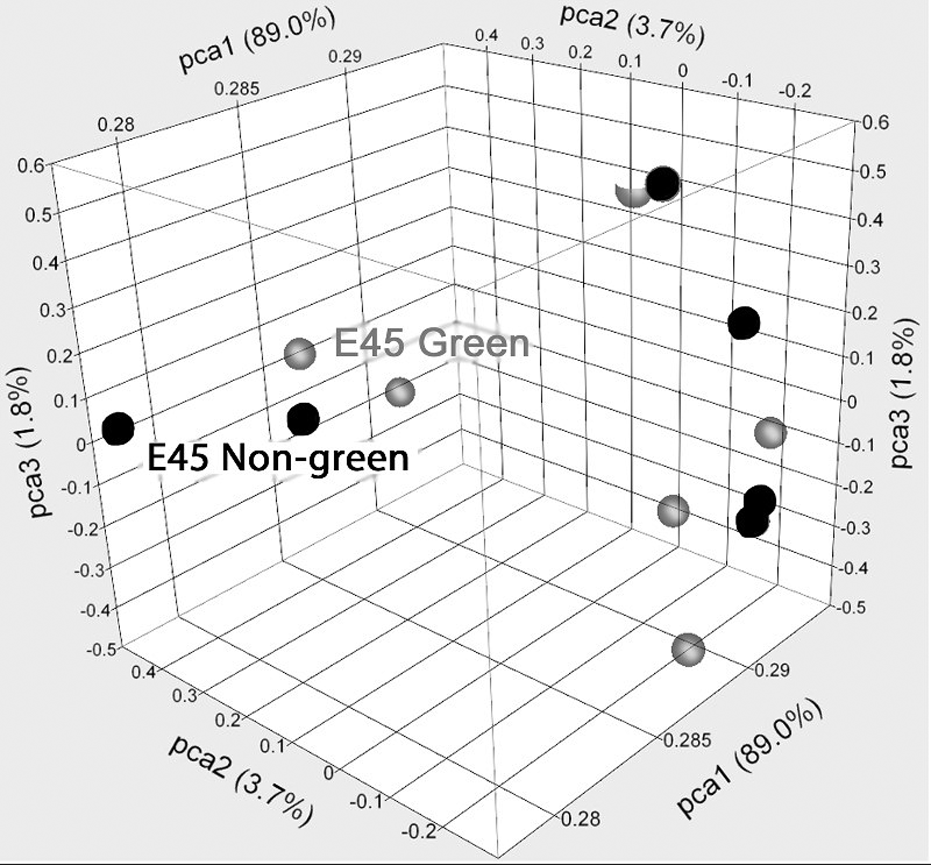
Principal component analysis of E45 GFP transgenic pBPCs versus E45 nontransgenic pBPCs, in both SM and UL. E45 GFP-transgenic pBPC is in green, and E45 nontransgenic pBPC is in red. SM, standard medium; pBPCs, pig brain progenitor cells.
BPCs Derived from E60 versus E45 Donor Tissue
Comparison of E60 versus E45 nontransgenic pBPC in SM showed separation between the 2 data sets by PCA (Fig. 2A), although the cells in culture appeared similar morphologically (data not shown). Direct comparison of gene expression for the E60 nontransgenic pBPCs versus the E45 nontransgenic pBPCs, both in SM, showed 372 significant changes with 171 genes upregulated and 201 downregulated. Several homeobox genes related to pattern formation during development were downregulated in the E60 compared to E45 cells (HOXA10, HOXB5, HOXB6, HOXB7, HOXD3; Table 1), as were several genes related to proliferation (CDK6, NEK6; Table 1) and metabolism (ATP5J, IDH3G, SLC2A2, Table 1). Analysis of marker expression using quantitative polymerase chain reaction (qPCR) showed that several proliferative progenitor cell markers were downregulated, particularly KLF4 and KI67 (Fig. 2B) in E60 versus E45, while the cell proliferation marker CLDN11 was upregulated (Fig. 2B). Two glial differentiation markers were upregulated (GFAP, MBP; Fig. 2B) in E60 versus E45, as were the signaling molecules CXCR4, JAK1, and STAT3 (Fig. 2B).
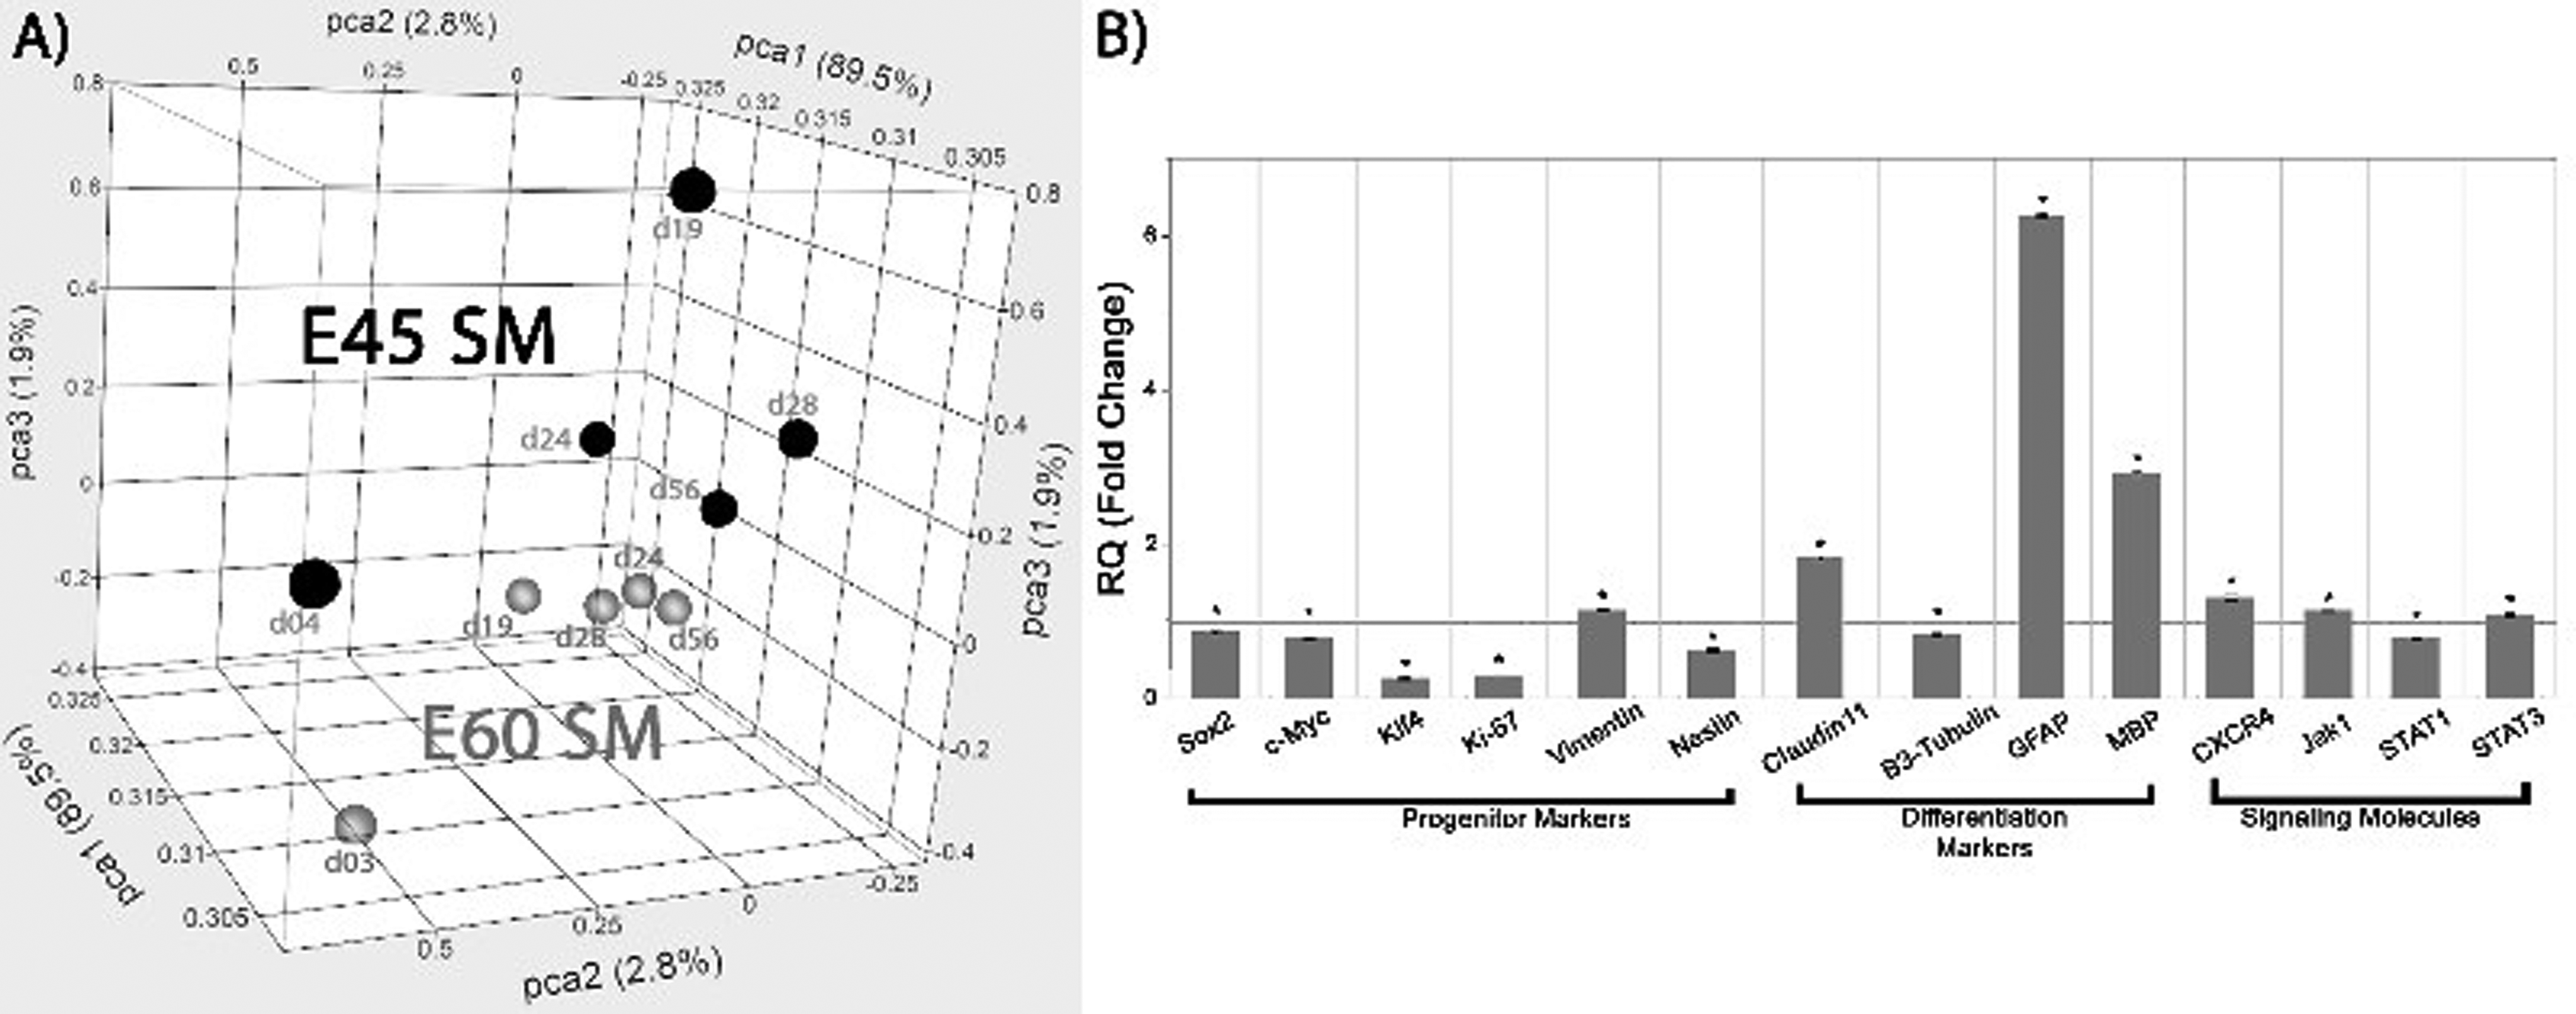
(A) Principal component analysis of E60 nontransgenic pBPC versus E45 nontransgenic pBPC, both in SM. E60 pBPC is in blue, and E45 pBPC is in red. (B) Quantitative real-time PCR analysis of select progenitor and differentiation markers between the E60 pBPCs in SM and E45 pBPCs in SM. Data are normalized to E45. Values greater than 1 indicate higher expression in E60 cells and values less than 1 indicate higher expression in E45 cells. The reference line at Relative Quantification (RQ) = 1 indicates no fold change difference. *P < 0.05 for E60 versus E45. SM, standard medium; pBPC, pig brain progenitor cells; PCR, polymerase chain reaction; pBPCs, pig brain progenitor cells.
E45 BPCs Grown in UltraCulture-Based Medium versus SM
Since there were no observed large-scale changes in the gene expression profile between the E45 GFP transgenic and nontransgenic cells, we treated both as similar replicates for comparing gene expression changes between SM and UL treatments of the E45 pBPCs. Cellular morphology of the E45 cells treated under SM conditions exhibited thin neurite process extensions and less confluence than the UL-treated cells, as the UL-treated cells exhibited much higher confluence and more rounded cellular morphology (Fig. 3). PCA comparison of the E45 pBPC SM and UL treatments did not show any clear separation between the 2 groups (Fig. 4A). However, direct gene analysis showed 521 genes with significant expression changes: 284 genes were upregulated and 237 were downregulated. Several genes related to cell cycle progression showed modest upregulation, while CCP110 is notably downregulated (Table 2). Genes related to neural lineage (TBR1; Table 2) and glia lineage (MBP, OMG; Table 2) were downregulated, while other developmental genes and lineage markers were upregulated (AQP4, BMP4, CHRDL1; Table 2). From the qPCR data, all lineage and progenitor markers were downregulated following UL treatment, particularly KLF4, CLDN11, and GFAP (Fig. 4B), as well as genes from the Janus kinase - signal transducer and activator of transcription (JAK-STAT) pathway (Fig. 4B), while only CXCR4 was upregulated (Fig. 4B).
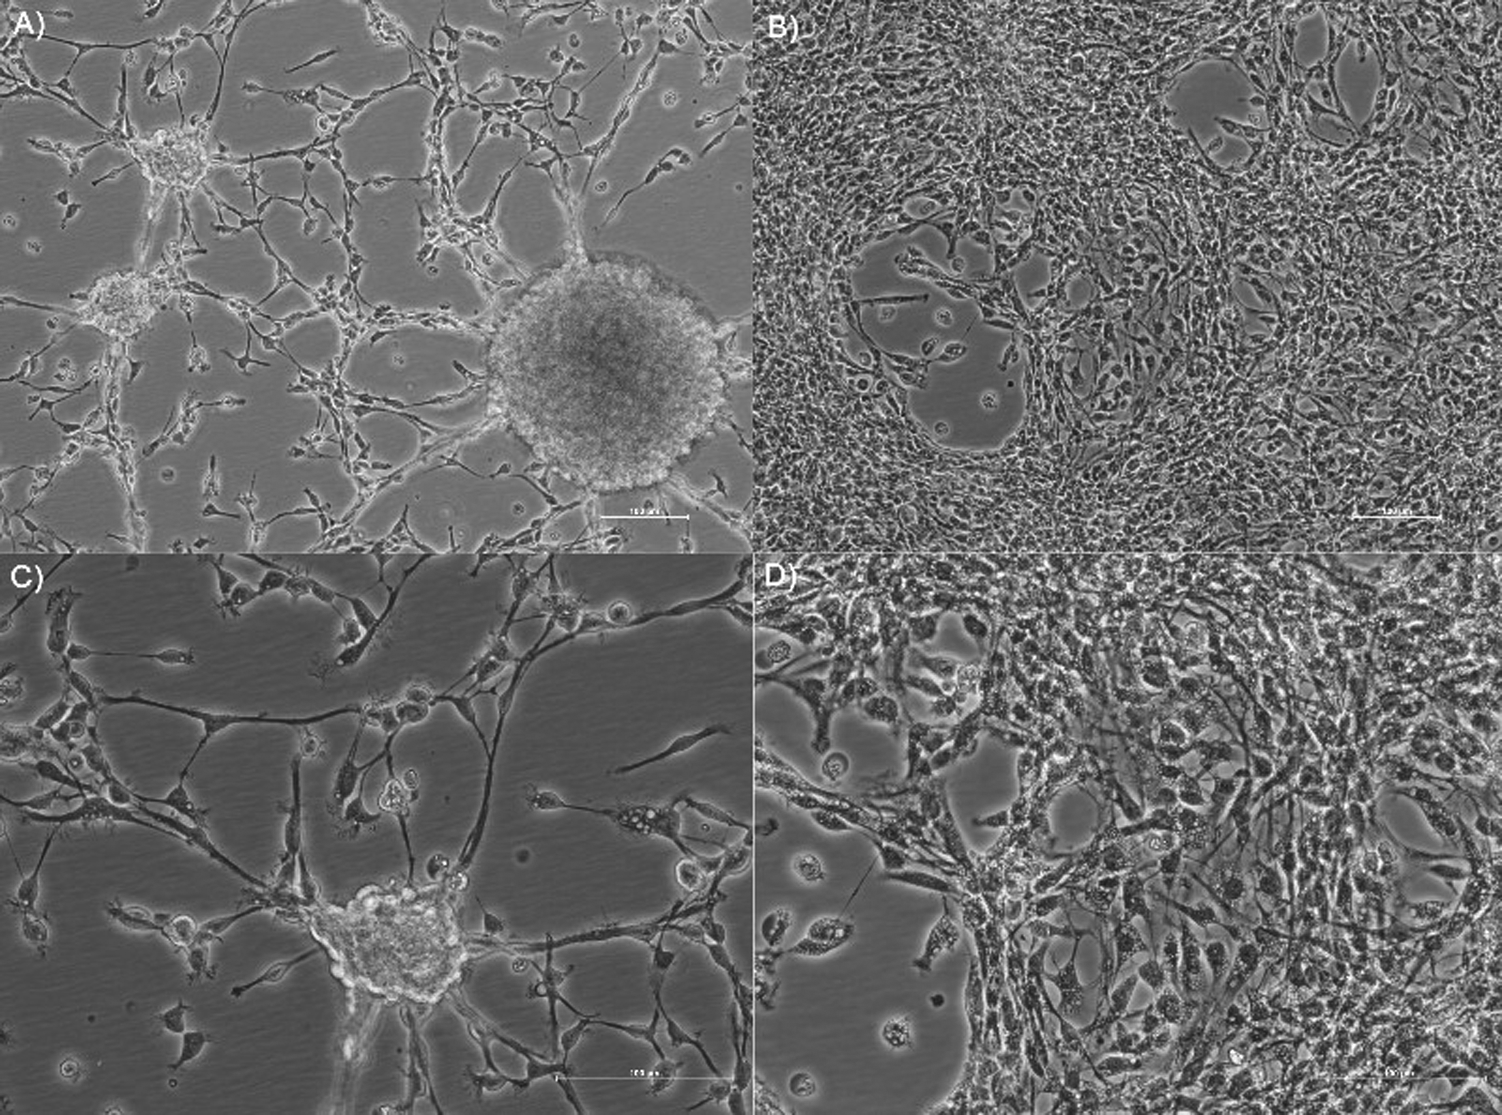
Image taken of E45 pBPC cells in SM (A) and UL (B) taken after 42 d in culture. Higher magnification of E45 pBPC cells in SM (C) and UL (D) is also shown. SM, standard medium; pBPC, pig brain progenitor cells.

(A) Principal component analysis of E45 pBPCs in UL versus E45 pBPCs in SM. E45 pBPC in UL is in blue, and E45 pBPC in SM is in green. (B) Quantitative real-time PCR analysis of select progenitor and differentiation markers between the E45 pBPCs in UL and SM. Data are normalized to E45 in SM. Values greater than 1 indicate higher expression in E45 UL-treated cells, and values below 1 indicate higher expression in E45 SM-treated cells. The reference line at Relative Quantification (RQ) = 1 indicates no fold change difference. *P < 0.05 for E45 UL versus SM. SM, standard medium; pBPC, pig brain progenitor cells; PCR, polymerase chain reaction; pBPCs, pig brain progenitor cells.
Genes of Interest in the E45 pBPCs (GFP-Transgenic and Nontransgenic Combined) in UL Normalized to SM.

Abbreviations: pBPC, pig brain progenitor cells; SM, standard medium; CNS, central nervous system.
Time Course Analysis of Individual Cell Lines
CLICK clustering analysis of the E45 pBPCs in SM showed the largest variance in gene expression between day 4 and day 28 among the 5 largest clusters (Fig. 5A). Analysis of individual gene expression changes over time for E45 pBPCs in SM showed a general downregulation of a few genes related to cell cycle (Table 3), while CDKN2A was upregulated (Table 3). Genes were related to synapse formation and neuronal cell structure (Table 3), while some glia-related genes were upregulated (Table 3).
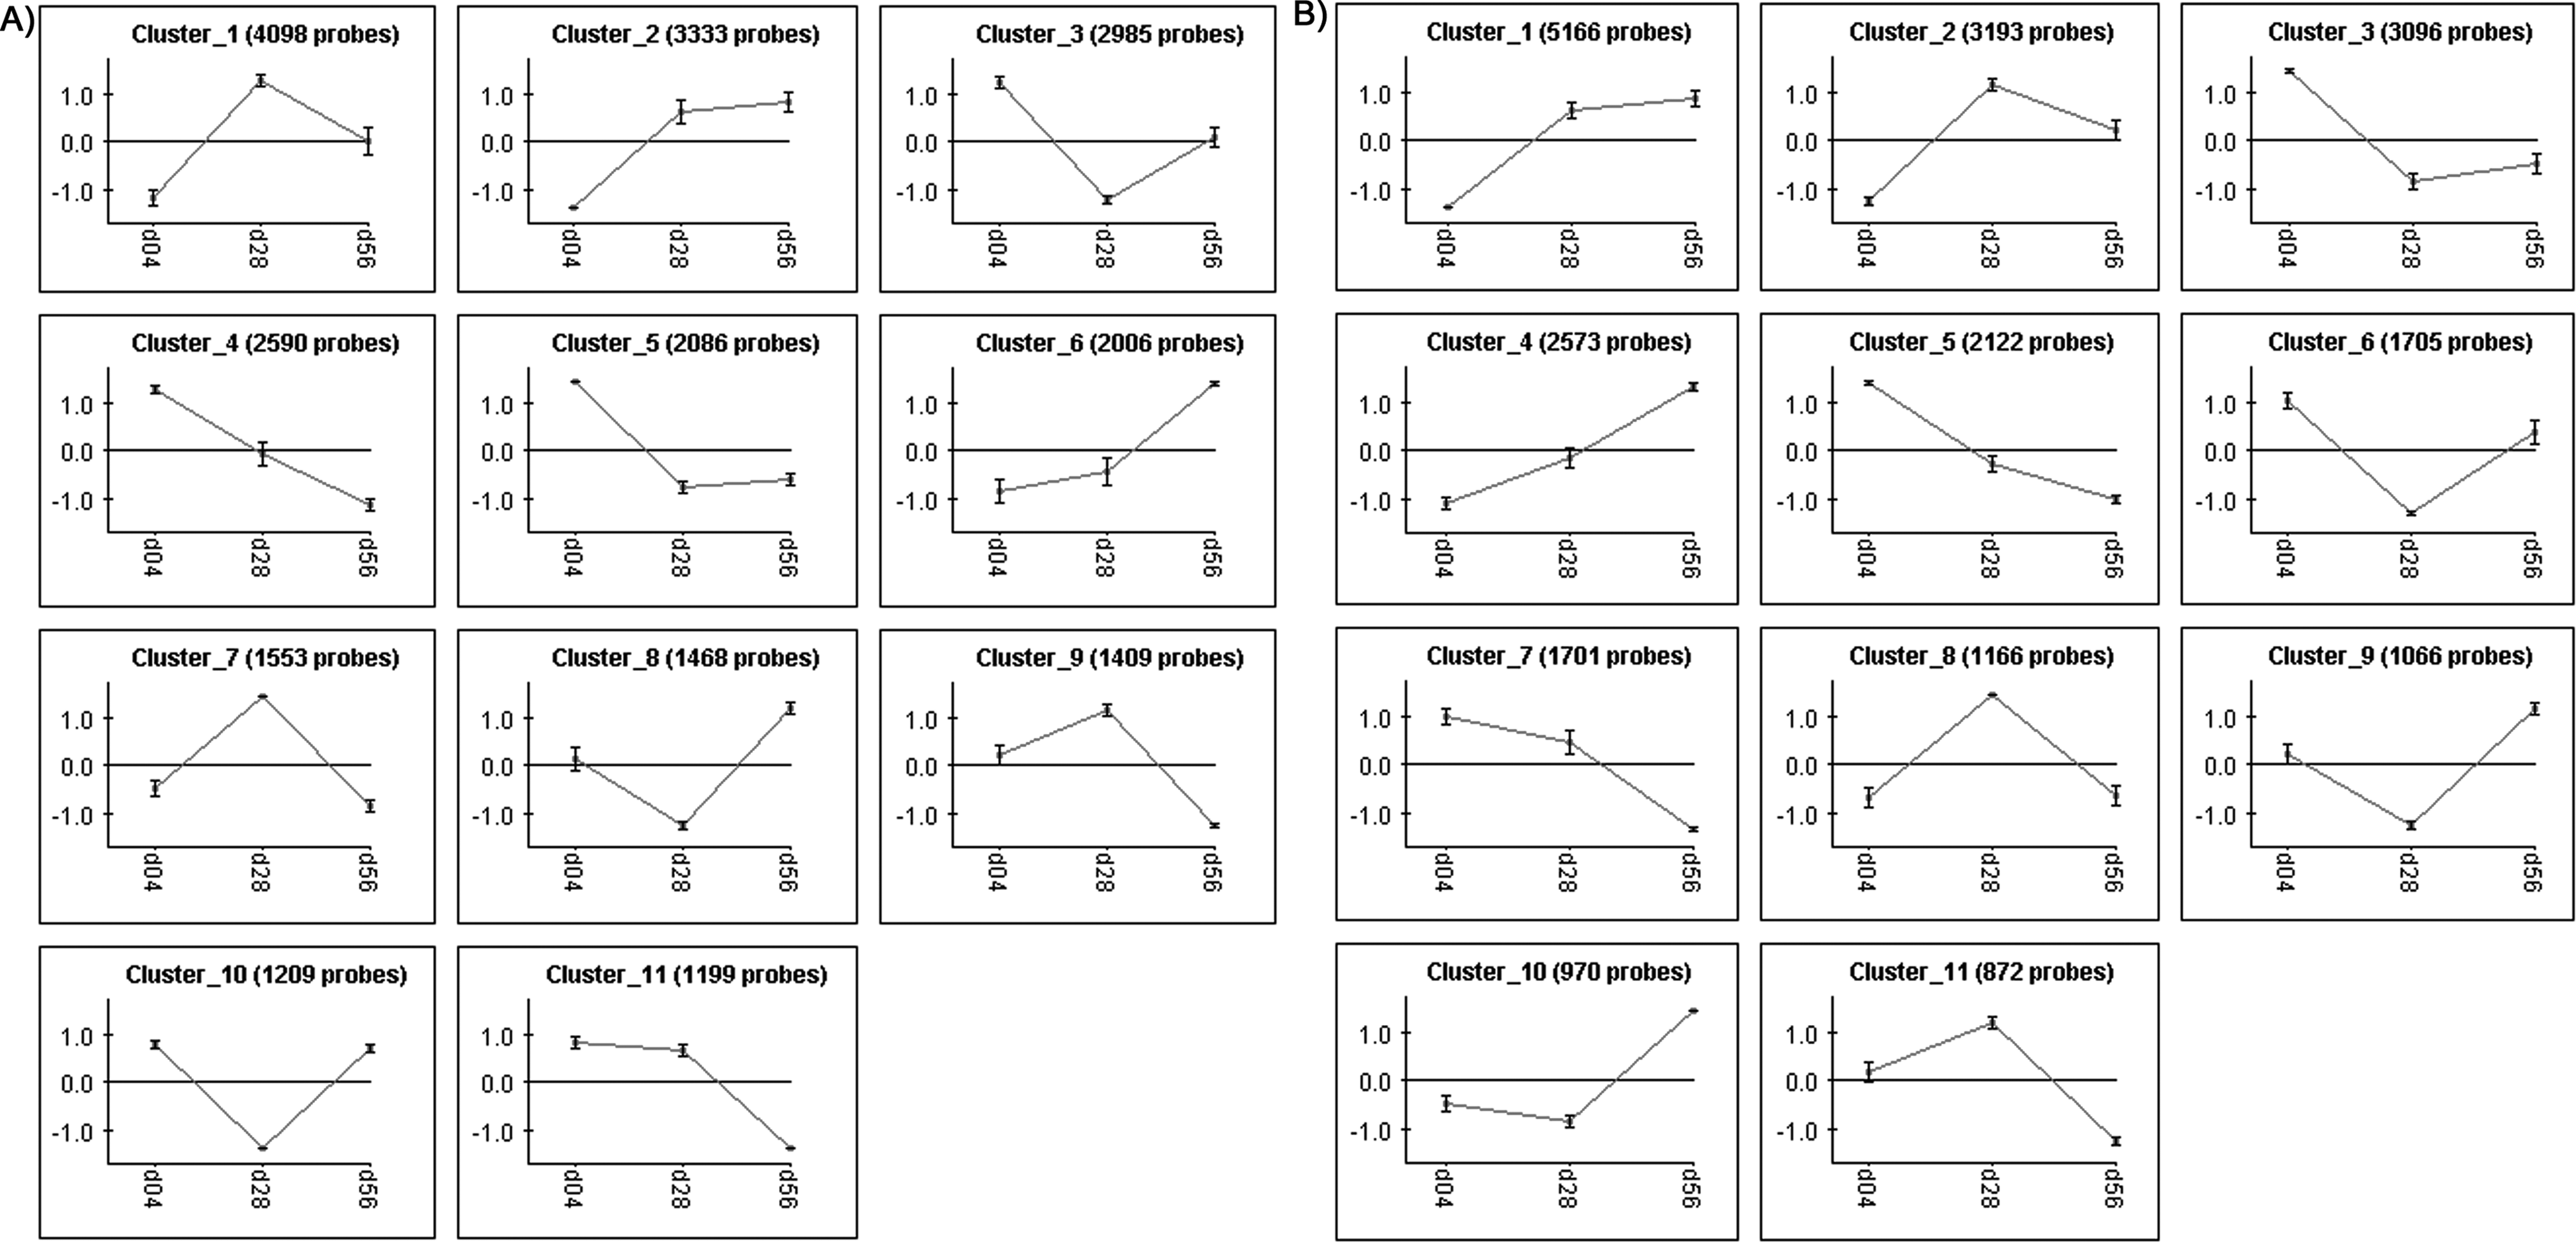
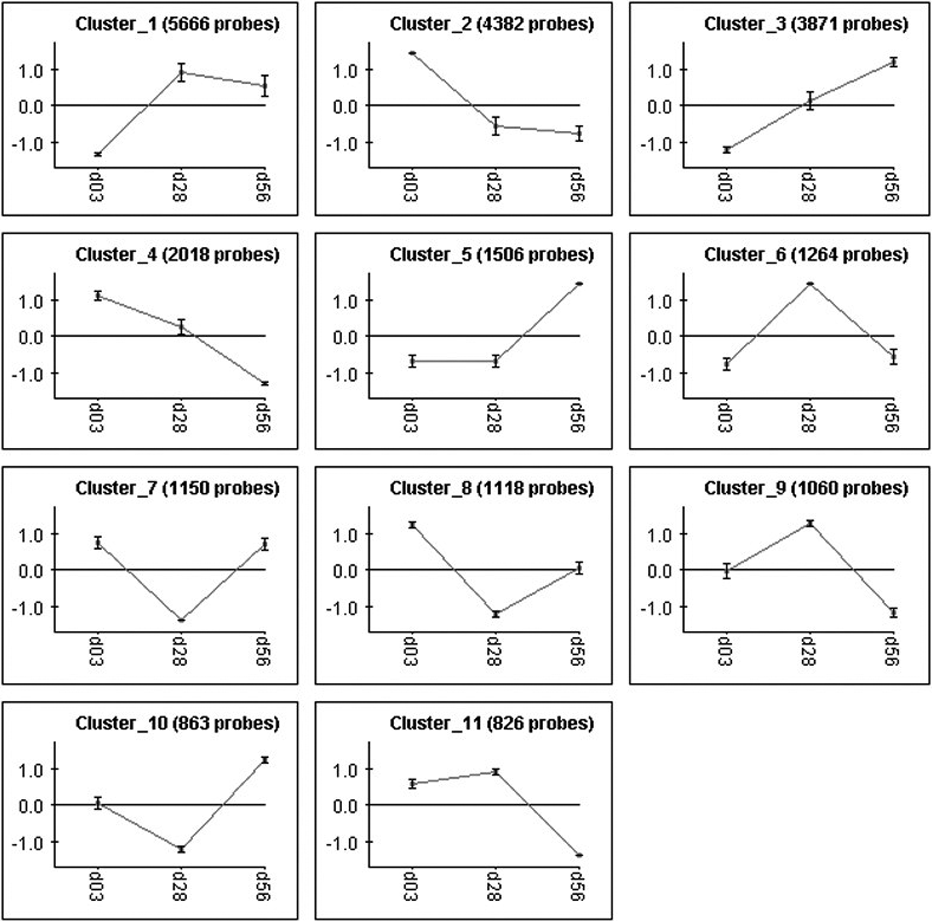
CLICK clustering analysis of E45 pBPCs in SM (A) and UL (B) with time. SM, standard medium; pBPCs, pig brain progenitor cells.
Time Course of the E45 Pig Brain Progenitor Cells.

Note. The time points day 28 and 56 are normalized to day 4. All genes listed with fold changes < |±2-fold| are not considered significant.
The E45 pBPC in UL cell line also showed the largest variance in gene expression between day 4 and day 28 among the 5 largest clusters from the CLICK clustering analysis (Fig. 5B). Expression of individual genes over time for the E45 pBPCs in UL showed downregulation of positive-regulating cell cycle genes and an upregulation of cyclin-dependent kinase inhibitor genes (Table 4) and some were downregulated (Table 4), while genes that are neuron-specific and related to synapse formation were generally downregulated (Table 4).
Time Course of the E45 Pig Brain Progenitor Cells in UL.
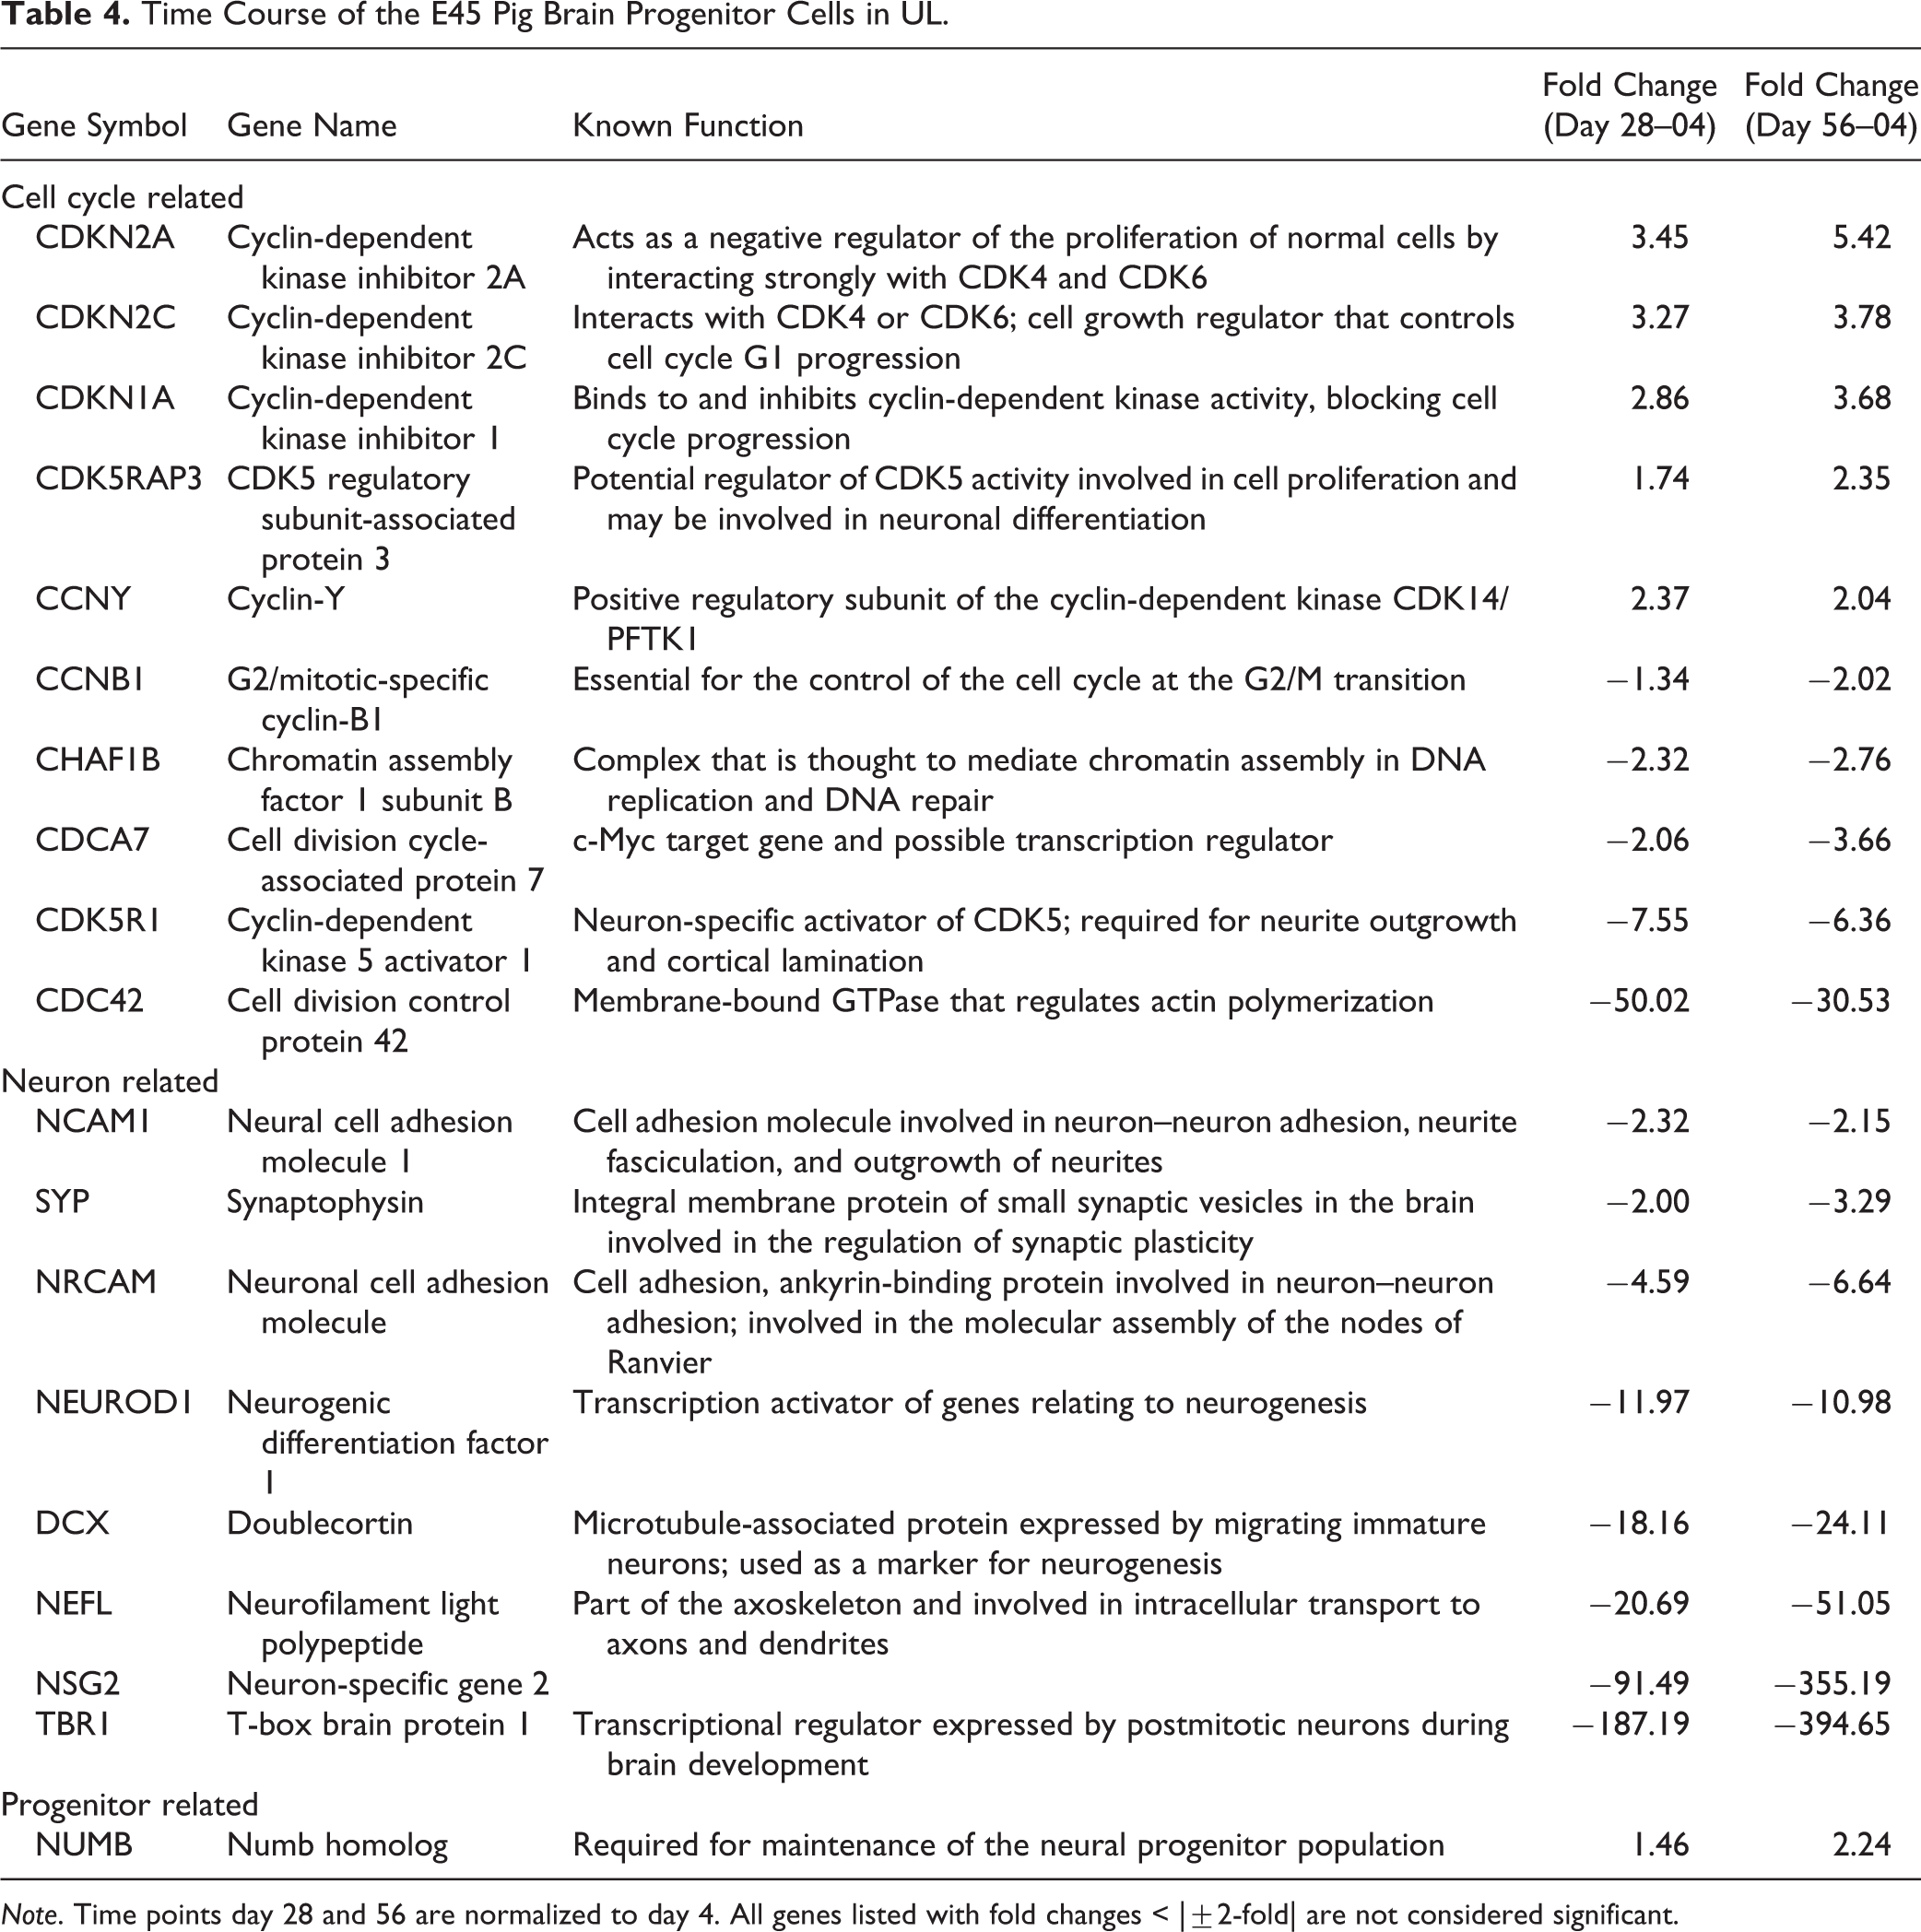
Note. Time points day 28 and 56 are normalized to day 4. All genes listed with fold changes < |±2-fold| are not considered significant.
The E60 pBPC in SM cell line also showed significant gene variance in the earlier time points for the 3 largest clusters from the CLICK analysis (Fig. 6), following a similar trend as the E45 cell lines. Genes related to neuronal expression, particularly GABRA4, HEY2, and LHX9, showed varying levels of downregulation (Table 5), while SOX8, a gene implicated in oligodendrocyte formation showed modest upregulation at both day 28 and 56 in culture (Table 5).
CLICK clustering analysis of E60 pBPCs with time. pBPCs, pig brain progenitor cells.
Time Course of the E60 Pig Brain Progenitor Cell Line in Standard Medium.

Note. Time points day 28 and 56 are normalized to day 3. All genes listed with fold changes < |±2-fold| are not considered significant.
Discussion
E60 pBPCs Are Slightly More Mature than E45 pBPCs
As cells in utero develop from proliferative pluripotent cells to more mature differentiated cells, the genetic expression of the cells changes based on which cell type it becomes. Our comparison of E60 pBPCs versus E45 pBPCs showed that most genes showed similar expression trends, and as such were not significantly distinguishable, although a few genes related to synapse formation and axon projections were upregulated in the microarray data and a few glial markers were upregulated in the qPCR data. Gene expression changes across gestational time points in embryonic mouse brain progenitor cells showed both similarities in markers across the embryonic time points and specific gene expressions at each time point. 16 Similar expression of most genes across gestation time was also observed in retinal progenitor cells in mice, 17 although a few genes related to more mature, differentiated retinal cells were upregulated in the later embryonic retinal progenitor cells. One study has compared E60 pBPCs to embryonic day 80 (E80) pBPCs, and they showed upregulation of MBP and a few other neural-specific genes such as neurogranin in the E80 cell line. 3 Furthermore, the downregulation of the several Hox genes coincides with expression patterns in Drosophila and mouse brain development, as the Hox genes are expressed early in development and are quickly restricted in expression thereafter. 18
Together, our results would then suggest that the E60 cell line, while not entirely distinct genetically from the E45 cell line, is taking on more of a glial fate. The large upregulation of JAK1 and STAT3, which are part of the JAK-STAT pathway that has been implicated in gliogenesis, 19,20 and the mature glial lineage markers GFAP 21,22 and MBP 23,24 would suggest more of a tendency of E60 pBPCs to form glial cells than E45 pBPCs. This tendency for neural progenitor cells to switch to more of a glial fate with time in development has been observed in older fetal-derived 25 and adult stem cell populations. 26 More so, the upregulation of Claudin 11, a proliferating oligodendrocyte marker, 27,28 in the E60 pBPCs suggests that this cell line still possesses a progenitor cell capacity in addition to showing signs of differentiating. Yet while the E60 pBPC cell line shows more glia potential, this does not exclude the cells from forming neurons as previous studies have shown that GFAP-positive proliferating radial glia and astrocytes can differentiate into mature neurons. 29 –31
UltraCULTURE Medium Shows Little Added Benefit for Porcine BPCs In Vitro
UL has been shown to provide benefits for certain cell lines in vitro, 32,35 but its efficacy on stem or progenitor cells has not been studied fully. Human mesenchymal stem cells were shown to exhibit some improved proliferation and survival in vitro when cultured with UL versus other serum-free media. 32 Our findings would suggest a similar result visually in culture and at the gene expression level but also that UL treatment appears to inhibit expression of differentiation markers, as we observed several mature genes were downregulated. Some mature neuronal and glial markers were downregulated in the UL treatment, such as MBP, TBR1, and OMG (Table 2), as were all lineage markers from the qPCR analysis, particularly CLDN11, GFAP, and KLF4. The nominal upregulation of several cell cycle–related genes would suggest that UL promotes higher cellular proliferation in comparison to other culture media, which has been observed in adipocyte progenitor cells of porcine and other similar mammalian species (Schwarz et al., 2012), 33 and we have observed similar long-term proliferation of feline neural progenitor cells under similar culture conditions (Yang et al., 2012). 34 The significance of increased expression of CXCR4 is less straightforward since this gene is both a marker on neural progenitor cells 36 and yet also increases in expression during the course differentiation, at least in vitro. 35 As a serum-free medium, UL is beneficial over serum-containing media, such as fetal bovine serum in terms of being a defined medium that minimizes lot variances, 35 and might also promote stem/progenitor cell maintenance in vitro.
One concern, however, is the downregulation of CCP110 that we observed following UL treatment compared to SM treatment. CCP110 is involved in centrosome formation during cytokinesis, and inhibition of CCP110 has been linked to improper karyotype numbers. 36 Coupled with the increased cell cycle gene expression and high confluence in the culture image, the downregulation of CCP110 raises some concerns about potential transformation of pBPCs cultured over longer periods of time in UL.
GFP Transgenic pBPCs Have Similar Genetic Expression to Non-GFP pBPCs
Tagging transplanted cells with a fluorescent protein such as GFP has been one way to track transplanted cells without relying on a histological stain or antibody. This technique is particularly useful for tracking stem or progenitor cells in vivo, as these cells tend to migrate and differentiate based on the cellular environment within the transplanted area of the host. 37 –39 Stem cells labeled by transfection with GFP or other markers have been transplanted into various animal models of human pathological conditions, such as Parkinson's disease, 40 retinal dystrophy, 41 and ischemic stroke. 42 Hence, there is a question of whether the transfection affects the overall integrity of the genome expression, as expression of GFP in cardiomyocytes was shown to affect several metabolic and signaling pathways but did not affect cell viability. 43 Our present study shows no significant changes from the GFP transfection, as E45 GFP transgenic pBPCs cultured in either SM or UL show few significant changes in gene expression compared to E45 nontransgenic pBPCs.
pBPCs Are Stable In Vitro Over Time
Analysis of each of the 5 cell lines over time shows only modest alteration of the genetic expression profile for each respective cell line. Most gene expression changes we observed occurred during the time between the first time point in culture (day 3 for the E60 line and day 4 for the E45 cell lines) and the next time point in sampled (either day 19 or 28), suggesting that most of the early gene changes are due to the cells adjusting from a tissue environment to a culture environment. A study by Venezia et al. 44 of hematopoietic stem cells over time in vitro showed that the most dramatic gene expression changes, either through upregulation or downregulation, occurred within the first 10 d in culture.
Unlike E60 pBPCs, the E45 cell line in both UL and SM showed changes in cell cycle–related genes, particularly a downregulation of positive cell cycle genes and an upregulation of cell cycle–inhibiting genes. This would suggest then that the cells in both media are beginning to slow down the rate of cell cycle proliferation, as cyclins and cyclin-dependent kinases are expressed by proliferating stem cells. 45,46 Another gene, TP53, is a classic gene for cell cycle inhibition and pro-apoptotic signaling that is upregulated over time as cells start to senesce. 47,48 The lack of TP53 expression change would then suggest that the E45 cell line has not started to senesce by day 56 in culture but are merely less proliferative.
In terms of differentiation marker expression, E45 pBPCs in SM appear to take on a glia cell fate in vitro over time, while E45 pBPCs in UL appear to maintain a progenitor fate with time. Both culture media treatments showed a decrease in neuron-specific genes in the E45 pBPC with time, such as DCX, TUBB3, NEUROD1, and TBR1, all of which are expressed by cells committed to a neuronal fate during development. 49 –52 However, unlike the UL-treated cells, the SM-treated E45 pBPCs showed an upregulation of several glia-specific genes such as MBP and OLIG2, suggesting that the SM treatment over time induces the E45 pBPCs toward a glial cell fate, while UL treatment does not due to the lack of any change in glia-related gene expression. Over time in culture, neural stem/progenitor cells tend to lose their neurogenic potential 53 and instead become more gliogenic, 54,55 suggesting that what we observe in the E45 pBPC in SM is the beginning stages of this determination into a glia-restricted fate over time in culture. Clearly, this fate restriction of BPCs has implications for the use of cultured progenitor cells, particularly in terms of suitability for neuron replacement strategies.
Footnotes
Acknowledgments
The authors are grateful for the participation of the National Swine Resource and Research Center (U42 OC011140) and support from the Lincy Foundation and the Polly and Michael Smith Foundation.
Ethical Approval
This study was performed in accordance with Institutional Animal Care and Use Committee (IACUC)-approved protocols and in compliance with NIH and institutional guidelines (University of Missouri, Columbia, MO, USA).
Statement of Human and Animal Rights
This article does not contain any studies with human subjects. Animal subjects were tested in accordance with the National Institutes of Health Guide for the Care and Use of Laboratory Animals (NIH Publications No. 80-23, revised 1978), and IACUC-approved protocols.
Statement of Informed Consent
There are no human subjects in this article and informed consent is not applicable.
Declaration of Conflicting Interests
The author(s) declared the following potential conflicts of interest with respect to the research, authorship, and/or publication of this article: Henry Klassen and Jing Yang have an equity interest in jCyte, Inc., a company that may potentially benefit from the research results presented. They also serve on the company’s board. The terms of this arrangement have been reviewed and approved by the University of California, Irvine, in accordance with its conflict of interest policies.
Funding
The author(s) disclosed receipt of the following financial support for the research, authorship, and/or publication of this article: Research was supported in part by an RPB unrestricted grant.
Supplemental Material
Supplementary material is available for this article online.