
Abstract
Online videos are a popular medium for science communication. These videos can be presented from many perspectives, including scientists sharing their own work or a third-party presenting research findings. A mixed between- and within-subjects experiment (n = 620) was conducted in the United States to assess the impact of narrative perspective on the communication objectives of increasing knowledge, changing perceptions, and influencing behavior related to bee diversity. Results indicate that watching a video presented by a scientist was associated with higher levels of perceived competence and a higher likelihood to mention a person or persons when recalling the video. However, we did not find significant effects of narrative perspective on knowledge gain and behavioral intentions to help support bee diversity.
1. Introduction
Communication of science through online media has become a primary means of reaching a public audience (Mitchell et al., 2016) as traditional print journalism has decreased in recent decades (Brossard and Scheufele, 2013; Brumfiel, 2009). Online research summaries can appear in many places and forms, from news websites, to institutional press releases, blogs, and the social media profiles of the research scientists themselves (Bik and Goldstein, 2013; Dudo, 2015). Alongside information sharing, each of these sources likely has a set of secondary, audience-oriented objectives (e.g. Besley et al., 2018; Dudo and Besley, 2016). Those objectives might range from promoting emotions, such as excitement, as well as shaping perceptions, such as trust-related perceptions of scientists and science, and perceptions of social norms and self-efficacy around taking certain actions (reviewed in the work of Besley and Dudo, 2022). This raises the question of whether some sources are more effective than others at achieving certain communication objectives.
Overall, extant literature supports the notion that scientists presenting their own work can have beneficial effects (e.g. Jarreau et al., 2019; Ruzi et al., 2021), but research also suggests that the specific scientific topic and various audience factors may interact with source variables (e.g. Brewer and Ley, 2013; Deng and Hu, 2019). The purpose of the current study is to examine these potential differences in the context of biodiversity research. Through an online experiment, we test the effects of narrative perspective on knowledge, trust-related perceptions, and behavioral intentions.
YouTube videos and science communication
YouTube is a widely used source of information (ranked second on a list of top 500 websites based on number of pageviews and daily visitors, Alexa, 2020). The site is trafficked by over two billion monthly users with over a billion hours of daily watch time (YouTube, 2020). YouTube science videos are produced by a range of professionals and amateurs (Allgaier, 2018; Morcillo et al., 2019; Welbourne and Grant, 2016). Several studies have described how aspects of these science videos correlate with video popularity and success metrics (e.g. view count, likes, number of subscribers). In general, popular science videos had moderate levels of production value (Morcillo et al., 2016), included aspects of storytelling (Huang and Grant, 2020; Morcillo et al., 2016), emphasized personality (Morcillo et al., 2016), and potentially fostered a direct connection with an audience (Morcillo et al., 2016) by having recurring hosts (Welbourne and Grant, 2016). These studies show there are many content-related choices that a video producer can make that influence how content performs online.
Numerical success on algorithm-curated platforms like YouTube is also influenced by things like title and thumbnail design, and search and discovery-related platform intricacies. Instead of focusing on what makes a successful YouTube video in terms of engagement metrics, we ask how different choices a content creator makes can impact audience knowledge and perceptions. Specifically, we focused on a single tactical choice of whether the person appearing on-screen is a scientist presenting their own research or someone presenting research in generalized third-person narration.
Social media and perceptions of scientists
There is a wealth of research on perceptions of scientists, especially those related to trust. Trust in science—and scientists—is important because it has a direct impact on the decisions people make related to behaviors that can impact their health and the environment (e.g. Brewer and Ley, 2011). Trust has been defined to include concepts related to expertise or competence, and more ethics or personality-based traits, such as warmth or honesty. Through a review of existing measures and empirical testing, Besley et al. (2021) developed a four-dimensional scale to measure perceptions of scientists that included competence, benevolence, openness, and integrity. Research has typically concluded that lay publics rate scientists highly in terms of expertise, but lower on other trust-related dimensions (e.g. Besley et al., 2021). Direct interaction and authenticity through social media has been suggested as a way to change these perceptions while also maintaining credibility (Jarreau et al., 2019).
Social media sites have provided a way for scientists to present first-person narratives about their work directly to a public audience (e.g. Erviti and Stengler, 2016; Martin and MacDonald, 2020). However, research has been somewhat mixed when it comes to the effects of this communication and whether scientists are the best spokespeople for science. According to some research, by humanizing and depicting themselves as good-intentioned individuals with similar beliefs and experiences to nonscientists (e.g. individualization, Swencionis and Fiske, 2014), scientists may be able to shift stereotyped public perceptions of being competent but cold (Losh, 2010; Rutjens and Heine, 2016). Across platforms like Twitter (now X) and Instagram, trends like #overlyhonestmethods (Simis-Wilkinson et al., 2018), and #scientistswhoselfie (Jarreau et al., 2019) have aimed to provide a direct and “insider” view of science from the scientists themselves.
Some experimental work has asked how these social media-based depictions of science and scientists influence audiences. For instance, on Instagram, Jarreau et al. (2019) found that viewing scientist selfies increased respondents’ perceptions of scientist warmth, and did not negatively affect perceptions of competence. This is consistent with recent experimental findings related to Twitter that found scientists were seen as both more qualified and authentic than other influencers (Zhang and Lu, 2023). Likewise, research on science blogs found that, in general, a post written by a scientist is more effective than one written by a non-scientist (Yuan et al., 2019). However, that study also found that if a scientist blogger wrote politely rather than aggressively, they violated readers’ expectations and were in turn less persuasive.
Specific to video, previous work by Ruzi et al. (2021) focused on YouTube presentations and asked how altering the relationship of a spokesperson to a research story influences audience perceptions of spokesperson trust and expertise. They created videos describing the discovery of a new insect species presented in first-person by a scientist, in third-person language, and an infographic-style video (no one on-screen and no voice). They found that when scientists presented their own work, respondents perceived them as more trustworthy and having more expertise compared to the infographic-style video. However, this experiment was limited to a single, not personally relevant message, leaving the question as to whether more controversial or personally relevant topics would influence results. For instance, in contrast, König and Jucks (2019) found that when the speaker in a science video was a lobbyist arguing a particular position (in this case, the superiority of organic food), he was seen as less trustworthy and less credible when presenting his own research versus third-party studies. Similarly, in the context of genetically modified (GM) food, scientists who research GM food were seen as less trustworthy as those who do research in other areas (Deng and Hu, 2019). Based on this review of literature, and the unsettled science around scientists as online communicators, we pose the following research questions:
Biodiversity communication
For ecologists, conservation and biodiversity-related research is a topic that spans basic, descriptive science to researching issues that have direct personal and policy-related recommendations. For insect ecologists, one of the highest profile issues of recent years stems from research around biodiversity decline, with campaigns aiming to “save the bees” (https://savethebees.com/; https://environmentamerica.org/topics/save-the-bees/) and headlines announcing an “insect apocalypse” (Jarvis, 2018). Communicating issues like bee decline presents many challenges including, but not limited to, distinguishing between losses of managed honeybees from declines in native bee communities (Hall and Martins, 2020), communicating both the context and nuance behind diversity studies (e.g. Thomas et al., 2019), and recognizing the human component necessary for conservation efforts to succeed (Hall and Martins, 2020). The objectives that motivate these communication efforts range from sharing information to inspiring behavior change. Therefore, to extend previous research efforts into communicating a topic that audiences are more familiar with, and may find more personally relevant, we designed an experimental set of videos presenting fictionalized research on bee diversity that ends in specific calls-to-actions. We designed these videos to mimic sharing a new research finding on how land-use impacts pollinator diversity and recommended actions individuals can take to conserve bee species.
2. Materials and methods
The study was approved by both North Carolina State University’s (IRB# 25577) and Arizona State University’s Institutional Review Board (IRB ID STUDY000017162). Respondents were recruited and completed the study via Qualtrics, an online survey platform that sends invites to volunteers to participate in research. Panel members who receive the recruitment email can opt-in to a particular study. Respondents must be at least 18-year old to participate, and we asked Qualtrics for a US representative sample (Supplemental Material: Section 6). The survey took place between January 25 and February 7, 2023, which included participant recruitment, data acquisition, and the replacement of non-quality survey responses.
Once volunteers gave informed consent, they self-reported demographic variables and completed a pre-assessment of the importance and understanding of the video topic before being randomly assigned in equal proportion to one of four video stimuli (Figure 1). After the stimulus video was viewed, participants responded to questions confirming they watched and listened to the video, asking whether the person in the video conducted the research, and assessing their perceptions of science in general. They answered questions assessing their perceptions of the spokesperson, the video itself, how likely they were to engage in a call-to-action, whether the video topic was of personal relevance, and how likely they were to subscribe to a channel that produced similar videos. Finally, the pre-assessment questions were asked again. After survey completion, respondents viewed a debrief message that explained that the contents of the video, while modeled on scientific findings, were crafted for use in this study (see debrief message in Supplemental Material: Section 4). Throughout the survey, there were quality control questions. Providing incorrect answers to these quality control questions resulted in early termination of the survey, at which point respondents saw the debrief message. The Supplemental Material: Section 4 has the full question list.
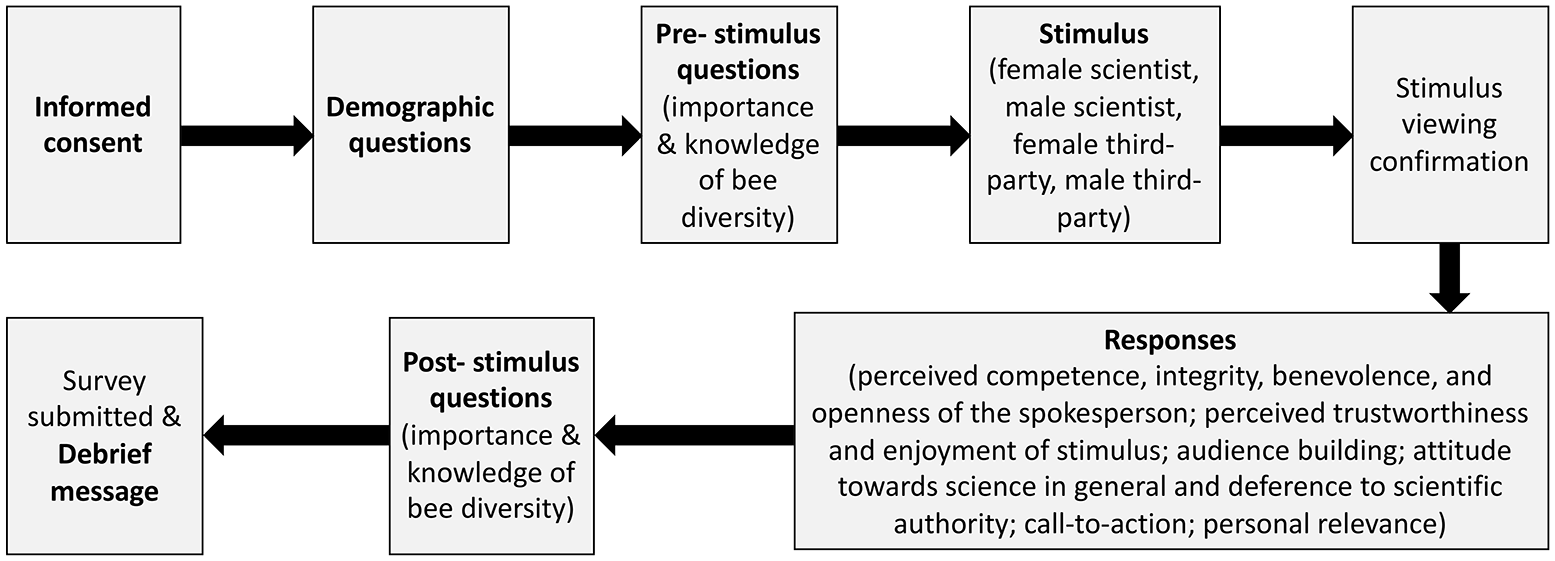
Questionnaire flow.
Sample
Qualtrics replaced non-quality survey responses that resulted from failure to pass quality control checks, ensured certain quotas were met, such as a US representative sample based on select demographic variables (Supplemental Material: Section 6) and ensured there were roughly equal proportions of responses across stimuli. In addition, Qualtrics replaced survey responses that included nonsense responses to a question about what the participant saw and heard in the video, when the participant provided an answer outside of an acceptable range for an estimated bee species richness (accepted range: 1–99,999), and if respondents straight-lined responses by choosing either the lowest or highest response for all statements. In total, there were 620 quality responses.
Stimuli
We created videos that mimicked a research news summary which presented research findings, implications, and calls-to-action individuals could take based on those findings. While we fictionalized the details of this study for the video narrative, we based the information on published findings. Thus, we were able to control the narrative perspective, what b-roll was included, and what call-to-action items were focused on.
In total, we created four video stimuli that fell into two treatments: a scientist presenting their own work in first-person narration (scientist) and a third-party individual presenting the work of unnamed scientists in third-person narration (third-party). The script for both treatments was the same except for 19 instances where an “I” statement was changed to a “scientists” or “they” statement (script in Supplemental Material: Section 3). All b-roll was consistent between the two treatments. The spokesperson was always identified on-screen with the gender-neutral name of Sam Wilson along with the words “Museum of Natural History” (Supplemental Material Figure S3.1a and b). Within each treatment, there was a video in which the spokesperson was either female or male to control for idiosyncratic effects of individual presenter. Both were portrayed by study authors. The same presenters recorded videos for both treatments. Videos were approximately 3 minutes long (min: 182 seconds; max: 190 seconds) and the spokesperson was speaking on-screen, directly to-camera 39% to 41% of the total video time.
These videos were embedded within the survey and presented with three sentence blurbs. The first two sentences were the same for both treatments: Bee community composition and traits vary across landscapes and environmental traits. By capturing bees across different landscapes, and looking at environmental variables like flower presence and amount of natural area, researchers have discovered that there are individual actions that can be taken to help bee populations.
The third sentence varied by treatment to further indicate that one treatment was told by the scientist themselves versus the other treatment told by a third-party. The scientist narrative had the following sentence: “The researcher who made this discovery explains their findings in this video.” And the third-party narrative had the following: “The discovery is explained in this video.”
Videos were filmed on May 24, 2022 in the North Carolina Museum of Natural Science’s video production studio. The added b-roll included footage filmed by A.A. Smith at the North Carolina State University Insect Museum, images included were taken by either S.A. Ruzi or creative commons photos (Supplemental Material Table S3.1 for specific attributions), and graphics were generated by A.A. Smith and S.A. Ruzi. All video editing was performed in Adobe® Premiere Pro (version 22.2.0).
Video topic and choice of call-to-action
The video presented research on how bee diversity differed across cities, forests, and agricultural land. Both the methods and the results were based on published findings (Supplemental Material: Section 5 for source information). We chose this topic as we felt it would be perceived as personally relevant to those viewing the video as bees are known for their pollination services (Hall and Martins, 2020; Lemelin et al., 2016; Wilson et al., 2017), which is significant for food production and there has been concern over bee declines (e.g. Lemelin et al., 2016). In addition, there are specific calls-to-action that individuals can take to help conserve bee diversity. The calls-to-action presented in the video encouraged the viewer to plant flowers and leave part of their yard as natural habitat. These are actions commonly recommended in the research literature (e.g. Harvey et al., 2020; Kawahara et al., 2021; Klein et al., 2007; Prendergast et al., 2022; Quistberg et al., 2016).
Outcome measures
A summary of the scales and outcome measures are summarized in Table 1 and Supplemental Material Table S6.2. We used existing scales to assess perceptions of the spokesperson, the stimulus, general attitude toward science, deference to scientific authority, and personal relevance. Spokesperson trustworthiness is considered to be multidimensional and can be measured using either a two-factor (competence and warmth) or a four-factor (competence, integrity, benevolence, and openness) approach (Besley et al., 2021). We use a four-factor approach as it is recommended to better capture nuanced perceptions (Besley et al., 2021). We used modified scales to assess a willingness to engage in a call-to-action by borrowing from the four dimensions of the theory of planned behavior, which seeks to predict the likelihood an individual will perform a certain action in a given context based on the motivations that individual has (Ajzen, 1991; Montano and Kasprzyk, 2015). Intention, the first dimension, describes the motivations the individual has toward completing an action with greater intention being more likely to complete the action (Ajzen, 1991; Montano and Kasprzyk, 2015). Intention, however, can be moderated by an individual’s attitude toward the action (attitude dimension), whether there is societal pressure to perform the action (subjective norms dimension) and the perceived self-efficacy of the action (control dimension) (Ajzen, 1991; Montano and Kasprzyk, 2015). We also used Ruzi et al.’s (2021) humanizing research. In addition, we assessed audience building by asking whether respondents were likely to subscribe to a channel that posted videos presented similarly to the one they viewed.
Summary of scales measured, their sources, and measure of internal reliability (Cronbach’s alpha).
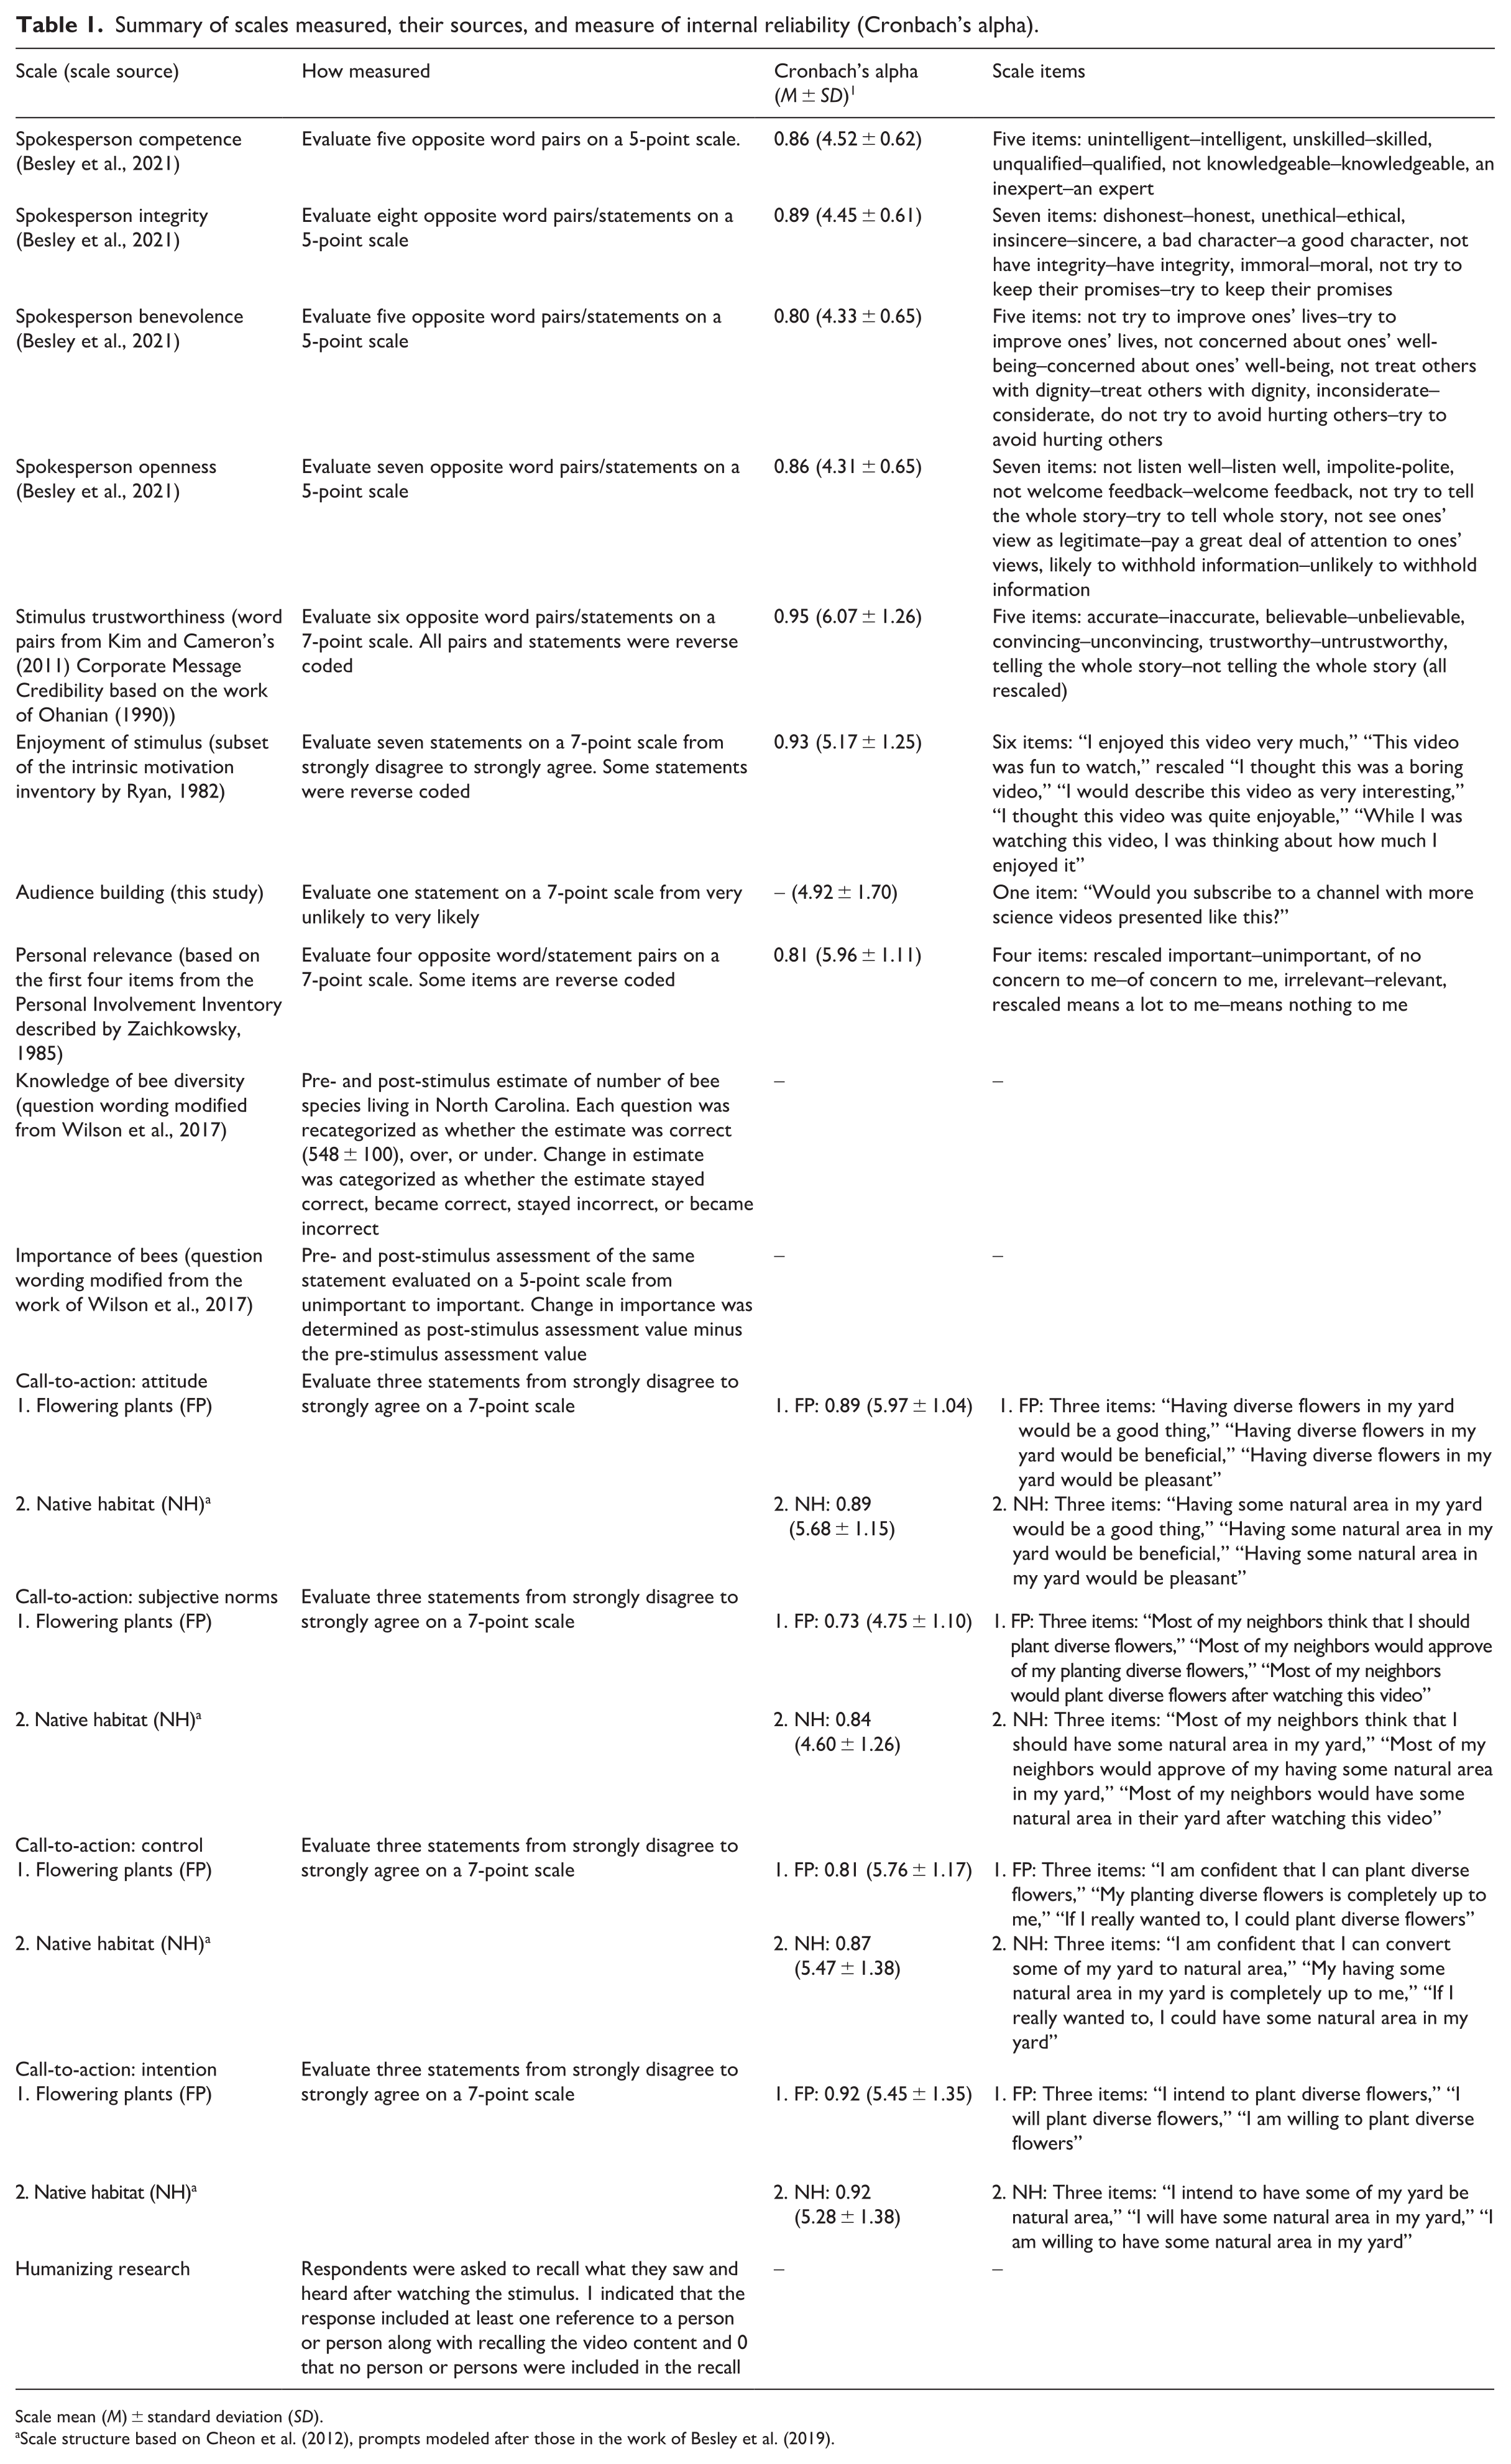
Scale mean (M) ± standard deviation (SD).
scale structure based on Cheon et al. (2012), prompts modeled after those in the work of Besley et al. (2019).
Statistical analyses
Analyses were conducted in SPSS Statistics (version 28; IBM) and visualizations in R (version 4.2.1, R Core Team, 2022) using the haven (VERSION 2.5.1, Wickham et al., 2022), tidyverse (VERSION 1.3.2, Wickham et al., 2019), and ggplot2 (VERSION 3.4.0, Wickham, 2016) packages.
We first determined whether treatment impacted how well respondents were able to correctly identify the person who conducted the research. We recoded respondent answers to the question “In this video, was it clear who performed this research?” into “correct” and “incorrect” responses with respect to which video was viewed. Therefore, respondents who viewed the scientist narrative needed to select the “Yes—it was the person in the video” and respondents who viewed the third-person narrative needed to select the “No—the video did not specify who did the research” to be marked correct, respectively. A chi-square test was then run.
Prior to hypothesis testing, we determined which variables to include as covariates by determining whether there were significant differences across treatments in terms of demographic variables, perceptions of science in general, or deference to scientific authority. None of the variables considered were significantly different across treatments, therefore, none were included as covariates in subsequent analyses (Supplemental Material: Section 6).
Hypotheses were tested using independent t-tests, Mann–Whitney U-tests, chi-square tests, Wilcoxon signed-rank tests, or Kruskal–Wallis tests depending on whether the dependent variable was continuous or categorical, there were extreme outliers, data were paired, and the independent variable had more than two levels. Extreme outliers were defined as being greater than three times the interquartile range outside of either the first or the third quartile. Assumptions of homogeneity of variance and normality of residuals were tested by visually inspecting a combination of boxplots, histograms, and QQ plots. If assumptions of normality were violated and/or extreme outliers were present, a non-parametric test was conducted. Because conducting multiple tests can lead to higher likelihood of type I errors or false discovery rates (Benjamini and Hochberg, 1995), we calculated q values (i.e. adjusted p values) in R using the p.adjust function. Effect sizes were calculated using SPSS for t-tests, or formulas found in the work of Tomczak and Tomczak (2014) for each test as appropriate. Depending on the method for calculating the effect size, the effect size may be bounded by different numbers (e.g. r ranges from −1.00 to 1.00; Cramer’s V,
Continuous scales were left as continuous except for estimating the number of bee species living in North Carolina, which we converted to categorical responses. The pre- and post-stimulus estimates of the number of bee species were categorized as “correct” if responses were 458–658, “over” if the estimate was 659 or higher, and “under” if the estimate was 457 or lower. We categorized how respondent estimates changed from pre- to post-stimulus questions in four ways: (1) “stayed correct,” (2) “stayed incorrect,” (3) “became correct,” and (4) “became incorrect.” Separate chi-square tests were used to see whether there were differences across treatments for the pre-stimulus question, post-stimulus question, change between the pre- and post-questions, and comparing pre- and post-stimulus questions irrespective of treatment. In addition, separate Kruskal–Wallis tests were used to examine the relationship between how respondents changed their species richness estimates relative to stimulus trustworthiness and enjoyment.
We recoded the recall text responses to determine if respondents were more likely to remember a person when recalling what they saw and heard. The response was coded as a one when the respondent included at least one reference to a person(s) and a zero when the respondent did not include a reference to a person(s). A chi-square test was used to determine if there was a difference between treatments.
3. Results
Overall, 620 responses were retained within the final data set with 309 respondents viewing a scientist and 311 respondents viewing a third-party (S1 Data Set). Respondents varied in self-reported demographics ranging in age from 18 to 83 (mean = 47.6). Most respondents identified as a woman (56.6%), were not of Hispanic or Latino descent (91.0%), and identified as White (78.9%). Most respondents identified as Democrat (43.7%) or Republican (38.4%) with a smaller percentage identifying as “other” (17.9%), and there were slightly more respondents who considered themselves conservative (56.5% “lean conservative,” “conservative,” “very conservative”) than liberal (43.5% “lean liberal,” “liberal,” “very liberal”). About one-third of respondents had a college degree or higher (35.2%) with very few degrees from STEM fields (13.5% of total responses). More respondents self-reported gross annual household incomes under US$55,000 (59.0%) than above. See the See Supplemental Material: Section 6 for a more detailed demographic breakdown.
Manipulation check
Treatments differed in the likelihood that respondents would correctly identify who conducted the research, with respondents who viewed a first-person scientist narrative responding correctly 96.76% of the time and respondents who viewed a third-person narrative 60.13% of the time (chi-square:
Research Question 1
The scientist was seen as a significantly more competent spokesperson than a third-party spokesperson (Table 2; Figure 2a). Otherwise, narrative perspective did not significantly influence respondent perceptions of the spokesperson though perceptions had positive scale means (Table 2; Supplemental Material Figure S1.1).
Summary of results of t-tests and Mann–Whitney U tests investigating the effects of treatment on different outcome measures.
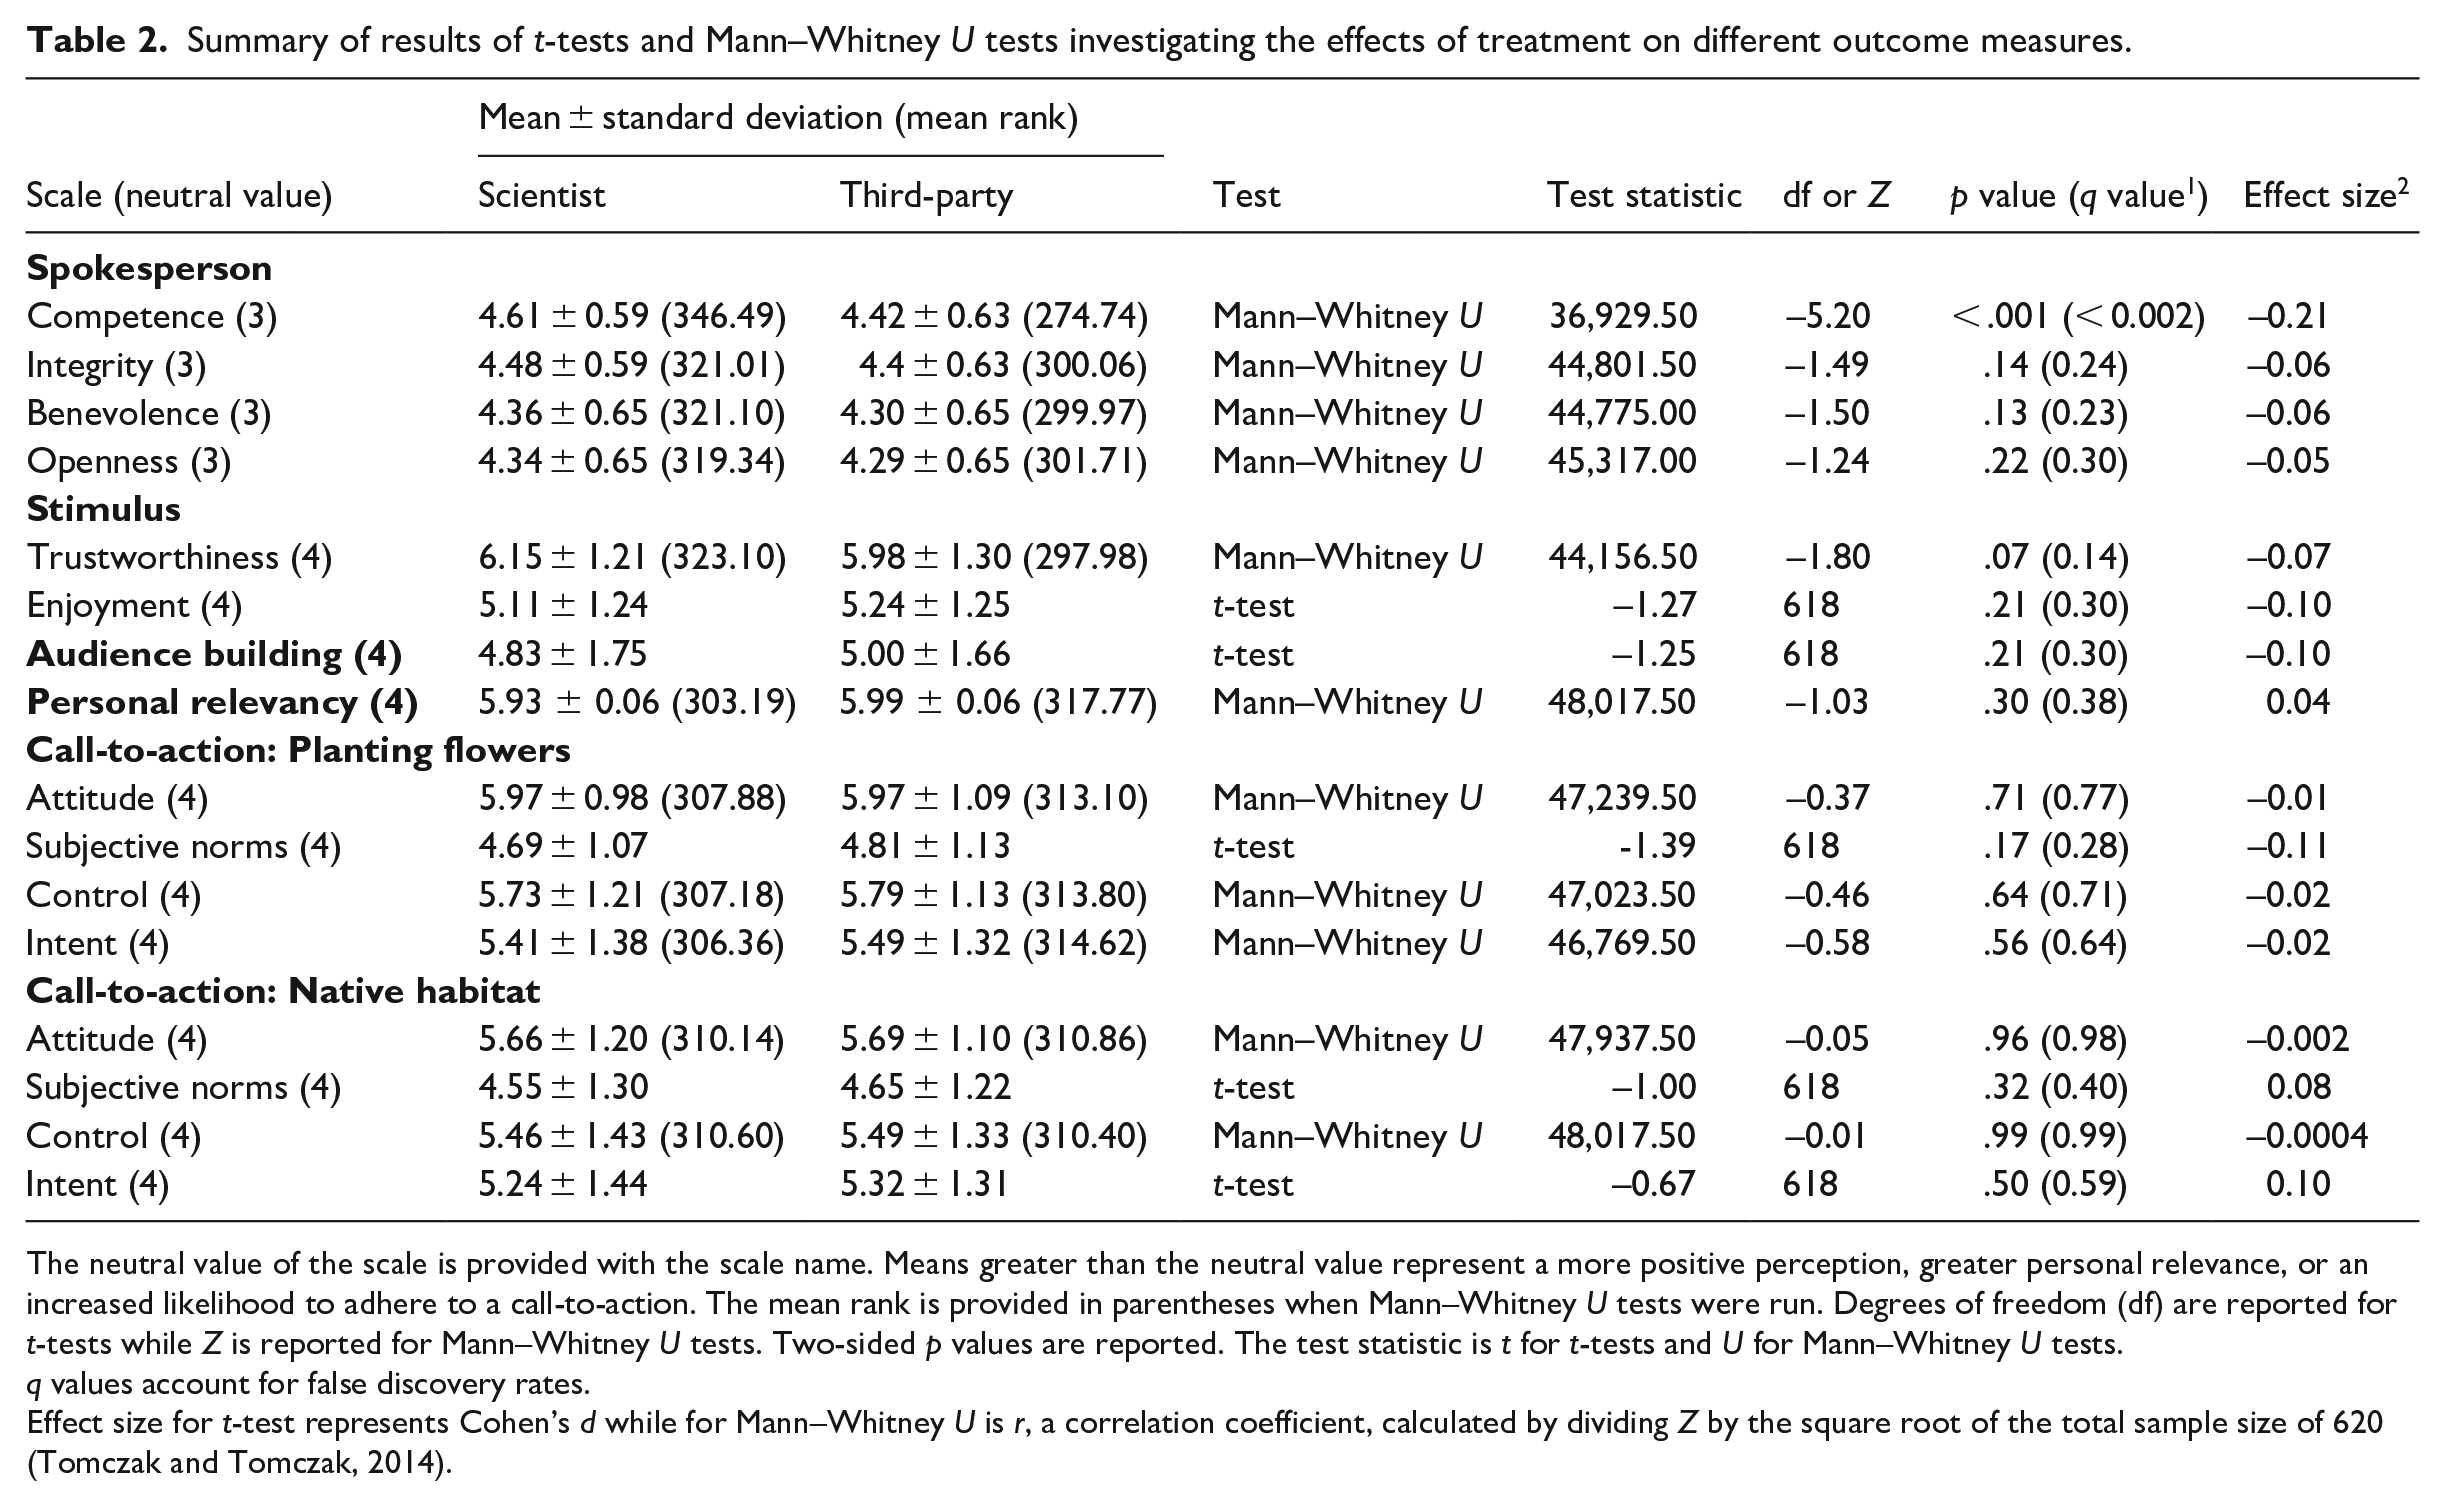
The neutral value of the scale is provided with the scale name. Means greater than the neutral value represent a more positive perception, greater personal relevance, or an increased likelihood to adhere to a call-to-action. The mean rank is provided in parentheses when Mann–Whitney U tests were run. Degrees of freedom (df) are reported for t-tests while Z is reported for Mann–Whitney U tests. Two-sided p values are reported. The test statistic is t for t-tests and U for Mann–Whitney U tests.
q values account for false discovery rates.
Effect size for t-test represents Cohen’s d while for Mann–Whitney U is r, a correlation coefficient, calculated by dividing Z by the square root of the total sample size of 620 (Tomczak and Tomczak, 2014).
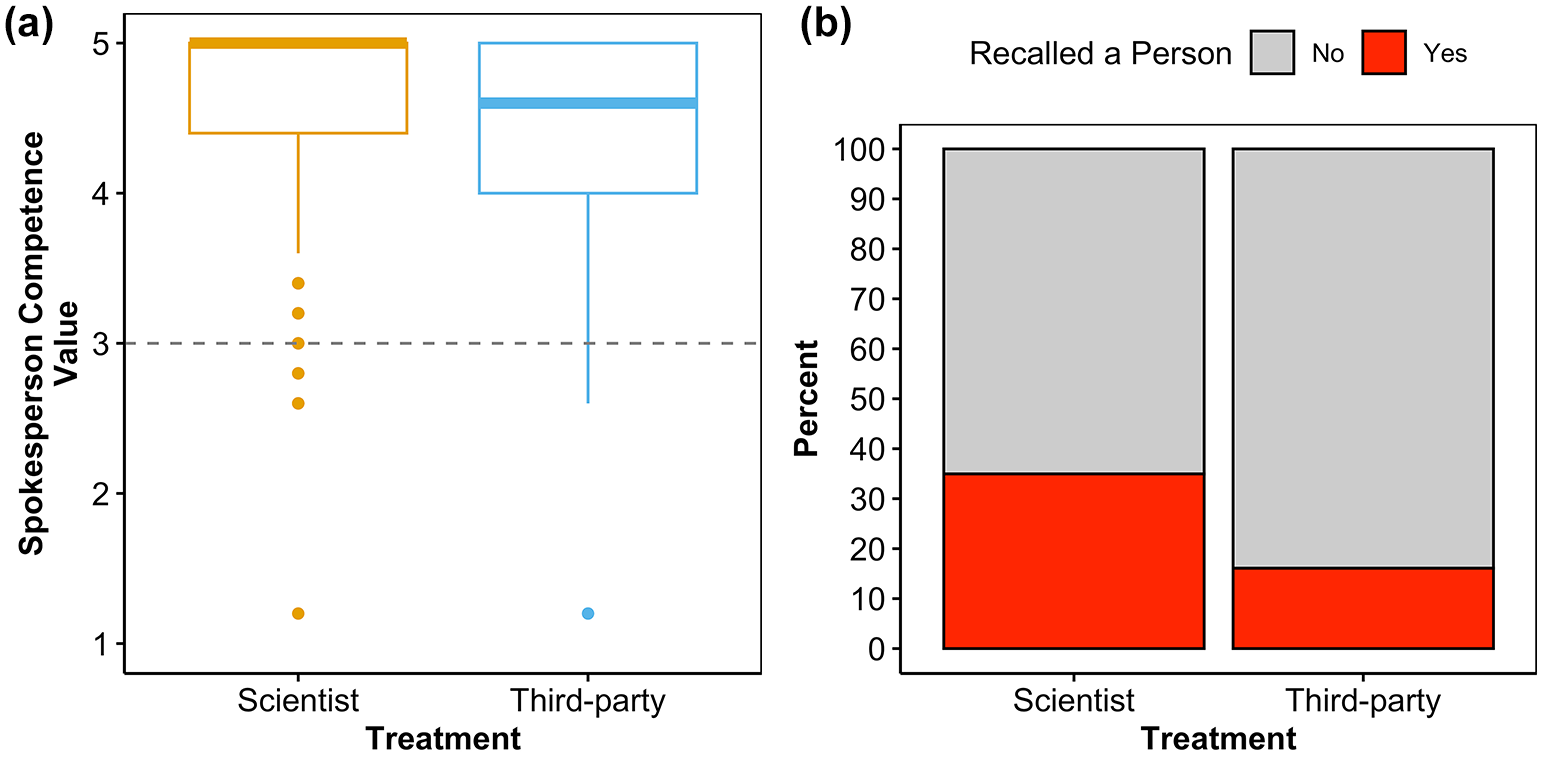
(a) Significant differences between treatments for spokesperson competence. (b) Humanizing science.
Research Question 2
Narrative perspective did not significantly influence respondent perceptions of trust or enjoyment of the stimulus, the likelihood of subscribing to a YouTube channel that published similar videos, or the perceived personal relevancy of the video topic (Table 2; Appendix S1 Figure S1.1). Again, all perceptions had positive scale means (Table 2; Supplemental Material Figure S1.1).
Research Question 3
In the pre-stimulus question about the number of bee species richness, treatments were significantly different (chi-square:
Regardless of which treatment was viewed, participant perceptions of bees increased in importance from an average ± standard deviation of 4.74 ± 0.03 to 4.80 ± 0.02 (maximum scale = 5) (Wilcoxon signed-rank test: Z = –2.88, p < .004, q < 0.009, effect size = r = –0.12). The change in perceived importance (calculated as post-stimulus minus pre-stimulus) was not significantly different between treatments (Mann–Whitney U test: U = 47,061.50, Z = –0.74, p = .46, q = 0.55, effect size = r = –0.03). Both pre- and post-stimulus perceived importance of bees were weakly, but significantly correlated with stimulus trustworthiness (pre-stimulus: r = 0.15, p < .001, q < 0.002; post-stimulus: r = 0.27, p < .001, q < 0.002) and stimulus enjoyment (pre-stimulus: r = 0.23, p < .001, q < 0.002; post-stimulus: r = 0.28, p < .001, q < 0.002) based on Pearson’s correlations. However, the change in perceived importance was not significantly correlated with either stimulus trustworthiness or enjoyment (pre-stimulus: r = 0.08, p = .06, q = 0.11; post-stimulus: r = 0.008, p = .84, q = 0.88).
The treatment of narrative perspective had no effect on any of the dimensions of the theory of planned behavior (i.e. call-to-action prompts) both when respondents were asked to plant diverse flowers or convert some of their yard to natural habitat.
Viewing a scientist talk about their work in the first-person compared to when a third-party shared the same research story humanized the research (chi-square:
4. Discussion
Our findings suggest that in general, scientists and third-party presenters were not perceived differently except for in a couple cases: (1) scientists narrating in first-person were perceived as more competent than our third-party treatment and (2) when respondents viewed first-person narratives, they were more likely to mention a person when recalling the research. This video topic ranged in personal relevancy to our respondents, with an average opinion rating the video topic as personally relevant.
Respondents were more likely to correctly identify who conducted the research when they were watching the first-person narrative than when they were watching the third-person narrative. Generally, individuals are less likely to be given negative reviews by respondents (Fiske, 2013; Fiske and Dupree, 2014) which could explain why they were rated as more competent than their third-party counterparts. This is consistent with prior research that found scientists were perceived as more qualified than other content creators (Zhang and Lu, 2023). In addition, scientists are already generally seen as competent (Besley et al., 2021). Without knowing whether our respondents also associate competence and trustworthiness with museum communicator roles (not directly tested for despite museums being regarded as trustworthy information centers; for example (Cameron et al., 2013; Novacek, 2008)), we cannot say whether we would have expected both spokespeople to be given equal credibility given their museum affiliation status which only appeared as an on-screen affiliation for approximately 4 seconds (~2% of the video).
The result that scientists and third-party communicators were perceived to be equal in terms of integrity, benevolence, and openness but differed in competence by respondents is supported by Ruzi et al. (2021) though different scales were used. Using a more nuanced set of factors, as we did here, is recommended specifically when looking to evaluate perceptions of scientists (Besley et al., 2021), and in our case, both the scientist and third-party spokesperson. Evaluating more nuanced trust-related perceptions also helps to better understand where communicators may want to focus improvement (Besley and Dudo, 2022).
This experiment included only one communication event and measured short-term responses from participants. Although there were some significant differences in perceptions, other outcomes, especially ones that ask respondents to think more deeply or to make a personal behavior change, such as with our call-to-action prompts, likely need more time for these changes to occur. In other words, respondents likely need repeated exposure—to be exposed to multiple communication events asking for the same behavioral change—prior to their behaviors shifting in a significant way. This is consistent with recommendations by Besley and Dudo (2022) about strategic science communication—that while some short-term changes may occur, communicators should not think of strategic science communication as making large changes over short-term periods, but that continued, repeated, strategic communication events are needed over longer periods to affect change. Future research should employ longitudinal studies to investigate whether repeatedly being exposed to similar communication messages would create larger perception and behavioral changes over time.
Implications
The results of this work build upon implications from the work of Ruzi et al. (2021) and Jarreau et al. (2019) specifically on how having a scientist on-screen can positively impact specific trust-related perceptions toward the scientist, at least in some contexts. This is experimentally demonstrated in both this study where we look at a more applied scientific story and Ruzi et al.’s (2021) study that looked at a more basic scientific story, by comparing scientist told first-person research narratives to third-person science narratives. For Jarreau et al. (2019), they tested this experimentally by setting up Instagram-style feeds in which scientists appear in selfie images alongside their research compared to research images where there was no person present and a control non-research feed. Across these experimental studies, treatments where there was a scientist on-screen (or in image) resulted in elevated trust-related beliefs. For example, in Jarreau et al. (2019), viewing Instagram posts that included the scientist positively impacted perceptions of the scientist Instagrammers’ trustworthiness and warmth, and perceptions of the warmth and competence of scientists in general. And in both this study and that of Ruzi et al. (2021), participants perceived scientists as having more competence or expertise compared to the other treatments tested.
In addition, across these three studies (this study; Jarreau et al., 2019; Ruzi et al., 2021), even respondent perceptions of the scientist that were not significantly different across treatments were always neutral or positive. This implies that obstacles around engaging in public outreach, specifically being viewed as a less competent or rigorous scientist (Shermer, 2002), is not a belief that public audiences have. This also counters the argument that some scientists have that scientists themselves may not be the appropriate individuals to communicate science to a broader audience (e.g. Ecklund et al., 2012). One caveat is that this assumes that the communicating scientist is equally skilled at communicating as a professional communicator. Overall, these arguments for why scientists should not communicate their work to a public audience could be detrimental to improving communication objectives surrounding trust-related beliefs.
Limitations and future research
This study has limitations that many experiments are prone to. For example, media effects may differ when videos are encountered and viewed in an organic media environment. In a non-experimental setting, there would likely be other choices made in conjunction with the choice of narrative perspective. For example, multiple studies have investigated how production choices influence popularity metrics (e.g. Huang and Grant, 2020; Morcillo et al., 2016). The quantitative nature of the study and number of hypotheses also increases the likelihood of type 1 error, or finding a significant association by chance when the null hypothesis should have been accepted. We addressed this by accounting for false discovery rates and calculating q values (i.e. adjusted p values).
Here, we looked at a single communication event that focused on one video topic that varied in personal relevancy to our respondents. Though better suited to being asked prior to viewing the stimulus and used as a moderator variable, there appeared to be an interaction between personal relevancy and behavioral intention (see Supplemental Material: Section 7). Though not assessed, it is possible that perceived personal relevancy may interact with other communication objectives. Future research should investigate other research topics an audience may find more personally relevant and use it as a moderator variable to see how this interacts with communication choices to impact communication objectives.
A purpose of creating content on YouTube from the perspective of the content creator is to build an audience that will subscribe and watch multiple videos. While we did not find an effect of treatment on how likely respondents were to subscribe to a channel, the idea that multiple YouTube videos by the same channel or content producer are meant to be watched by the same individual raises the question of whether repeated exposure to similar content and production choices can be more effective. For example, Jarreau et al. (2019) found that the warmth of scientists in general was improved after viewing multiple scientist selfies. This provides evidence for repeated exposure mitigating negative scientist stereotypes. Future work would benefit from seeing how repeated exposure impacts the success of communication objectives and goals.
5. Conclusion
We experimentally demonstrated that narrative perspective does impact some communication objectives, particularly the perceived competence of the spokesperson, and aids in humanizing science. We determined this by making a small, yet noticeable, change between our two treatments by switching 19 instances of an “I” statement to a “scientists say” statement while keeping all other production choices the same between treatments. Outside of an experimental context, there are likely additional tactical choices that could further contribute to accomplishing communication objectives. However, all things being equal, scientists may be more likely to build trust, demonstrate competence and dismantle negative scientist stereotypes by presenting their own research. In this specific context, there were no detrimental effects of scientists presenting their own work on-screen in terms of increasing knowledge, trust-related beliefs, or influencing behavior change. In addition, using first-person language humanized science and increased perceived competence. However, scientists should still exercise caution, especially when citing their own research to support a particular stance (König and Jucks, 2019) or violating audience expectations (Yuan et al., 2019).
Supplemental Material
sj-docx-1-pus-10.1177_09636625241300646 – Supplemental material for Communicating biodiversity research on YouTube: An experimental comparison of scientists and third-party presenters
Supplemental material, sj-docx-1-pus-10.1177_09636625241300646 for Communicating biodiversity research on YouTube: An experimental comparison of scientists and third-party presenters by Selina A. Ruzi, Adrian A. Smith and Nicole M. Lee in Public Understanding of Science
Footnotes
Acknowledgements
The authors thank their Qualtrics, NCSU IRB, and ASU IRB representatives for assisting in programming the Qualtrics Survey Panel and with IRB applications, respectively. They also thank the NCMNS Digital Media team for access to, and assistance in, the media production studio.
Author contributions
Selina A. Ruzi and Adrian A. Smith contributed to conceptualization. Selina A. Ruzi and Adrian A. Smith contributed to data curation. Selina A. Ruzi contributed to Formal analysis. Selina A. Ruzi, Nicole M. Lee, and Adrian A. Smith contributed to funding acquisition. Selina A. Ruzi and Adrian A. Smith contributed to investigation. Selina A. Ruzi, Nicole M. Lee, and Adrian A. Smith contributed to methodology. Selina A. Ruzi and Adrian A. Smith contributed to project administration. Nicole M. Lee and Adrian A. Smith contributed to resources. Selina A. Ruzi contributed to software. Adrian A. Smith is responsible for supervision. Selina A. Ruzi and Nicole M. Lee are responsible for validation. Selina A. Ruzi is responsible for visualization. Selina A. Ruzi contributed to writing—original draft. Selina A. Ruzi, Nicole M. Lee, and Adrian A. Smith contributed to writing—review and editing.
Data availability statement
All data used in this study are supplied as a supplemental file.
Funding
The author(s) disclosed receipt of the following financial support for the research, authorship, and/or publication of this article: This work was funded by National Science Foundation (NSF) Division of Social and Economic Sciences (SES) Science of Science: Discovery, Communication, and Impact grant-2219533 to Adrian A. Smith and Nicole M. Lee. Any opinions, findings, and conclusions or recommendations expressed in this material are those of the authors and do not necessarily reflect the views of the NSF.
Supplemental material
Supplemental material for this article is available online.
Author biographies
References
Supplementary Material
Please find the following supplemental material available below.
For Open Access articles published under a Creative Commons License, all supplemental material carries the same license as the article it is associated with.
For non-Open Access articles published, all supplemental material carries a non-exclusive license, and permission requests for re-use of supplemental material or any part of supplemental material shall be sent directly to the copyright owner as specified in the copyright notice associated with the article.