
Abstract
The COVID-19 pandemic in the United States is marked by divisions in perceptions of disease severity as well as misperceptions about the virus and vaccine that vary along ideological and political party lines. Perceptual differences may be due to differences in the information about the virus that individuals are exposed to within their own identity-affirming ideological news bubbles. This content analysis of six different national network transcripts highlights differences in coverage of severity, and the prevalence of misinformation and its correction that are consistent with previously established preferred news channels of conservatives/Republicans and liberals/Democrats and their perceptions and misperceptions about the pandemic. Results contribute to the growing body of country-specific COVID-19 media studies that allow for comparisons across nations with different cultures and media systems, as these factors play a pivotal role in national responses and experiences.
1. Introduction
The COVID-19 pandemic was a cataclysmic event that killed millions and created social, and economic crises worldwide (Hiscott et al., 2020). Despite the same virus being detected in every country in the world (with only one exception as of January 2023; Stephens, 2022), notable country-to-country differences emerged in how each crisis was handled (Hale, et al., 2021). Research on media systems highlights the importance of examining country-specific press coverage of outbreaks and crises, as news reporting is said to be culturally constructed and differs across countries (Brossard et al., 2004).
The literature examining press coverage of COVID-19 within individual countries (e.g. Chen et al., 2022; Gupta et al., 2022) and comparing across different countries (e.g. Mwangale Kiptinness et al., 2021; Mach et al., 2021; Ng and Tan, 2021; Wirz et al., 2021) is expansive. Much of this literature analyzes newspaper and online news coverage of the issue (e.g. Hubner, 2021; Krawczyk et al., 2021; Wasserman et al., 2021). The present study examines broadcast news coverage of the COVID-19 pandemic in the United States. Analyzing media coverage within specific countries is helpful for providing insight into public understanding and experiences of large-scale science and risk-related events (Wirz et al., 2021). The United States is a particularly relevant case study, as public opinion on coronavirus in the United States was found to be more politically divided in comparison to other advanced economies (Mordecai and Connaughten, 2020). This research was guided by a relatively new model in communication—the ideological health spirals model (IHSM; Young and Bleakley, 2020; see Figure 1) that was designed specifically to account for the highly politically polarized responses to COVID-19 experienced within the United States due in part to a news media system that creates discrepant information environments depending on viewers’ selection of news media channel.
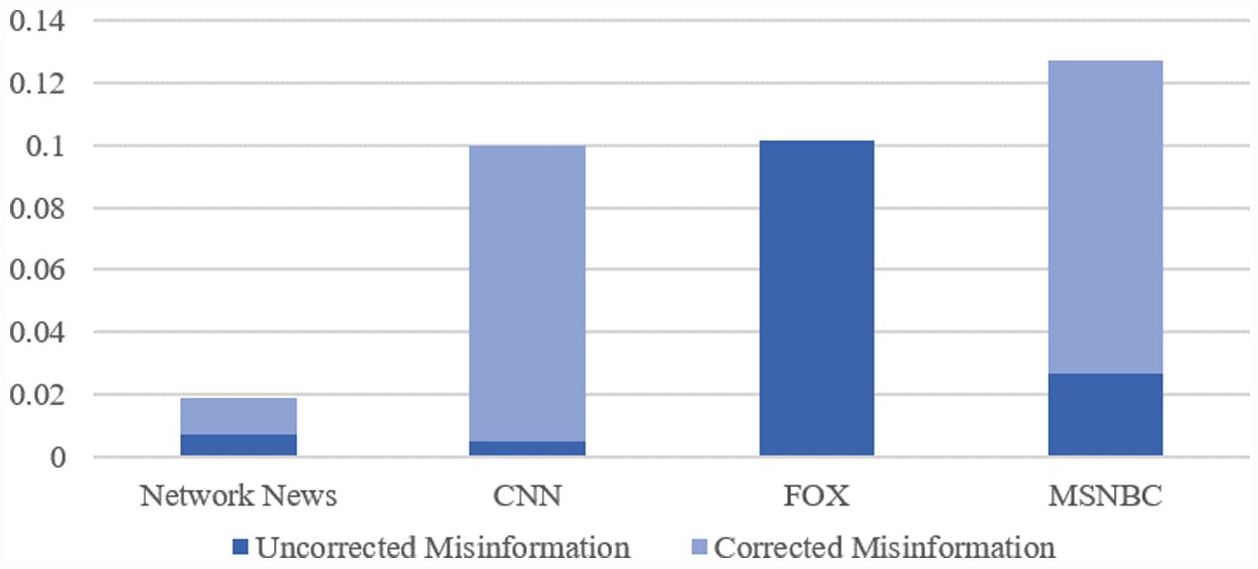
Percentages uncorrected and corrected misinformation coded in transcripts.
2. COVID-19 in the United States
A hallmark of the COVID-19 outbreak in the United States has been massive divides in public support for recommended mitigation strategies, including social distancing (e.g. (Gollwitzer et al., 2020), school and business closings (e.g. Dean et al., 2021), testing (e.g. Collins et al., 2020), contact tracing (e.g. McClain, 2020), and vaccination (e.g. Galston, 2021). These differences align with the nation’s current stark ideological divide, with those on the political right (Republicans, conservatives) expressing less concern about disease severity and lower support for policies or adjustments to daily life in the name of reducing virus spread, and those on the political left (Democrats, liberals) more concerned about health risks associated with the virus and offering more support for policies that reflect guidelines outlined by public health officials to lower rates of infection (Ruisch et al., 2021; VanDusky-Allen and Shvetsova, 2021). Research indicates that these political distinctions are derived from very different perceptions between groups about the nature and seriousness of the virus itself (Pew Research Center, 2020), which may be attributable to a complex combination of personal and environmental factors that lead to discrepancies in exposure to, and internalization of, different types of information about the virus (Young and Bleakley, 2020). One of these factors is an individual’s news media diet, which historically has played a major role in determining the content of national conversations and shaping public opinion about them (Iyengar and Kinder, 1987; McCombs and Valenzuela, 2020). The present study was conducted to examine the degree to which different broadcast news media outlets in the United States covered specific aspects of the COVID-19 pandemic differently, which has implications for consumers’ perceptions of virus severity and contributes to widely held misperceptions about the pandemic.
3. The ideological health spirals model
The IHSM (Young and Bleakley, 2020) is a new model of communication that was developed to account for the politically polarized responses to the COVID-19 threat in the United States. The model builds upon the well-established Social Identity Theory (Tajfel and Turner, 1979) and the Reasoned Action Approach (Fishbein and Ajzen, 2010) to suggest that the attitudinal and behavioral differences between the political right and left regarding COVID-19 stem from different perceptions and misperceptions systematically formed over time within highly discrepant information environments. According to the model, demographic and cultural factors, psychological traits, political orientation, and individual differences play a role in forming identity-related motivations to select specific interpersonal and media sources from which one obtains information about issues. These communication discrepancies lead to differences in attitudinal, normative, and efficacy perceptions about the issue, which again contribute to the selection of identity-consistent interpersonal and media sources to further inform an individual about the issue (i.e. the ideological spiral). The IHSM has yet to be tested extensively. Testing the model can help to provide a better understanding of the news media system functioning in the United States during a key time of the pandemic. The present analysis tests the assumption that different news media outlets in the United States present discordant accounts of the same topic, a bedrock of the IHSM which necessitates discrepant information environments across news channels that drive the proposed health information spirals in the model.
Media likely played a particularly large role in informing and shaping public opinion about COVID-19 in the United States, as shutdowns and stay-at-home orders would have restricted some of the interpersonal communication sources that generally serve as key information outlets. Data from the Pew Research Center in April 2020 indicated that national news outlets were listed as a major source of coronavirus news for the largest segment of adults in the United States (Mitchell et al., 2020). Partisan preferences for different broadcast news media outlets are well-established, with Republicans placing trust in Fox for more than any other news outlet, and Democrats placing less trust in Fox and instead trusting CNN, ABC, CBS, and NBC more evenly (Jurkowitz et al., 2020). This is consistent with patterns of trust for COVID-19-specific news as well. A national poll from the Kaiser Family Foundation revealed that majorities of Democrats said that they trusted information about COVID-19 from network news (72%), CNN (65%), and MSNBC (56%), but none of these sources were trusted by majorities of Republicans or Independents. Republicans’ most trusted national broadcast news source for COVID-19 information was FOX (49%) (Palosky, 2021). The ISHM would suggest that these differences in preferred broadcast news media outlets along party lines may produce and reinforce differences in perceptions about COVID-19 severity and misperceptions about the pandemic in general (assuming the outlets covered these elements differently). Consistent with this proposition, multiple studies have identified consumption of certain national broadcast news outlets (FOX and MSNBC) as significant correlates of misperceptions about the COVID-19 pandemic (Jamieson and Albarracin, 2020; Maloney et al., 2022). Although the correlation between consumption of specific news sources and misperceptions about COVID-19 has often been taken as evidence of discrepancies in coverage (e.g. Young and Bleakley, 2020), a few studies have attempted to quantify and compare the actual content of media coverage across channels.
The present study was conducted to determine whether different broadcast news media outlets covered the COVID-19 pandemic differently over the course of 1 year. Specifically, given the previously cited partisan divide in perceptions of disease severity and misperceptions about the nature of the virus and vaccination against it, we examined the degree to which six different national broadcast news outlets discussed COVID-19 severity and included widespread misinformation about COVID-19 and vaccination against COVID-19. We also noted whether misinformation was refuted within the same transcript. Thus far, most content analyses of COVID-19 media coverage have been limited to shorter time periods (Hart et al., 2020) and automated coding of content (Budak et al., 2021; Muddiman et al., 2020). This manuscript presents the results of an analysis of a full year’s worth of national broadcast news coverage of COVID-19 using manual coding procedures, which allowed for a more nuanced examination of media content than automated coding (e.g. determining whether a misinformation claim was directly refuted within a transcript). Identifying differences in portrayals of disease severity and the presence of misinformation is a key first step in determining the degree to which broadcast news media contributed to partisan divides in support for COVID-19 containment efforts. Coding and analyses were undertaken to address the following research questions.
Research questions
In an effort to identify potential sources of partisan discrepancy in perceptions of disease severity, RQs 1–4 were posed.
RQ1: How often was disease severity discussed in broadcast media coverage of COVID-19 over the course of the year?
RQ2: How did the frequency of disease severity in COVID-19 coverage differ across broadcast media channels?
RQ3: What aspects of disease severity were most represented in COVID-19 coverage over the course of the year?
RQ4: How did the frequency of specific aspects of disease severity coverage differ across broadcast media channels?
RQs 5 and 6 were put forth to examine whether news media outlets differed in the degree to which they acknowledged misinformation about the pandemic and discussed where the misinformation might have originated. An analysis of the most prominent COVID-related misinformation that emerged in traditional media around the world in the first few months of the pandemic in the United States (January 1—May 26, 2020) found that President Trump was by far the name most often mentioned in the context of COVID-19 misinformation (Evanega et al., 2020). The authors concluded that President Trump was likely the largest driver of COVID-19 misinformation. RQ 6 was posed to examine whether this sentiment was uniform across media outlets.
RQ5: How frequently was (a) COVID-19 misinformation discussed as a problem and (b) President Trump discussed as a source of COVID-19 misinformation?
RQ6: How did different broadcast news stations differ in the amount that they covered (a) COVID-19 misinformation discussed as a problem and (b) President Trump discussed as a source of COVID-19 misinformation?
The final set of research questions were asked to identify the broadcast news sources that were most likely to expose consumers to misinformation about COVID-19.
RQ7: How frequently was misinformation about COVID-19 included in COVID-19-related broadcast news transcripts over the course of the year?
RQ8: How much misinformation in COVID-19-related broadcast news transcripts was corrected?
RQ9: How did the frequency of misinformation referenced in COVID-19-related broadcast news transcripts differ across broadcast news stations?
RQ10: How did correction of misinformation referenced in COVID-19-related broadcast news transcripts differ across broadcast news stations?
4. Method
Transcript collection
Nexis Uni was used to search all transcripts from nightly network newscasts on ABC, CBS, and NBC and selected nighttime cable news network shows on CNN, FOX, and MSNBC using search terms “COVID” and “coronavirus” to generate lists of all transcripts that included at least two sentences that said something about COVID-19 between October 1, 2020, and September 30, 2021. Transcripts from four different nightly shows from each of the three cable news networks were collected (CNN: Anderson Cooper 360, Cuomo Prime Time, The Lead with Jake Tapper, and The Situation Room with Wolfe Blitzer; FOX: Hannity, The Ingraham Angle, The Five, and Tucker Carlson Tonight; and MSNBC: Deadline: White House with Nichole Wallace, The Last Word with Lawrence O’Donnell, The Rachel Maddow Show, and The Reidout with Joy Reid). Programs were selected based on air time (all aired between the hours of 4 and 10 PM EST) and ratings (highest-rated shows selected).
Transcript sampling
For each week, a full sampling frame with the names of all COVID-related transcripts from all stations for that week was created in Excel. Every transcript was given a unique identification number. A random integer set generator (random.org) was used to select a 20% sample of each week’s transcripts to be coded. The final total sample used or the present study included 939 coded transcripts from ABC (n = 120), CBS (n = 131), NBC (n = 171), CNN (n = 220), FOX (n = 148), and MSNBC (n = 149).
Coder training, reliability, and coding procedures
Five undergraduate coders were hired to code content in the Spring of 2021. Coder training involved a series of meetings to familiarize them with the codebook and practice coding articles and transcripts from the same sources that were coded in the official study, but were published in August and September of 2020 before the start date of content coded in this study, as well as real-time content that was aired on shows that were similar to the programs included in the study (e.g. All In with Chris Hayes). Once coders were familiar with all codes and coded several articles and transcripts together, they were then assigned articles and transcripts to code independently to be compared and resolved together in weekly meetings. Throughout the training process, the codebook was edited to include more specific definitions as well as exemplars to aid in coders’ comprehension of problematic codes.
In total, coders were trained on 19 practice articles, each reviewed and discussed throughout 13 hours of structured training in addition to coders’ independent time spent dedicated to coding practice articles ahead of meetings. All training sessions were conducted during April of 2020. This study used a subset of data that was collected for a larger, grant-funded project that included coding newspaper content as well. Based on trends that arose in training and later informed by reliability assessments, two coders were assigned exclusively to broadcast-specific content and two others were assigned exclusively to print-specific content. The final coder was assigned to code both types of content. Intercoder reliability was assessed using 51 broadcast articles coded by the two full-time broadcast coders and one part-time broadcast coder. The coding sheet included several major codes that, if selected as present, then prompted coders to select all relevant subcodes that applied. For example, if coders selected that the transcript included a discussion about COVID-19 severity, coders were then prompted to select all elements of severity that applied, including symptoms, death rates, etc.) To capture coding on the major variable as a whole, reliability on these items was calculated by creating an index for each major code that assessed the degree to which coders’ selection of all sub-codes as a whole was consistent with one another. All variables met a Gwet’s AC (Gwet, 2001) reliability threshold of at least .70 before moving forward with coding sample content. Gwet’s AC was used because several important codes were not very prevalent and this statistics has been shown to be less affected by prevalence and marginal probability than Cohen’s Kappa (Wongpakaran et al., 2013).
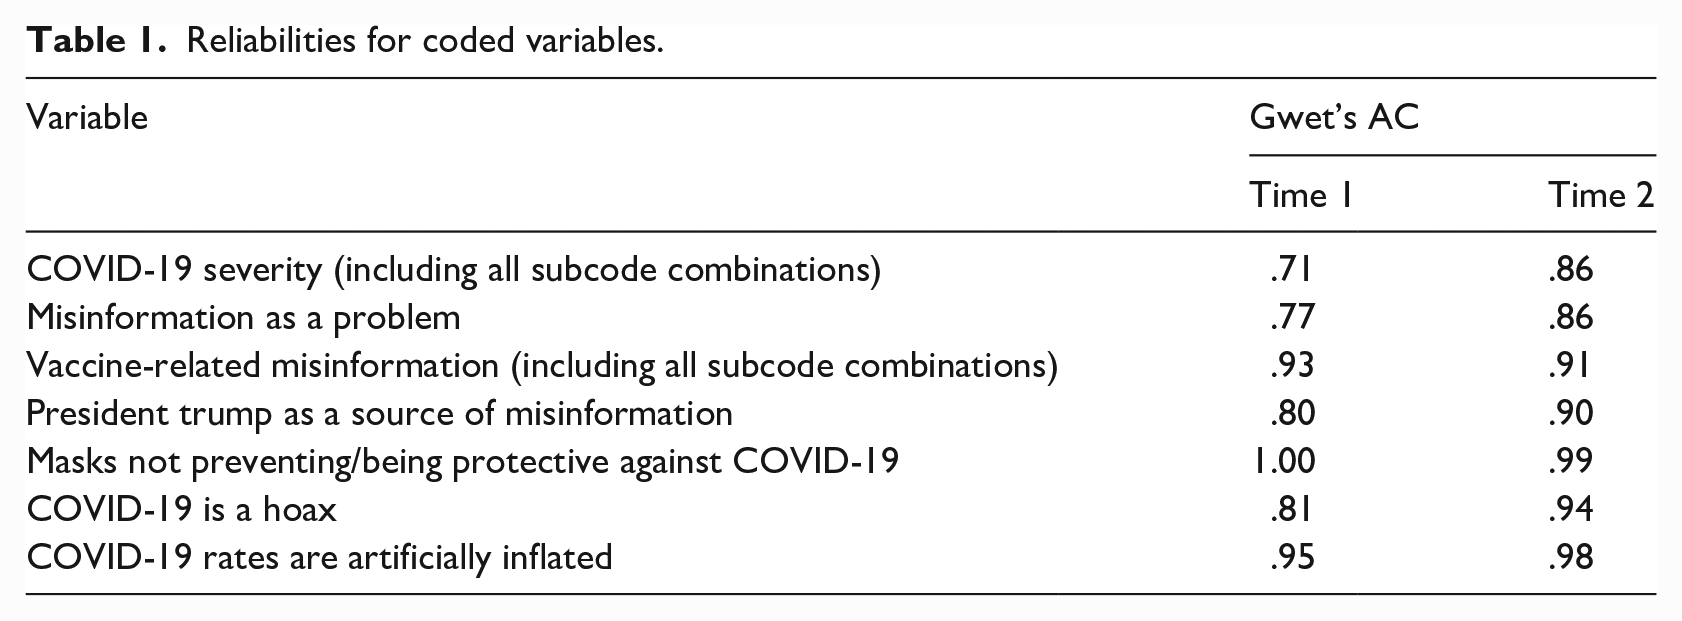
The codebook was expanded in the fall of 2021 to capture additional COVID-19 discourse that did not yet exist when the initial codebook was created (e.g. vaccine-specific information). A second reliability assessment was taken in November 2021 on a subset of transcripts from March 2021 (n = 12). Again, all variables met the threshold of a Gwet’s AC coefficient of at least .70 before assigning additional coding sample content. Coders met with graduate students and postdoctoral members of the research team who had created the codebook to discuss and resolve all disagreements. Gwet’s AC coefficients from both assessments for the variables used in this study are reported in Table 1.
Reliabilities for coded variables.
Two weeks’ worth of content were randomly assigned to broadcast coders each week. The part-time coder left for a full-time work opportunity in September 2021, so the remaining transcripts were coded by the two full-time coders who were each randomly assigned 50% of the broadcast coding content. Coding sheets were accessed through Qualtrics.com. Coding for each transcript was completed as a separate survey.
Codes
The same codebook developed by the research team was used to code both broadcast transcripts and newspaper articles on a number of aspects of COVID-19 news coverage. For the present study, the following items were coded: COVID severity (i.e. describes the dangers of the pandemic, such as the referencing number of cases, death rates, hospitalizations, hospitals being over capacity, long haul symptoms, people on ventilators); misinformation discussed as a problem; President Trump discussed as a source of misinformation, specific widespread misinformation (i.e. researchers searched the fact-checking search engines Factcheck.com and Snopes.com to identify specific pieces of misinformation that were widespread enough in the United States to warrant a correction on these sites), and whether or not each piece of misinformation was refuted. See supplemental material for a copy of the codebook used for all relevant codes.
5. Results
RQs 1–4: Disease severity
The first two RQs asked how often COVID-19 disease severity was discussed in broadcast media over the course of the year (RQ1) and how the frequency of severity differed across broadcast media channels (RQ2). Table 2 reports frequency counts and percentages of transcripts that made reference to severity. Across all content, more than half of all transcripts (n = 531, 56.5%) included statements about the severity of COVID-19.
COVID-19 severity, misinformation, and correction coverage.
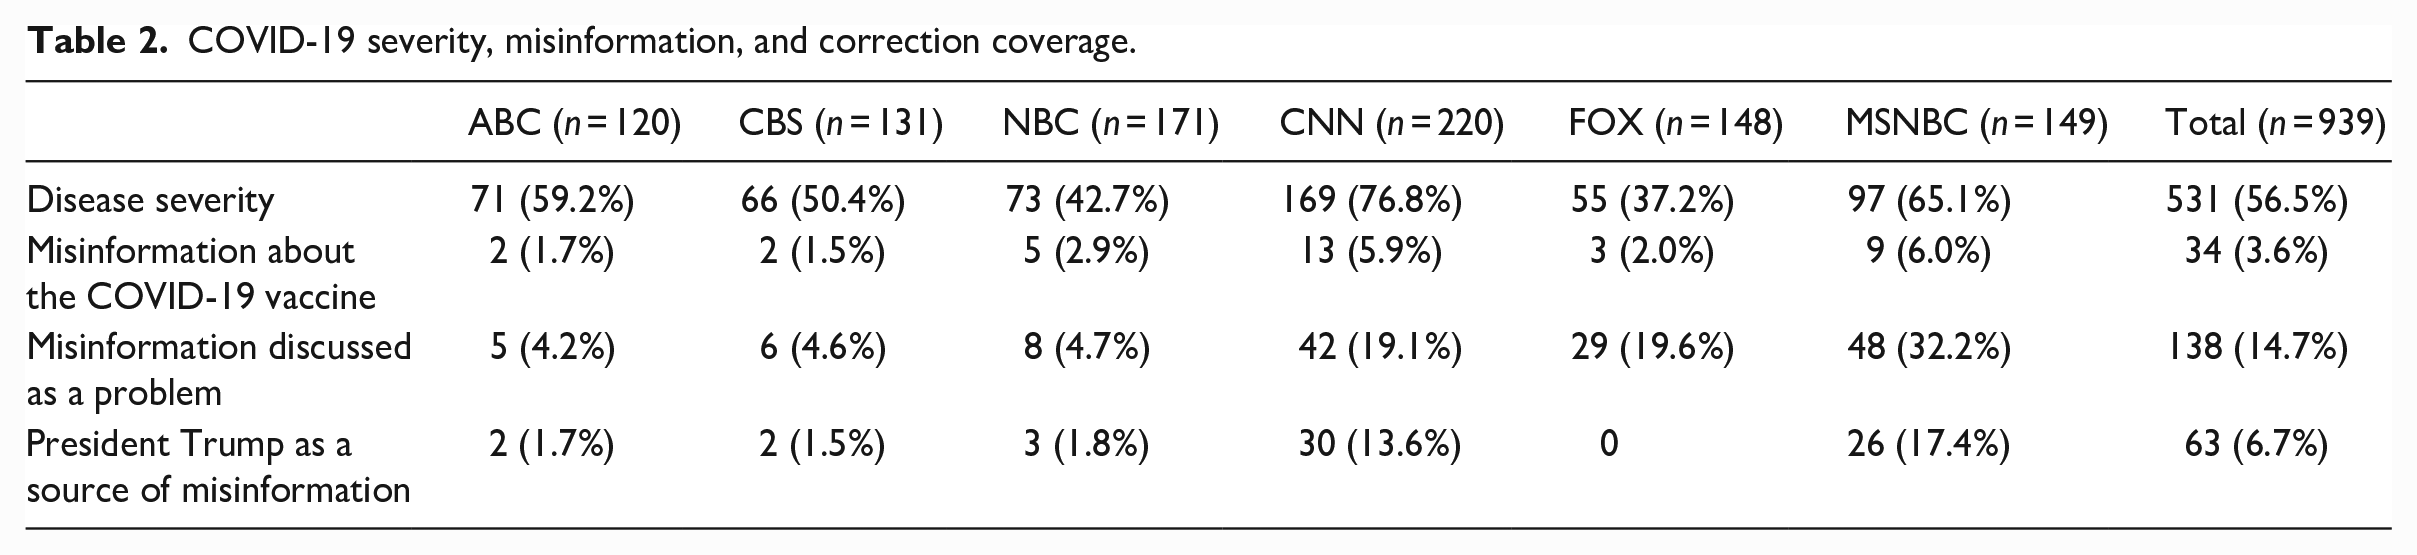
A chi-square test of independence detected a significant relationship between broadcast news station and reference to disease severity in COVID-19-related transcripts, χ2 (5) = 79.59, p < .001. Pairwise z-tests were conducted to detect where significant differences in coverage were present. A Bonferroni correction for multiple tests was applied. Results indicated that severity was referenced in a higher proportion of COVID-related CNN transcripts than ABC (p = .010), CBS (p < .001), NBC (p < .001), and FOX (p < .001) transcripts. MSNBC transcripts also referenced disease severity significantly more often than NBC (p = .001) and FOX (p < .001).
RQs 3 and 4 asked about the nature of severity depictions in COVID-19 broadcast media coverage (RQ3) and how this coverage differed across broadcast media channels (RQ4). Table 3 reports elements covered among COVID-19 transcripts that referenced disease severity. Across all COVID-19 media that discussed disease severity, the number of cases/infections was most often referenced, followed by number of deaths, hospitalizations, and international coverage of deaths, hospitalizations, and cases. Symptoms were the least-often aspect of severity discussed in all COVID-19 broadcast news media coverage.
Elements covered among COVID-19 transcripts that referenced disease severity.
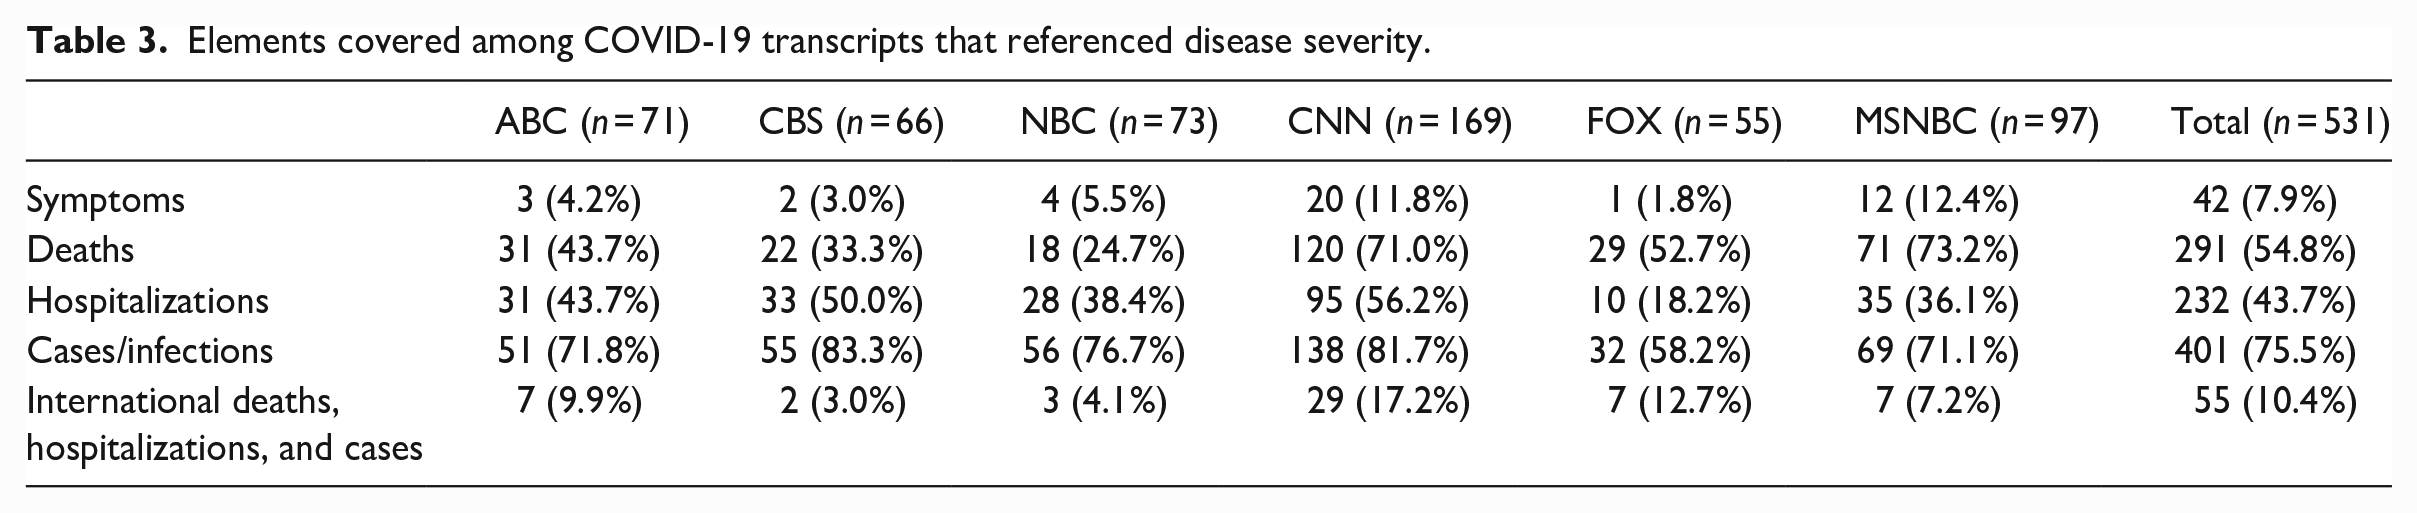
Chi-square tests of independence detected significant relationships between broadcast news station and references to COVID-19 symptoms, χ2 (5) = 13.10, p = .022, death rates, χ2 (5) = 73.88, p < .001, hospitalizations, χ2 (5) = 29.51, p < .001, cases/infections, χ2 (5) = 16.15, p = .006, and international statistics, χ2 (5) = 16.69, p = .005. Pairwise z-tests with Bonferroni corrections for multiple tests indicated that CNN and MSNBC referenced death rates significantly more than ABC (p = .001 and p = .002, respectively), CBS (p < .001 for both), and NBC (p < .001 for both). FOX transcripts also referenced death rates significantly more than NBC (p = .017). CNN transcripts referenced hospitalizations significantly more frequently than FOX (p < .001) and MSNBC transcripts (p = .024). ABC (p = .037) and CBS transcripts (p = .004) also referenced hospitalizations significantly more than FOX transcripts. CBS (p = .033) and CNN (p = .006) referenced cases/infections more frequently than FOX transcripts. Low prevalence rates of symptoms and international coverage did not allow for a Bonferroni correction. Without the adjustment, CNN referenced international coverage more frequently than CBS (p = .004), NBC (p = .006), and MSNBC (p = .022). FOX also referenced international statistics more frequently than CBS (p = .043).
RQs 5–6: Coverage of the misinformation problem
RQs 5 and 6 asked about the frequency of transcripts that referred to (a) COVID-19 misinformation discussed as a problem and (b) President Trump discussed as a source of COVID-19 misinformation. Table 2 reports frequencies and percentages of each for each station. Chi-square tests of independence detected significant relationships between broadcast news stations and reference to COVID-19 misinformation as a problem, χ2 (5) = 77.69, p < .001 and Trump as a source of misinformation, χ2 (5) = 72.17, p < .001.
Pairwise z-tests with Bonferroni corrections for multiple tests indicated that CNN, FOX, and MSNBC referred to COVID-19 misinformation as a problem significantly more often than ABC (p = .002, p = .002, and p < .001), CBS (p = .002, p = .002, p < .001), and NBC (p < .001, p = .001, p < .001). CNN and MSNBC referenced Trump as a source of misinformation significantly more frequently than ABC (p = .003, p < .001) CBS (p = .001, p < .001), and NBC (both ps < .001). Discussion of President Trump as a source of misinformation about COVID-19 was absent from FOX transcripts.
RQs 6–10: Specific misinformation referenced and corrected
RQs 6–10 asked about the frequency of misinformation (RQ5) and its correction (RQ6) in COVID-19-related broadcast news transcripts, and how this presence (RQ7) and correction (RQ8) differed across broadcast news stations. Table 4 reports frequencies and percentages of specific types of misinformation in each broadcast station. The most common type of misinformation included in COVID-19-related transcripts was that COVID-19 is a hoax. The sum of all misinformation included in all transcripts was calculated as a total misinformation index for each station and the sum of all refutations was totaled to create a refutation index, both of which were reported in Table 4 as well. One-Way ANOVA procedures detected significant differences among broadcast media stations in the amount of misinformation referenced in their transcripts, F(5, 938) = 6.31, p < .001, η2p = .04. Post hoc analyses with a Bonferroni correction for multiple tests indicated misinformation was significantly higher in MSNBC transcripts than transcripts from ABC (p = .003), CBS (p = .005), and NBC (p < .001). CNN transcripts contained significantly more misinformation than ABC (p = .045) and NBC (p = .016). Importantly, however, the vast majority of misinformation on these two channels also included a refutation or correction. Among transcripts that included misinformation, a one-way ANOVA detected significant differences across stations in the inclusion of a correction, F(5, 63) = 14.30, p < .001, η2p = .55. Post hoc analyses with a Bonferroni correction for multiple comparisons highlighted that misinformation on FOX was significantly less likely to include a correction than NBC (p = .006), CNN (p < .001), and MSNBC (p < .001). Figure 1 depicts the proportions of uncorrected and corrected misinformation coded in transcripts from each of the six news networks.
Specific COVID-19 misinformation and correction contained within transcripts.
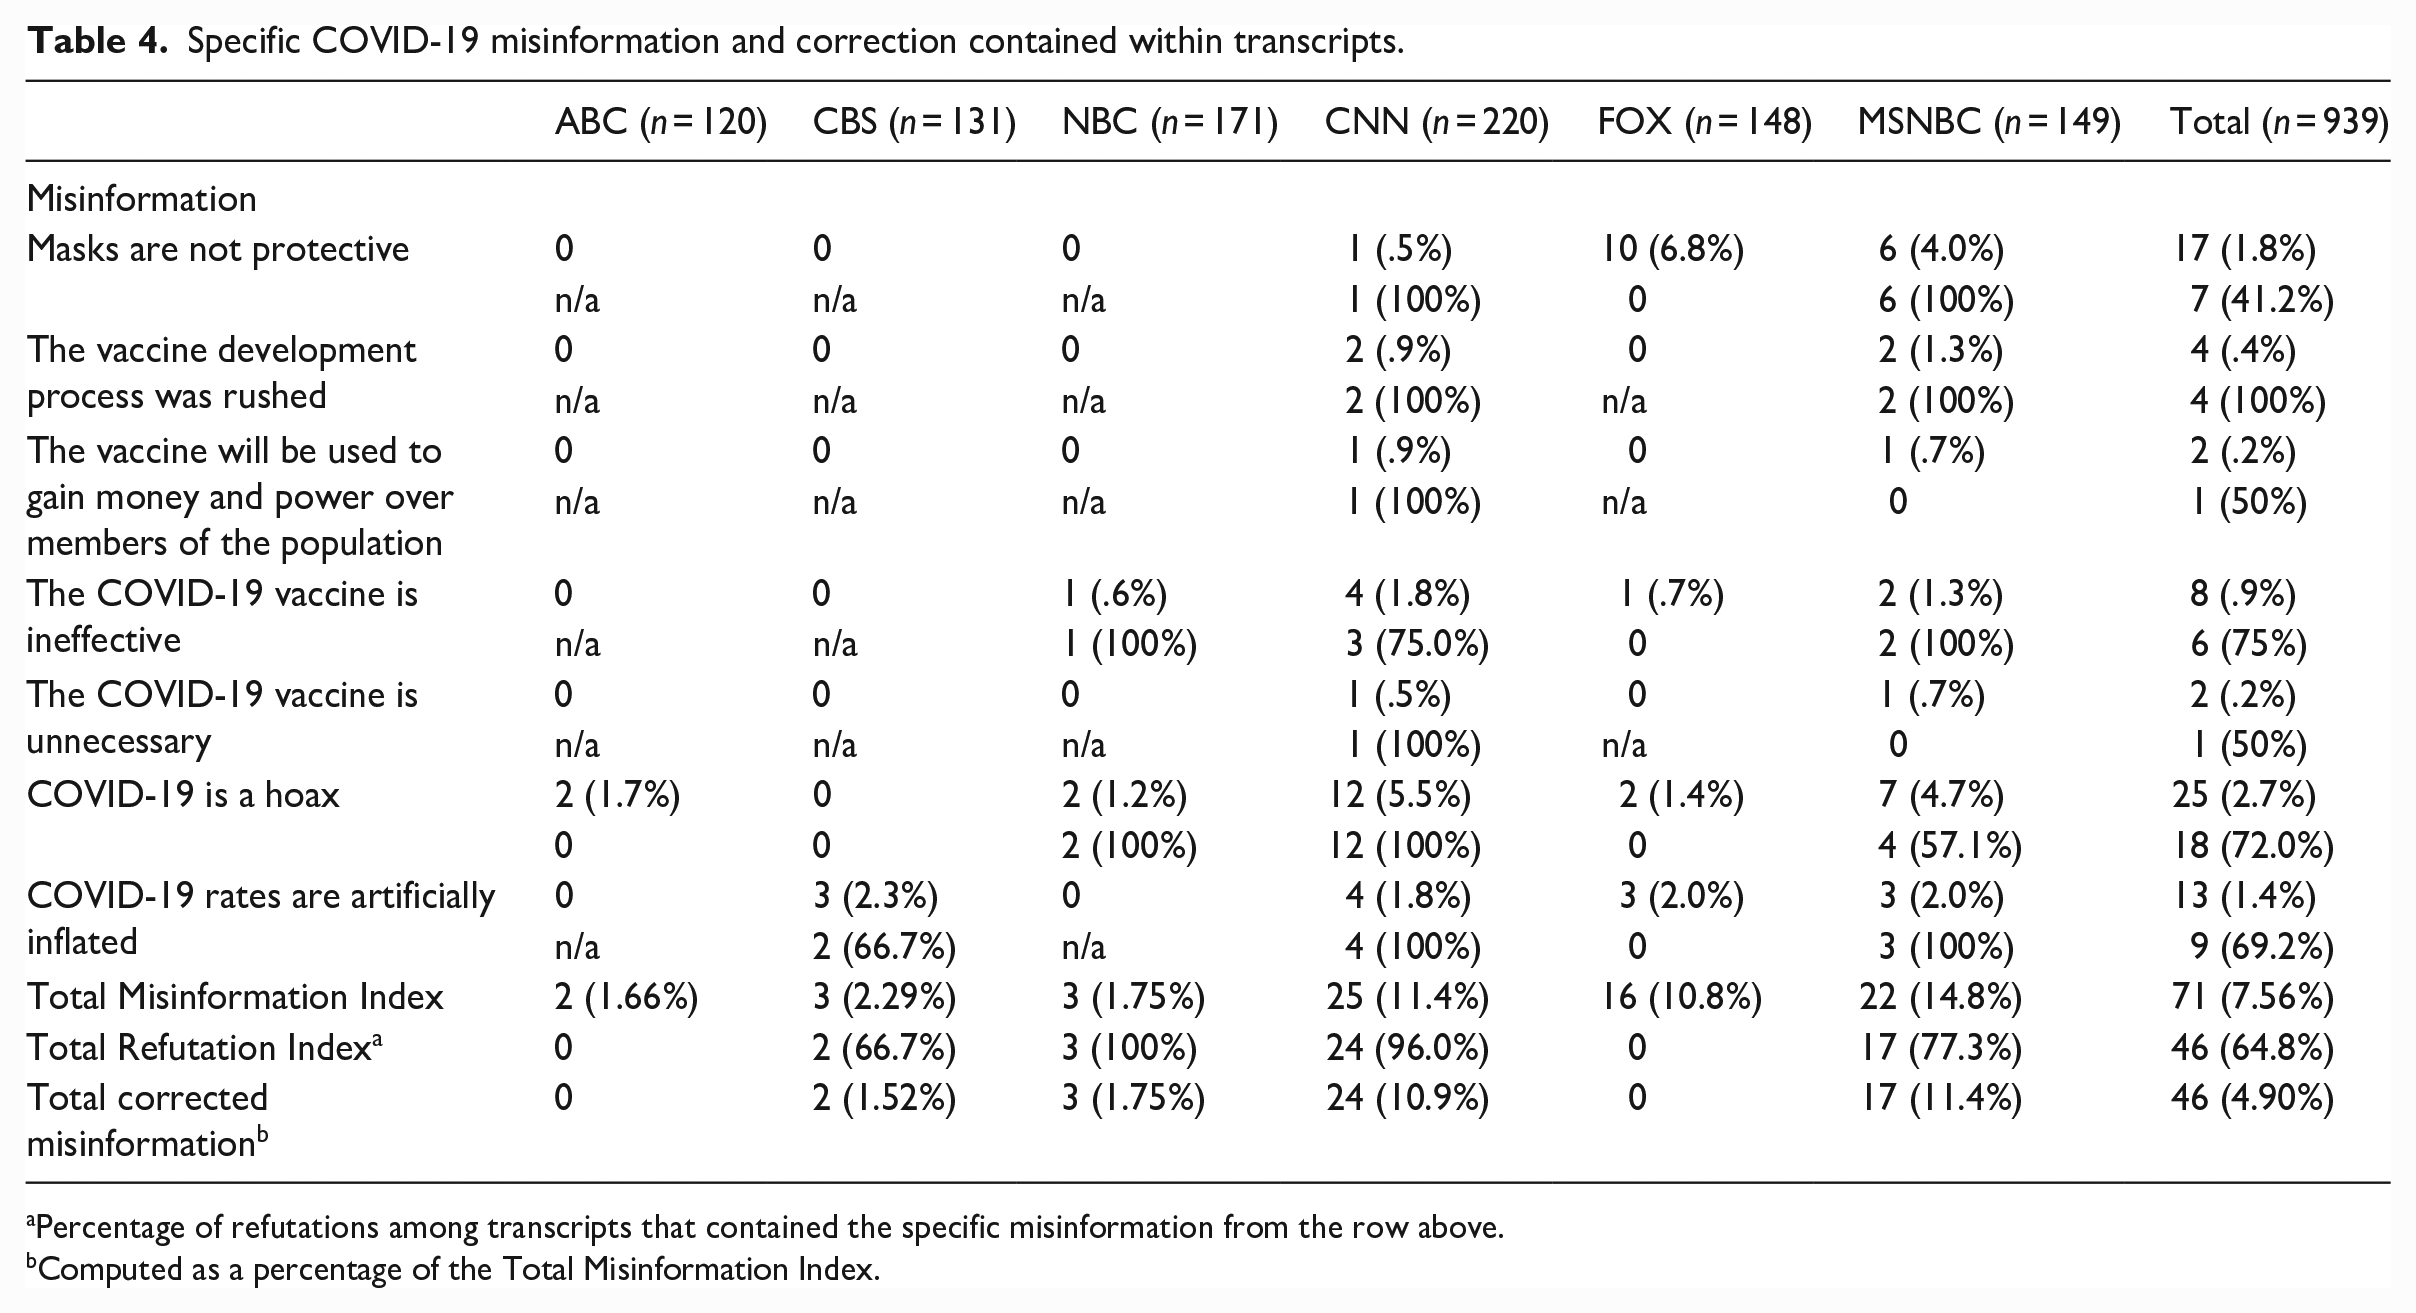
Percentage of refutations among transcripts that contained the specific misinformation from the row above.
Computed as a percentage of the Total Misinformation Index.
6. Discussion
The COVID-19 pandemic in the United States has been marked by divisions in perceptions of disease severity as well as misperceptions about the virus and vaccine that vary along ideological and political party lines. The IHSM suggests that differences in COVID-19 perceptions may be due to differences in the information about the virus that individuals are exposed to within their own identity-affirming ideological news bubbles. The present study was undertaken to examine differences in the degree to which each channel included information about disease severity and misinformation about the virus and its vaccine. Results from this study provide insight into the content of the IHSM’s proposed ideological media bubbles that contribute to partisan divides in perceptions about the COVID-19 pandemic.
The first four research questions were proposed to identify potential sources of partisan discrepancy in perceptions of disease severity. CNN and MSNBC covered disease severity more often than other stations. Severity was most often discussed in terms of cases/infections and death rates and less so in terms of symptoms, hospitalizations, and comparisons to international rates. These findings are consistent with the IHSM proposal that differences in the content of media will be consistent with consumers’ attitudes and intentions about the topic, as it was previously noted that Republicans and conservatives, who are less likely to believe that the virus is severe (Ruisch et al., 2021; VanDusky-Allen and Shvetsova, 2021), did not trust the two networks that most often discussed disease severity (Jurkowitz et al., 2020). Furthermore, Democrats and liberals were more trusting of these stations and they are also generally more likely to believe the virus is severe. Republicans and conservatives were more likely to trust FOX news for COVID-related information, which referenced disease severity the least across all networks (Jurkowitz et al., 2020).
The next set of research questions was posed to examine how misinformation was discussed, the prevalence of misinformation about COVID-19 across national broadcast news sources, and the degree to which this misinformation was corrected within each broadcast. CNN, MSNBC, and FOX all discussed misinformation as a problem significantly more often than the network news channels did. CNN and MSNBC also discussed President Trump as a source of COVID misinformation significantly more than network news. Despite covering the topic of misinformation as a problem more often than network news, FOX made no reference to President Trump as a source of misinformation at all. Thus, those who consume network news exclusively are unlikely to be exposed to any discussion of misinformation as a problem, and the way that the misinformation problem is discussed on cable news differs between the network most trusted by Republicans and conservatives (FOX) and the networks that are more trusted by Democrats and liberals (CNN and MSNBC), with CNN and MSNBC acknowledging the role of President Trump in the creation and spread of misinformation, and FOX excluding Trump from the conversation about misinformation.
The most prevalent misinformation statement included in the transcript was that COVID-19 was a hoax, which was most often present in transcripts from CNN and MSNBC. This misinformation statement was refuted 100% of the time on CNN, but only a little over half of the time on MSNBC. This is inconsistent with the proposition that consumers’ attitudes and behavioral intentions will match the information provided within their chosen media bubble, as MSNBC is most trusted by Democrats and liberals who are more likely to take the pandemic seriously and not as a hoax. It might be useful to conduct a follow-up study to code misinformation statements in a more qualitative manner rather than just marking as present/absent to determine whether statements were made in a sarcastic manner or delivered as an example in a story about misinformation, but never specifically refuted. Nonetheless, uncorrected misinformation statements are cause for concern in the public health community.
No single piece of misinformation that was coded for was highly prevalent in the transcripts, but as a whole, the cable news outlets—CNN, MSNBC, and FOX included the most misinformation statements in their transcripts, whereas network news stations—ABC, CBS, and NBC made little to no reference to misinformation and included almost no misinformation statements within their broadcasts. This is unsurprising as network channels spend considerably less time airing news content, so their news broadcasts only have time to provide factual information and updates, whereas 24-hour news networks on cable TV fill time with punditry and reflection on a news story after the factual updates are provided.
CNN and MSNBC included significantly more misinformation claims than network news, but the vast majority of their misinformation claims were corrected (especially CNN with 96% of misinformation statements corrected within the transcript). Therefore, it seems that most of the misinformation claims made on CNN and MSNBC may have been brought up for the specific purpose of correcting them. None of the misinformation claims made on FOX were corrected. Therefore, although FOX news included slightly less misinformation statements than CNN and MSNBC, it contained more uncorrected misinformation statements than all other networks combined. This is consistent with prior research that found that consumption of FOX news was a significant correlate of misperceptions about the virus (Jamieson and Albarracin, 2020; Maloney et al., 2022).
In addition to FOX News consumption, Maloney et al. (2022) identified MSNBC consumption as an additional positive correlate of misperceptions about COVID-19. Given the finding from the present study that MSNBC did contain more misinformation statements than network news, this raises the long-standing question in the literature on misinformation correction about whether restating misinformation for the purpose of correcting it does more harm than good by making the misinformation more familiar and accessible in people’s memories. Data from the present study indicated that CNN contained even more misinformation statements that were then corrected, but Maloney et al. (2022) found that CNN consumption was a significant negative correlate of misperceptions, which suggests that discussing misinformation to correct it does not always backfire. Future studies might probe into whether there are qualitative differences between CNN and MSNBC in the structure or presentation of correctives and whether one format is more effective at correcting misperceptions than the other.
Limitations
Like all studies, the data presented in this manuscript are limited in some aspects. First, due to the large volume of COVID-19-related stories aired over the course of the year and the taxing nature of manual coding, we limited the coded content to 20% of the total content in our sampling frame. Articles were randomly selected by week in an effort to make the coded sample representative of the whole, but due to the low prevalence rates of some of the coding categories, it is possible that a handful of atypical articles randomly selected from throughout the year could have a large impact on results. Results from the analysis were mostly in line with what would be expected based on the literature, however, which makes it more likely that findings were due to systematic differences picked up in the representative sample rather than atypical articles selected by chance skewing the data in exactly the way that happens to be consistent with theoretically derived predictions.
For the present study, data from different television shows were collapsed to compare news coverage at the news network level. While this serves as an adequate first step for linking news media content to consumer perceptions and attitudes, it should not be expected that most people regularly consume every show that airs on a single network, or that different shows within a network will cover a topic in exactly the same way. Future studies may analyze data at the program level rather than the network level to get an even clearer picture of the nature of content to which viewers of different programs are exposed.
Overall, the present study contributes to the literature by providing information about the specific content of the vast broadcast media coverage of the COVID-19 pandemic, but it is only a first step in gaining a full understanding of the news media system through which information about COVID-19 was delivered in the United States. In addition to further analyzing the content of news broadcasts and connecting it to trends in beliefs that are typical of consumers of each channel, future research may use survey and experimental methods to establish the effects of exposure to different information provided within each channel. Research in this area across multiple disciplines acknowledges a distinction between misinformation and disinformation, with the latter being marked by its creation and spread with the intention of misleading (e.g. Scheufele and Krause, 2019; Southwell et al., 2019; Tandoc et al., 2018). Distinguishing between misinformation and disinformation fell outside of the scope of the present study as it would be impossible to attribute true intent to reporters outside of sheer speculation; however, future research may explore ways to uncover the intent of a false report and examine any differences this intention may make among message recipients.
Supplemental Material
sj-docx-1-pus-10.1177_09636625231179588 – Supplemental material for COVID-19 coverage from six network and cable news sources in the United States: Representation of misinformation, correction, and portrayals of severity
Supplemental material, sj-docx-1-pus-10.1177_09636625231179588 for COVID-19 coverage from six network and cable news sources in the United States: Representation of misinformation, correction, and portrayals of severity by Erin K. Maloney, Allie J. White, Litty Samuel, Michele Boehm and Amy Bleakley in Public Understanding of Science
Footnotes
Acknowledgements
The authors would like to acknowledge Jessica Langbaum, Ph.D., from Banner Alzheimer’s Institute, who is a Co-PI on the grant from the National Institute of Aging that funded this project.
Declaration of conflicting interests
The author(s) declared no potential conflicts of interest with respect to the research, authorship, and/or publication of this article.
Funding
The author(s) disclosed receipt of the following financial support for the research, authorship, and/or publication of this article: National Institute on Aging: 3R01AG063954-02S1.
Supplemental material
Supplemental material for this article is available online.
Author biographies
References
Supplementary Material
Please find the following supplemental material available below.
For Open Access articles published under a Creative Commons License, all supplemental material carries the same license as the article it is associated with.
For non-Open Access articles published, all supplemental material carries a non-exclusive license, and permission requests for re-use of supplemental material or any part of supplemental material shall be sent directly to the copyright owner as specified in the copyright notice associated with the article.