
Abstract
Women are a minority in science, technology, engineering and mathematics academic careers. In particular, few women in Japan choose to study physics and mathematics. In this study, we investigated the factors contributing to the masculine image of physics and mathematics based on the framework of our expanded model. We conducted online questionnaire surveys in Japan and England, and found that physics and mathematics occupations, and mathematical stereotypes were both related to a masculine image. Only in Japan were social factors, such as a person’s attitude to intellectual women, related to viewing mathematics as ‘masculine’. However, the experience of being told or having heard that the choice of a particular course of studies would make someone less attractive to the opposite sex was evident only in England. This finding suggests that social factors affect the masculine image of physics and mathematics, and that this could vary depending on the country.
Keywords
1. Introduction
Women are a minority in STEM (science, technology, engineering and mathematics). According to the Organisation for Economic Co-operation and Development (OECD), women’s participation in “science, mathematics and computing” at the university level averages 39% worldwide. However, this figure varies with the country; the highest ranked countries are Portugal (57%), Italy (53%), and Turkey (50%), while the United Kingdom (46%) and the United States (40%) rank just above the OECD average. Japan (25%) ranked below the average (OECD, 2017).
In Japan, comparatively few women study physics and mathematics. The percentage of first-year female university students was only 16% in physics and 20% in mathematics (Ministry of Education, Culture, Sports, Science and Technology, 2018). A recent study in Japan asked 1086 members of the public how well 18 fields (including 12 STEM fields) were suited for women. The percentage of participants who answered “strongly agree” or “agree” that a field was suited was smallest in mechanical engineering. Physics ranked second from the bottom, and math ranked fourth from the bottom. These subjects were seen as unsuitable for girls in terms of gender, suggesting that the Japanese public considers STEM subjects as better suited to men than women (Ikkatai et al., 2020). Also, in the United Kingdom, physics (Archer et al., 2017; DeWitt et al., 2019; Francis et al., 2017) and mathematics (Smith, 2014) are perceived as masculine fields. In total, 92% of secondary school girls agreed that working in a STEM job would allow them to make a good living, but 67% believed that STEM jobs were male dominated, and 49% agreed that STEM jobs were hard to get for women (Cassidy et al., 2018). These results suggest that a masculine image of physics and mathematics could be preventing girls from choosing physics and mathematics, not only in Japan but also in the United Kingdom.
2. Literature review: Comparing Japan and the United Kingdom
Cross-cultural survey
It is often hard for people to notice the social climate within their own country, as it is obvious to them. Studies of STEM issues have been mainly focused on Western countries, and studies in Asian countries are very limited. For example, Shin et al. (2018) compared career motivation in STEM between Indonesia and Korea. The authors found that while Korean students’ science literacy was higher than Indonesian students’, their motivation toward STEM was lower (Shin et al., 2018). In another study, Lummis and Stevenson (1990) reported that mothers were likely to perceive that girls are better at reading than boys in Taiwan, Japan, and the United States. Cross-cultural studies such as these help to draw attention to the social climate and clarify issues in STEM that each country needs to tackle.
We investigated the factors contributing to the masculine image of physics and mathematics, using cross-cultural surveys between Japan and the United Kingdom, especially England. Japan and England have similar situations: few girls choose physics and mathematics, though these subjects are provided in the national school curriculum. However, the level of gender equality and the social climate are markedly different. Cross-cultural comparisons could lead us to find clues to ways to change the masculine image of physics and mathematics and to increase the number of women in those fields.
Underrepresentation of girls in physics and mathematics
First, girls in high schools choose physics and mathematics less often than boys in both countries. In Japan, in the educational guidelines released in 2012 (Ministry of Education, Culture, Sports, Science and Technology, n.d.), all students study science in addition to mathematics at high school. Science is divided into four basic subjects (basic physics, basic chemistry, basic biology, and basic earth science), four advanced subjects (physics, chemistry, biology, and earth science), plus two other subjects. The students choose one subject among the four basic subjects along with “science and our daily lives”, or choose three basic subjects.
Overall, for both genders physics (22.8%) and earth science (1.2%) were chosen less often than chemistry (38.3%) and biology (28.2%) (Ministry of Education, Culture, Sports, Science and Technology, 2019). One of the reasons for the low percentage of students selecting earth science was the small number of earth science teachers (Tamura, 2008). In 2008, girls dominated advanced biology (Biology II in the old guidelines: girls, about 60%; boys, about 40%), and boys dominated advanced physics (Physics II: girls, about 20%; boys, about 80%) (Center for Promotion of Science Education, Japan Science and Technology Agency, 2010). These percentages show that Japanese girls choose physics less often than boys at high school.
In the United Kingdom, high school students planning to enter university take GCE (General Certificate of Education) A-Levels in the sixth form (final 2 years of high school) after the GCSE (General Certificate of Secondary Education). Students take AS-Level exams at the end of the first year and A2-Level exams at the end of the second year. Their performances are graded from A* to E. The A-Level exams in the United Kingdom, however, differ slightly depending on the location (England, Wales, and Northern Ireland), for example, in the timing of AS exams and the contribution of AS-levels to A-Level (Gov.uk, n.d.). Students need to choose more than three from among 100 subjects (not all subjects are available at all schools) that relate to their preferred university courses. They can choose the subjects they want to learn, but some university courses list desirable A-Level subjects in advance. For A Levels in 2019, girls were dominant in biology (43,555 of 69,196 or 62.9%) and chemistry (31,757 of 59,090 or 53.7%), but girls were in the minority in mathematics (35,605 of 91,895 or 38.7%) and physics (8799 of 38,958 or 22.6%) (Joint Council for Qualifications, 2019).
Second, women at university choose physics and mathematics less often than men in both countries. The percentages of first-year Japanese female university students were only 16% in physics and 20% in mathematics, which were lower than the percentages for chemistry (31%) and biology (38%) in 2018 (Ministry of Education, Culture, Sports, Science and Technology, 2018). Similarly, in the United Kingdom, the percentage of women at the undergraduate level was 41% in both “mathematics and statistics” and “physical science” in 2015, which were lower than “life science” (60%, OECD, 2015).
However, in 2019, for the first time girls in the United Kingdom overtook boys in core STEM A-Levels entries (including physics, maths, advanced maths, chemistry, computing, ICT, design and technology, and other sciences; The Guardian, 2019), suggesting that girls in the United Kingdom are more likely than before to choose physics and mathematics.
Social climate for gender roles
We posited that the social climate surrounding gender roles would affect female underrepresentation in physics and mathematics in Japan. Importantly, the social climate, including at least the four aspects outlined, differs markedly between Japan and the United Kingdom (Table 1).
Points of difference between Japan and the United Kingdom.
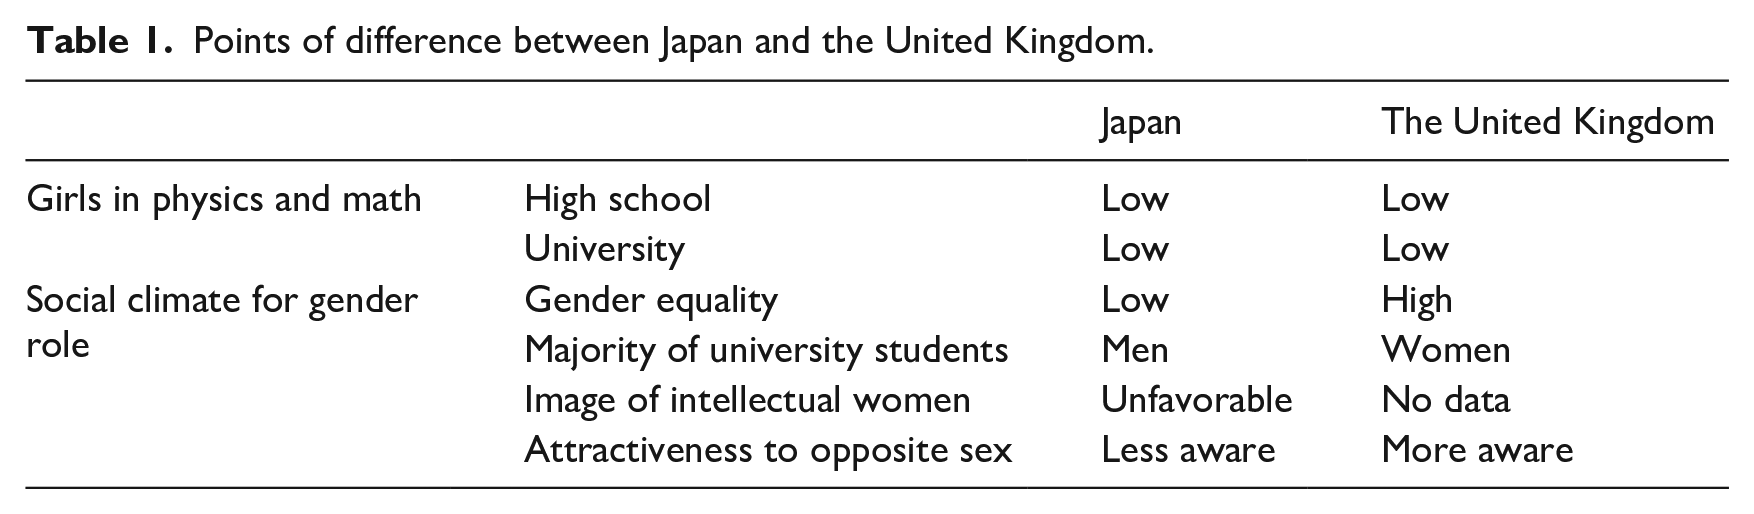
First, gender equality is higher in the United Kingdom than in Japan. Global Gender Gap Index (GGI) rankings, published annually by the World Economic Forum, are used to show gender equality in various countries. This index measures gender equality in four fields: health, economics, politics and education. A higher GGI ranking indicates greater gender equality. The United Kingdom ranked 15th and Japan ranked 110th out of 149 countries on the GGI in 2019, meaning that Japan has a lower level of gender equality at the international level (World Economic Forum, 2019).
Second, the percentage of bachelor’s or equivalent level degrees is higher for women than men in the United Kingdom (men, 43.7%; women, 56.3%) and most of the other countries in the OECD, but not in Japan (men, 54.9%; women, 45.1%) (OECD, 2015), suggesting that more women than men in the United Kingdom go to university. One factor associated with this gender gap is parents’ attitudes toward their children’s education. One study targeting 116 Japanese mothers showed that they tended to desire a bachelor’s degree for their sons, but a short-term college degree for their daughters (Holloway et al., 2005). This suggests that at least some Japanese mothers desire higher educational attainment for their sons than for their daughters. Japanese people are likely to have the view that a university education is more important for men than women.
Third, intellectual women are not often preferred in Japanese society. Holloway et al. (2005) described the case of a Japanese woman who believed that her daughter would lose the opportunity to be happily married if she had an advanced education. Two-income households were in the minority until 1997 (Gender Equality Bureau Cabinet Office, 2018) and it was difficult for women to continue working. Therefore, Japanese women feel strong pressure from their parents to get married, and parents often advised their daughters not to choose science because this was seen as a barrier for their marriage. The ability to do mathematics and physics is perceived as synonymous with being intellectual, and mathematicians and physicists are often perceived as geniuses. Their experiences have been posted on the Internet, as well as some comments by their parents, including “You cannot get married if you choose science” (Gakken Shingaku Henshūbu, 2017), and “A girl who studies science at a university in Tokyo will probably not be able to get married” (Yomiuri Kyōiku Nettowāku, 2018). Many Japanese people are likely to have the view that women should not be too intellectual, but it is unclear whether people in the United Kingdom have this same view.
Fourth is that people in the United Kingdom may be more aware of their own attractiveness to the opposite sex than Japanese. In the United Kingdom, in 2015, 60% of teenagers and only 30% of those in their 20s were unmarried and had no boyfriend or girlfriend. However, in Japan, 90% of teenagers and nearly 60% of those aged in their 20s were unmarried and had no boyfriend or girlfriend. These percentages for Japan were the highest among seven countries: Japan, South Korea, the United States, the United Kingdom, Germany, France, and Sweden (Maita, 2016). This suggests that social pressure from peers for experiencing romance is stronger in the United Kingdom than in Japan. One study observed that German middle-school boys reported disliking girls who liked physics and girls who performed well in physics reported feeling unpopular with boys (Kessels, 2005). We consider that this aspect of the social climate may differentially affect the choice of STEM in the United Kingdom and Japan, but this has yet to be examined.
These indicate that the social climate in Japan and the United Kingdom differ in at least four aspects. However, it is not clear which aspects of social climate are related to the girls’ underrepresentation in physics and mathematics. To intervene in girls’ underrepresentation in physics and mathematics in Japan, it is important to clarify the contributing aspects. We thus investigated this relationship using cross-cultural survey based on the model proposed in the United States by Cheryan et al. (2017).
3. Theoretical framework
A model proposed by Cheryan et al
Cheryan et al. (2017) proposed a model explaining women’s lower representation in physics, engineering, and information science over mathematics, chemistry, and biology in the United States after reviewing the literature for statistical reliability, variability, and gender disparities. The model looked at the following three factors: Factor 1, Factor 2, and Factor 3.
Factor 1 (“masculine culture of the fields”) consisted of the following three items of masculine perception: (1A) stereotypes of people in the fields, (1B) negative stereotypes of women’s abilities, and (1C) lack of female role models. In (1A), two stereotypes were included: that people in STEM have masculine traits and interests or that they are male. For example, in the United States, when high school students were instructed to write about a scientist, some described the scientist as a man wearing a white coat and working in a laboratory (Mead and Métraux, 1957). Also, a large percentage of elementary school students in the United States drew men when instructed to draw a scientist (Barman, 1997).
Factor 2 (“insufficient early experience”) included the following two items: (2A) few course offerings and (2B) freedom to choose courses. For (2A), the STEM curriculum differs depending on the state and the school in the United States. Regarding (2B), mathematics is most likely to be required and biology is the next requirement in US high schools (Cheryan et al., 2017).
Factor 3 is “gender gaps in self-efficacy.” Self-efficacy is the belief in someone’s own ability to be successful at a certain task (Bandura, 1994). PISA (Programme for International Student Assessment) results from 2012 for 15-year-old students showed that boys and socioeconomically advantaged students are more likely to have high levels of self-efficacy for mathematics than girls and socioeconomically disadvantaged students (OECD, 2013).
Experimental evidence was found for a relationship between Factor 1 and the lower representation of women in computer science, engineering, and physics, and between Factor 1 and Factor 3 (Cheryan et al., 2017). They explained that Factor 2 is a less potent for the following two reasons: first, there are some fields (e.g. nursing and psychology) that women are more likely to choose despite having less experience of these fields in childhood; second, mathematics is a field that women choose more often than physics, engineering, and information science, but the number of women in mathematics at the PhD level is limited. Cheryan et al. (2017) indicated that early educational experience is important for encouragement, but the cultural setting may also be important for bringing the greatest changes.
Revising the model
We argue that this model (Cheryan et al., 2017) could explain the underrepresentation of women not only in the United States but also in other countries, and that the model could also explain the masculine image of physics and mathematics among the public in Japan and the United Kingdom. We therefore modified this model based on the Japanese situation and devised a new model to explain the masculine image of physics and mathematics in Japan and the United Kingdom.
First, we modified Factor 1 (“masculine culture of the fields”) to include the following four items: (1a) occupation, (1b) mathematical stereotype, (1c) smartness of people, and (1d) female role model.
More specifically, (1A) “stereotypes of people in the fields” in the Cheryan et al. model was rephrased to (1a) occupation and (1c) smartness of people. In (1a), Japanese university students regarded the occupation of physicist as a job for men (Adachi, 2014), suggesting that occupation and gendered image are closely related. For (1c), one study reported that women are underrepresented in fields where people believe that “brilliance” was required for success. Physics and mathematics are fields that people believe require brilliance, and fewer women are represented at the PhD level among STEM disciplines in the United States (Leslie et al., 2015). Although this kind of study has not been conducted in Japan, we considered Japanese people as likely to share the image of smartness being required for some STEM fields.
(1B) negative stereotypes of women’s abilities in the Cheryan et al. model were rephrased to (1b) mathematical stereotype. The belief that women are not good at mathematics and science is a negative stereotype of women’s abilities, which discourages women from studying STEM subjects. Spencer et al. (1999) reported that the performance of women at mathematics fell more than men when they were told that there was a gender difference in mathematical ability. However, if women were told that there was no such gender difference, their performance in mathematics was equal to that of men. The type of fear that increases negative stereotypes of groups is known as the stereotype threat. In Japan, it is reported that the motivation to study mathematics in junior high school and high school girls decreased when they scored highly in mathematics but were praised with the expression “Good job, even though you’re a girl” more than they when they were praised with just “Good job” (Morinaga et al., 2017).
(1C) the lack of female role models in the Cheryan et al. model was rephrased to (1d) female role model. A female high school teacher in STEM subjects would be a good role model for students; however, most of these teachers are men. In 2009, only 14.5% of high school science teachers in Japan were women (National Institute for Educational Policy research, 2009). Another role model could be a scientist in mathematics and physics, but female mathematicians and physicists are comparatively few. Women were only 6% of the members of the Physical Society of Japan and only 7% in the Mathematical Society of Japan in 2017 (The Japan Inter-society Liaison Association Committee for Promoting Equal Participation of Men and Women in Science and Engineering, 2017).
We modified Factor 2 (“insufficient early experience”) including the following two items: (2a) childhood experience and (2b) pressure of the choice of subjects. Factor 2 was less potent in the model of Cheryan et al. We included Factor 2 in the revised model as it remains unclear whether Factor 2 is less potent in Japan. However, we removed (2A) “few course offerings” because in the current Japanese education guidelines (Ministry of Education, Culture, Sports, Science and Technology, n.d.), mathematics and science (all areas) are compulsory subjects at elementary schools and junior high schools. Instead, we added (2a) “childhood experience,” which is the opportunity to experience games in physics and mathematics before secondary school (playing outside, at home, in the classroom, or at museums or libraries). A Japanese report indicated that opportunities to experience science, such as visiting science museums at an early age, could lead to later motivation to take science subjects (Libertas Consulting Co., Ltd, 2018). However, it has not examined whether experiences of physics or mathematics at an early age affect their later gendered perception of mathematics and physics.
(2B) “Freedom to choose courses” in the Cheryan et al. model was rephrased with (2b) pressure to choose subjects. All Japanese high school students learn Mathematics I as well as selected science subjects. Students can choose between physics, chemistry, biology, and earth science. However, students’ choices—especially girls’ choices—are biased toward chemistry and biology (Ministry of Education, Culture, Sports, Science and Technology, 2019). We considered that some students may feel pressure to choose subjects due to their gender suitability.
Factor 3 is “gender gaps in self-efficacy,” which is the same as the Cheryan et al. model. In Japan, the index of self-efficacy for boys (–0.24 ± 0.04) was higher than for girls (0.60 ± 0.03) (OECD, 2013). PISA results from 2015 showed that the OECD’s average (for 41 countries) for self-efficacy for science literacy was higher in boys (mean index of self-efficacy, 0.14 ± 0.00) than girls (–0.06 ± 0.00) (OECD, 2016a, 2016b) The gender gap for self-efficacy in Japan (–0.33 ± 0.03 in boys and −0.59 ± 0.03 in girls) was larger than the OECD average, suggesting that girls in Japan have lower self-efficacy for science and mathematics than boys.
Factors 1–3 in the revised model did not include the social climate for gender roles, which we considered as a candidate factor contributing to the masculine image of physics and mathematics. We then included “social climate surrounding gender roles” as Factor 4, adding this to the three factors studied by Cheryan et al. (2017). Factor 4 consists of the following four items: (4a) gender equality, (4b) view of university education, (4c) view of intellectual women, and (4d) attractiveness to the opposite sex.
(4a) individual attitudes toward gender equality can be measured by the short form of the SESRA-S (Scale of Egalitarian Sex Role Attitudes), a scale to measure individual egalitarian attitudes for gender roles that has been widely adopted in the field of psychology. It consists of 15 items, each rated on a 5-point scale. The total score of 15 items shows the level of attitudes toward gender equality. Higher scores show that respondents have a more gender equal attitude. The SESRA-S scores of Japanese are lower than US respondents (Suzuki, 1991). (4b) “View of university education” measures attitudes toward educational achievement by gender. Some people want higher educational attainment for boys than girls. (4c) “View of intellectual women” measures attitudes toward intellectual women, who have in the past been treated poorly by Japanese society. (4d) “Attractiveness to the opposite sex” covers the experience of being told or having heard that the choice of a particular course of study would make someone less attractive to the opposite sex, which may be stronger in the UK than in Japan. 1 We considered that the four items in Factor 4 captured the social climate surrounding gender roles in both Japan and the United Kingdom.
Expanded model
Cheryan et al.’s model consisted of three factors: Factor 1, “masculine culture of the fields”; Factor 2, “insufficient early experience”; and Factor 3, “gender gaps in self-efficacy” (Cheryan et al., 2017). We revised those three factors and added Factor 4 (“social climate surrounding gender roles”) to create our expanded model (Figure 1). Cheryan et al.’s model shows “women’s underrepresentation in physics, engineering, and information science” established through survey of the literature. However, our expanded model explains the “masculine image in physics and mathematics” through quantitative investigation of the expanded model using an online questionnaire survey.
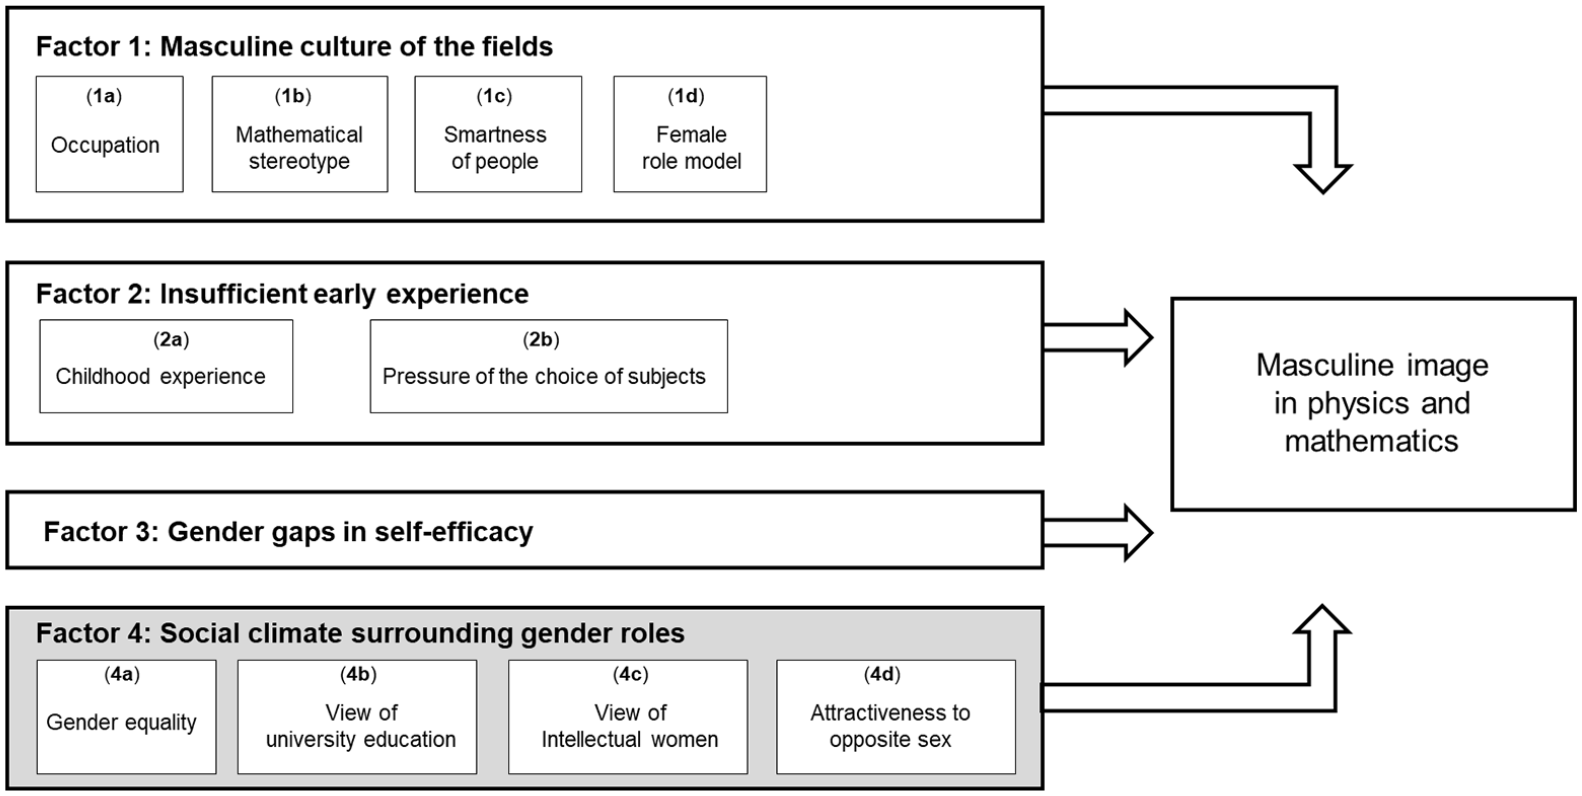
Expanded model, explaining the masculine image of physics and mathematics. Factor 4 was added to the model proposed by Cheryan et al. (2017).
4. Research questions
We conducted two online surveys in Japan and England, using the expanded model, to investigate factors related to the masculine image of physics and mathematics. We limited the collection of responses to people in England, as A-Level education systems at high school vary among areas in the United Kingdom. The research questions were the following:
Which items in the expanded model are significantly related to the masculine image of physics and mathematics in Japan and England?
Does Factor 4 (“social climate for gender role”) explain the masculine image of physics and mathematics in Japan and England?
5. Survey 1 (Japan)
Respondents
In total, 1177 Japanese members of the public (men = 594, women = 583) were surveyed. Respondents were aged from 20 to 69 among those who graduated from a university regardless of the field of study. We limited respondents to those who graduated from university, as they have experienced an academic environment. The authors contracted NTTCom Online Marketing Solutions Corporation, a research company in Japan, to collect online data using their data pool. The online survey was conducted on 25–27 March 2019. The sample was collected to reflect the current demographic profile of the ages, gender, and regions of Japan.
Questionnaire
The online questionnaire, in Japanese, consisted of a long list that contained several studies. We reported only the items used in this study. We collected responses about following items (see Supplemental Appendix 1 for the detail):
Demographic profiles: “age” (mean ± SD = 43.50 ± 12.13), “gender” (men = 594, women = 583) and “educational attainment” (undergraduate = 1110, master’s = 46, and doctoral = 21).
Level of masculinity in physics and mathematics: the respondents rated how much physics and mathematics, respectively, sound more suitable for women (= 1) or men (= 5).
Items in Factor 1: 1a. Occupation: The respondents rated how much the occupations available after studying physics and mathematics, respectively, sounded more suitable for women (= 1) or men (= 5). 1b. Mathematical stereotype: The respondents rated how much they strongly agree (= 1) or strongly disagree (= 5) with the statement “women are not as good at mathematics as men.” 1c. Smartness of people: The respondents rated how much they strongly disagree (= 1) to strongly agree (= 5) with the statement “people who go on to study physics and mathematics respectively at university were generally smart” Their responses were categorized as “smart” (agree = 4, strongly agree = 5) and “other” (strongly disagree = 1, disagree = 2, neither agree nor disagree = 3). 1d. Female role model: The respondents rated how much they cannot imagine at all (= 1) to can easily imagine (= 5) at least one specific woman who studied physics and mathematics, respectively, and was active in work or public life. Their responses were categorized as “have role model” (can somewhat imagine = 4, can easily imagine = 5) and “other” (cannot imagine at all = 1, cannot easily imagine = 2, cannot say either way = 3).
Items in Factor 2: 2a. Childhood experience: The respondents rated how much they had the opportunity to experience games in physics and mathematics, respectively, before secondary school (playing outside or at home, in the classroom or at museums or libraries) from never (= 1) to very frequently (= 5). Their responses were categorized as “experienced” (frequently = 4, very frequently = 5) or “other” (never = 1, rarely = 2, sometimes = 3). 2b. Pressure to choose subjects: The respondents responded whether they felt any pressure when they made their choice of subjects at the high school using five options. Their responses were categorized as “pressured” (“I felt pressure to take humanities-related courses,” “I felt pressure to take science-related courses”) or “other” (“I did not feel any pressure,” “I was not free to choose my courses,” and “other”).
Items in Factor 3: The respondents answered how confident they were about the physics and mathematics subjects respectively they took at the high school using six options. Their responses were categorized as “confident” (“fairly confident,” “completely confident”) and “other” (“not confident at all,” “slightly confident,” “somewhat confident,” and “didn’t choose”).
Items in Factor 4: 4a. Gender equality: SESRA-S (Scale of Egalitarian Sex Role Attitudes) is a psychological scale that measures individual gender equal attitudes (Suzuki, 1991; Ui, 2001). It consists of 15 items, indicating positions such as “women at home and men at work.” The questionnaire respondents rated each item on a 5-point scale (strongly agree = 1 to strongly disagree = 5). The total score of the 15 items (from 15 to 75) showed the level of egalitarian attitude. The higher the score, the higher the person’s gender-equal attitude. The coefficient reliability of the items was reported as 0.91 (Suzuki, 1994). 4b. View of university education: The respondents rated how much they strongly agree (=1) to strongly disagree (=5) with the statement “a university education is more important for men than women.” 4c. View of intellectual women: The respondents rated how much they strongly agree (=1) to strongly disagree (=5) with the statement “women should be intellectual.” 4d. Attractiveness to opposite sex: The respondents replied to whether they had ever been told or heard that the choice (“agree” or “disagree”) of a particular faculty or department would make someone less attractive to the opposite sex.
Analysis
The mean ± SD of level of masculinity was 3.58 ± 0.71 in physics and 3.50 ± 0.71 in mathematics (see Supplemental Appendix 2 for the statistical descriptions of the items). An ordinal logistic regression analysis was conducted with the “level of masculinity of physics and math” as the dependent variable for items in Factor 1: (1a) occupation, (1b) mathematical stereotype, (1c) smartness of people, (1d) female role model; Factor 2: (2a) childhood experience, (2b) pressure to choose subjects; Factor 3: self-efficacy; and Factor 4: (4a) gender equality, (4b) view of university education, (4d) attractiveness to opposite sex as the independent variables. We tested two models: Model 1 included Factors 1–3. In Model 2, we added Factor 4 on Factors 1–3. This analysis was conducted separately for physics and mathematics. The statistical significance level was p < 0.05. All analysis was conducted using IBM SPSS Statistics 25.
Results
Factors related to the masculine image of physics
In Model 1, the coefficient of “occupation,” “mathematical stereotype,” and “smartness of people” in Factor 1 were significant. In Model 2, the coefficient of “occupation,” “mathematical stereotype,” and “smartness of people” were significant (Table 2). The coefficient of items in Factors 2 and 3 in Models 1 and 2, and Factor 4 in Model 2 were not significant. These suggest that respondents who have a masculine image for jobs in physics, who perceive a stronger mathematical stereotype (i.e. that women are less capable in mathematics), and who perceive a higher degree of smartness for people in physics are likely to perceive physics as masculine in both models.
Factors affecting public perception of masculinity in physics and mathematics in Japan. Results from ordinal regression analysis.

p < 0.05, **p < 0.01, ***p < 0.001. SEM shows standard error.
Factors related to the masculine image of mathematics
In both Models 1 and 2, the coefficient of “gender” in the demographic profile was negative and significant, suggesting that Japanese women perceived mathematics as masculine more than men. The coefficients of “occupation,” “mathematical stereotype,” and “smartness of people” in Factor 1 were positive and significant. The coefficient of “view of intellectual women” in Factor 4 was negative and significant. A significant coefficient was neither found in Factor 2 or 3 in Model 1 and 2 (Table 2). These suggest that female respondents who have a masculine image of jobs in mathematics, hold a stronger mathematical stereotype seeing women as less able in mathematics, and perceive that people in mathematics are smart, are likely to perceive mathematics as masculine in both models. The respondents who disagree with “women should be intellectual” are likely to perceive mathematics as masculine more than respondents who agree with this statement (Model 2).
6. Survey 2 (the United Kingdom)
Respondents
In total, 1082 members of the English public (men = 529, women = 553) participated in this study. All were aged from 20 to 69 and had graduated from a university, regardless of the field of study. We limited respondents to those who graduated from university, as they have experienced an academic environment. The authors contracted NTTCom Online Marketing Solutions Corporation, a research company in Japan, and the company collected the data online using their data pool. The sample was selected to reflect the current demographic profile of the population in England by age and gender. The online survey was conducted on 3–13 June in 2019.
Questionnaire and analysis
Items on the online questionnaire were the same as Survey 1. A native British English speaker who could speak native-level Japanese translated the Japanese questionnaire into English. Demographic profiles of the participants were the following: “age” (mean ± SD = 43.96 ± 13.94), “gender” (men = 529, women = 553), and “educational attainment” (undergraduate = 777, master’s = 267, and doctoral = 38). The mean ± SD for the level of masculinity was 3.21 ± 0.63 in physics and 3.18 ± 0.60 in mathematics (see Supplemental Appendix 3 for statistical descriptions of the items). The analysis of Survey 2 mirrored that of Survey 1.
Results
Factors related to the masculine image of physics
In Model 1, the coefficients of “occupation” and “female role model” in Factor 1 were positively significant. In Model 2, the coefficients of “occupation,” “mathematical stereotype,” and “female role model” in Factor 1 were positively significant. The coefficient of “attractiveness of opposite sex” in Factor 4 was positive and significant. A significant coefficient was not found for Factors 2 and 3 (Table 3). These suggest that respondents who have a masculine image of jobs in physics, who have fewer female models in physics (Models 1, 2), who have a stronger mathematical stereotype, seeing women as less mathematically able, and who have been told or heard that the choice of a particular course of study would make someone less attractive to the opposite sex (Model 2) are likely to perceive physics as masculine.
Factors affecting public perception of masculinity in physics and mathematics in England. Results from ordinal regression analysis.
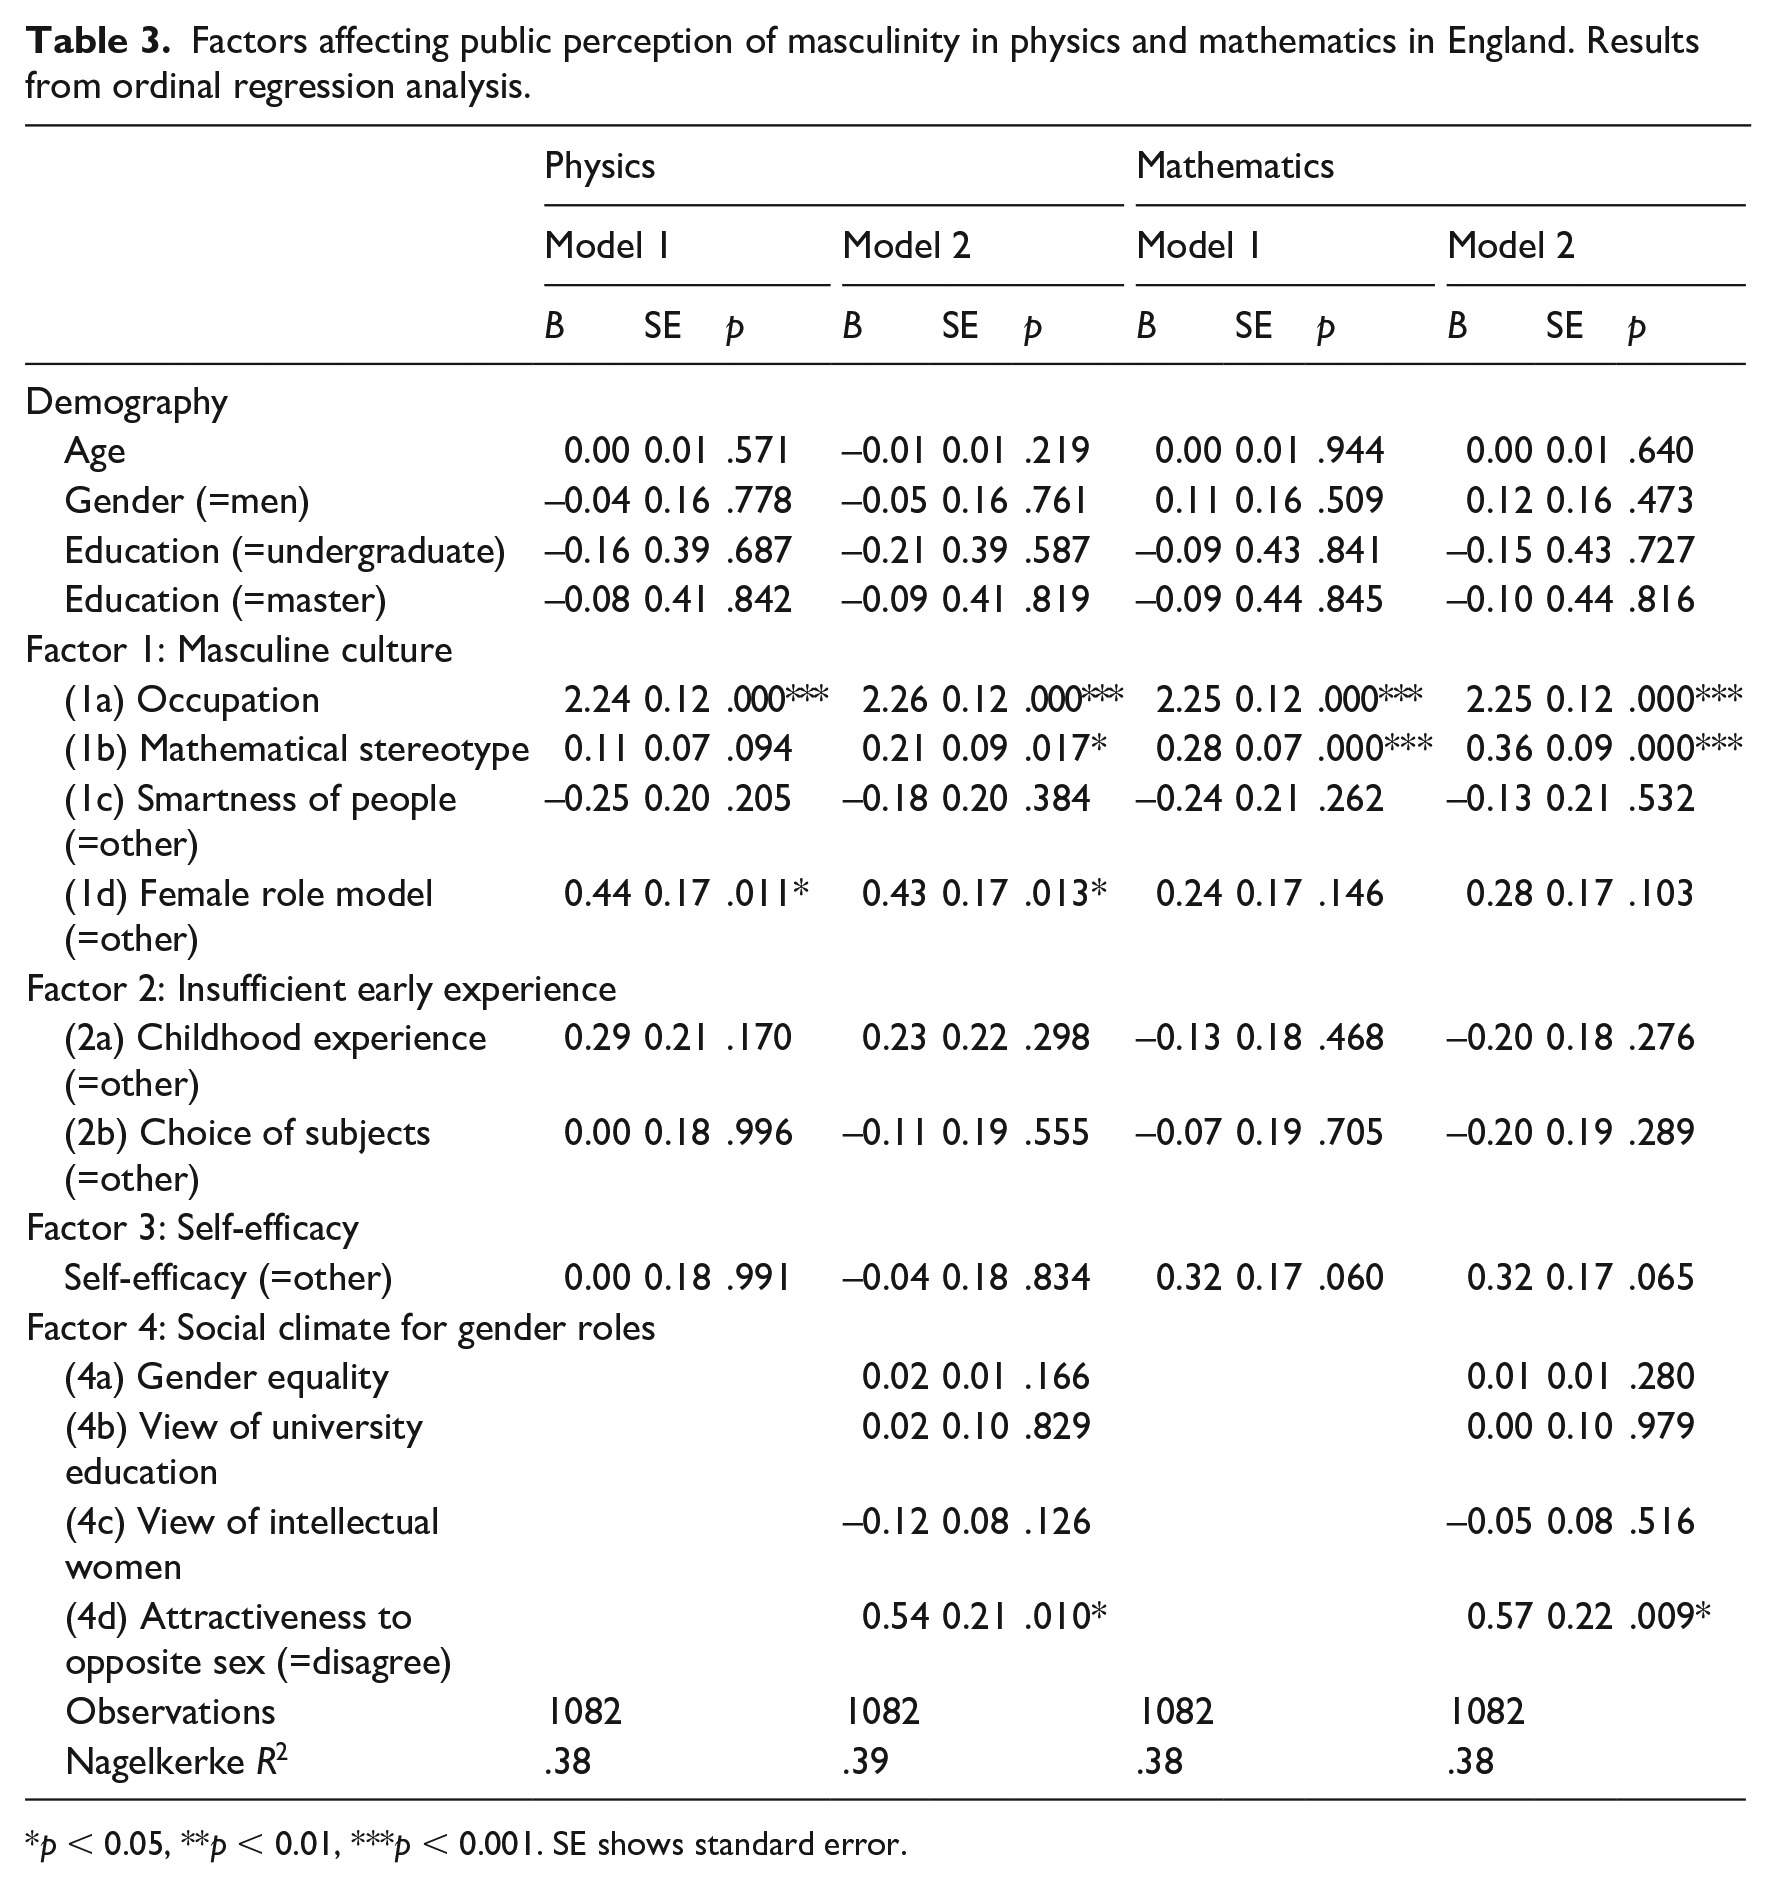
p < 0.05, **p < 0.01, ***p < 0.001. SE shows standard error.
Factors related to the masculine image of mathematics
In Models 1 and 2, the coefficients of “occupation” and “mathematical stereotype” in Factor 1 were significant and positive. The coefficient of “attractiveness of opposite sex” in Factor 4 was positively significant. A statistically significant coefficient was not found for Factors 2 and 3 in both Models 1 and 2 (Table 3). These suggest that the respondents who have a masculine image for jobs in mathematics and who have stronger mathematical stereotype (Models 1, 2) and have been told or heard that the choice of a particular course of study would make someone less attractive to the opposite sex (Model 2) are more likely to perceive mathematics as masculine than those who do not share these factors.
7. Discussion
We quantitatively investigated the expanded model in Japan and England using online questionnaire surveys. We found that some factors contributed to the masculine image of physics and mathematics in both countries, as well as factors that are specific to each country. In particular, in Factor 4, “view of intellectual women” was significantly related to seeing mathematics as masculine only in Japan. This suggests that in the social climate of Japan, those who do not approve of intellectual women are more likely see mathematics as the domain of men. “Attractiveness to the opposite sex” was significantly related to seeing physics and mathematics as masculine only in England. This item measured not only their view but their experiences in order to check the surrounding social climate. However, the percentage who have been told or have heard that the choice of a particular course of study would make someone less attractive to the opposite sex was much larger in England than in Japan (Supplemental Appendix 3), suggesting that the English have a social climate where there is stronger pressure for feeling their own attractiveness to the opposite sex. These results suggest that social climate contributes to the masculine image of physics and mathematics in each country. The revised model, including Factor 4, “social climate surrounding gender roles,” suggests that the barriers due to social climate need to be lowered for changing male-biased attitudes toward physics and mathematics.
This study has several limitations. First, we limited the respondents to those who graduated from university, meaning that our results are not based on the population of the whole country. For example, the percentage of the population aged 25–64 years old who completed tertiary education was 52.7% in Japan and 47.2% in the United Kingdom in 2019 (OECD, 2020). Respondents were also limited to those who could use the Internet, as our surveys were conducted online. Social climate cannot be established only for those who graduated from university and those who can use the Internet. When we change the social climate for physics and mathematics, we also need to change the attitudes of those who were not targeted in this study. In future studies, we need to expand our target of this survey. There might be a different trend in the attitudes between two populations, such as between those who graduated from university and who did not, and between those who use the Internet and those who do not. This may allow for effective intervention appropriate to each population. Second, we conducted Survey 1 in Japanese and Survey 2 in English. Even if the words were the same, the meaning may be slightly different between Japanese and English. However, we considered that this is unlikely because a British native English speaker who speaks native-level Japanese translated the Japanese questionnaire into English. Further study in different countries, especially countries where more women learn physics and mathematics, would be meaningful to investigate how Factor 4 is related to the gendered image of physics and mathematics. Third, we need to explore effective interventions to lower the barrier created by the perception that physics and mathematics are masculine. Such interventions might target “smartness of people” and “view of intellectual women” that were culturally relevant issues in Japan.
Our cross-cultural survey suggests future directions for study. First, we need to change social climates surrounding gender roles. Both “view of intellectual women” and “attractiveness to opposite sex” in Factor 4 stem from a gender-focused society. Perceptions of intellectual women, the necessity for women to be seen as attractive, and the belief that physics and mathematics are ‘unattractive’ occupations for women all contribute to excluding women from these pursuits. Further study could explore how to mitigate these obstacles.
In summary, our results suggest that the expanded model explains the masculine image of physics and mathematics in Japan and England. “Occupation” and “mathematical stereotype” in Factor 1 were significantly related to the masculine image of physics and mathematics in Japan and England, suggesting that a global effort is needed to change gender stereotype images for physics and mathematics and related occupations. Factor 4 contributed to the masculine image in physics and mathematics, but the effect was limited to (4c) “view of intellectual women” in Japan for mathematics, and (4d) “attractiveness to the opposite sex” in England for physics and mathematics. Our results suggest that items in Factor 4, the social climate surrounding gender roles, would vary depending on the country.
Supplemental Material
sj-pdf-1-pus-10.1177_09636625211002375 – Supplemental material for Masculinity in the public image of physics and mathematics: a new model comparing Japan and England
Supplemental material, sj-pdf-1-pus-10.1177_09636625211002375 for Masculinity in the public image of physics and mathematics: a new model comparing Japan and England by Yuko Ikkatai, Atsushi Inoue, Azusa Minamizaki, Kei Kano, Euan McKay and Hiromi M. Yokoyama in Public Understanding of Science
Footnotes
Acknowledgements
This study was supported by the World Premier International Research Center Initiative (WPI), MEXT, Japan.
Declaration of conflicting interests
The author(s) declared no potential conflicts of interest with respect to the research, authorship, and/or publication of this article.
Funding
The author(s) disclosed receipt of the following financial support for the research, authorship, and/or publication of this article: This work was funded by a Japan Science and Technology Agency (JST)-RISTEX (Research Institute of Science and Technology for Society) research program (number JPMJRX17B3).
Supplemental material
Supplemental material for this article is available online.
Notes
Author biographies
References
Supplementary Material
Please find the following supplemental material available below.
For Open Access articles published under a Creative Commons License, all supplemental material carries the same license as the article it is associated with.
For non-Open Access articles published, all supplemental material carries a non-exclusive license, and permission requests for re-use of supplemental material or any part of supplemental material shall be sent directly to the copyright owner as specified in the copyright notice associated with the article.