
Abstract
Dual agent dose-finding trials study the effect of a combination of more than one agent, where the objective is to find the Maximum Tolerated Dose Combination, the combination of doses of the two agents that is associated with a pre-specified risk of being unsafe. In a Phase I/II setting, the objective is to find a dose combination that is both safe and active, the Optimal Biological Dose, that optimises a criterion based on both safety and activity. Since Oncology treatments are typically given over multiple cycles, both the safety and activity outcome can be considered as late-onset, potentially occurring in the later cycles of treatment. This work proposes two model-based designs for dual-agent dose finding studies with late-onset activity and late-onset toxicity outcomes, the Joint time-to-event (TITE) partial order continual reassessment method and the Joint TITE Bayesian logistic regression model. Their performance is compared alongside a model-assisted comparator in a comprehensive simulation study motivated by a real trial example, with an extension to consider alternative sized dosing grids. It is found that both model-based methods outperform the model-assisted design. Whilst on average the two model-based designs are comparable, this comparability is not consistent across scenarios.
Introduction
A traditional Phase I dose-finding study uses binary observations of dose-limiting toxicities (DLTs), evaluating the safety of a novel agent by escalating dose assignment in order to find the Maximum Tolerated Dose (MTD), a dose level associated with a pre-specified probability of observing a DLT. It may however be of interest to study the effects of a combination of more than one agent, for example for synergistic effects of activity or safety. Here the objective is to find the MTD Combination, the combination of doses of each of the agents associated with the pre-specified probability of observing a DLT. Multiple designs exist for the dual agent Phase I dose-finding trial, for example the Bayesian Optimal Interval design 1 (BOIN), Keyboard, 2 Partial Order Continual Reassessment Method 3 (POCRM), Waterfall 4 and Bayesian Logistic Regression Model 5 (BLRM), with a comprehensive comparison of model-assisted designs compared to model-based designs recently undertaken. 6
It is often the case in oncology trials that there are multiple cycles of treatment, and therefore the trial duration would be infeasibly long if one had to wait until the entire follow-up period for the previous cohort had been completed before assigning the next cohort to a dose. Therefore, it is useful for a design to be able to incorporate delayed onset outcomes when only partial information is available, for example on the first cycle out of a three-cycle treatment programme. Few designs exist that incorporate delayed onset outcomes in dual agent trials, one such example being the time-to-event (TITE) version of the POCRM. 7
In the cases where it is possible to collect measures of activity of the agents, as is often the case in oncology, seamless Phase I/II designs are possible since activity acts as a surrogate for efficacy. Here, the objective is to find the Optimal Biological Dose (OBD), a dose that is both safe and shows sufficient activity that optimises some utility criterion based on safety and activity, in line with the goal of the FDA’s Project Optimus
8
‘to move forward with a dose-finding and dose optimisation paradigm across oncology that emphasises selection of a dose or doses that maximises not only the efficacy of a drug but the safety and tolerability as well.’ A small number of designs exist that can evaluate both safety and activity with delayed-onset binary outcomes in the single agent setting, model-assisted approaches such as that from Liu et al.
9
the TITE-B,
10
and model-based approaches of the
In this work, we propose two model-based approaches to design a seamless Phase I/II dose finding trial in oncology, incorporating delayed-onset toxicity and delayed-onset activity outcomes for dual agents, hypothesising that the joint modelling approach will improve accuracy in the OBD identification. These novel model-based designs are compared to the model-assisted TITE-comb-BOIN12 design. A motivating example is given in Section 2, before Section 3 introduces the methodology for all three designs considered. Section 4 conducts a simulation study to compare the performance of the designs before concluding with a discussion in Section 5.
Motivating example
Combining several anticancer agents can enhance overall antitumour activity; however, it may also lead to increased toxicity. Combination therapies are frequently evaluated during the early clinical development of investigational oncology agents. This is particularly relevant for prostate cancer, which remains the most commonly diagnosed cancer in males and a leading cause of cancer-related deaths.
Target Radionuclide Therapy, which involves therapeutic agents based on radionuclides, holds significant promise in oncology. These new agents are also being investigated in combination with standard treatments for prostate cancer, such as hormone therapy. This approach is especially appealing and more easily planned when both agents are part of the internal portfolio, as preclinical data can be generated more readily, creating a commercially viable opportunity.
This exploration is driven by previous initiatives within Bayer’s Targeted Alpha Therapy (TAT) platform. TAT is an emerging modality in the field of radiotherapy that combines tumour-targeting molecules with alpha particle-emitting radioisotopes, aiming to provide a novel approach to cancer treatment and potentially overcome resistance. 20
In an early-phase study, a thorium-227 labelled antibody-chelator conjugate was combined with darolutamide, a synthetic nonsteroidal next-generation androgen receptor antagonist, in patients with metastatic castration-resistant prostate cancer.21,22 In this context, the doses of both agents could be adjusted to identify the optimal dose combination that enhances overall antitumour activity while maintaining an acceptable safety profile.
Methodology
We propose two alternative approaches, both based on the Joint TITE-CRM,
12
a design for single agent therapies with late-onset activity and toxicity outcomes, which was shown to have good operating characteristics. The first proposed approach, the Joint TITE-POCRM, extends the Joint TITE-CRM to the dual agent setting by mapping the two-dimensional dosing grid into one dimension using the POCRM.
3
The second, the Joint TITE-BLRM, extends the Joint TITE-CRM to the dual agent setting by modelling the joint odds using the BLRM.
23
These are compared to the model assisted TITE-comb-BOIN12 design,
18
which brings together the TITE-BOIN12 design,
24
and the dual agent BOIN,
1
summarised in this section, with further details given in the Supplemental Materials. Section 3.1 provides the trial setup that is applicable to all methods considered, then the following subsections introduce each of the approaches in turn. For brevity in this section, many equations that are identical in the cases of toxicity and activity are only given once, with relevant subscripts of
Trial setup
Dosing grid
We consider two agents labelled agent
An example of dose labelling for the dual agent trial.
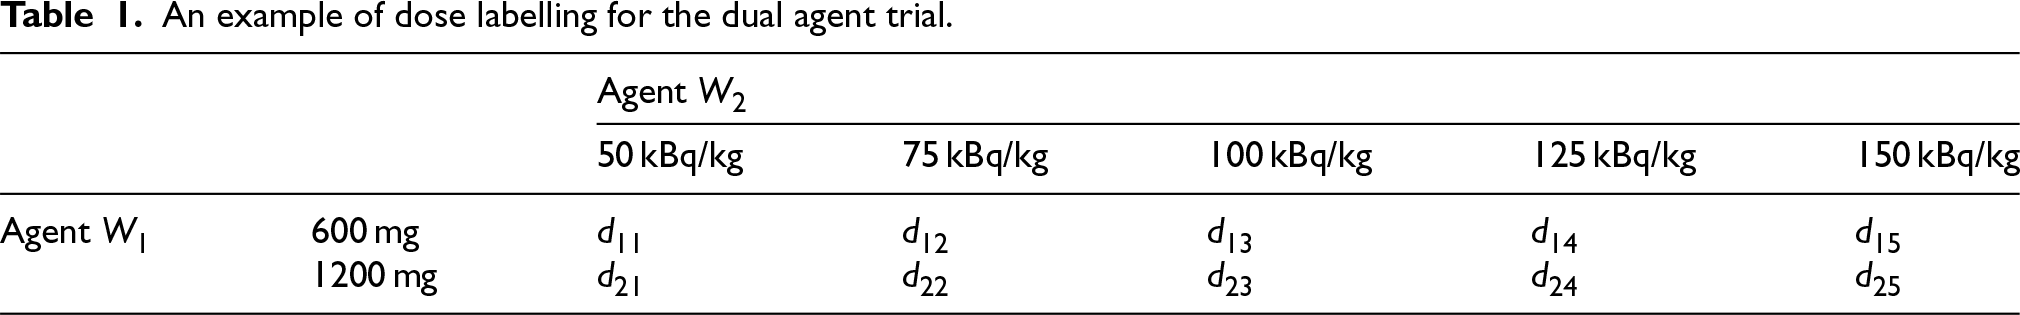
An example of dose labelling for the dual agent trial.
In the motivating setting introduced in Section 2, a toxicity or activity outcome may be observed at any point during the trial, and therefore the trial procedure is set up to reflect this.
Patients are followed up for a total of The first cohort of patients is treated at the pre-specified starting dose combination. After the previous cohort has been observed for one cycle of treatment, the next cohort is assigned to a dose combination based on admissibility and a criterion of utility, both incorporating activity and toxicity. Repeat step 2 until a stopping rule is triggered.
Figure 1 illustrates how such a trial would progress, with each vertical line representing the start of a cycle. Patients may observe an activity response only, an activity response and then a DLT response, a DLT response only, or neither an activity nor DLT response, with all four types of outcome visualised here.
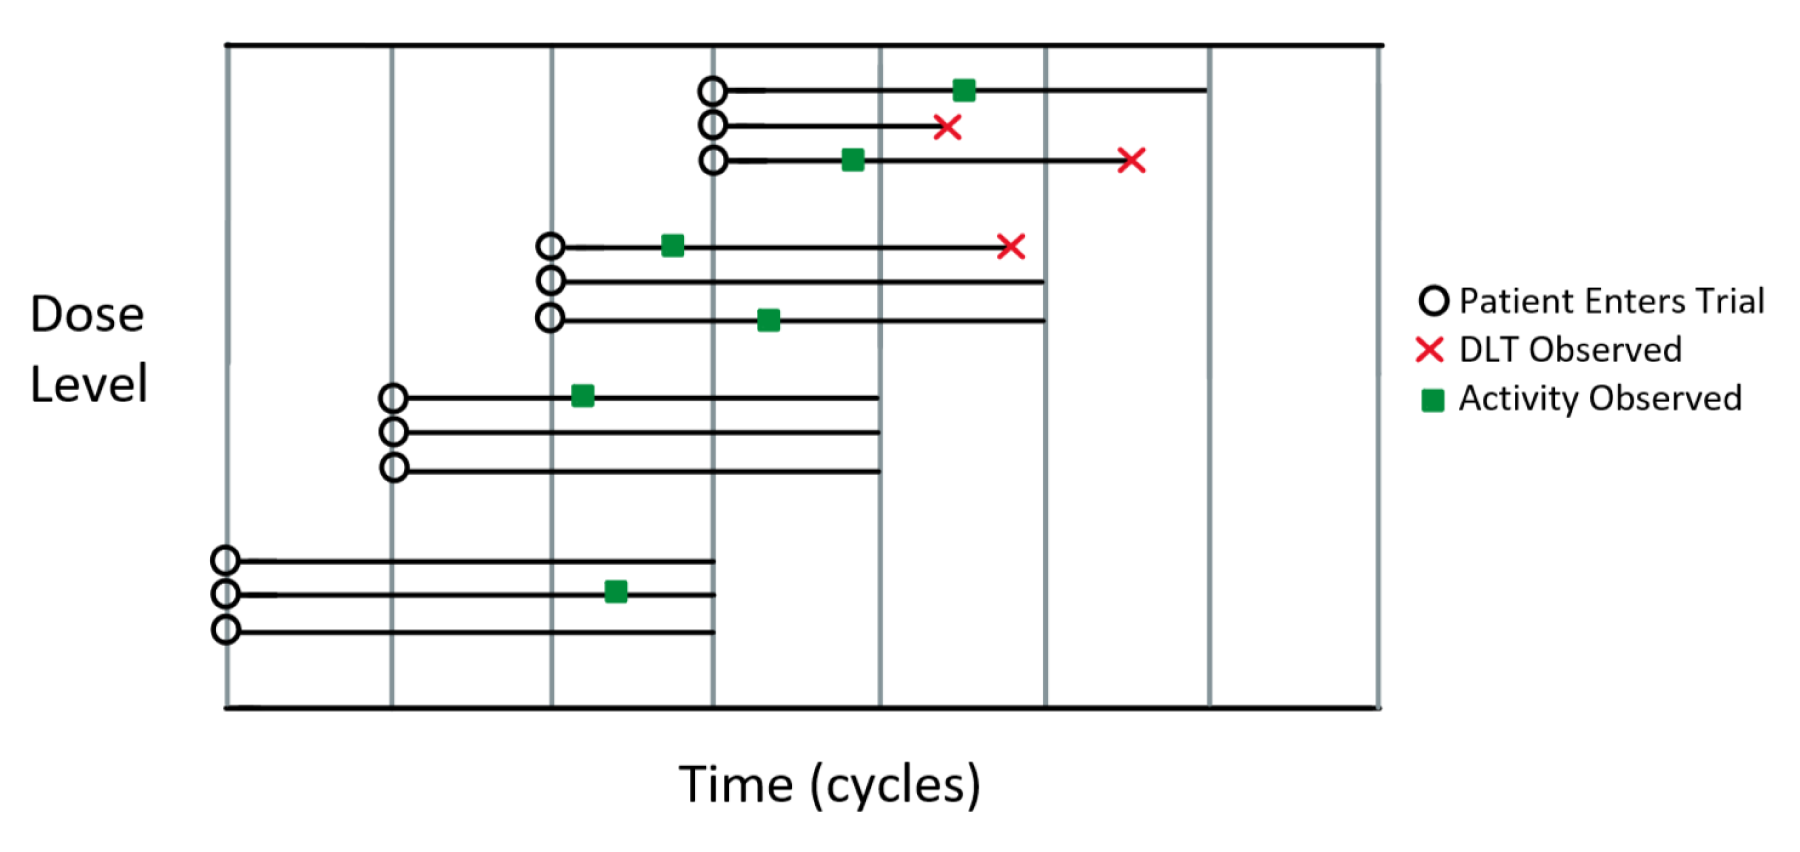
Visualisation of example trial with an observation period of three cycles and dose-escalation decisions taking place after one cycle.
In all designs, a cohort may only be assigned to dose combination 
Once dose combinations are deemed admissible, the dose combination that optimises some utility criterion is chosen. For all designs, for fairness of comparability, the following utility as used by Barnett et al.
12
is used:

The POCRM 3 maps the two-dimensional dosing grid into one dimension so that a single-agent dose-response model can be applied. In order to do this, one must choose what is known as the dose skeleton, the dose-response model and the ordering of the mapping itself.
Firstly, consider the dose skeleton,
Next, consider the dose-response model. In the original proposal of the POCRM, the one parameter power model was used:
In this setting, since responses may be late-onset, we also consider the TITE of a response in the model:

Next, consider the mapping. In order to choose which dose combinations are mapped to which elements of the skeleton, one has to consider the ordering of the dose combinations. For example, one may map the grid in Table 1 into one dimension using the ordering:

A one-dimensional dose-response model can then be applied. Since there are a large number of potential mappings that can exist, the POCRM considers only a subset of these, based on the ordering of the dosing grid. To choose the one dimensional ordering in which to apply the dose skeleton to the dosing grid, a set of so-called partial orderings are considered. These are plausible orderings of the dose-combinations that adhere to the dose orderings. For example, increasing the dose level of one agent whilst keeping the other the same would be a “higher” dose. (e.g.
In this application, since we are considering both activity and toxicity endpoints, how they are incorporated into each part of the POCRM must be taken into account. The skeleton is not necessarily the same for activity and toxicity, but is fixed for each prior to conducting the study. The dose-response model must be for both toxicity and activity and the mapping must be done for activity and toxicity separately. Like the dose skeleton, the set of partial orderings is not necessarily the same for activity and toxicity, and hence the chosen ordering is also not necessarily the same.
The Joint TITE-POCRM therefore breaks down into two parts at each dosing decision:
Since they are two distinct parts, it is not necessary that the models used in each part are the same. The gain in accuracy of using a two-parameter joint logistic model in Part 2 as opposed to a one-parameter independent power model is large, as this gives much more flexibility and allows the most use out of the observed data to estimate this relationship.
25
However in Part 1, not much is gained by the more complex model, which consequently substantially increases computational burden. This is because the objective is only to find the right ordering, and not precise estimation. Therefore it is proposed here to use one-parameter independent power models in Part 1 to determine the ordering, and a two parameter joint logistic model in Part 2 to determine the OBD.
A set of
Toxicity and activity are considered independently in this part, both following.
7
with the following dose-response models:

The TITE weight for toxicity,
For activity and toxicity, a prior 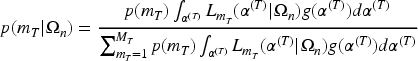
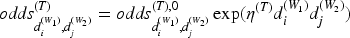
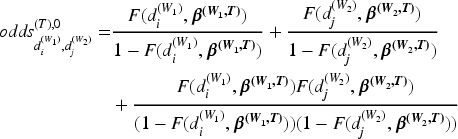
The chosen partial orderings from Part 1 are used in the following model, a joint two-parameter logistic model for both safety and activity outcomes, the Joint TITE-CRM.
12
The model for toxicity is outlined here, with the same used for activity, replacing 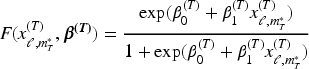
The same weights for toxicity and activity observations as used in part 1 (
Priors are elicited on the parameters
Out of the admissible dose combinations, the dose combination with the highest utility (Equation 1) is recommended.
Joint TITE-BLRM
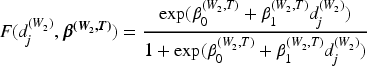
The Joint TITE-BLRM uses the actual dose values of agent
The model for toxicity is outlined here, with the same used for activity, replacing 
The contribution to the likelihood is then weighted in the same way as in the Joint TITE-POCRM, with the same definition of weights 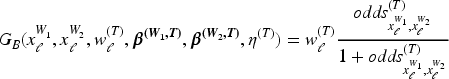
There are therefore 11 parameters in this model:
TITE-comb-BOIN12
As a model-assisted design, TITE-comb-BOIN12 18 uses a model at each dose level to make escalation decisions, rather than modelling the dose–response relationship as the previous two designs have. This design extends the original proposal of TITE-BOIN12 for single agent trials in line with the dual agent BOIN design. 1 In this comparison, the utility given in Equation 1 is used in order for the modelling approaches to be compared fairly since different utilities will naturally give different definitions of optimality. Further details of this model-assisted comparator are given in the Supplemental Materials, including the alternative utility.
Simulations
To assess and compare the relevant operating characteristics of the designs, simulations are conducted over a range of plausible scenarios. In each scenario, 1000 trial simulations are performed.
The setting is motivated by the example illustrated in Section 2, with two doses of Agent
Details of the values used in the priors of all methods are given in the Supplemental Materials.
Scenarios
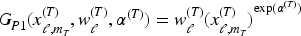
Given the complexity of the setting, it is important to consider a wide range of relevant scenarios. Six safety scenarios and eight activity scenarios are combined to give 48 total scenarios. The individual safety and activity scenarios are defined so that different areas of the grid are active and safe. When combined, this gives the OBD in different positions in the grid. The six toxicity and activity scenarios are given in Table 2, with the probability of toxicity and activity for the whole observation window of
Scenarios considered for simulation study, giving the probability of observing a toxicity/activity event at each dose combination.
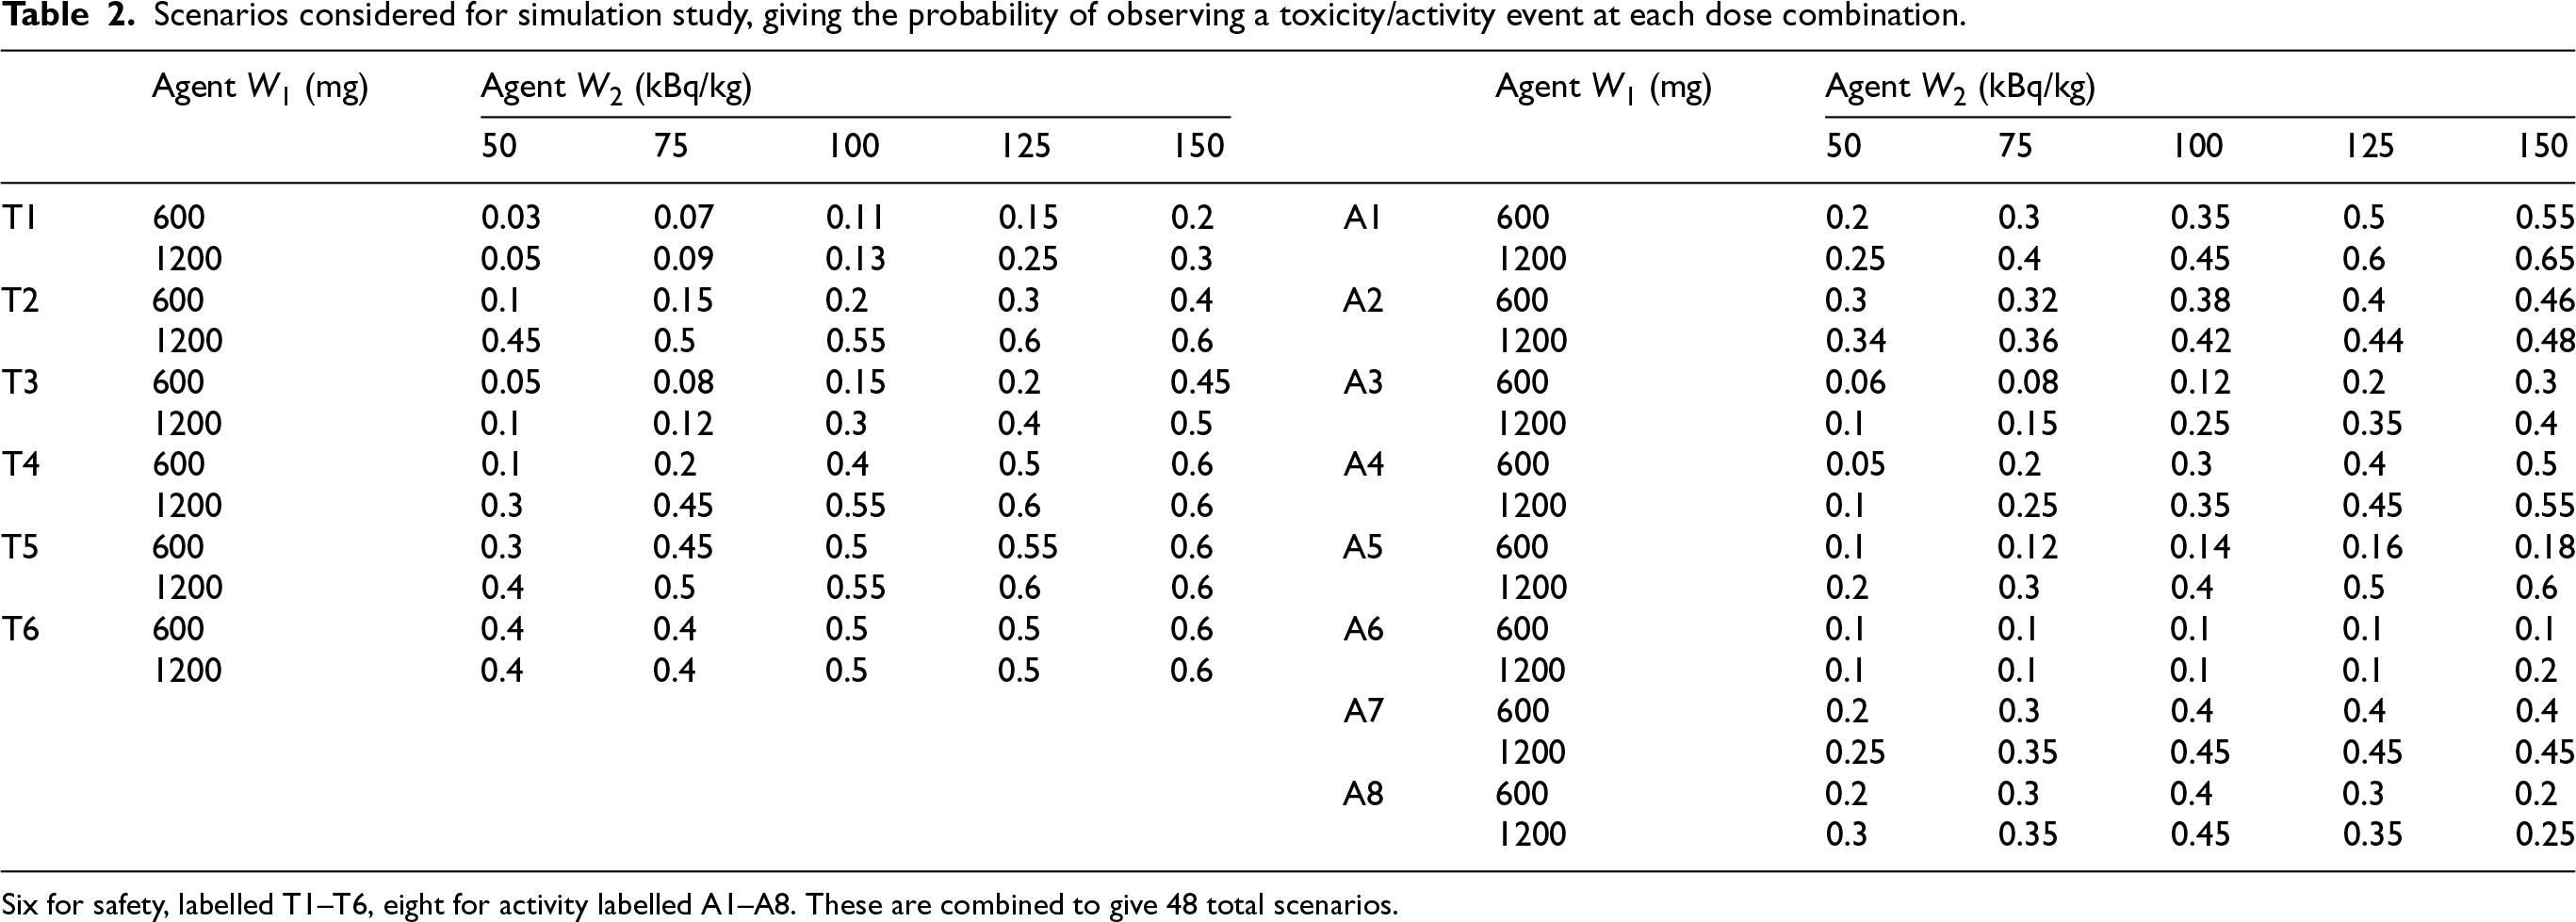
Scenarios considered for simulation study, giving the probability of observing a toxicity/activity event at each dose combination.
Six for safety, labelled T1–T6, eight for activity labelled A1–A8. These are combined to give 48 total scenarios.
Data in the form of event times for activity and toxicity are generated for each simulated patient response. Following Barnett et al.,
12
these event times 
Rules
In a similar fashion to Barnett et al.,
12
a set of rules reflecting those applied in such a trial are used. Let
Enforcement rules restrict the set of allowable doses in order to protect the safety of patients in the trial. The dose skipping rule restricts escalation to unexplored doses, and the hard safety rule restricts escalation to explored doses. Stopping rules dictate the criteria for stopping the trial.
The parameters for the admissibility criteria for all designs are set at
Enforcement
Stopping
Results
To evaluate the merits of the three designs, their performance is measured according to criteria based both on their final recommendation of dose combination and the assignment of patients to the dose combinations. It is desirable for a design to give a high proportion of good dose combination recommendations, whilst also not exposing unnecessary levels of patients to unsafe dose combinations.
To compare the recommendations, we define certain classes of dose combinations. A dose combination is safe if the true probability of observing a toxicity is less than or equal to 0.3 and unsafe otherwise. A dose combination is active if the true probability of observing an activity event is greater than or equal to 0.2 and futile otherwise. If a dose is unsafe or futile, then it is unacceptable. If it is both safe and active, then it is acceptable. Within the class of acceptable dose combinations, the one dose combination with the highest true utility is defined as the correct dose combination, however when the utility is very similar across dose combinations with the highest utility, these dose combinations are referred to as good.
To gain an assessment of the performance, the selections are also compared to an optimal non-parametric benchmark that takes into account uncertainty of ordering. 27 This is modified in this context to also account for admissibility, with further details given in the Supplemental Materials.
It is worth noting that for the approaches to be fairly compared, we have used the same utility criterion for all approaches. The original proposal of the TITE-comb-BOIN12 design introduced an alternative utility criterion, which is evaluated in the Supplemental Materials. The decision was made to use the same utility criterion for all methods in this comparison as for the alternative BOIN utility criterion, in some scenarios, the definition of correct and good doses are not identical to the utility used here, and so direct comparisons of these metrics for different utility criteria are not meaningful.
Figures 2 to 7 display the results across the 48 scenarios, each figure representing one toxicity scenario, with its combination scenario with each activity scenario, and an average across these combinations. Within each figure, subfigure (a) concerns the selections, displaying the percentage of Correct, Good and Acceptable selections. Subfigure (b) concerns the assignments, displaying the average total sample size and the average number of patients assigned to unsafe doses. Figure 8 displays the mean of these results over the toxicity scenarios for each activity scenario, and an average over all 48 scenarios. Full details of the selections and assignments are available in the Supplemental Materials.
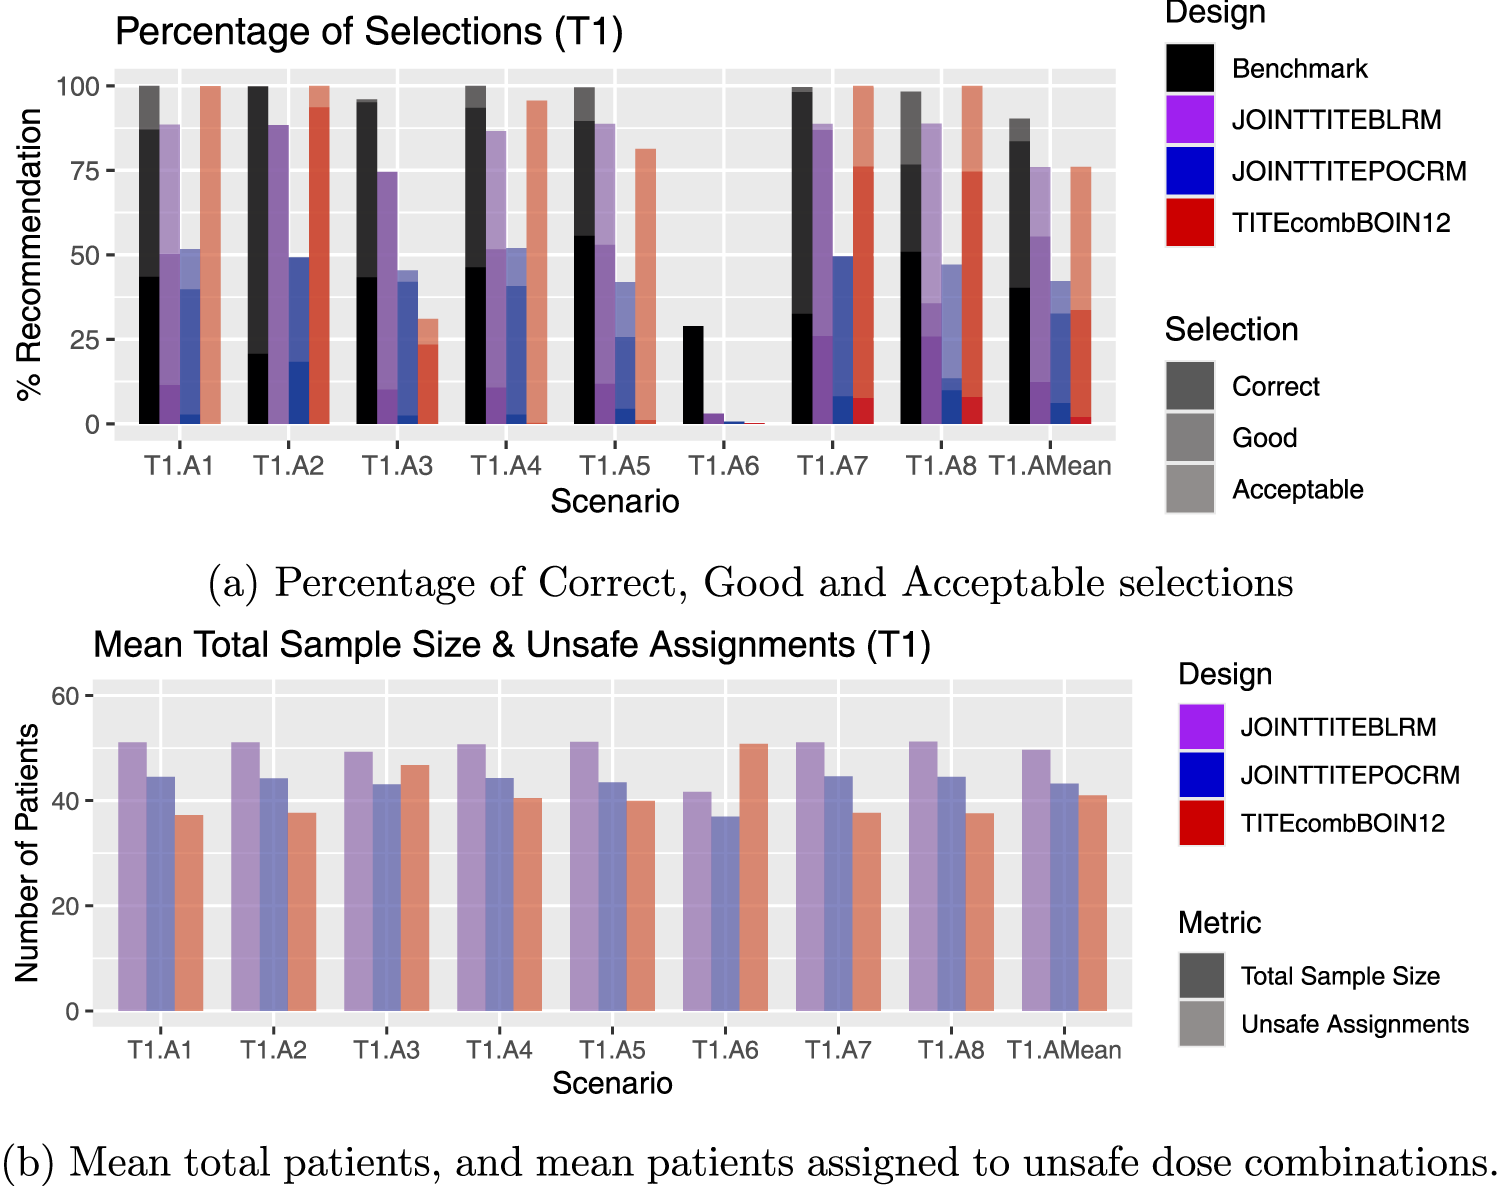
Results for scenarios T1.A1–T1.A8, including an average over these six scenarios, labelled T1.AMean. (a) Percentage of Correct, Good and Acceptable selections; (b) Mean total patients, and mean patients assigned to unsafe dose combinations.
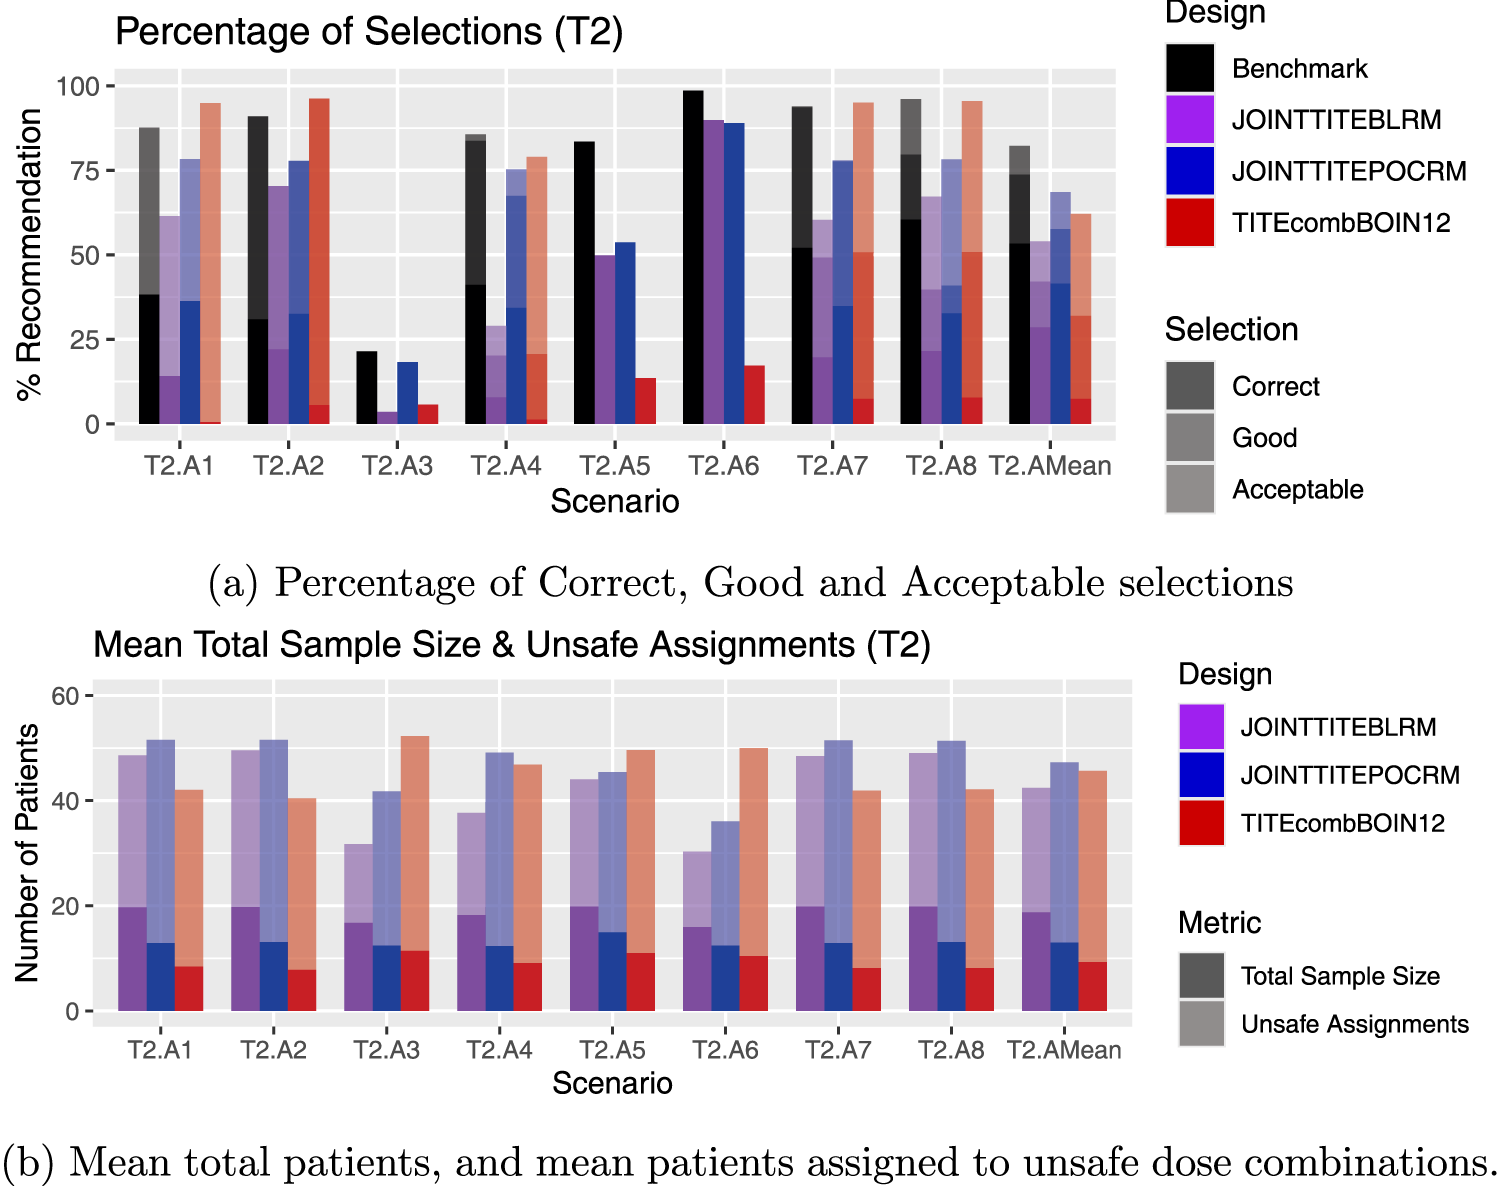
Results for scenarios T2.A1–T2.A8, including an average over these six scenarios, labelled T2.AMean. (a) Percentage of Correct, Good and Acceptable selections; (b) Mean total patients, and mean patients assigned to unsafe dose combinations.
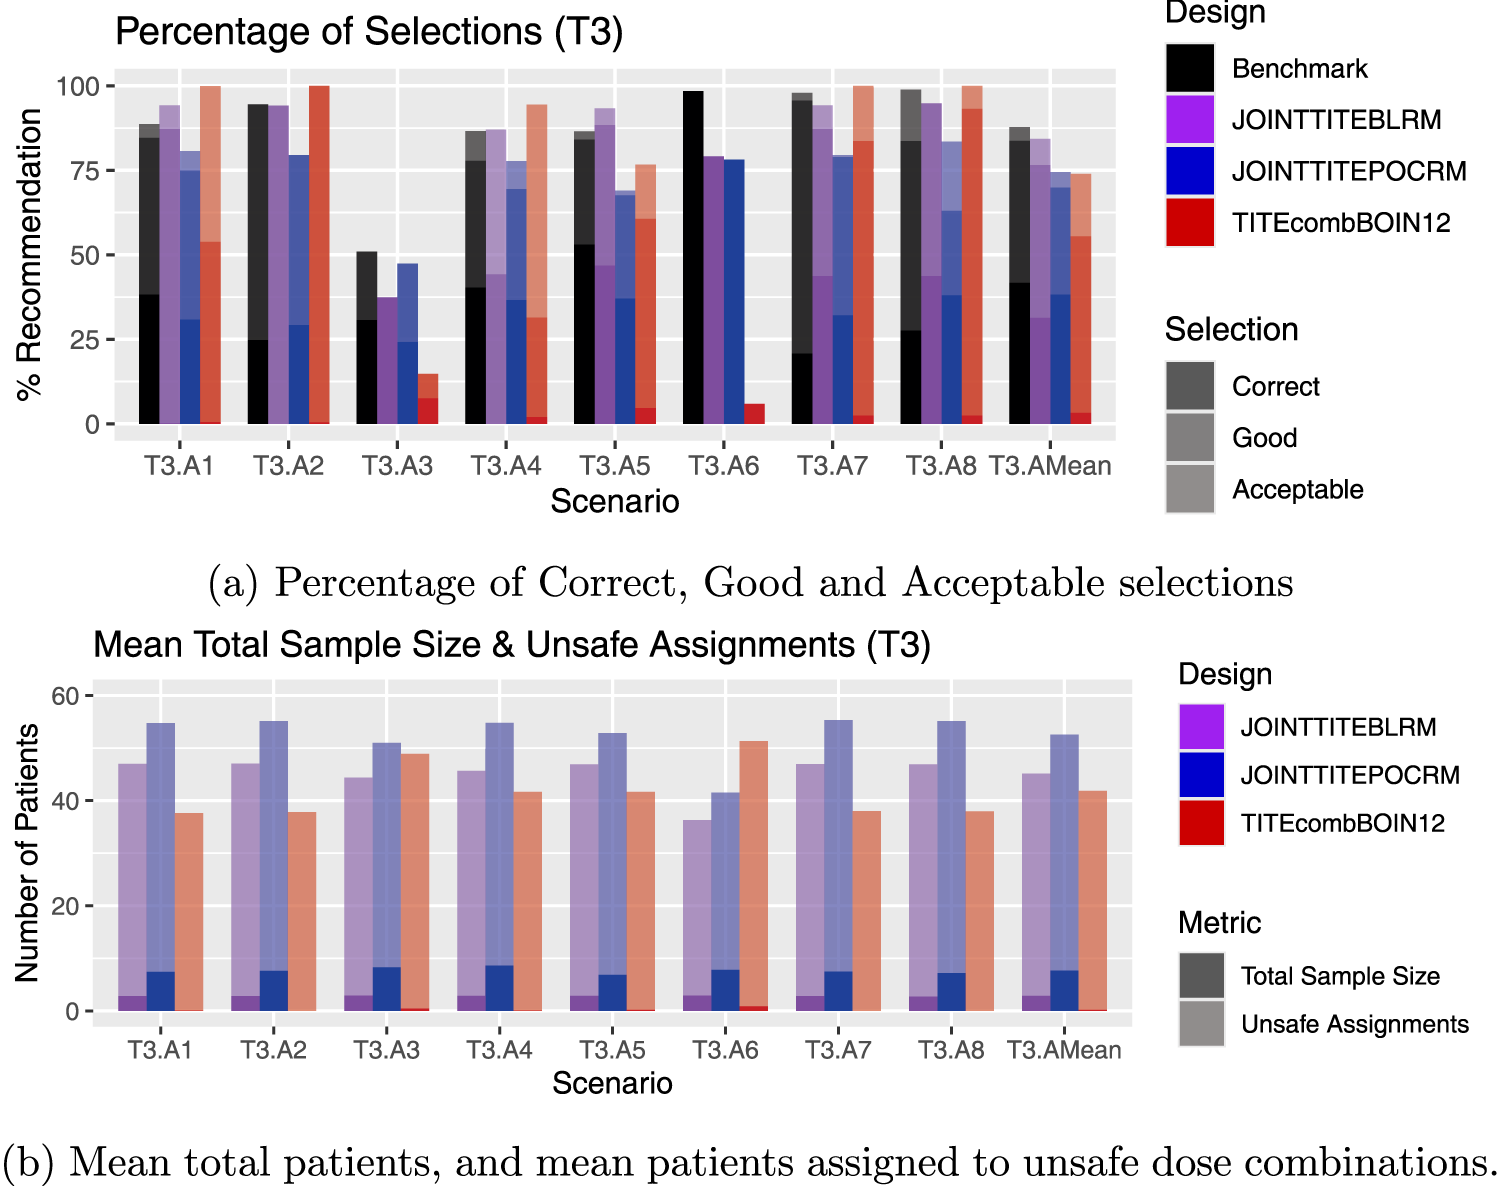
Results for scenarios T3.A1–T3.A8, including an average over these six scenarios, labelled T3.AMean. (a) Percentage of Correct, Good and Acceptable selections; (b) Mean total patients, and mean patients assigned to unsafe dose combinations.
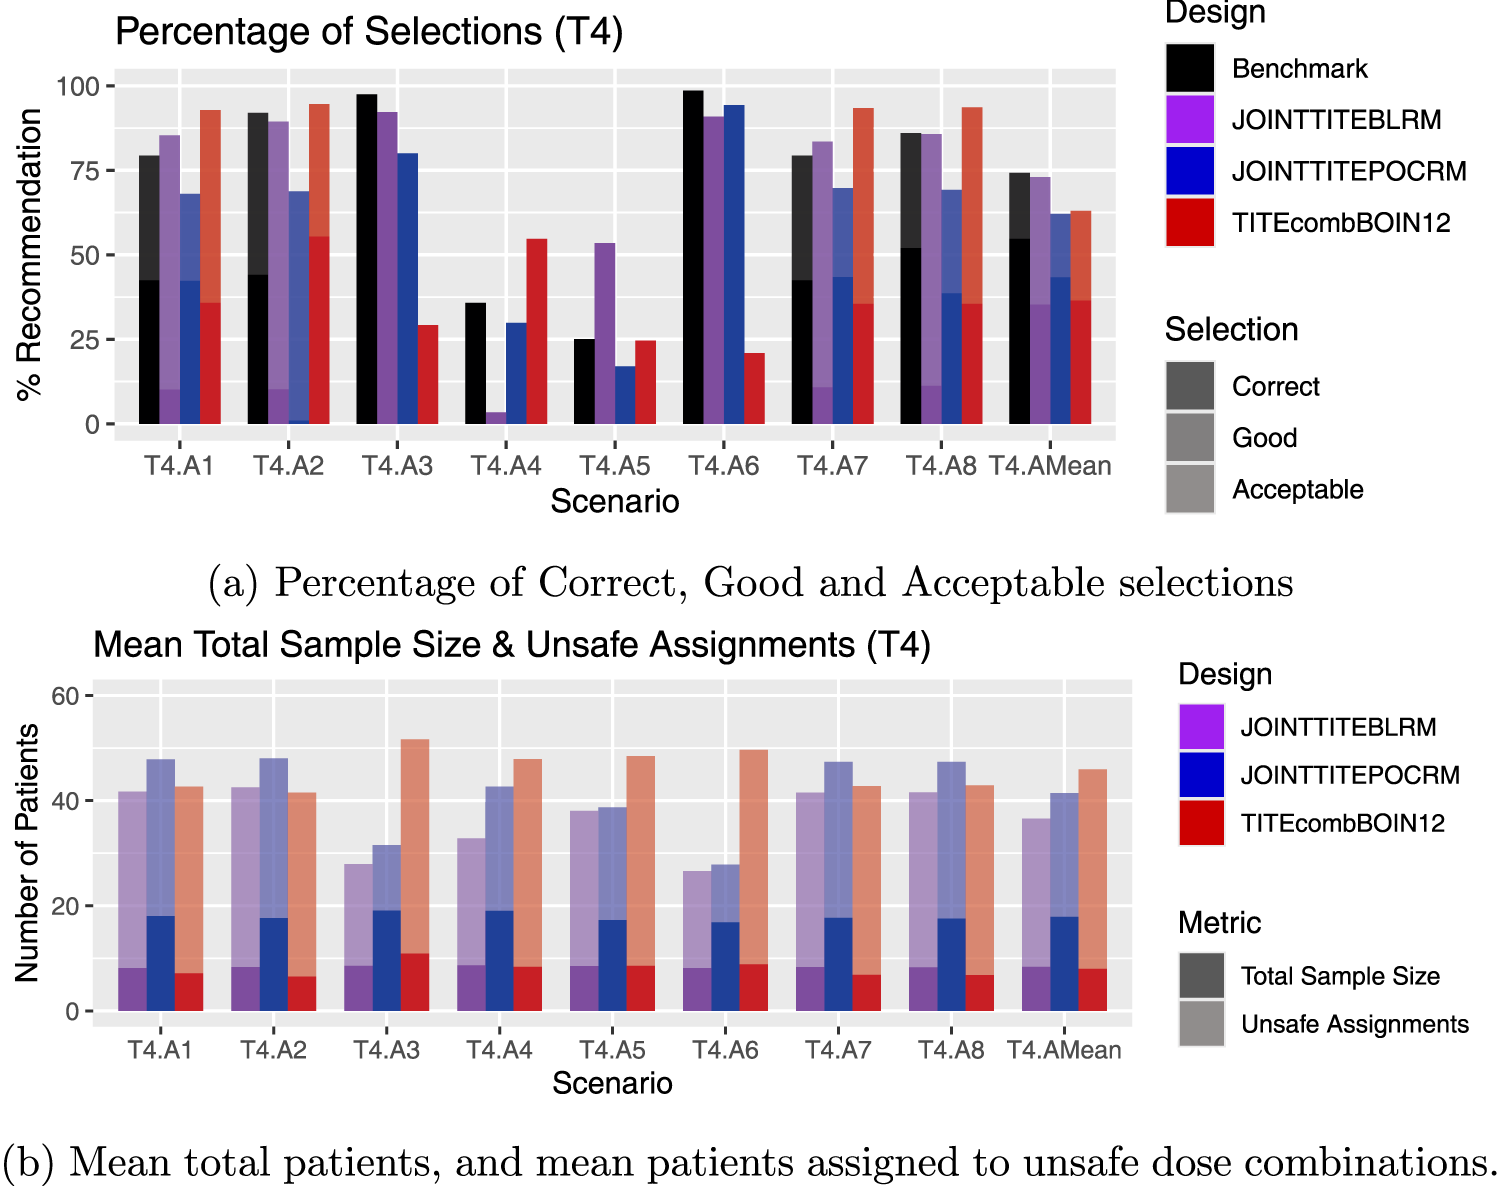
Results for scenarios T4.A1–T4.A8, including an average over these six scenarios, labelled T4.AMean. (a) Percentage of Correct, Good and Acceptable selections; (b) Mean total patients, and mean patients assigned to unsafe dose combinations.

Results for scenarios T5.A1–T5.A8, including an average over these six scenarios, labelled T5.AMean. (a) Percentage of Correct, Good and Acceptable selections; (b) Mean total patients, and mean patients assigned to unsafe dose combinations.
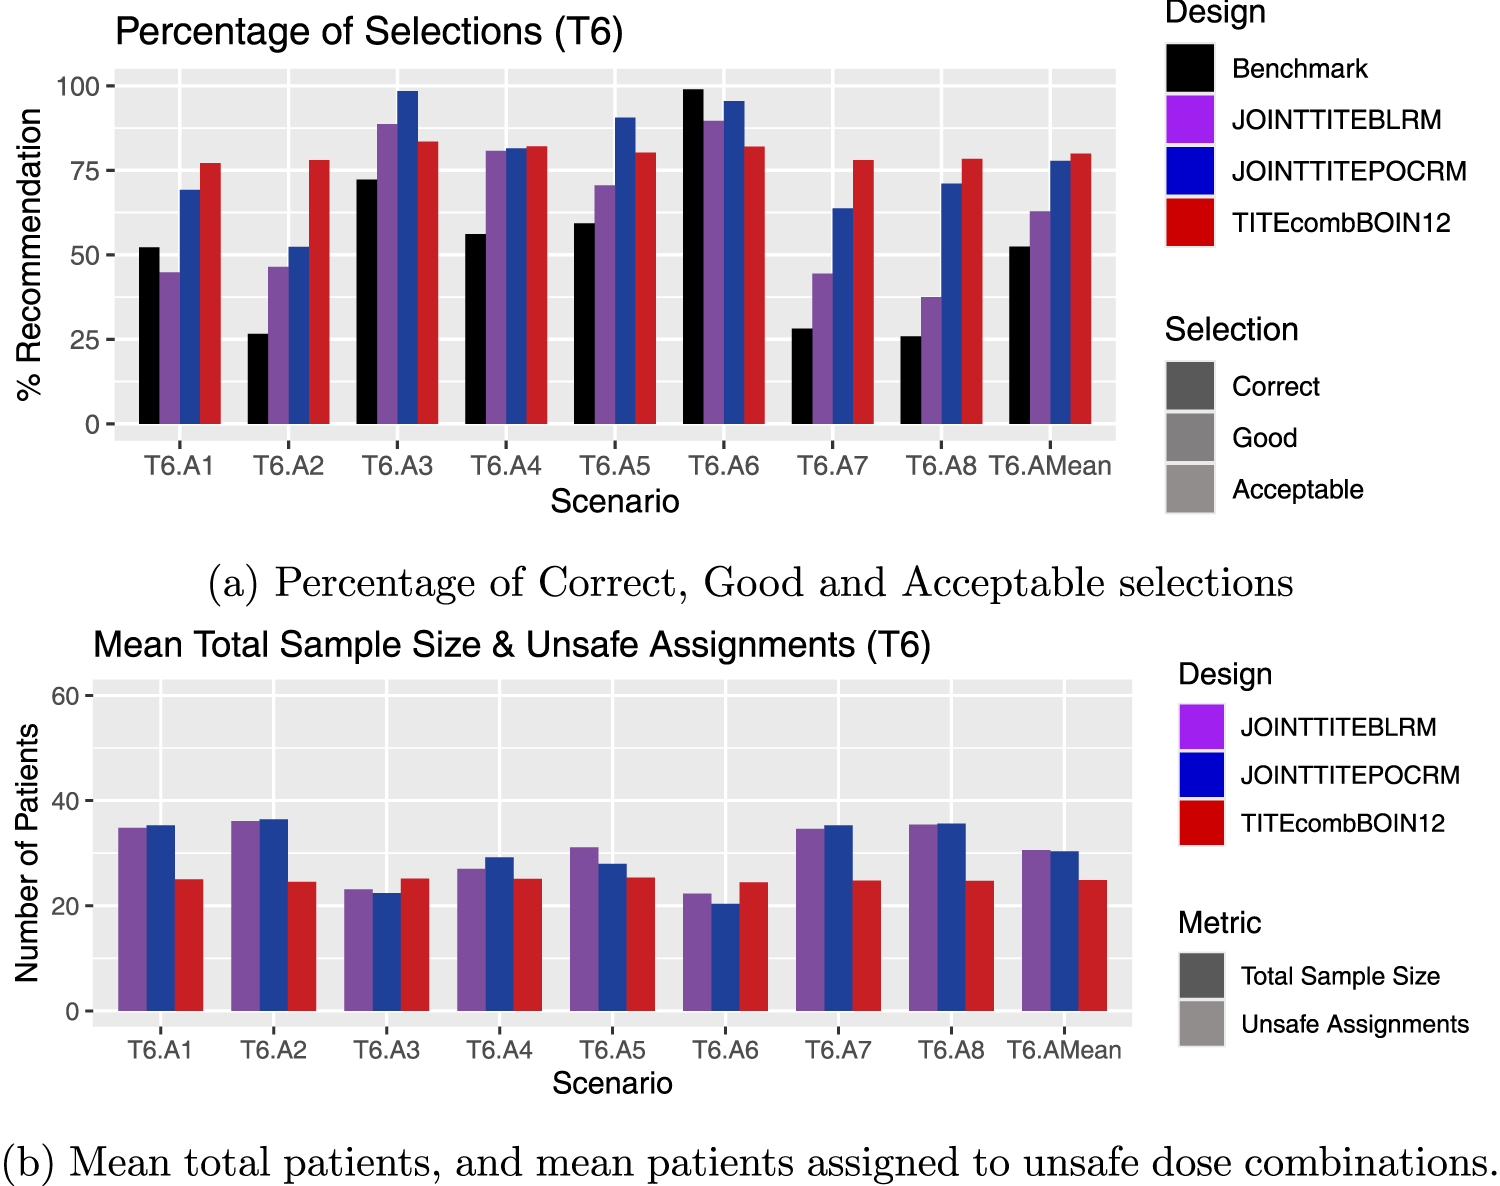
Results for scenarios T6.A1–T6.A8, including an average over these six scenarios, labelled T6.AMean. (a) Percentage of Correct, Good and Acceptable selections; (b) Mean total patients, and mean patients assigned to unsafe dose combinations.
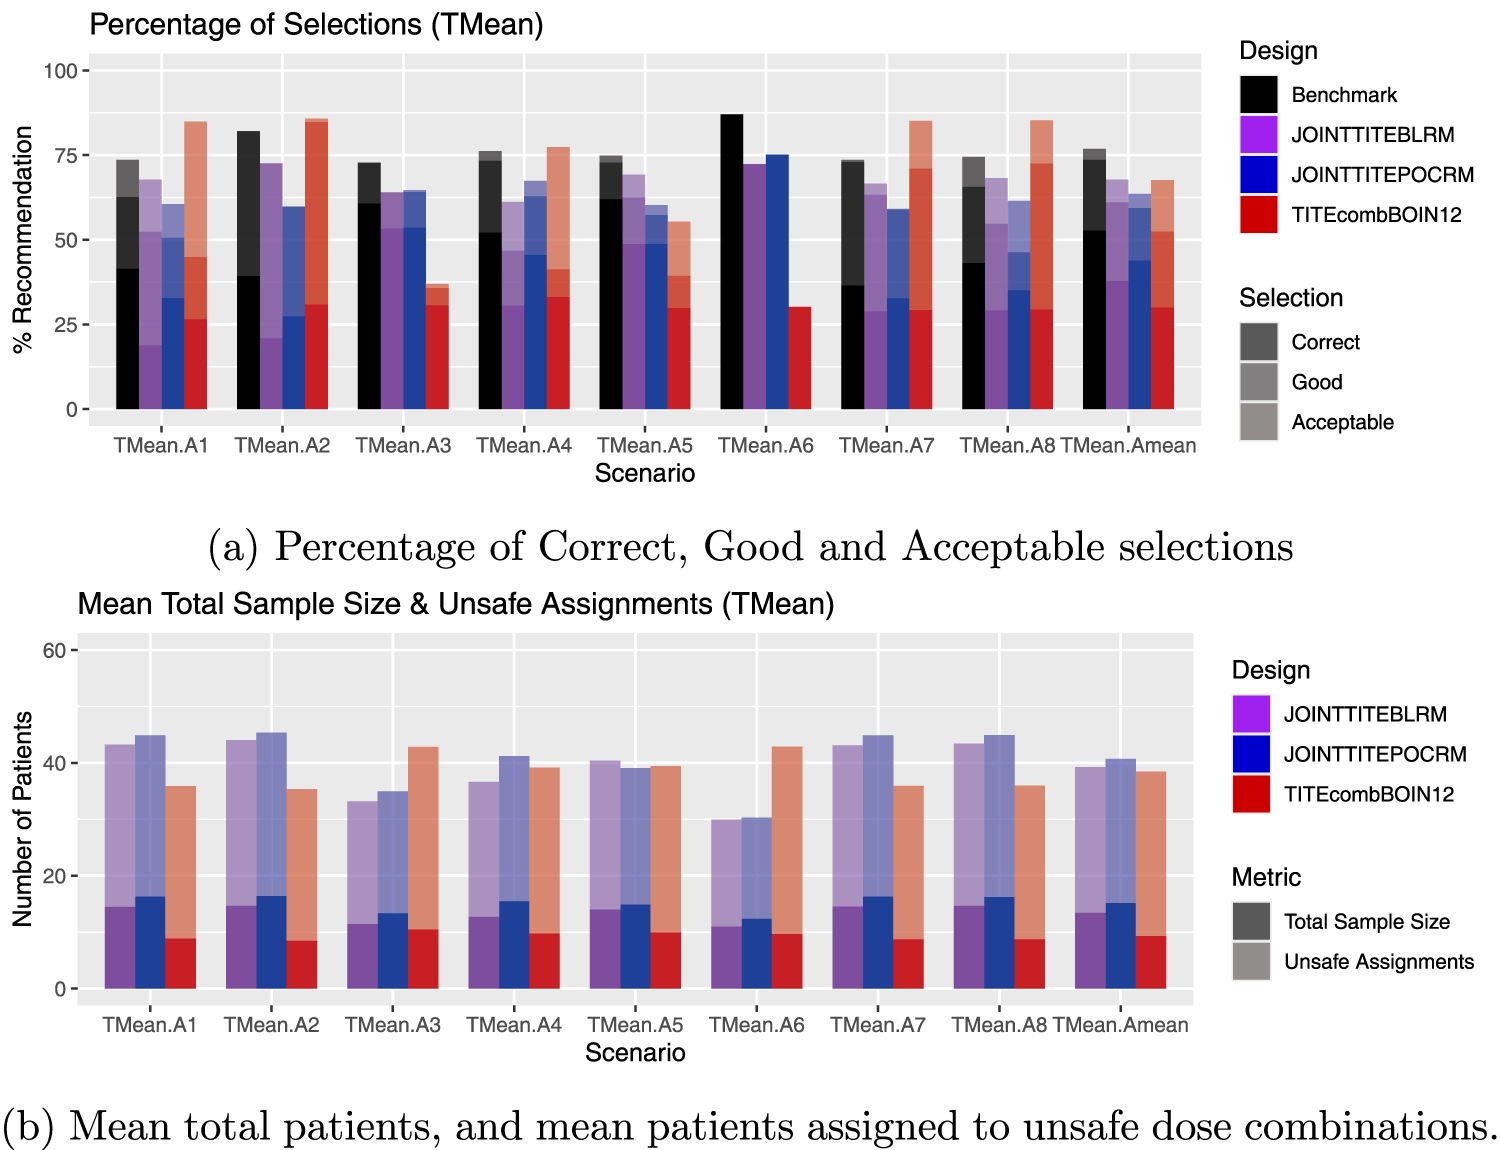
Average results over toxicity scenarios, labelled TMean.A1–TMean.A8, including an average over all 48 scenarios, labelled TMean.AMean. (a) Percentage of Correct, Good and Acceptable selections; (b) Mean total patients, and mean patients assigned to unsafe dose combinations.
Since the overall average displayed in the final columns of Figures 8(a) and (b) show only a small difference across the three approaches, one might assume that there is comparable performance. However, there is a large amount of variation when one looks in more detail at the individual scenarios.
For example, in scenarios T1.A1, T1.A2, T1.A3, T1.A4 and T1.A5, the Joint TITE-BLRM considerably outperforms the Joint TITE-POCRM. In these scenarios, all dose combinations are safe, and the correct dose combination is at the highest level of Agent
In contrast, it can be seen in Figure 3(a) in scenario T2.A1 and T2.A4, the Joint TITE-POCRM considerably outperforms the Joint TITE-BLRM. In both of these scenarios, dose combination
Figure 4(a) shows some interesting contrasting behaviour of the two model-based approaches. In T3.A3 and T3.A5, the Joint TITE-BLRM shows superior performance in terms of correct selections, however in T3.A1 T3.A2 and T3.A4, the Joint TITE-POCRM shows superior performance in terms of correct selections, and the Joint TITE-BLRM fails to select the correct dose combination at all. Here the correct dose combination is on the lowest dose of Agent
Figure 5(a) again shows the contrast in the behaviour. The average performance across T4 is very similar in terms of correct selections, but the Joint TITE-BLRM has more good selections. However. for example T4.A4 and T4.A5 show very different performances. In T4.A4, the Joint TITE-BLRM shows a very poor performance. The only acceptable/good/correct dose is
Since in T5, only the lowest dose combination is safe, only in scenarios T5.A1 and T5.A2 are we seeking to find the correct dose combination, and in the other four T5 scenarios we seek to declare no admissible doses. In Figure 6, the Joint TITE-POCRM shows superior performance in T5.A5 and T5.A6, where the Joint TITE-BLRM is more likely to recommend the inactive dose combinations than the Joint TITE-POCRM. The Joint TITE-BLRM identifies the lowest dose combination as the OBD in scenarios T5.A1 and T5.A2 more than the Joint TITE-POCRM.
In the T6 scenarios, all dose combinations are unsafe, and therefore the correct recommendation is either stopping for no admissible dose, or for a safety stopping rule. Here, Figure 7 illustrates the performance of the methods in these scenarios. It is clear to see that the TITE-comb-BOIN12 design correctly stops in more simulations in T6.A1 and T6.A2, but also stops sooner across most scenarios, with much smaller mean sample sizes. The Joint TITE-POCRM and Joint TITE-BLRM show similar performances to each other in T6.A2, T6.A4 and T6.A6, however the across the rest of the scenarios the Joint TITE-POCRM shows superior performance. Both model-based methods show poorer performances in the scenarios where the lowest dose combinations are active.
Figure 8 shows the average results over toxicity scenarios, including an average over all 48 scenarios. Whilst conclusions cannot be drawn in cases where the averages are similar, it is of interest to note those activity scenarios where the results are contrasting. Of note is A4, where the Joint TITE-POCRM shows superior performance over the Joint TITE-BLRM. Here, in three out of the six individual scenarios, the OBD was at the the 600 mg dose of Agent
So far we have considered scenarios whereby the dosing grid has dimensions
A smaller range of scenarios are considered in this setting, labelled S1–S6, with their definitions given in Table 3. These scenarios are chosen to give a range of relationships across the grid, and to further explore the results seen in the
Toxicity and activity probabilities and utility values for scenarios S1–S6.
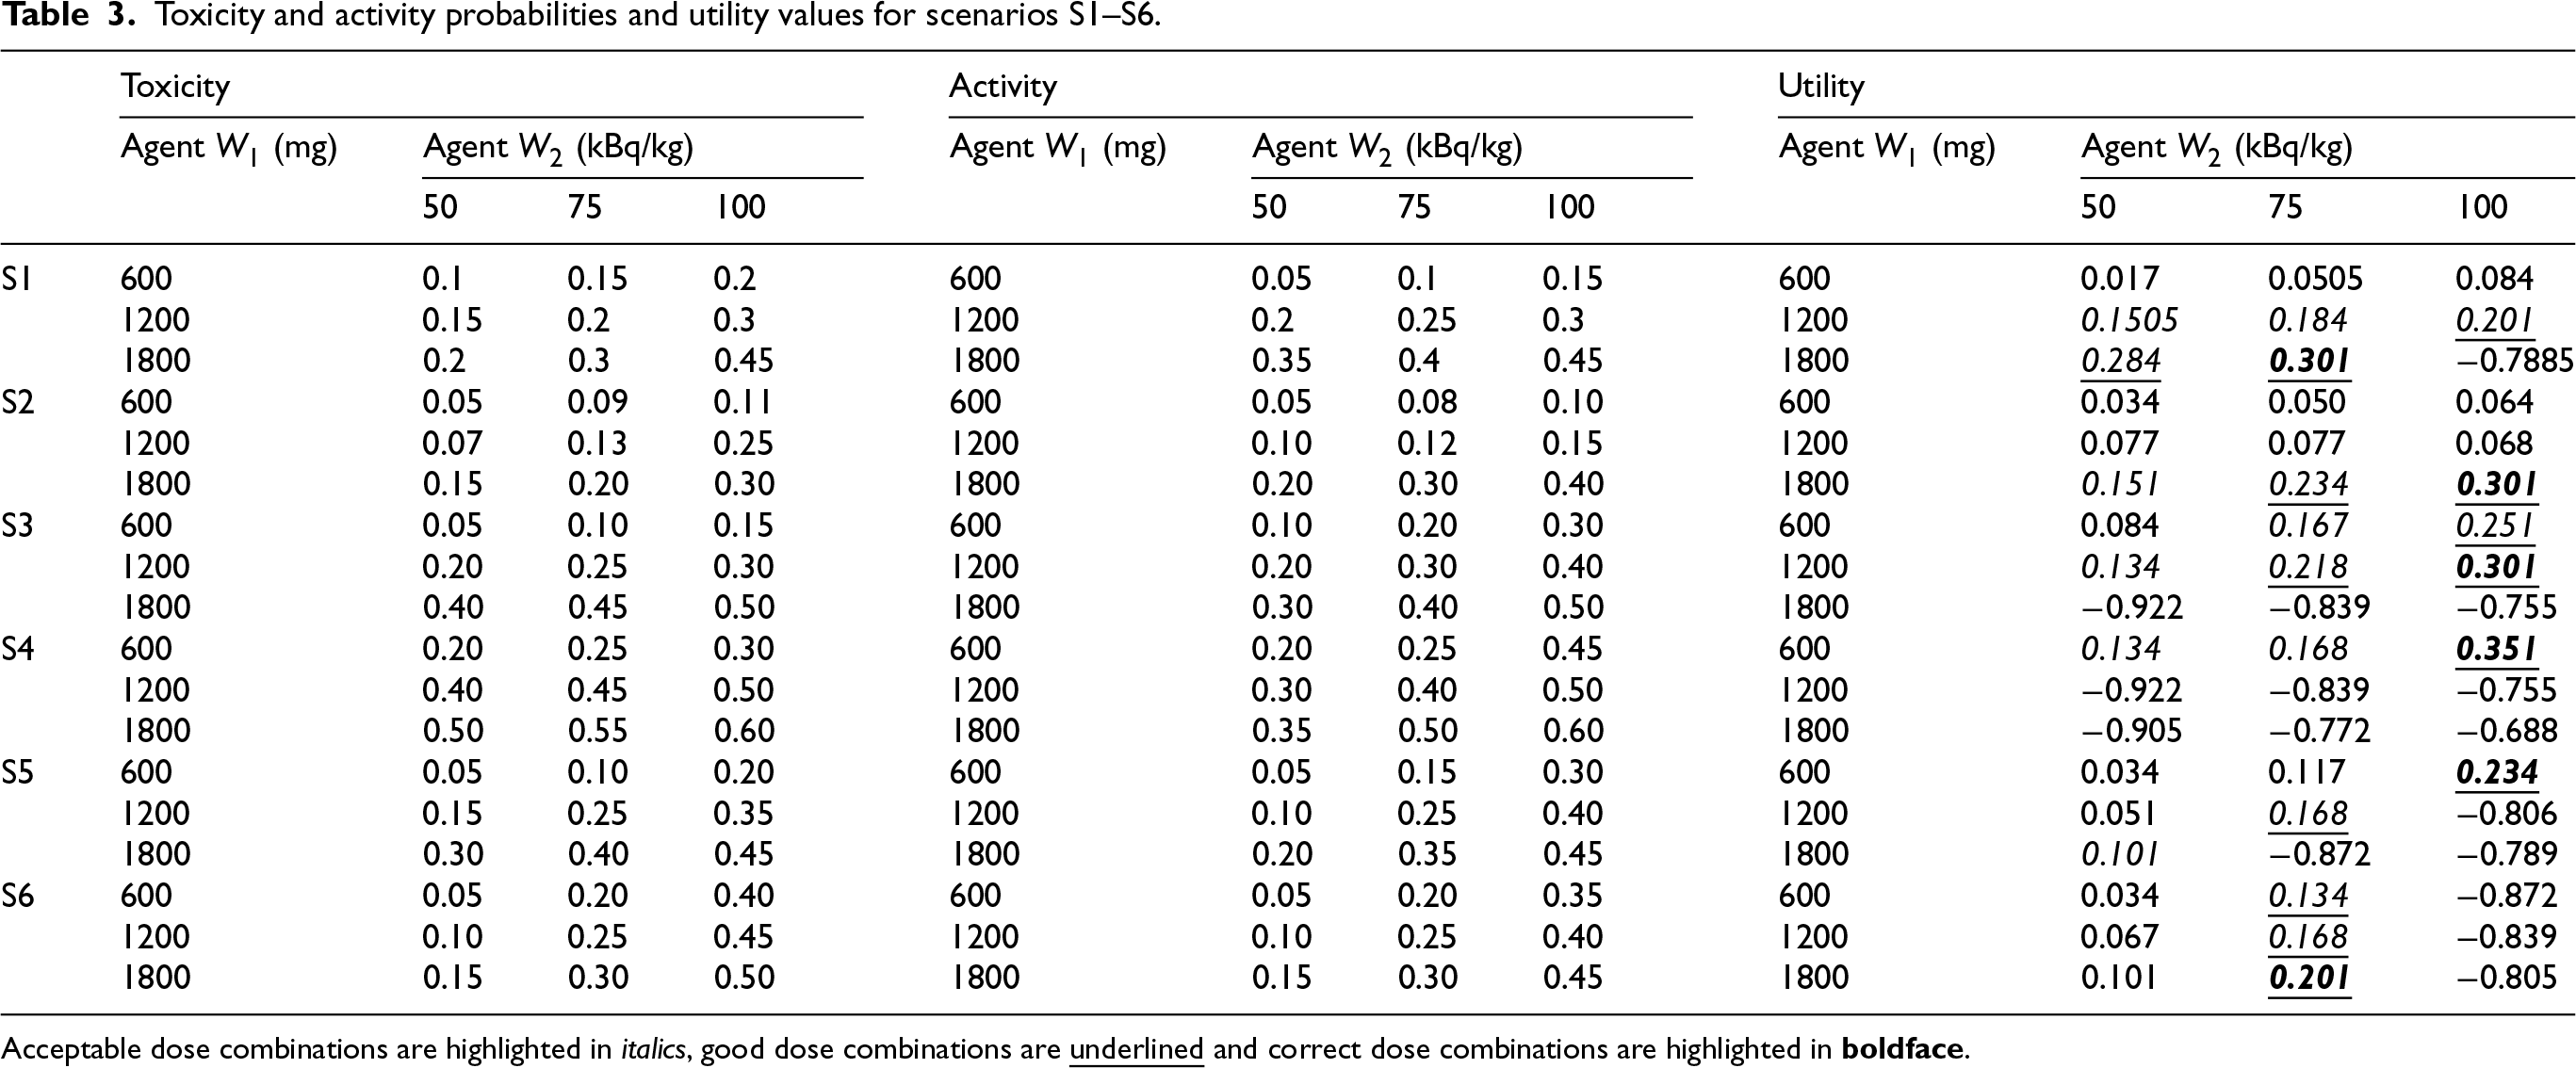
Toxicity and activity probabilities and utility values for scenarios S1–S6.
Acceptable dose combinations are highlighted in italics, good dose combinations are
The starting dose remains
The results for the simulation study of
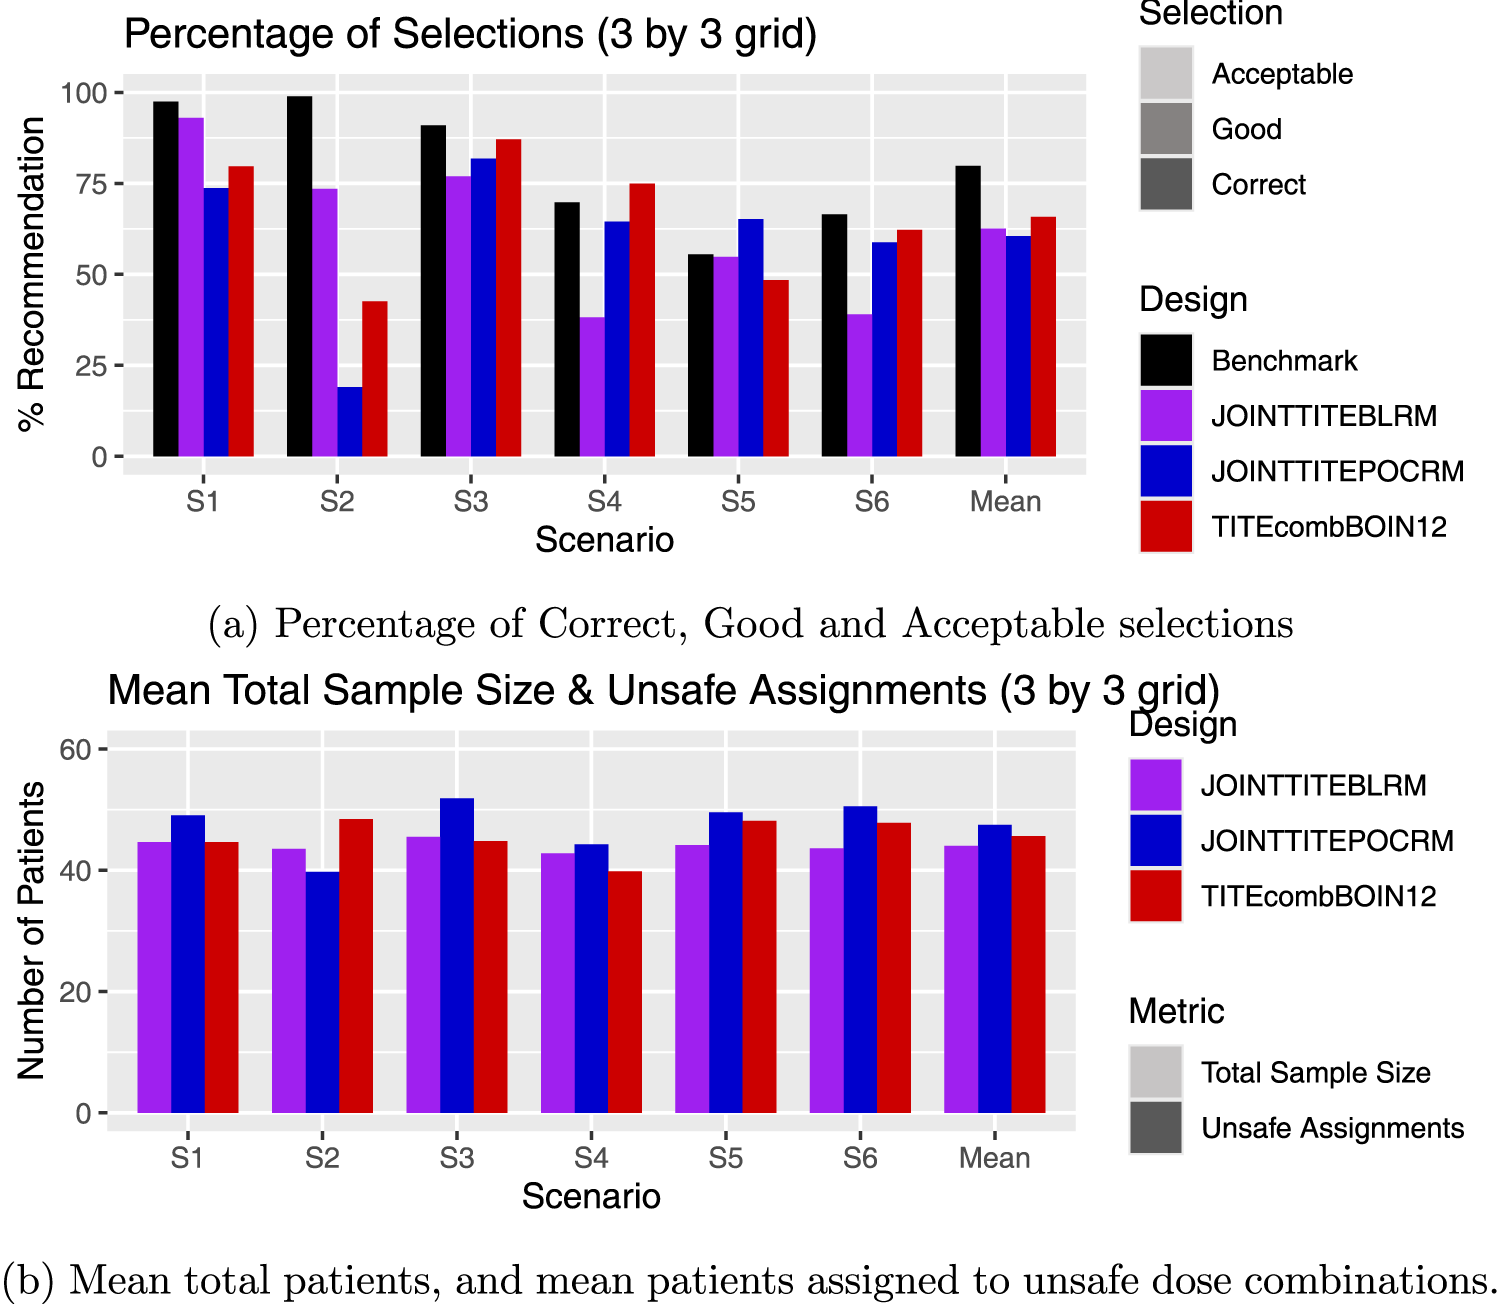
Results for the scenarios with 3 by 3 grids, including an average over these scenarios. (a) Percentage of Correct, Good and Acceptable selections; (b) Mean total patients, and mean patients assigned to unsafe dose combinations.
In S2, again the Joint TITE-BLRM shows more promising behaviour, recommending a good dose combination in 59% of simulations compared to the 12% of the Joint TITE-POCRM. This stark difference is due to the POCRM incorrectly stopping the trial for no admissible doses or the highest dose being too safe in 74% of simulations. Here only the 1800 mg dose of Agent
In S3–S6 however, the reverse is true, and the Joint TITE-POCRM show superior performance to the Joint TITE-BLRM. In S3, where the 1800 mg dose of Agent
In S5, the acceptable dose combinations lie along the off-diagonal of the grid, increasing utility as the dose of Agent
The TITE-comb-BOIN12 again shows a strong performance in terms of acceptable selections, however a poor performance in terms of good and correct selections, with a sample size in between the two model-based designs, and fewer patients assigned to unsafe doses.
In this work, two model-based approaches for a Phase I/II dose-finding trial with dual agents and late-onset endpoints are presented. One is based on the BLRM, and the other the POCRM. Both approaches show promise, but with contrasting behaviours in a subset of considered scenarios.
These contrasting behaviours are inherent due to the differences in nature of the two designs, accentuated by the dual TITE endpoint. Since the Joint TITE-POCRM has a fixed skeleton that can be mapped onto the dosing grid for the different partial orderings, this means that there is no fixed prior for each dose combination. In contrast, the Joint TITE-BLRM must by definition have a fixed prior for each dose combination. However, the Joint TITE-BLRM models interaction between the two agents and interaction between the two endpoints, whilst the Joint TITE-POCRM only models the interaction between the two endpoints in its second stage. Therefore both approaches offer flexibility in different ways, and this is illustrated in the simulation results presented here. In the case where there are two-dose levels of
One obvious limitation of both methods is their computational intensity. The complex models require MCMC methods to compute posterior distributions for parameters. The large number of parameters on which priors must be elicited is especially problematic for the BLRM as the high dimensionality of the prior calibration greatly increases the computational load. The reliance on the prior calibration should also be noted. In this work, both methods were subject to the same method of calibration an hence both given the fair chance to perform. Within the results of this calibration, it was clear to see that the results were particularly sensitive to some changes in hyper-parameter values and robust to others. Therefore the prior specification must be considered carefully in the context of the trial.
The models themselves also rely on a number of assumptions. For example, the monotonicity of both the activity and toxicity with dose. We have explored scenarios where the dose–activity relationship is both a plateau and bell-shaped, finding that the model-assisted method outperforms both model-based methods in these cases, although it should be noted that the model-based methods still perform well. Whilst the framework of both approaches could be adapted to accommodate non-monotonicity, the way in which this should be done would depend upon any further assumptions on the dose–response relationship.
Whilst we endeavour to present a comprehensive study of the proposed methods, there are of course other extensions that could be considered. For example, sensitivity to the distribution of the TITE, number of cycles, cohort size and sample size could all be considered of interest and would be especially pertinent in application to a trial.
Funding
The authors received the following financial support for the research, authorship, and/or publication of this article: Funding was received from UK Medical Research Council (MC_UU_00040/03). For the purpose of open access, the author has applied a Creative Commons Attribution (CC BY) licence to any Author Accepted Manuscript version arising
Supplemental Material
sj-pdf-1-smm-10.1177_09622802251403384 - Supplemental material for Joint time-to-event partial order continual reassessment method and Joint time-to-event Bayesian logistic regression model: Statistical designs for dual agent phase I/II dose finding studies with late-onset toxicity and activity outcomes
Supplemental material, sj-pdf-1-smm-10.1177_09622802251403384 for Joint time-to-event partial order continual reassessment method and Joint time-to-event Bayesian logistic regression model: Statistical designs for dual agent phase I/II dose finding studies with late-onset toxicity and activity outcomes by Helen Barnett, Oliver Boix, Dimitris Kontos and Thomas Jaki in Statistical Methods in Medical Research
Footnotes
Declaration of conflicting interests
The authors declared no potential conflicts of interest with respect to the research, authorship, and/or publication of this article.
Data availability
Supplemental material
Supplemental materials for this article are available online.
References
Supplementary Material
Please find the following supplemental material available below.
For Open Access articles published under a Creative Commons License, all supplemental material carries the same license as the article it is associated with.
For non-Open Access articles published, all supplemental material carries a non-exclusive license, and permission requests for re-use of supplemental material or any part of supplemental material shall be sent directly to the copyright owner as specified in the copyright notice associated with the article.