
Abstract
It is increasingly common for therapies in oncology to be given in combination. In some cases, patients can benefit from the interaction between two drugs, although often at the risk of higher toxicity. A large number of designs to conduct phase I trials in this setting are available, where the objective is to select the maximum tolerated dose combination. Recently, a number of model-free (also called model-assisted) designs have provoked interest, providing several practical advantages over the more conventional approaches of rule-based or model-based designs. In this paper, we demonstrate a novel calibration procedure for model-free designs to determine their most desirable parameters. Under the calibration procedure, we compare the behaviour of model-free designs to model-based designs in a comprehensive simulation study, covering a number of clinically plausible scenarios. It is found that model-free designs are competitive with the model-based designs in terms of the proportion of correct selections of the maximum tolerated dose combination. However, there are a number of scenarios in which model-free designs offer a safer alternative. This is also illustrated in the application of the designs to a case study using data from a phase I oncology trial.
Introduction
The aim of phase I clinical trials investigating a single therapy is to find the highest dose that can be administered whilst ensuring that patients are at a low risk of serious side effects. To offer patients a higher chance of successful treatment, there is willingness to accept a dose that leads to more toxic responses, commonly labelled as dose-limiting toxicities (DLTs). The highest dose for which the treatment has a pre-specified probability of leading to a toxic outcome (target toxicity) is called the maximum tolerated dose (MTD). In an analysis of over 400,000 clinical trials conducted between 2000 and 2015, 1 it was found that 57.6% of all phase I oncology trials successfully progressed to phase II. It was found that in 73% of trials excluding oncology, treatments were successful in moving to phase II, thus demonstrating the importance of successful dose-finding methods in oncology, where drugs are clearly harder to develop.
In this work, we consider phase I oncology trials in which a combination of two therapies is investigated. Here the objective is to identify a maximum tolerated dose combination (MTC), the dose combination with a probability of toxicity closest to the target toxicity. Phase I oncology trials in this dual-agent setting have recently provoked notable interest. 2 In particular, it was found that immunotherapy, a targeted agent that stimulates the immune system to fight cancerous cells, 3 can provide benefit to patients when administered in combination with chemotherapy or another targeted agent. 4 One difficulty in the dual-agent setting is that the order of toxicity is unknown for some combinations – if the amount of one compound in the combination is increased while another is decreased, it is unknown whether the overall toxicity goes up or down.
A number of dose-finding methods for dual-agent combination phase I trials relaxing the monotonicity assumption on the order of some of the combinations have been proposed in the literature. They broadly belong to one of three categories; rule-based, model-based, and model-free (also known as model-assisted) designs. Rule-based designs (e.g. 3+3+3 or extensions of this5–7) rely on a number of pre-specified rules to determine when a dose is escalated, de-escalated and chosen as the MTC. Model-based designs (e.g. Bayesian logistic regression model (BLRM), 8 six-parameter model, 9 partial ordering continual reassessment method (POCRM) 10 and the modified logistic model 11 ) model the relationship between dose and probability of toxicity through a parametric function. Through the course of a trial, parameter estimates are updated to better describe this relationship. The model-free designs12,13 do not pre-specify any relationship between dose and toxicity, thus do not rely on any parametric assumptions in their search for the MTC. However, unlike rule-based designs, the decision process in which the dose can be escalated or de-escalated is assisted with a statistical model.
Despite numerous papers demonstrating flaws in rule-based designs and their performance in drug combination trials,14–16 it was reported that less than 5% of combination trials in oncology between 2011 and 2013 deviated from rule-based designs. 17 It is perhaps the restrictions associated with model-based designs, such as difficulty of implementation or communication to clinicians, that have made these less commonly used in real trials. Recently, model-free designs have attracted attention due to their practicality, 18 although these have not yet been fully evaluated in the literature.
The objective of this work is to review five recently proposed model-free dose-finding designs for phase I dual-agent combination studies, namely, the Bayesian optimal interval (BOIN) design 19 BOIN, the Keyboard design 20 (KEY), the surface-free design 21 (SFD), the product of independent beta probabilities design 22 (PIPE), and the Waterfall design. 23 We evaluate their performance in an extensive simulation study. We note that some comparison has already been investigated by previous authors, for example, the comparison of the Keyboard design to two other designs. 20 The novelty in our approach is to compare the methods on equal grounds. We hence propose a calibration procedure that selects the parameters of each of the designs that maximise the proportion of correct selections (PCS), subject to a safety constraint. We compare the performance of these designs to three model-based designs; the BLRM, a model-based approach that uses a two-parameter logistic model for each compound 8 ; the POCRM 10 ; and the modified logistic model, 11 as well as a non-parametric optimal benchmark. 24 We also evaluate the performance of each of the designs in a case study of neratinib and temsirolimus, 25 to highlight the differences between approaches in a real trial setting of a dose-finding trial from combination therapies.
The rest of the paper continues as follows. We first provide a review of model-free designs, before using a novel method to calibrate the parameters of each design leading to good performance. We then present detailed results from our simulation study across a wide range of toxicity scenarios, including the model-based designs for comparison. Each design is also applied to the real case study of neratinib and temsirolimus. We finish with a discussion of our results.
Methodological review
In this section, we describe the dose escalation procedure for each of the five model-free approaches in a general dose-finding trial. It is assumed patients enter the trial in cohorts, and the dose combination for the next cohort is assigned once the previous cohort’s responses are available. We first define the admissible combinations for each design. These are the dose combinations that are allowable for assignment for the next cohort of patients based on the last tested combination. We then describe the details of the escalation procedure in each of the designs in the following setting. Consider a dual-agent trial with
Admissible combinations
Before deciding on a dose for the next cohort, each design defines a set of combinations that are admissible; i.e. combinations that the next cohort could be allocated to. These are best illustrated with a diagram, Figure 1. Suppose we are at
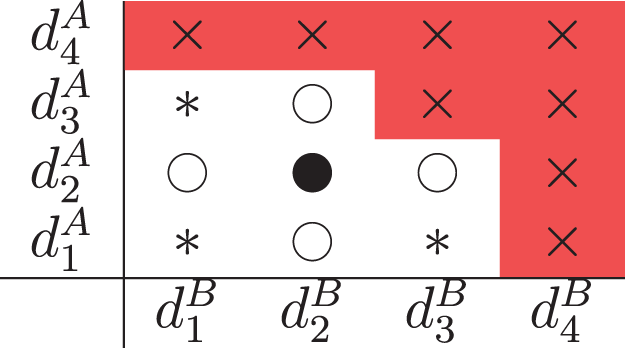
Illustration for
In addition to these combinations, the SFD and PIPE also allow for diagonal de-escalation, where the next cohort is administered a combination that is one dose level lower in each drug (
All designs prohibit diagonal escalation, where the next cohort receives a combination of one dose level higher in each drug (
The BOIN design
19
uses the intuitive estimator If If Otherwise,
In this way, dose skipping, diagonal escalation and diagonal de-escalation are prohibited – see the ‘Admissible Combinations’ section for more details. If the next combination is to be chosen from an empty

The design uses an overdosing criterion stating that a combination, and any that are more toxic under monotonicity, satisfying
After all patients are treated, estimates of each
The Keyboard design (KEY)
20
is very similar to the BOIN design, defining an interval about the target toxicity
The KEY design assigns a vague Beta(1,1) prior distribution to each If If If
To choose between combinations in

Both the BOIN and KEY designs model dose combinations independently, however in the following two designs, the connections between the dose combinations are also taken into account.
The SFD
21
does not restrict the MTC search to a parametric surface and does not require the order of toxicity between combinations to be known. The main idea is to parametrise ratios between toxicity probabilities for different combinations, defining

After each cohort, the SFD updates the posterior means for ratios
Once all patients have been treated, the MTC is selected as the combination with toxicity probability closest to
The PIPE design
22
differs from the model-free designs discussed so far in that it was originally proposed to find the MTC contour, labelled
Assuming the

Each contour can be represented by a binary matrix, where entries are 0 or 1 depending on whether estimates of the toxicity probability for a combination are below or above the contour respectively. Let
To estimate the


The design uses an overdosing rule that considers the expected probability of
The PIPE design can recommend multiple combinations for phase II, as it recommends all combinations closest from below its
The Waterfall design
23
also aims at finding the MTC contour. This design breaks down the two-dimensional dosing grid into a series of one-dimensional sub-trials. For the
Firstly, sub-trial
Similarly to the PIPE design, since many combinations are recommended, for consistency we select one MTC based on the posterior mean probability of each dose combination that is recommended.
Calibration of designs
Model-based and model-free designs based on a Bayesian framework give clinicians more control over their performance. The PIPE design, the SFD and most model-based designs allow for knowledge on the toxicity of each drug from monotherapy trials to be incorporated into the design through their prior distributions. As the BOIN and KEY designs assign vague priors to the toxicity probabilities, their behaviour is primarily determined by the pre-defined intervals guiding escalation. Although it is in theory possible to incorporate historical data through the prior in the BOIN and KEY designs, 27 for the purpose of this comparison, it would defeat the purpose of a design with all escalation boundaries pre-specified at the design stage for ease of implementation.
Since for all designs, the hyper-parameter values of the prior and the values of the intervals have a substantial effect on the escalation procedure, any attempt to compare designs objectively must ensure that these values are specified in a fair way. In this comparison study, the aim of the novel calibration procedure is to give all designs a set-up that leads to consistently high proportions of selections of combinations with toxicity probability close to
Each design considered in the comparison is calibrated using a novel two-stage approach. The first stage of the calibration is concerned with choosing values for hyper-parameters that give a good performance in selecting the MTC without considering safety. The second stage then focusses on safety, calibrating the overdose rule taking into account not only good performance in terms of recommending no combinations when considering an overly toxic scenario, but also the number of patients who are treated at unsafe doses. Although using similar principles to a standard fine-tuning approach, the novelty of this two-stage calibration is in this lesser subjective but still intuitive choice of hyper-parameters.
This two-stage calibration procedure based on high performance and safety is applied for all designs, employing a grid search over hyper-parameter or interval values (depending on the design). At each stage, this involves running simulations over four clinically plausible scenarios and determining which values lead to superior performance when averaged across the scenarios. We refer to the priors resulting in superior performance across the four scenarios as operational priors. Whilst this procedure gives the Bayesian designs an opportunity to be compared fairly against each other through their performance, these priors can also be applicable in the practical case where no reliable prior information about the compounds is available.
The first stage of the calibration procedure evaluates which design inputs lead to superior performance in recommending the MTC across the four scenarios. The PCS is examined in each scenario. This is the proportion of trials in which a design selects any combination with a true toxicity probability of exactly 0.30. To summarise the overall performance across these four scenarios, the geometric mean PCS is used. For the remainder of this section, the mean will refer to the geometric mean. Suppose
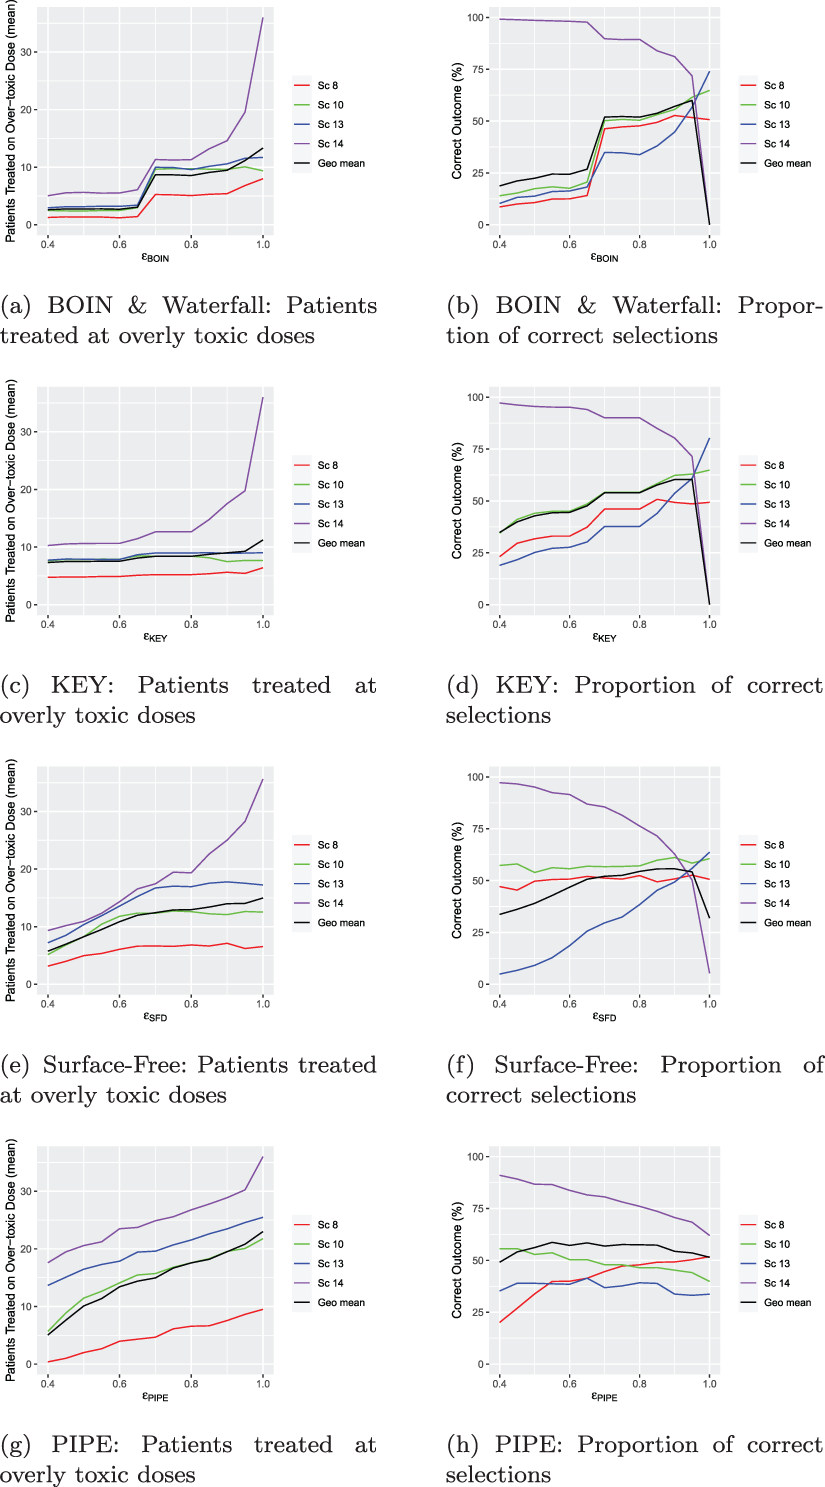
The second stage of the calibration procedure is for
Calibration of
Each design is calibrated in the same setting that is then explored in the simulation study, representative of a phase I trial in oncology. There are two drugs with three dose levels each, which results in nine combinations, and the first cohort is treated at the lowest combination. The objective is to select a single combination as the MTC with true toxicity probability
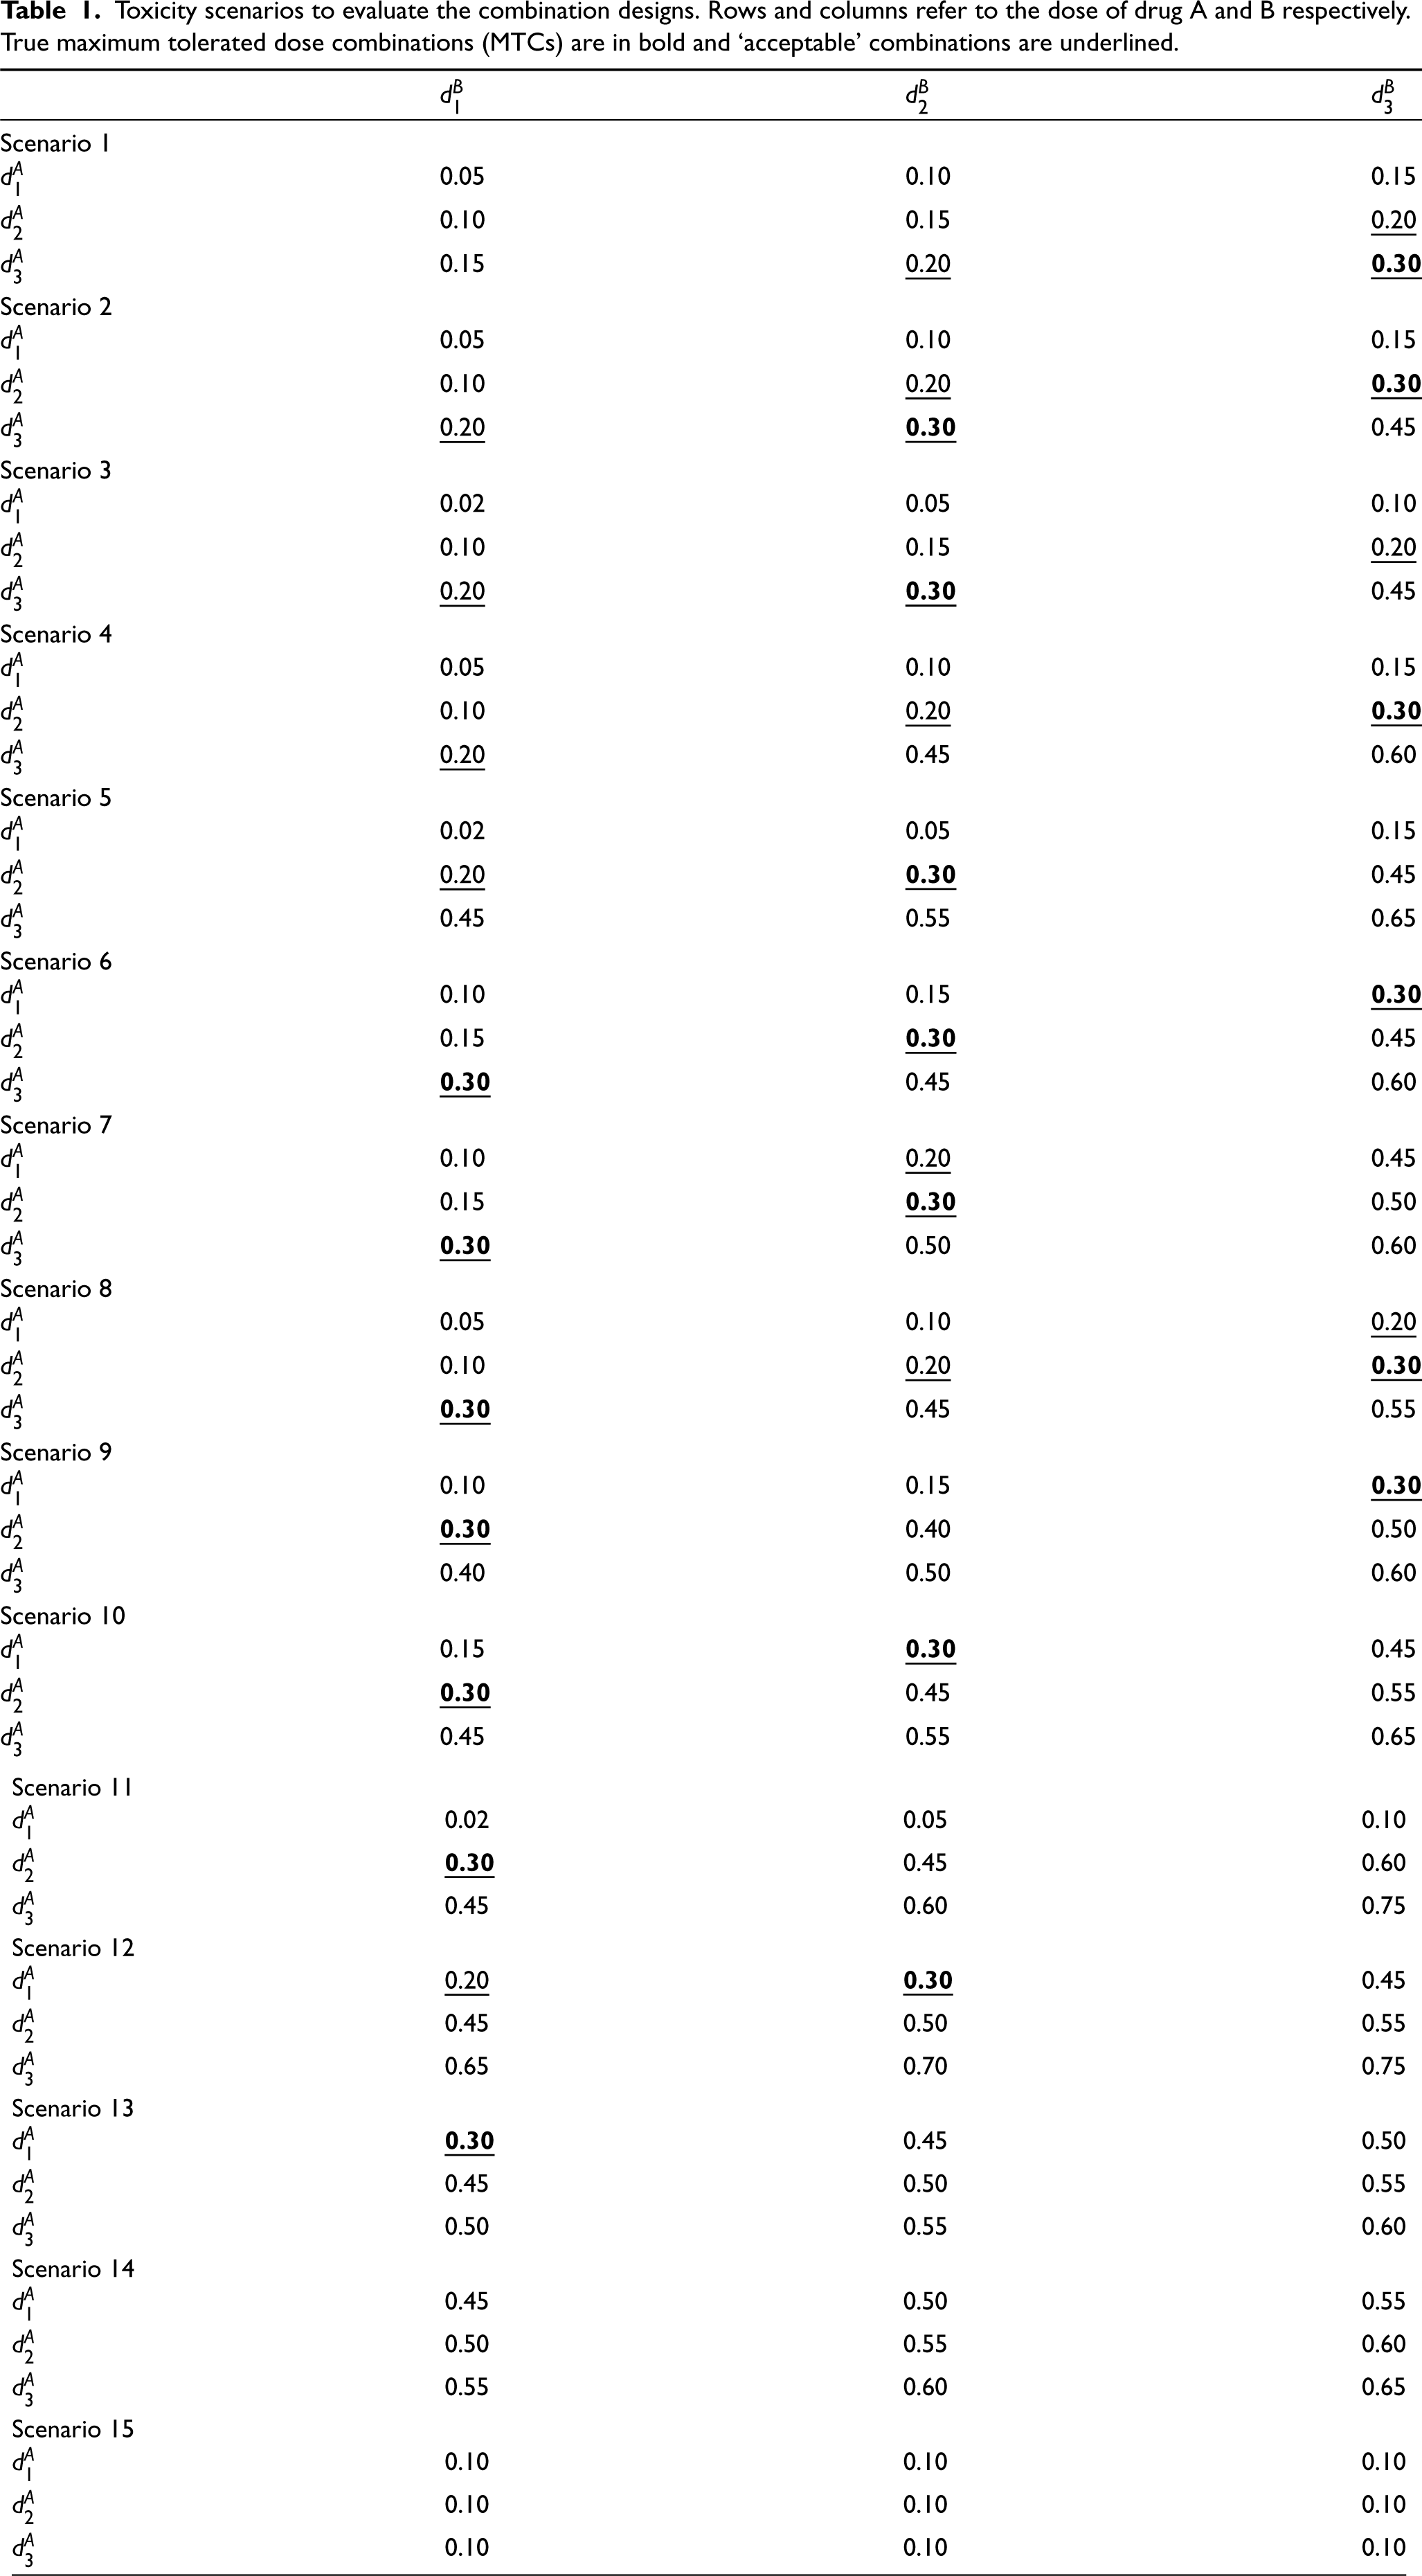
Toxicity scenarios to evaluate the combination designs. Rows and columns refer to the dose of drug A and B respectively. True maximum tolerated dose combinations (MTCs) are in bold and ‘acceptable’ combinations are underlined.
Toxicity scenarios to evaluate the combination designs. Rows and columns refer to the dose of drug A and B respectively. True maximum tolerated dose combinations (MTCs) are in bold and ‘acceptable’ combinations are underlined.
In stage 1 of the calibration procedure, Scenarios 1, 8, 10 and 13 are chosen to give a diverse range of plausible scenarios. We have found the procedure to be robust to changes in these scenarios provided the qualitative features (e.g. if there is at least one scenario where the optimal combination is off diagonal) are maintained. The number of scenarios is chosen to balance computational feasibility and breadth of differing scenarios. Scenarios 1 and 13 are chosen to represent the extremes: when the highest combination is the only true MTC and all others are safe, and when the lowest combination is the only true MTC and all others are overly toxic, respectively. Scenario 8 covers situations in which most combinations are safe but true MTCs do not lie on the same diagonal. Scenario 10 captures the case where most combinations are overly toxic and true MTCs lie on the same diagonal. Note that we often refer to the set of combinations in a scenario as the combination grid.
In stage 2, simulations are run for each design over Scenarios 8, 10, 13 and 14 for different values of
We summarise the optimal choice of hyper-parameters alongside the recommendations from the original proposal of each design in the online supplemental materials.
To guide dose escalation, the BOIN design relies on the interval
The optimal values are found to be
In the second stage of calibration, we find that as
Calibrating the keyboard design
Using a similar method to BOIN, we first calibrate the parameters that define the interval for KEY. The interval
In the second stage of calibration, we find that as
Calibrating the surface-free design
The SFD assigns Beta priors to each of its parameters; the ratios between toxicity probabilities. In this setting, there are five ratios (
For each pair, we run 1000 simulations (which is lower than other model-free designs due to the computational demands of the design) and examine the mean PCS across the four scenarios. Our results in Figure S4 in the online supplemental materials show that the mean PCS is highest for
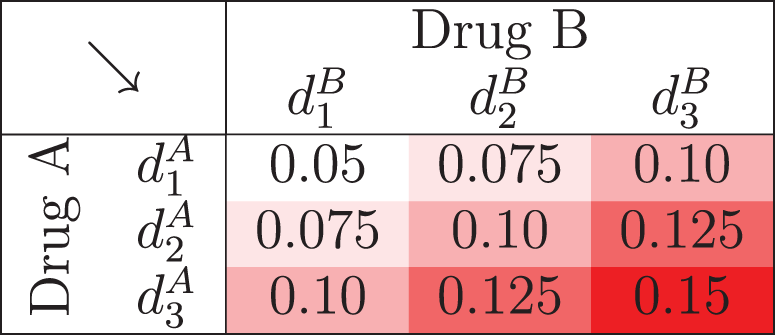
Constructing prior mean toxicity probabilities when calibrating the PIPE design.
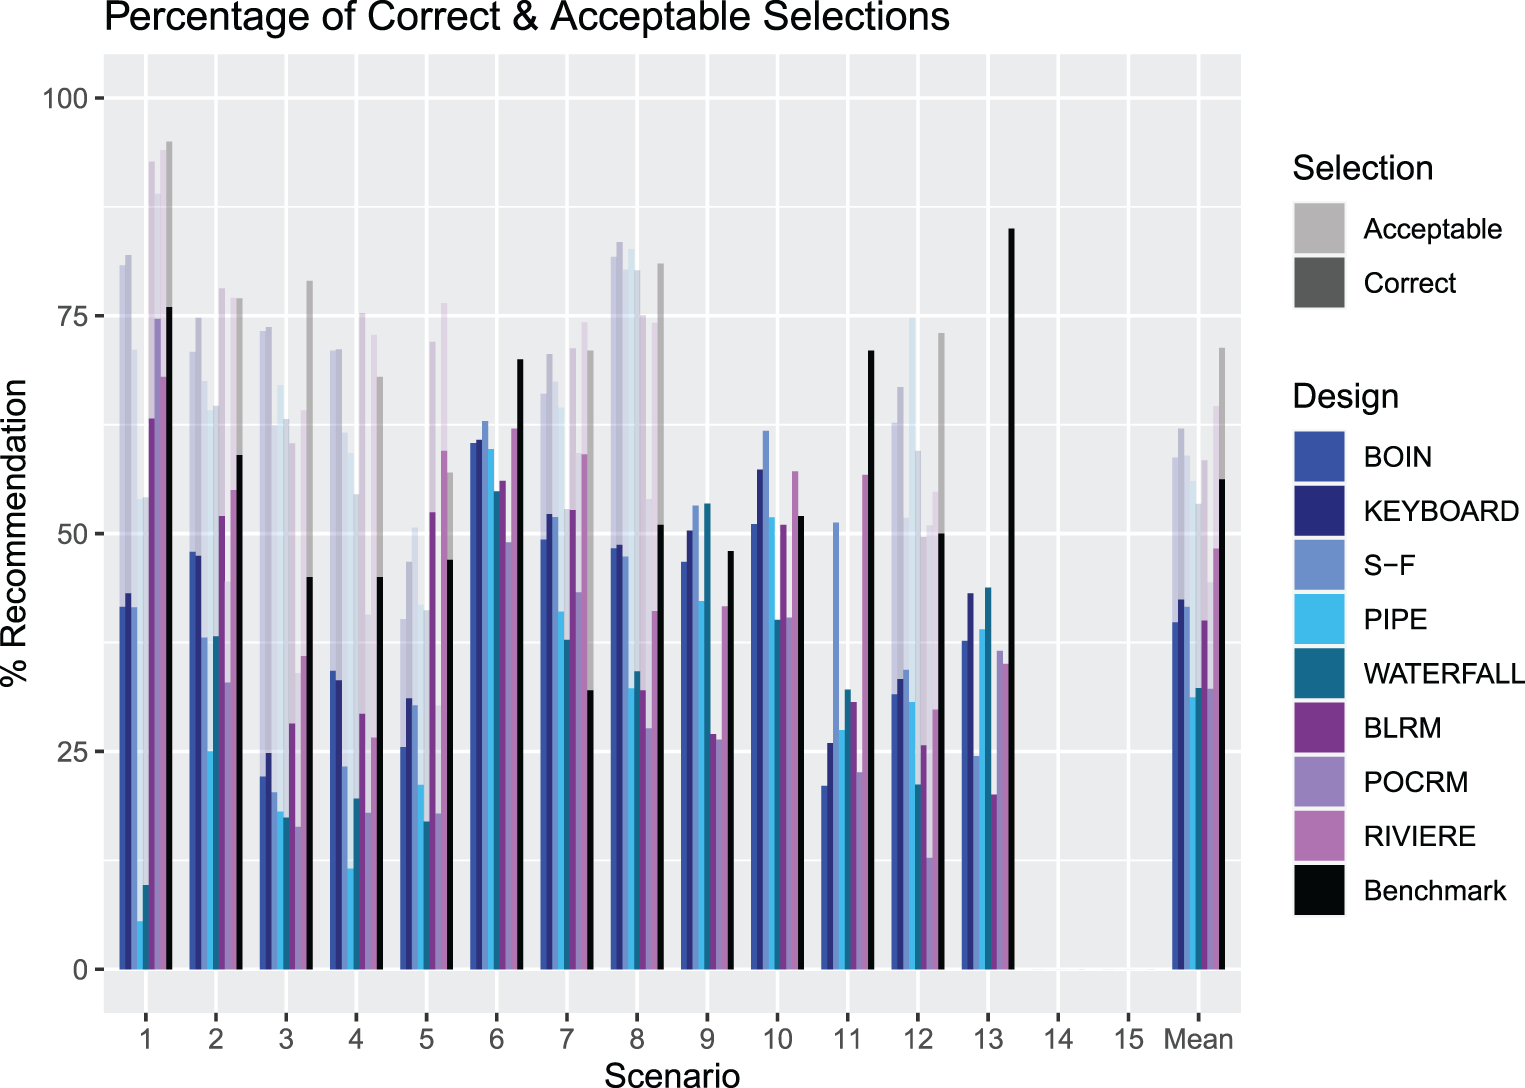
An illustration of the PCS and PAS for Scenarios 1–13 for each design. The solid bars measure the PCS and the more transparent bars measure the PAS. The rightmost group of bars show the means. PCS: proportion of correct selection; PAS: proportion of acceptable selection.
For the calibration of
Similar to the SFD, the PIPE designs assigns beta priors to each
Our approach involves calibrating three parameters simultaneously to create operational priors, and are chosen from the sets
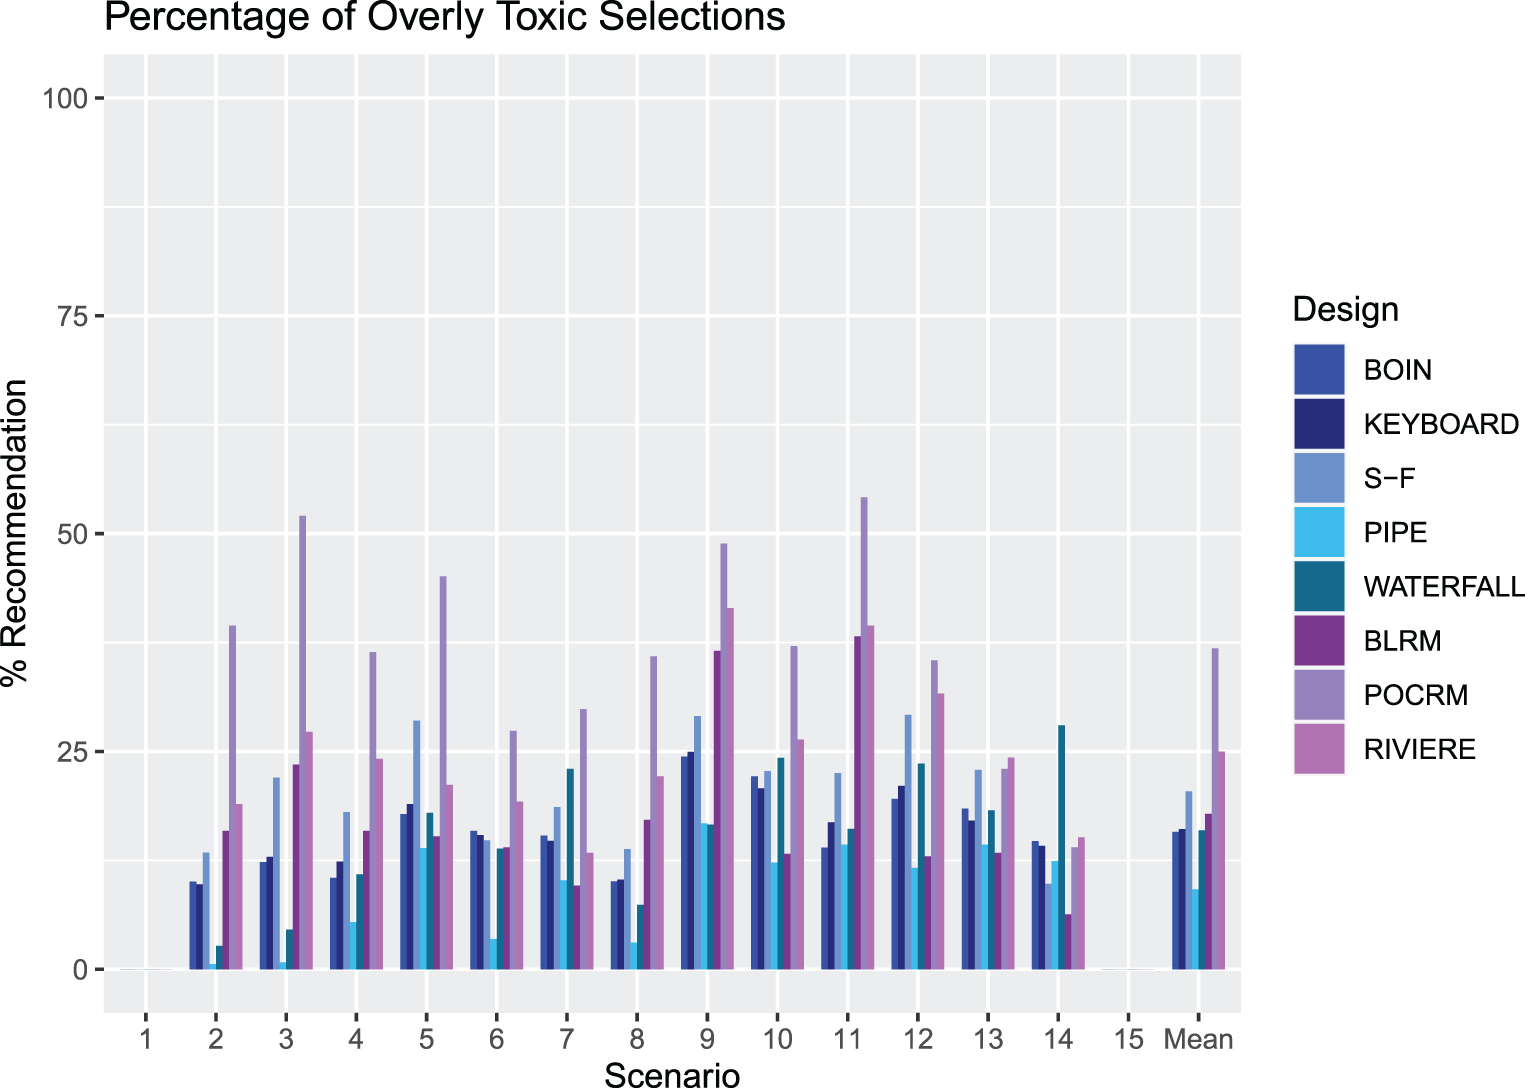
An illustration of the proportion of overly toxic selections across Scenarios 1–15 for each design. The rightmost groups of bars show the means.
For the second stage of the calibration, the value of
The calibration of the Waterfall design is in line with the calibration of the BOIN design, since the parameters of escalation are the same. Therefore the values of the hyper-parameters used for the interval
Simulation study:
dosing grid
In this section we describe the setting for the simulation study of
Setting
In order to compare the discussed designs, we conduct a simulation study, performing 2000 simulations of each of the 15 scenarios depicted in Table 1 for all five designs. As before, the objective is to select a single combination as the MTC with true toxicity probability
In general, the number of overly toxic combinations available for selection increases as we move through Scenarios 1–14. Scenario 1 has a single MTC which is the highest combination available. Scenarios 3 and 4 contain very few overly toxic combinations and have MTCs on the edge of the grid. Scenario 5 is similar to these, except its only MTC is located in the centre of the grid. In Scenarios 2, 6, 7, 8, 9 and 10, there are multiple combinations to explore which have toxicity probability
In order to accentuate the differences in the designs, we do not implement any accuracy or sufficient information rules, as these may mask some key elements of the designs. We focus on the operating characteristics of PCS and proportion of acceptable selections (PAS) as measures of accuracy, and proportion of overly toxic selections and the number of patients treated on unsafe dose combinations as measures of safety.
Model-based comparators
To provide a comparison between model-free and model-based designs, we also consider conventional model-based approaches in our simulation study, the two-dimensional BLRM, 8 the POCRM, 10 and a modified design based on the logistic model (referred to here as the Riviere design). 11
The same proposed calibration procedure as is applied to the model-free designs is applied to the model-based, with details provided in the online supplemental materials. Note that the form of the overdosing rule may be different for the model-based designs, compared the model-free designs, as described in their respective original proposals.
Bayesian logistic regression model
In this approach, the toxicity probability for each combination, 
The Bayesian POCRM
10
generalises the original CRM design to the setting of combination trials. The POCRM design assumes that there are 
Another model-based approach considered is the modified logistic model. 11 Following the recommendation on reducing the dimensionally of the parametric models in Phase I trials, 31 we consider the 3-parameter logistic model (rather than the original 4-parameter one 32 ) and was found to result in the same or better, on average, operating characteristics of the design for small to moderate sample sizes.
Specifically, the combination-toxicity is modelled using the 3-parameter logistic model

While the primary goal of this work is to compare the performance of different model-free designs to each other, there is a risk that all methods might perform equally poorly on some scenarios. In this case, the comparison of the designs to each other would not identify why the poor performance is observed – due to the challenging scenario or due to all designs having difficulties identifying a particular MTC. To provide context for the comparison of operating characteristics, we include the performance of the non-parametric benchmark for combination studies, a tool that provides an estimate for the upper bound on the PCS under the given combination-toxicity scenario.24,33 The benchmark takes into account the ‘difficulty’ of a scenario in terms of how close the toxicity risks for the combinations (under this scenario) are to the target level of 30%, and also accounts for the unknown monotonic ordering in the combination setting. We refer the reader to the recent work by Mozgunov et al. 24 for further technical details on the benchmark for combinations implementation.
Results
Accuracy index and proportions of correct and acceptable selections
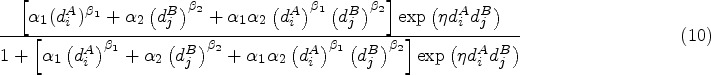
The results are presented here in terms of proportions of correct and acceptable selections (PCS and PAS) as defined in the ‘Calibration of Designs’ section. We also calculate an accuracy index, defined in equation (13), where 
Values of the accuracy index (13) for each of the designs across Scenarios 1–15.
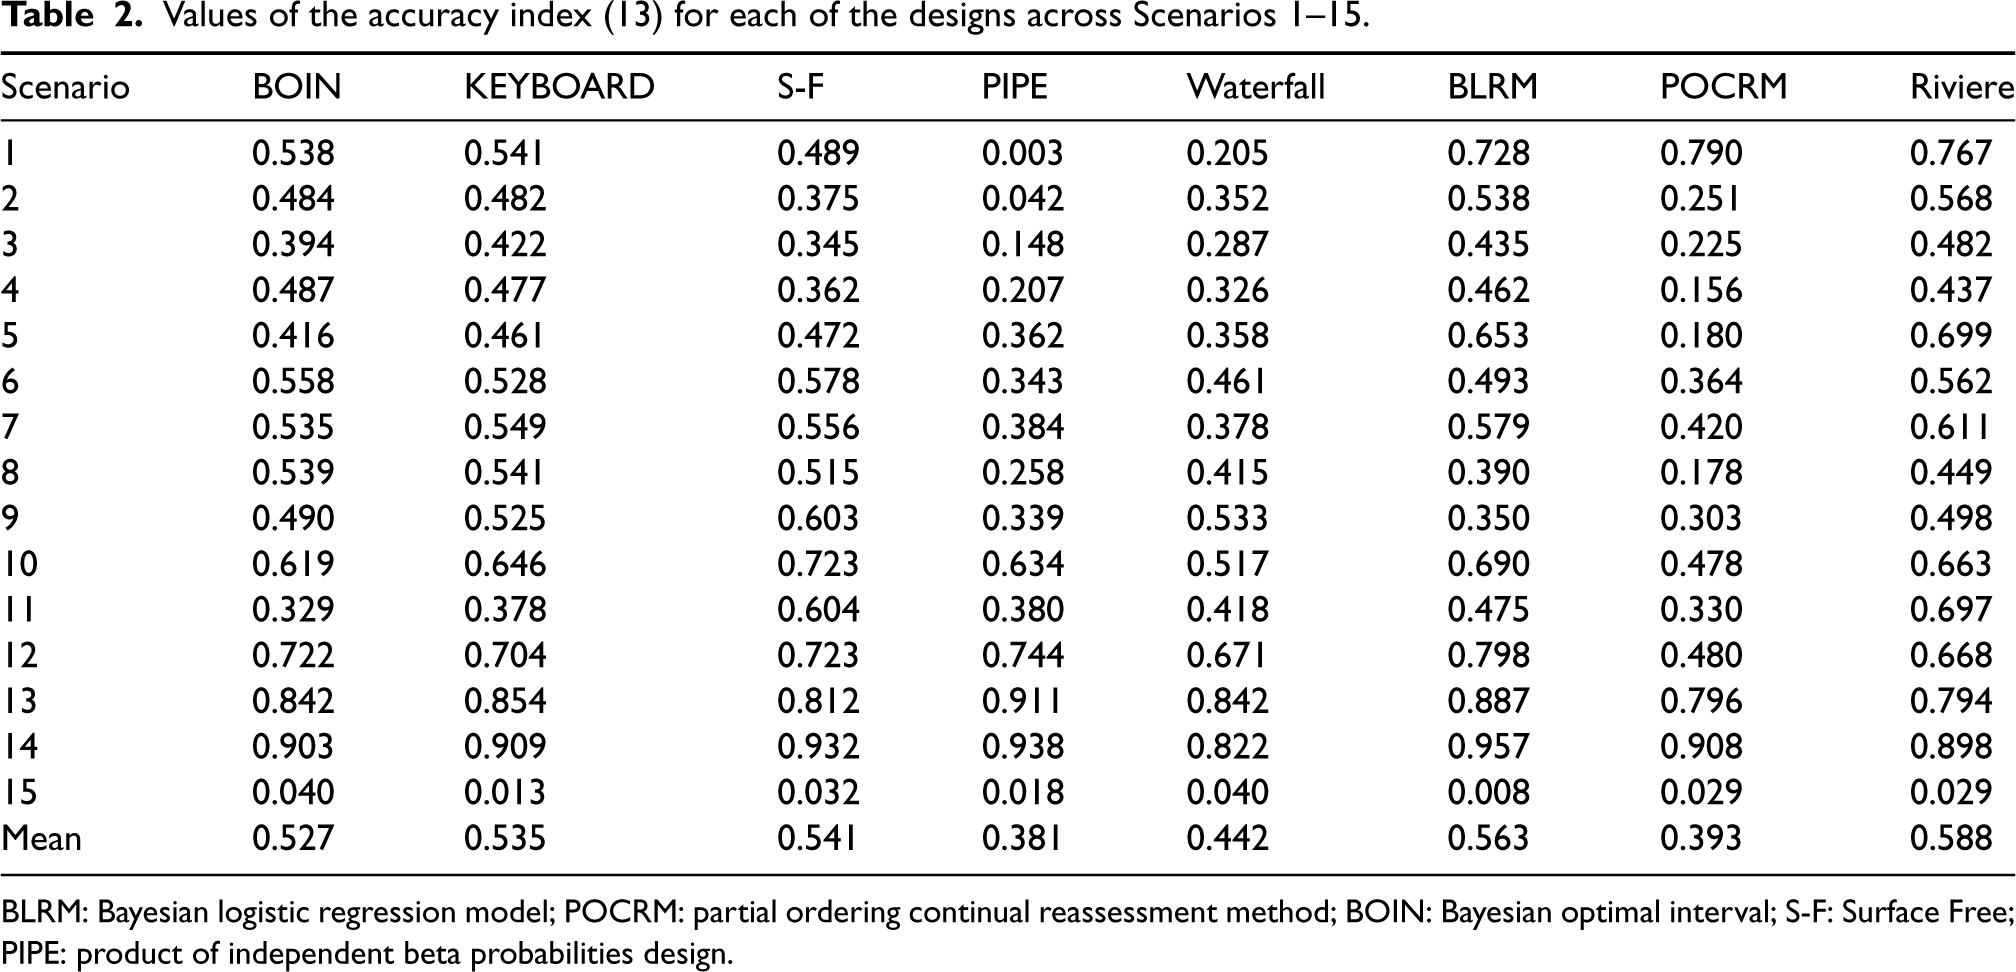
BLRM: Bayesian logistic regression model; POCRM: partial ordering continual reassessment method; BOIN: Bayesian optimal interval; S-F: Surface Free; PIPE: product of independent beta probabilities design.
Figure 4 presents the summary of the operating characteristics of the considered designs in terms of the PCS and PAS (with the full set of results given in the online supplemental materials). Model free designs are shown in blue, model-based designs in purple, and the non-parametric benchmark is in black. Scenarios 14 and 15 have been excluded as these have no true MTCs for the design to select. For scenarios in which the only acceptable combinations are also correct combinations (Scenarios 6, 9, 10, 11 and 13), the PCS and PAS are equal. The mean PCS across Scenarios 1-13 for the BOIN, KEY, SFD, PIPE, Waterfall, BLRM, POCRM and Riviere designs is 39.8%, 42.4%, 41.6%, 31.2%, 32.3%, 40.0%, 32.2% and 48.3% respectively, whilst the mean PAS are 58.7%, 62.1%, 59.0%, 56.0%, 53.4%, 58.4%, 44.4% and 64.6% respectively.
First of all, the benchmark reveals the differences in how challenging it is to identify the MTC in the considered scenarios: the PCS for the benchmark varies between approximately 35% under Scenario 7 to more than 80% under Scenario 13. As expected, the benchmark corresponds to the highest average PCS and PAS – 55% and nearly 70%, respectively. Similarly, under the majority of scenarios the benchmark corresponds to the highest PCS and PAS as it employs the concept of the complete information. The largest difference between the benchmark and other designs can be seen under Scenario 13. At the same time, there are scenarios under which the benchmark is outperformed by a competing design – this can be a sign of the design favouring particular combinations under the calibrated priors – for example under Scenario 7. Since the aim of the calibration procedure was to obtain a prior with good operating characteristics across many plausible scenarios, in the simulation study some scenarios will have better or worse performance than the benchmark.
The variety of performances across the scenarios demonstrates the variability between the different designs in different settings. Considering the model-free designs, on average the KEY design has the highest proportion of both correct and acceptable selections, but is vastly outperformed in some scenarios by the SFD design. In five of the scenarios, the KEY has the highest PCS out of all the model-free designs, being superior in scenarios with few overly toxic combinations. However, for example in Scenario 11, where the MTC is the middle dose of drug A and lowest dose of drug B, the SFD outperforms the next best performing design by 19.2%. The PIPE design shows poor performance in many scenarios, most notably in Scenario 1 where the PCS is 5.5% and PAS is 54.0%. A likely reason is that for the PIPE design, the choice of MTC must be below the MTC contour, and a scenario where the true MTC is the highest dose combination gives rise to underestimation since we cannot explore above the true MTC contour. In addition, the procedure discussed in the Methodological Review of the PIPE design to choose one MTC from the recommended set will make our results differ from those originally reported by Mander and Sweeting, 22 where a ‘correct selection’ was defined as the MTC being in the set of recommended doses. Although the Waterfall design also recommends a set of doses, the performance in the simulations is better than that of the PIPE design. Although it has poor performance in Scenario 1, where the MTC is the highest dose combination, it is the best performing design in Scenarios 9 and 13.
When considering the model-based designs as a comparator, we see that in many scenarios these outperform the KEY. For example, in Scenario 1 where the MTC is the highest combination, all of the model based designs achieve a PCS at least 20% higher than the next best performing design, the KEY. In fact, when including these designs in the comparison, the KEY is only the best performing design in one scenario, Scenario 8. The SFD does however outperform the model-based designs in some cases, with the model-based designs having the highest PCS in Scenarios 1, 2, 3, 5, 7 and 11 and the SFD is the best performing in Scenarios 6, 10 and 12.
In terms of the accuracy index, the SFD, BLRM and Riviere designs show the highest mean value, supporting the collective evidence that these are the most accurate designs in selecting the MTC.
Figure 5 illustrates the proportion of overly toxic selections for each design. Scenarios 1 and 15 have no overly toxic combinations, so the proportion is zero for these cases. Model-free designs showed lower proportions of overly toxic selection than model-based designs in many scenarios. We observe that the POCRM recommends the most overly toxic combinations on average by far, in 36.8% of trials. It stands out in multiple scenarios with a very high percentage of simulated trials recommending overly toxic doses. In 10 scenarios this is over 30%, highlighting how aggressive this approach is.
Of the model-free designs, the SFD has the highest percentage, in 20.4% of trials. In scenarios 5, 9 and 12, it recommends overly toxic combinations in over 25% of the simulated trials and in 9 of the scenarios, it is the model-free design with the highest proportion of overly toxic recommendations. This is evidence of the trade-off between selecting combinations close to
The PIPE design demonstrates a very low proportion of overly toxic selections with a mean of 9.2% across the 13 scenarios, 6.2% below any of the other designs. It has the lowest in all but four scenarios. This is a further illustration of the feature of the design to recommend combinations near but lower than the estimated MTC contour.
A focus on Scenario 14, where all dose combinations are overly toxic, shows the BLRM is the most efficient at stopping for safety, with 93.7% of simulations not recommending any dose combination. Noticeably, the Waterfall design is the least efficient at stopping for safety in this scenario.
Number of patients treated at overly toxic combinations
Figure 6 outlines the mean number of patients treated at overly toxic combinations in Scenarios 1–15 for each design. Note that we report the number rather than proportion of patients, as this will also give insight into how effectively each design stops for safety.
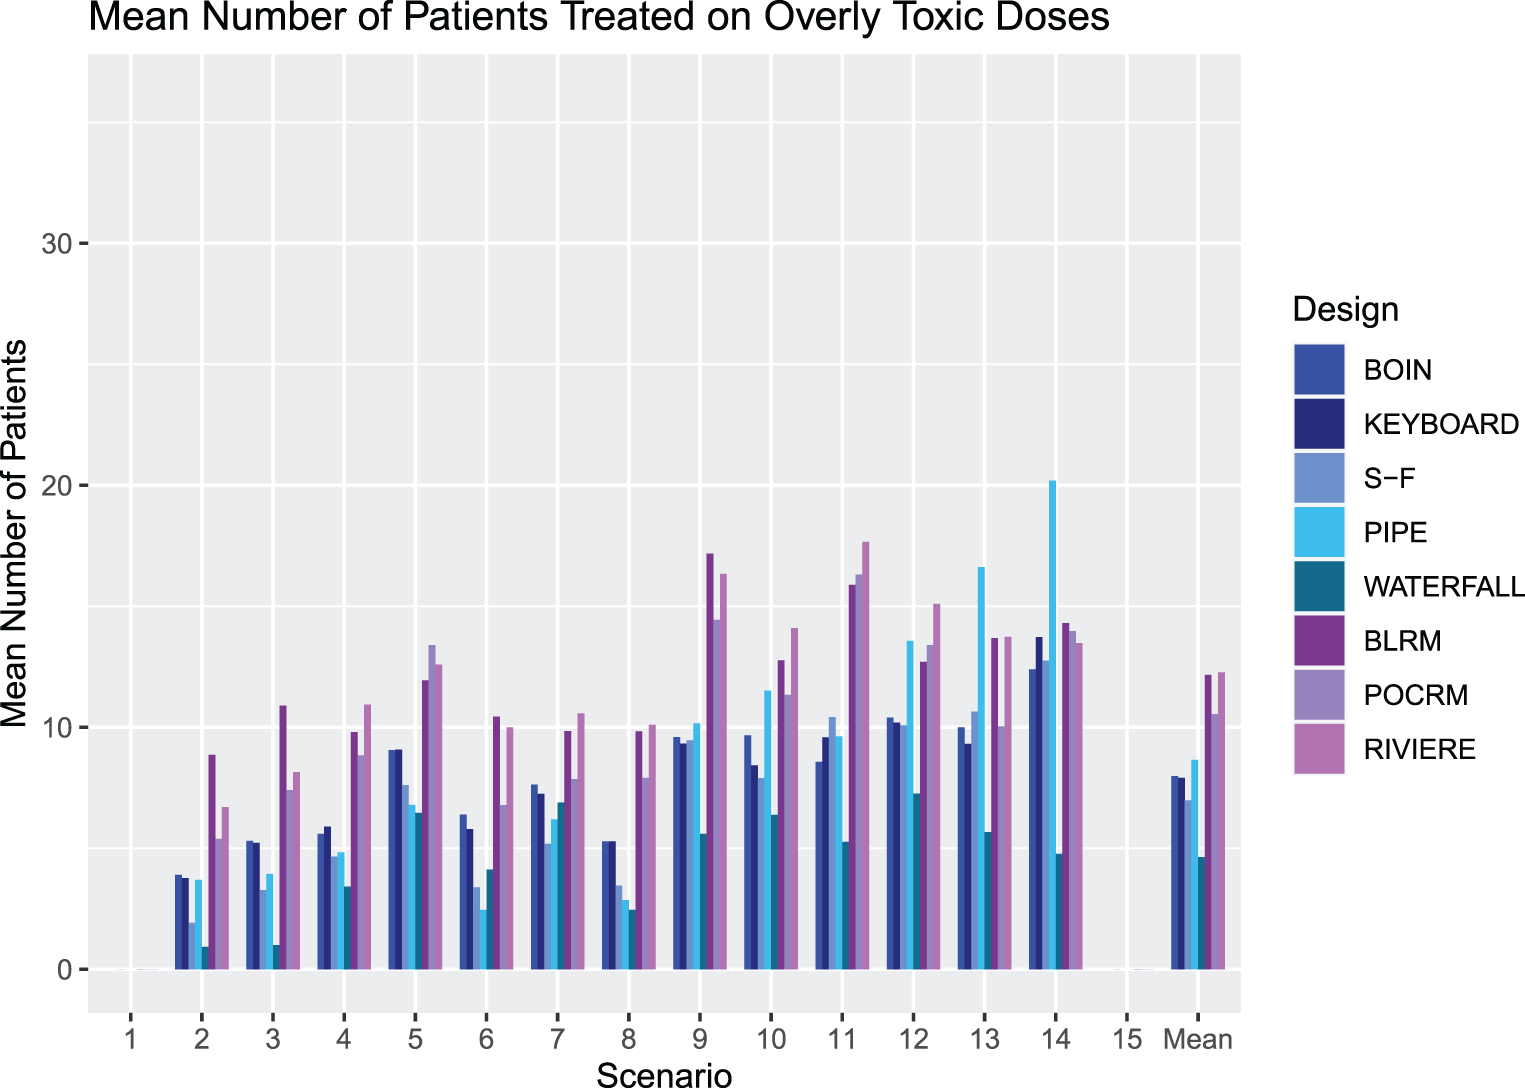
An illustration of the number of patients treated at overly toxic combinations during trials in Scenarios 1–15 for each design. The rightmost group of bars show the means.
The most notable feature of these results is the large number of patients treated at overly toxic combinations by the model-based designs. This aggressive escalation is driven by the informative prior, calibrated to give high values of PCS. We refer the reader to the online supplemental materials where an alternative BLRM prior leading to more conservative escalation (but considerably lower PCS and PAS) is explored.
The SFD, KEY and BOIN have reasonable performance, with the Waterfall design showing a strong performance with the lowest overall mean number of patients treated on overly toxic doses of five patients.
Careful attention must again be paid to Scenario 14, where all dose combinations are overly toxic. The PIPE design treats an average of 20 patients per trial, over six cohorts, which is an unacceptable level of exploration in such a scenario. In this scenario, we also consider that although the BLRM showed good performance in stopping early for safety in the highest number of simulated trials, it also has a high number of patients treated on average before stopping. The Waterfall design has the fewest patients treated by far, with an average of five patients, but this leads to the erroneous recommendation of a dose in a large proportion of simulated trials.
We see that overall the model-free approaches are more conservative in their escalation than the model-based designs, with fewer patients treated on unsafe doses, with no noticeable increase in PCS. Of the model-free approaches, the SFD shows the most promising PCS over the different scenarios, at the cost of somewhat higher overly toxic selections. It is also worth noting that the SFD has a substantially higher computational cost than the other model-free designs.
All of the simulations so far have concerned a dosing grid whereby there are three levels of each drug. However, it may alternatively be the case where there are differing numbers of dose levels for the two drugs. The most common being two levels of one drug and three or four of the other. Therefore in this section, we consider two alternative dosing grid sizes:
Setting
Six additional scenarios are considered for the alternative dosing grids, outlined in Table 3. Scenarios 16-18 have a
Alternative dosing grid toxicity scenarios to evaluate the combination designs. Rows and columns refer to the dose of drugs A and B, respectively. True MTCs are in bold and ‘acceptable’ combinations are underlined.
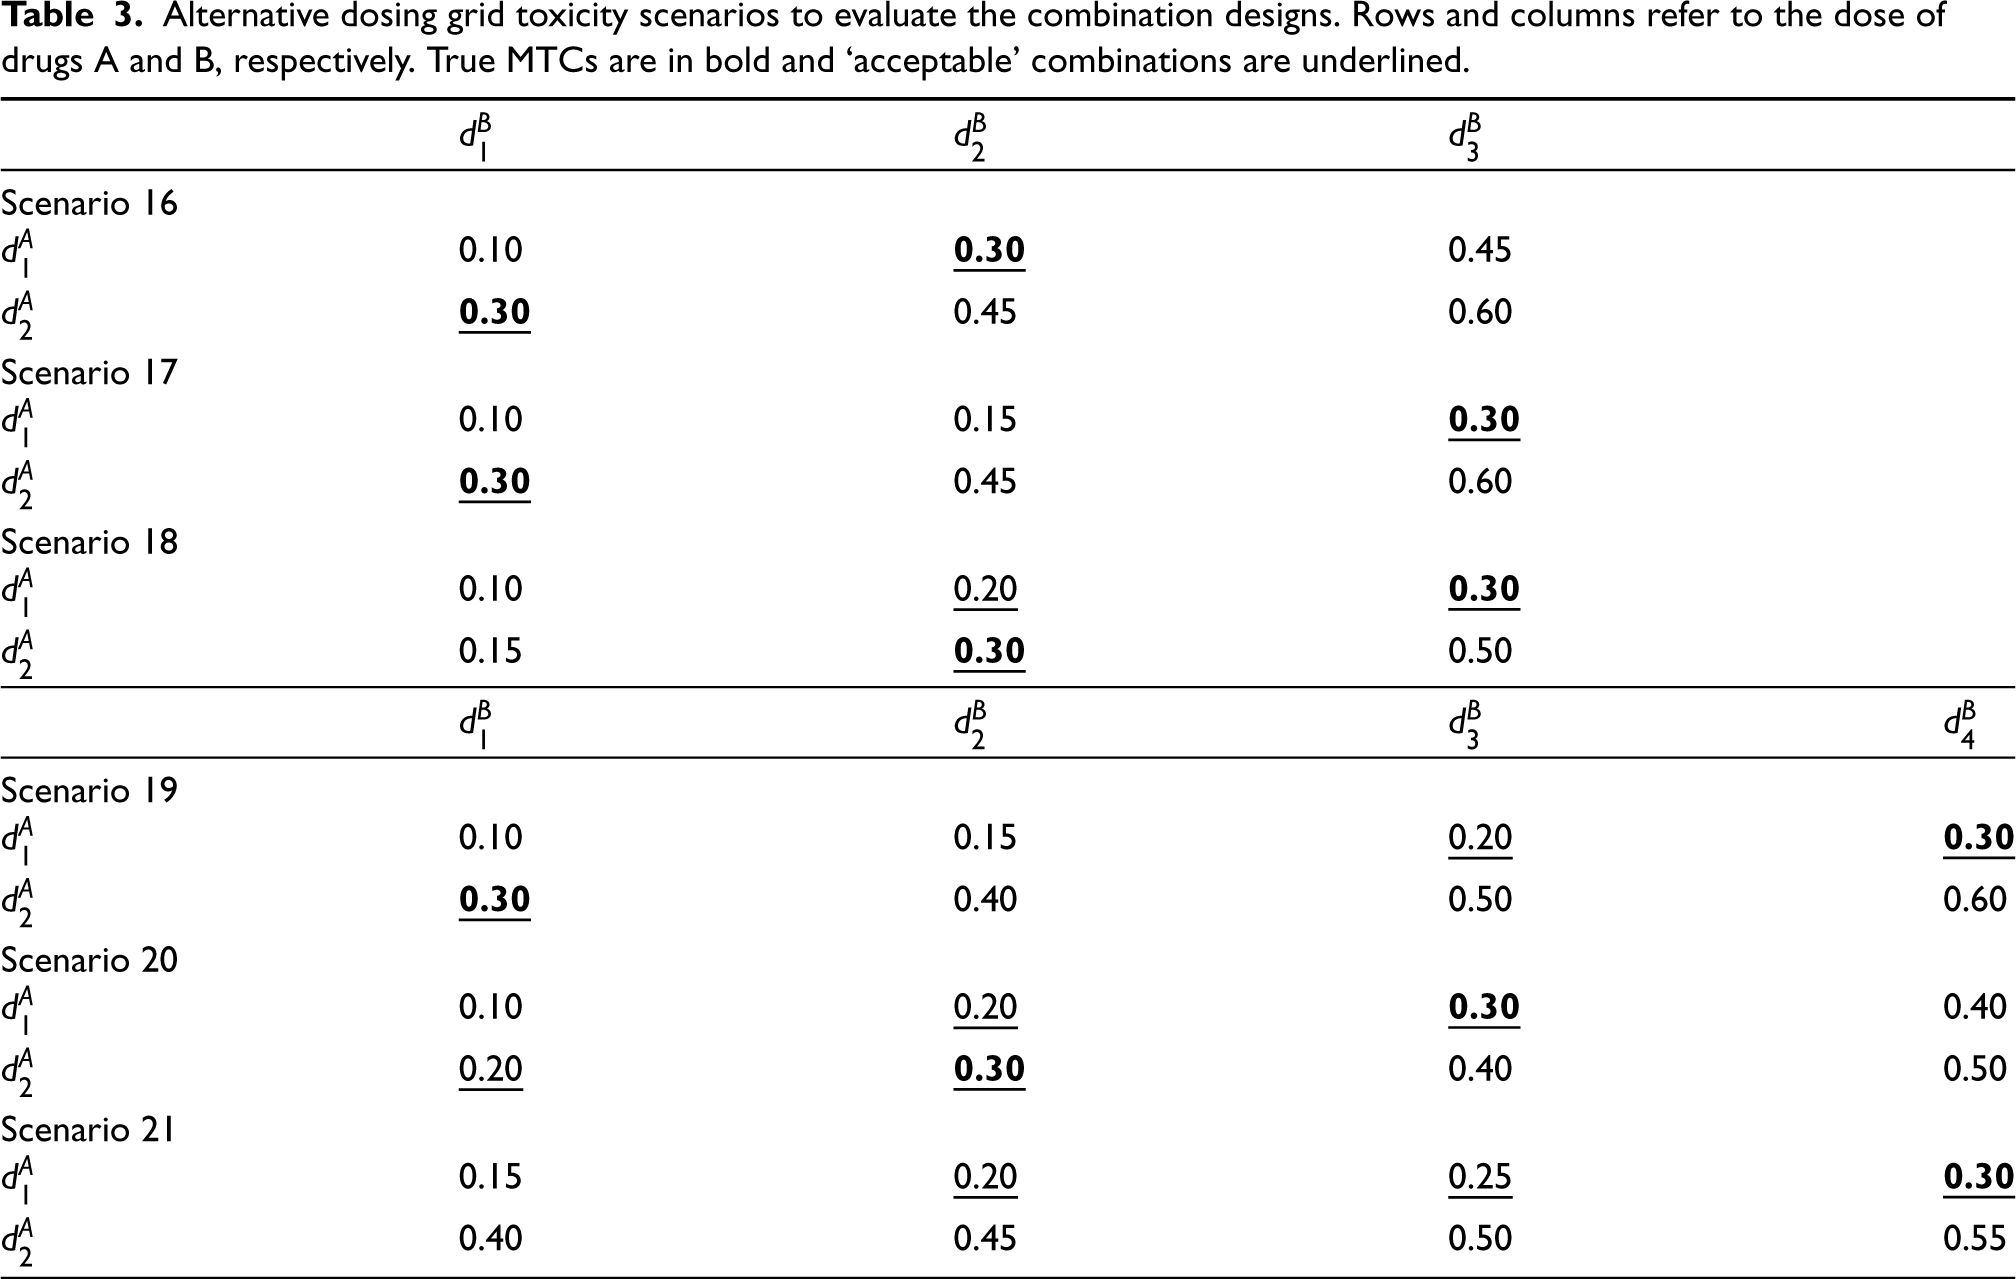
Alternative dosing grid toxicity scenarios to evaluate the combination designs. Rows and columns refer to the dose of drugs A and B, respectively. True MTCs are in bold and ‘acceptable’ combinations are underlined.
The priors and intervals used in each design are equivalent to those used for the
We again compare the designs’ operating characteristics in terms of performance of selecting correct and acceptable dose combinations, and safety in terms of patients allocated to overly toxic doses and selection of overly toxic doses.
Table 4 gives the accuracy index for the designs across the six scenarios, calculated using equation 13. It shows a similar trend to the
Values of the accuracy index (13) for each of the designs across the alternative dosing grid scenarios.

Values of the accuracy index (13) for each of the designs across the alternative dosing grid scenarios.
BLRM: Bayesian logistic regression model; POCRM: partial ordering continual reassessment method; BOIN: Bayesian optimal interval; S-F: PIPE: product of independent beta probabilities design.
Figure 7 shows the percentage of correct and acceptable selections for the alternative dosing grid scenarios. In scenarios 16 and 17, the benchmark illustrates that these
Figures 8 and 9 show the percentage of overly toxic selections and the number of patients treated at overly toxic combinations for scenarios 16-21, respectively. There is a clear trend that the model-based designs have a higher percentage of overly toxic selections, with the PIPE design showing a very low percentage, substantially lower than all designs apart from in Scenario 21, where it has the same level as the Waterfall design. There is a similar trend in the mean number of patients treated on overly toxic doses, with the PIPE design showing the smallest average overall, and POCRM and Riviere showing the highest. Scenario 20 has many more patients treated on unsafe doses than Scenario 18 in all but the SFD, PIPE and BLRM designs. This indicates that for the other five designs, escalation to the fourth dose level of drug
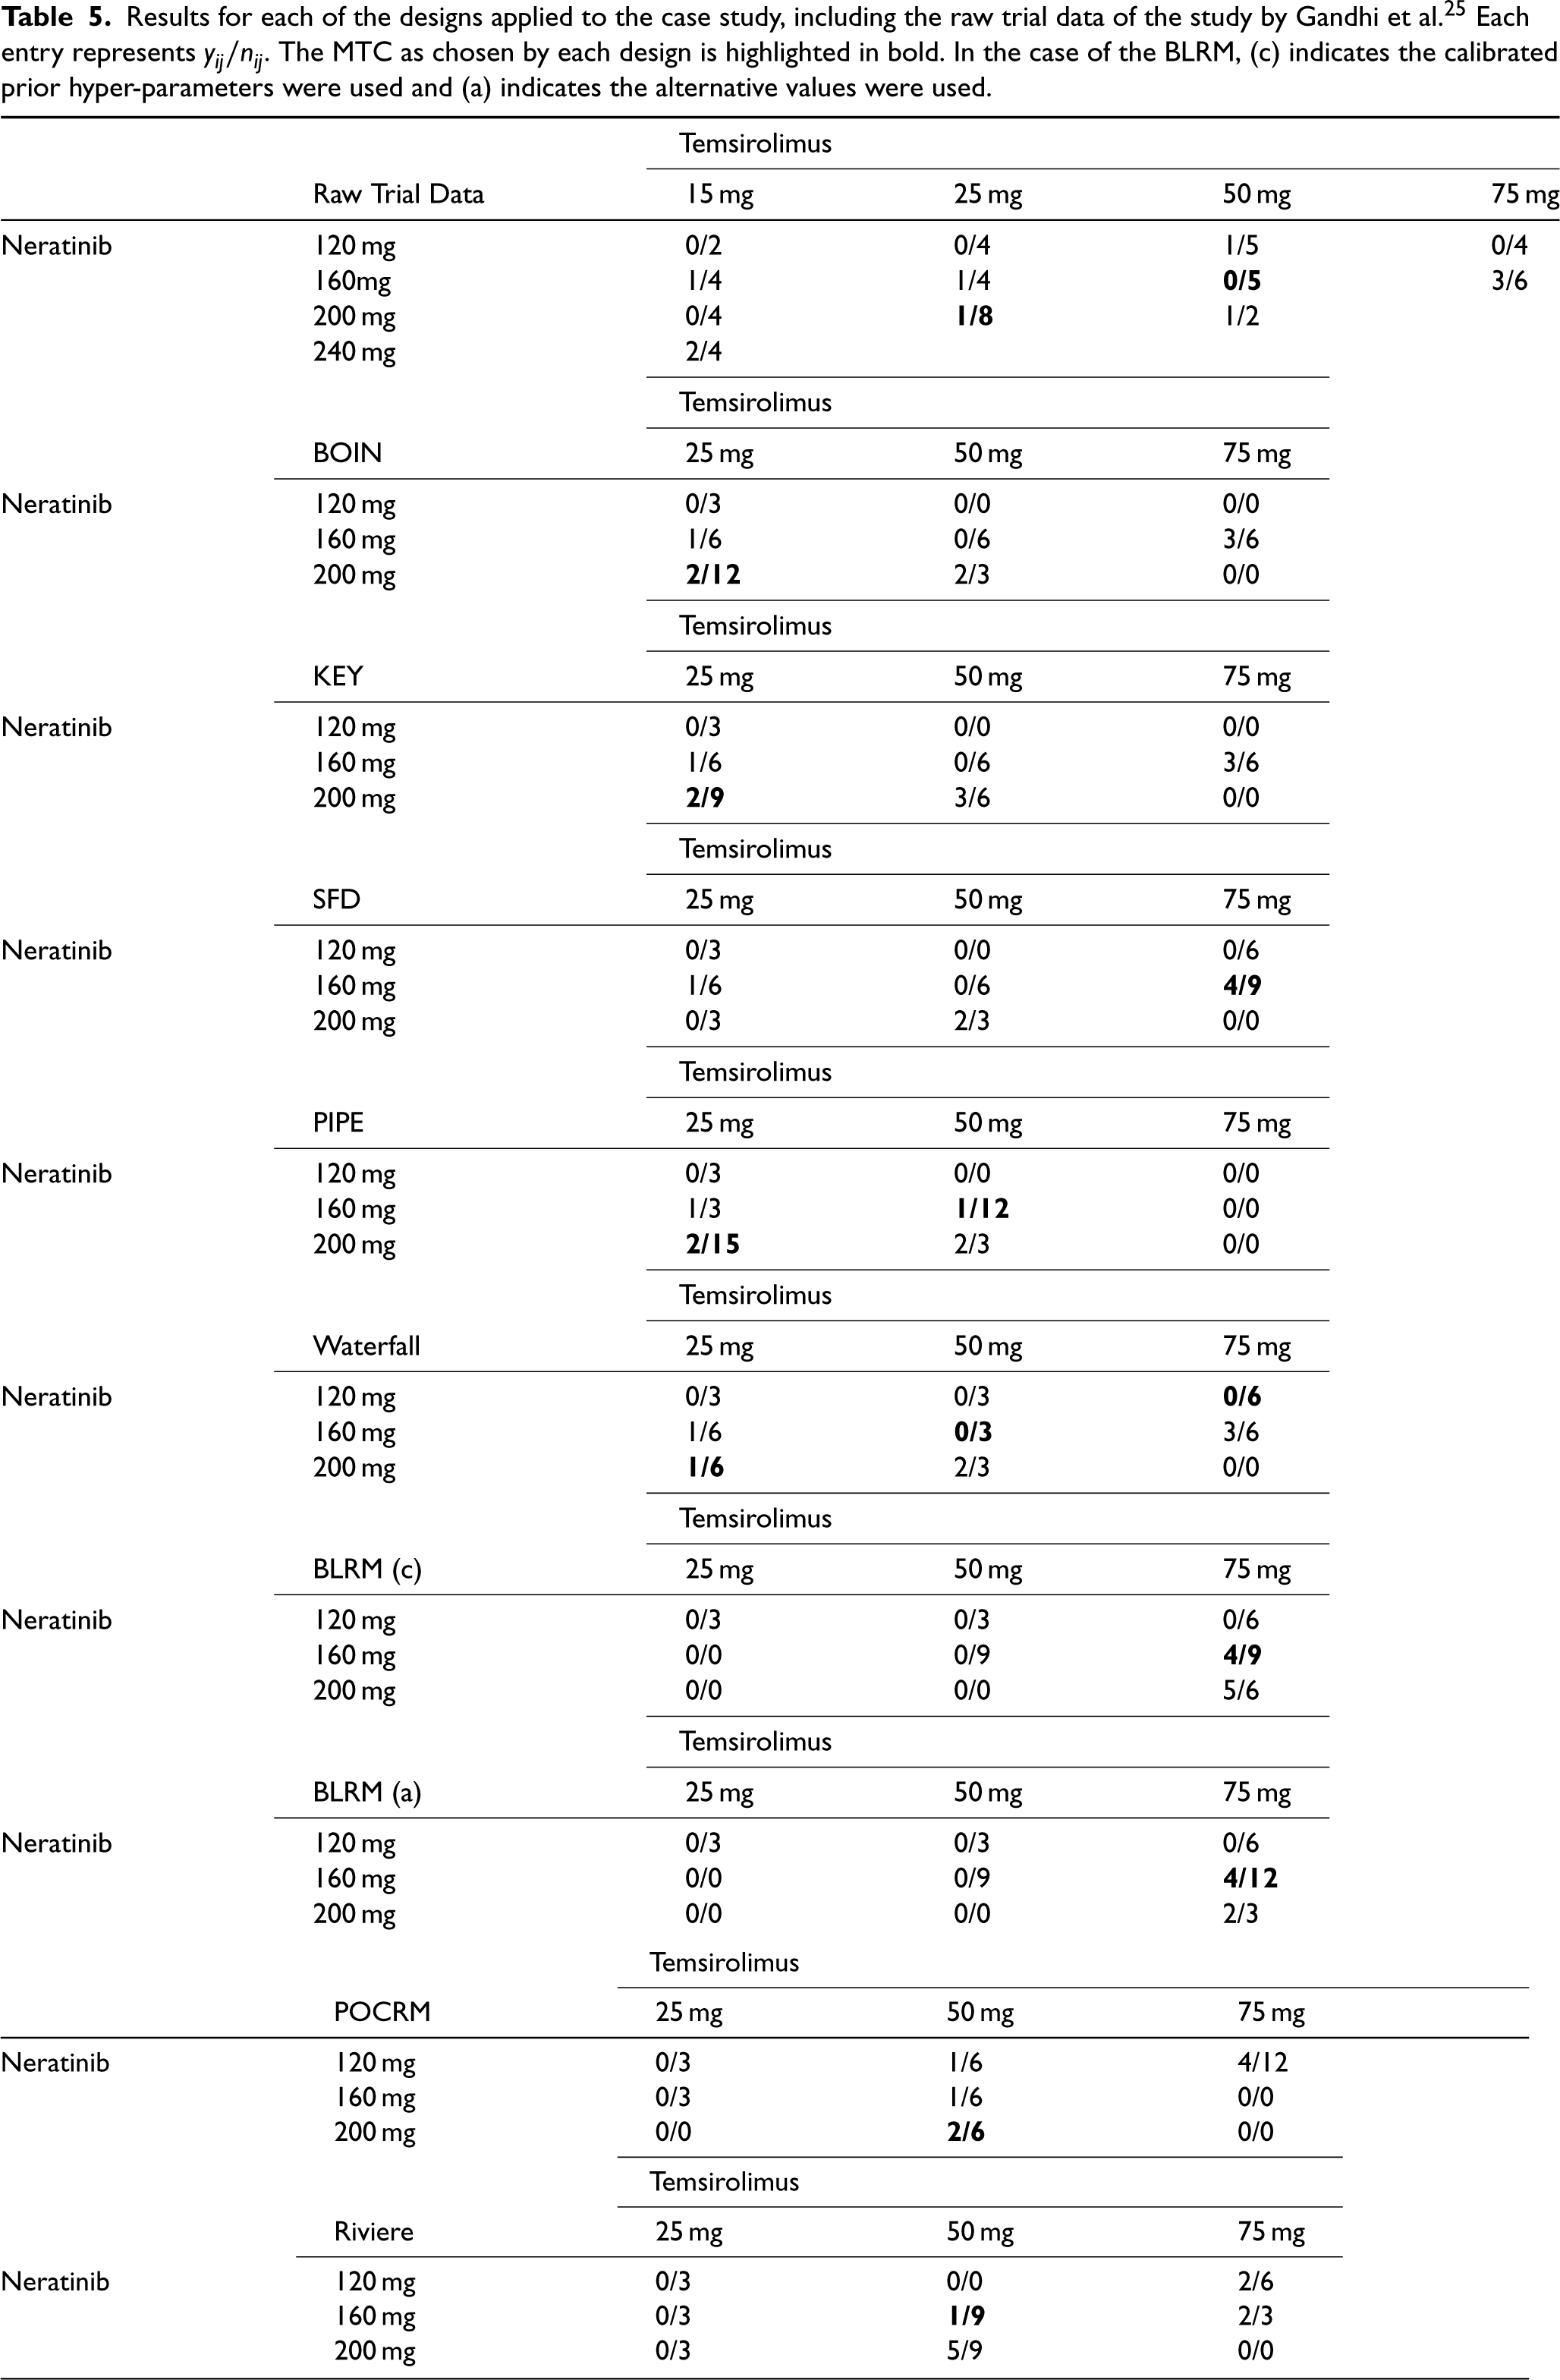
The simulation studies gave insight into the operating characteristics of each design, however for further insight into the escalation behaviour, we apply each method to an example case study. We consider a phase I oncology (breast and lung cancer) study enrolling patients to dosing combinations of four dose levels of neratinib and temsirolimus. 25 A total sample size of 60 patients (cohorts of size 2 or 3) were treated on 12 of 16 possible dosing combinations. Results from 52 patients were included and 10 DLTs were observed, with full results of the trial displayed in Table 5.
Results for each of the designs applied to the case study, including the raw trial data of the study by Gandhi et al.
25
Each entry represents
. The MTC as chosen by each design is highlighted in bold. In the case of the BLRM, (c) indicates the calibrated prior hyper-parameters were used and (a) indicates the alternative values were used.
Results for each of the designs applied to the case study, including the raw trial data of the study by Gandhi et al.
25
Each entry represents
In order to strengthen the case that our conclusions are generalisable with less risk of selective reporting, the purpose of this case study is not to investigate whether each design chooses the same MTC as the real study did. The purpose is to give an illustration of how each design explores the dosing grid, given identical patient responses.
In order to use the calibrated prior specifications, and in line with the simulation study, we restrict the dosing grid to three doses of each drug, removing the lowest dose of temsirolimus and the highest dose of neratinib. We also fix the cohort size to three patients and maximum total sample size to 36.
To ensure a fair comparison between designs, we define a fixed set of 36 ordered patient responses for each dose combination. The first patient responses in this set are the true
Table 5 displays the results of each of the methods, with the number of patients treated at each combination, the number of DLTs observed, and the concluded MTC highlighted in bold.
The BOIN and KEY designs show very similar exploration, first escalating in neratinib, then temsirolimus. The highest combination is not explored, as the combinations with the next lowest dose of each drug were considered unsafe. The only difference is that the KEY assigns one more cohort to the 200 mg/50 mg combination, even when the previous cohort had 2/3 observed DLT responses.
The PIPE design explores differently, not escalating to the highest dose of temsirolimus at all, even though only 1/12 DLT responses were observed on the 160 mg/50 mg combination. The SFD explores more of the highest dose of temsirolimus, although still not the highest combination. An interesting observation here is that the final recommended dose has observed 4/9 DLT responses, a level that would generally be an unsafe standard. This is in line with the simulation results that showed this design to have the highest level of overly toxic selections. The Waterfall design explores the entire dosing grid apart from the highest dose combination 200 mg/75 mg, a more even spread of patients across the grid than the other model-free designs.
The BLRM is executed with two prior distributions, the calibrated prior and the alternative, more realistic based on safety concerns, prior. Surprisingly, both show a more aggressive escalation than the model-free designs, with patients allocated to the highest combination. The calibrated prior gives the most aggressive approach with a second cohort assigned to a dose, even when the first observed 2/3 DLT responses. This also means that for this prior, the dosing grid is not as well explored as some of the model-free designs, as the lowest dose of temsirolimus is only explored in combination with the lowest dose of neratinib. For the calibrated prior, these results are in line with the simulation study, where the BLRM had on average the most patients treated on overly toxic doses and also a high proportion of overly toxic recommendations. However, even the alternative prior shows more aggressive escalation than the model-free designs in this case study. Both the POCRM and the Riviere design had a balanced exploration of the dose grid.
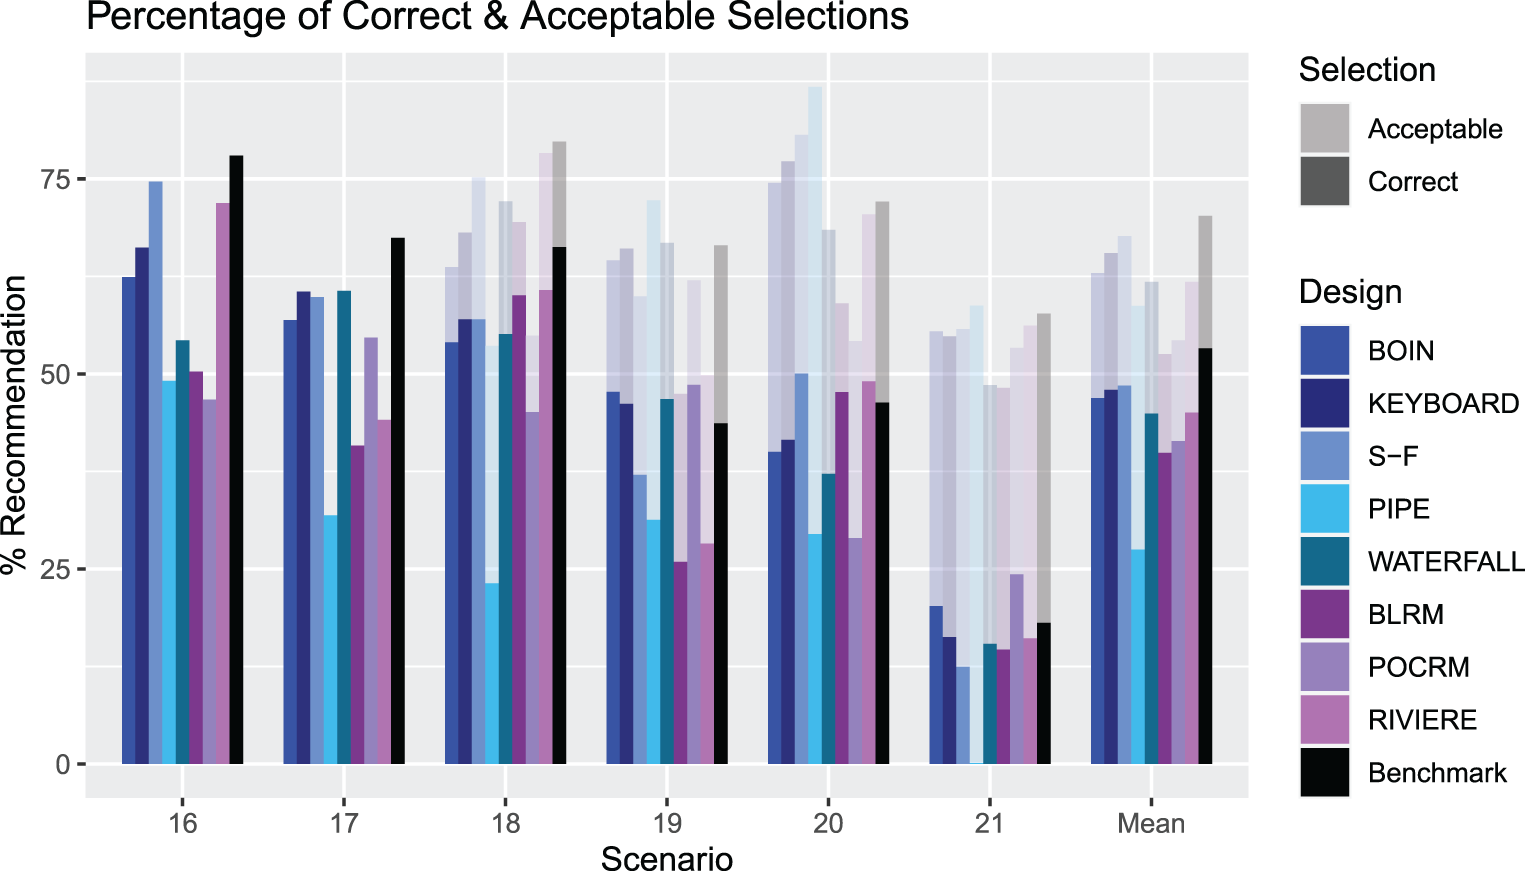
An illustration of the PCS and PAS for Scenarios 16–21 for each design. The solid bars measure the PCS and the more transparent bars measure the PAS. The rightmost group of bars show the means.
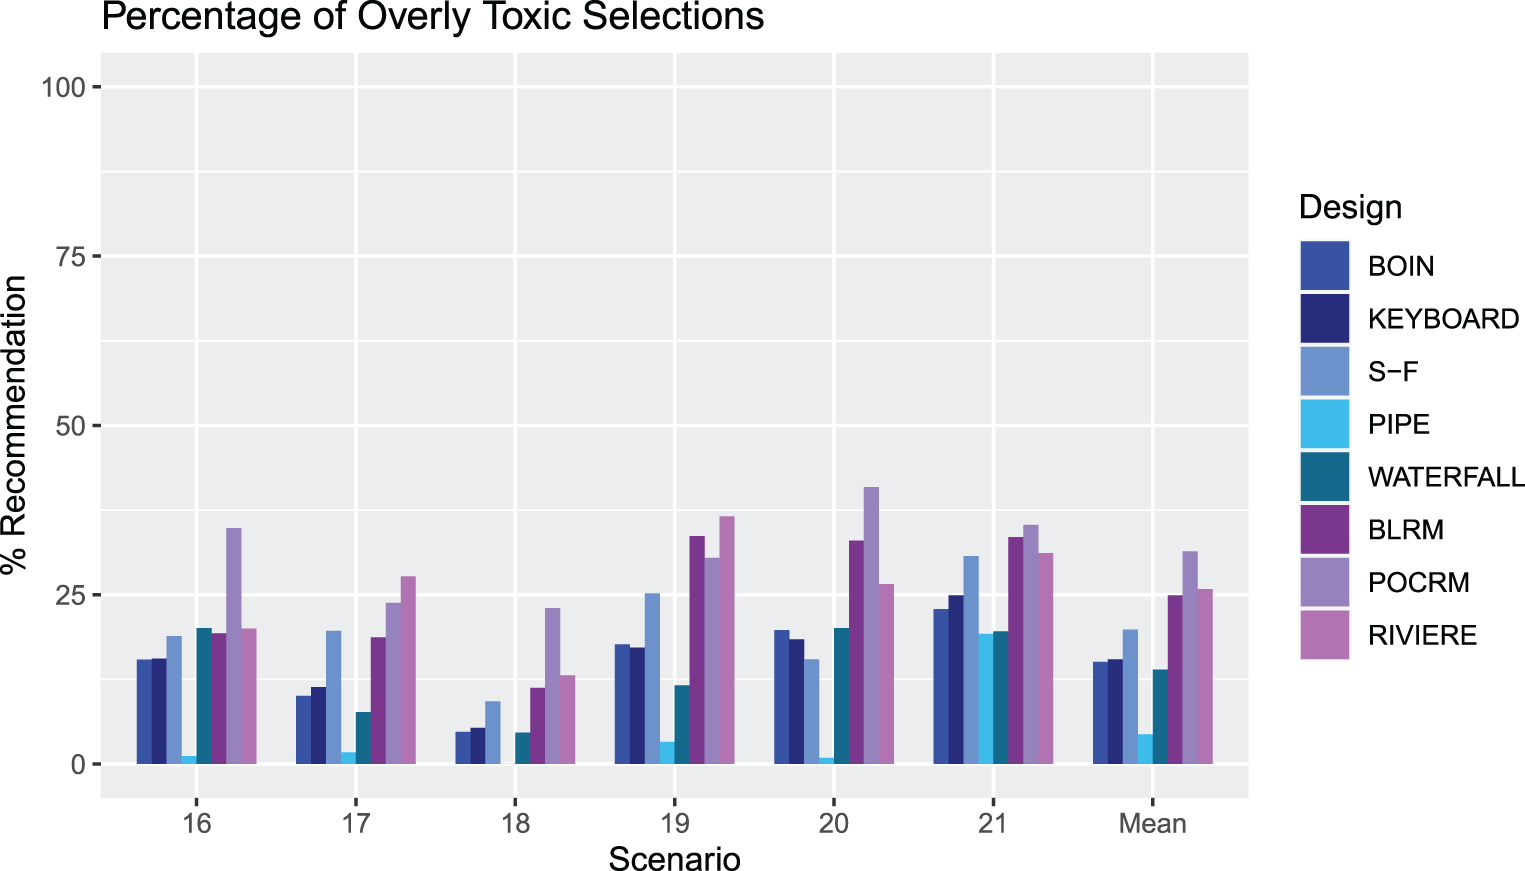
An illustration of the percentage of overly toxic selections across Scenarios 16–21 for each design. The rightmost group of bars show the means.
The case study highlights some key differences in the approaches, illustrating how both the escalation schemes and final recommendation differ. Particularly of note is the somewhat aggressive behaviour of not de-escalating when observing 2/3 observed DLT responses, and recommending a final dose combination with 4/9 observed DLT responses from both the SFD and calibrated prior BLRM. This behaviour, which could be considered unsafe, is not necessarily obvious from simulation results and underlines the importance of studying the individual escalations in an example case study. It is also important to consider that in practice, such a statistical approach is a guidance for dose recommendation that should be supported by an overall evaluation of the safety, pharmacokinetics and clinical rationale.
This paper provides a review of a wide range of combination designs in phase I oncology, exploring the more recently proposed model-free designs in detail, as well as providing a novel approach for the calibration of such designs. The comprehensive simulation study we conduct suggests that model-free designs are competitive with the model-based designs in terms of the proportion of correct combinations selected. The operating characteristics of model-free designs in a number of scenarios suggest they offer a safer alternative. The case study example highlighted the key differences in how the methods explore the dosing grid given the same patient responses, with more aggressive approaches missing the lower doses, and conservative approaches missing the higher ones.
The discussed results depend upon the specification of the intervals for the BOIN, KEY and Waterfall designs, and the operational priors for the PIPE, SFD, POCRM, Riviere and BLRM designs, which were calibrated using a novel approach. This included calibrating the overdosing rules in each design to reduce the risk of recommending overly toxic combinations for phase II. Naturally, our work does not allow for comparison between designs when complete and reliable prior information on the toxicity of each drug is available. In practice, the PIPE, SFD, POCRM, Riviere and BLRM designs can exploit this prior knowledge to help the escalation process.
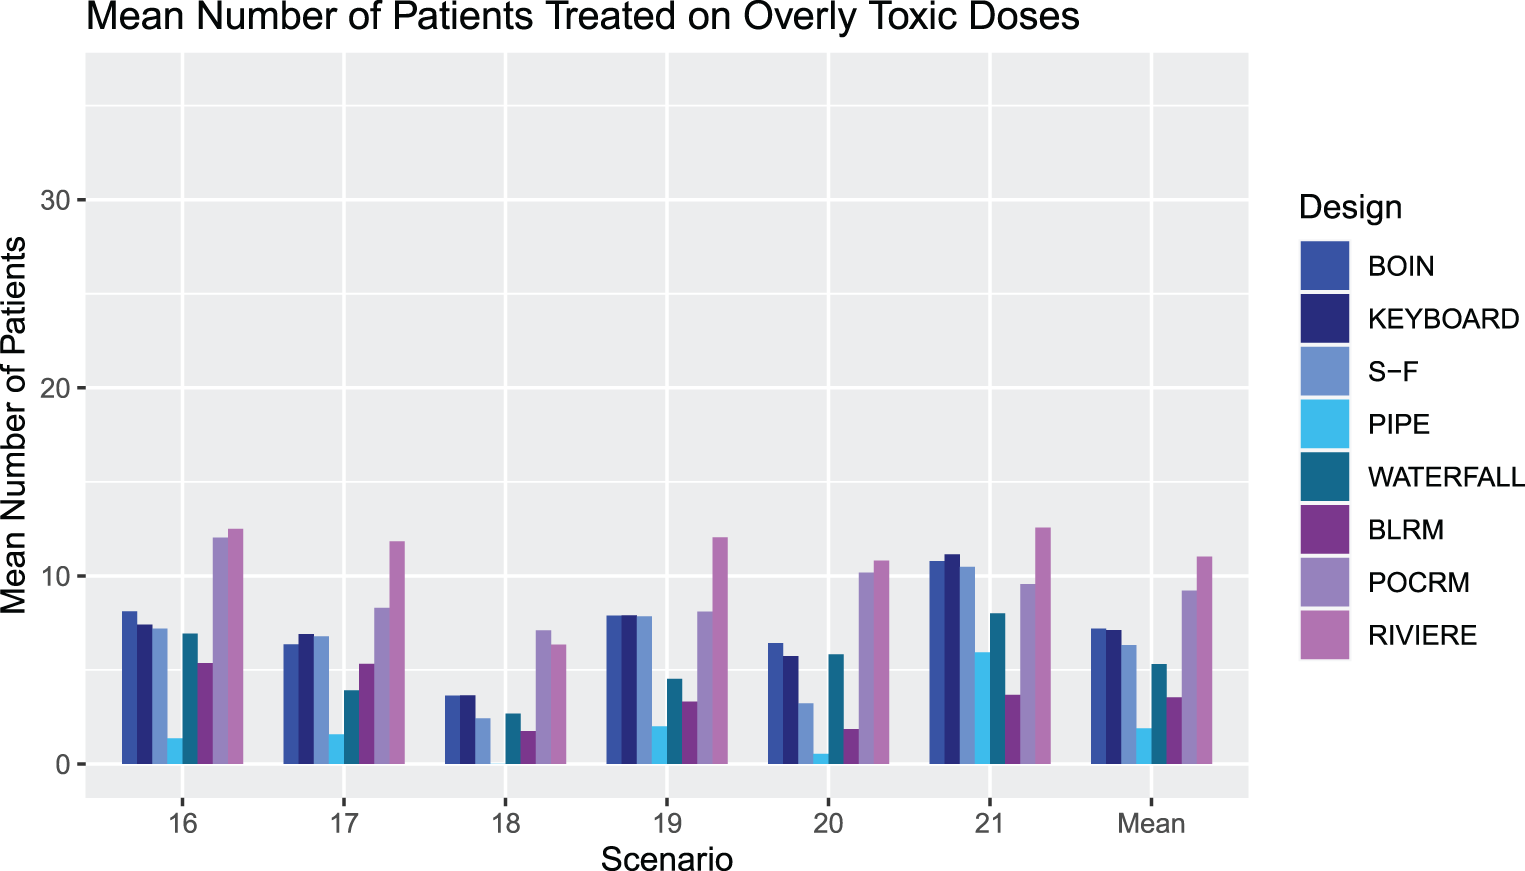
An illustration of the number of patients treated at overly toxic combinations during trials in Scenarios 16-21 for each design. The rightmost group of bars show the means.
The calibration procedure, although novel in approach, is relatively straightforward to implement. It does however highlight the computational intensity of the different methods. Both the BLRM and SFD are very computationally intensive, with the calibration procedure taking substantially longer than for any of the other designs. It has shown great promise in specifying prior distributions that yield high PCS values, removing the subjectivity from the specification.
Moreover, our simulations do not allow for the early selection of an MTC. For example, if at least 9 patients are treated at a combination and the next cohort is recommended to be treated at this combination, then a trial could be stopped and this combination selected as the MTC. We acknowledge this rule is useful to reduce sample sizes, especially in scenarios where the true MTC is a low-dose combination. One of the advantages of model-based approaches is that they allow for selection of unplanned intermediate doses. This is an advantage that was not used in the simulation study, but must be considered in practice.
An additional area of interest for such dose-finding studies is the sample size and cohort size. Conducting a sensitivity analysis on both of these for each design would be an excellent opportunity to investigate whether designs can still achieve high PCS with fewer patients, or significantly higher PCS with extra patients, and whether a larger or smaller cohort size would lead to better exploration of the dosing grid.
Finally, we conclude this comparison with an overview of recommendations for the use of each design in the context of this work. The BOIN and KEY designs give a balanced approach, with a good level of PCS and PAS across a range of scenarios. Overly toxic explorations and selections are also well-balanced across scenarios. The PIPE design is more cautious in its selection, with a consistently low proportion of overly toxic selections, although at the cost of also recommending correct combinations a lower proportion of the time. The Surface Free design offers a high PCS and PAS and a generally low number of patients treated at overly toxic selections, but this must be balanced with the high proportion of overly toxic selections. The Waterfall design is most cautious in its allocation of patients, with a similar level of overly toxic recommendations as KEY and BOIN. However, the overall PCS and PAS are somewhat lower than the other designs. The model-based designs provide the most aggressive approach with a calibrated prior, with a large number of patients treated on overly toxic doses, however a good level of PCS and PAS. For the BLRM, with an alternative, intuitive prior, the number of overly toxic explorations is reduced, but at the cost of the high PCS values.
Supplemental Material
sj-pdf-1-smm-10.1177_09622802231220497 - Supplemental material for A comparison of model-free phase I dose escalation designs for dual-agent combination therapies
Supplemental material, sj-pdf-1-smm-10.1177_09622802231220497 for A comparison of model-free phase I dose escalation designs for dual-agent combination therapies by Helen Barnett, Matthew George, Donia Skanji, Gaelle Saint-Hilary, Thomas Jaki and Pavel Mozgunov in Statistical Methods in Medical Research
Footnotes
Data Availability Statement
The data that supports the findings of this research are available in ![]() of this article, originally from Gandhi et al.,
25
with all other data simulated according to the specifications described.
of this article, originally from Gandhi et al.,
25
with all other data simulated according to the specifications described.
Declaration of conflicting interests
The authors declared no potential conflicts of interest with respect to the research, authorship, and/or publication of this article.
Funding
The authors disclosed receipt of the following financial support for the research, authorship, and/or publication of this article: This study was supported by the National Institute for Health Research (NIHR Advanced Fellowship, Dr Pavel Mozgunov, NIHR300576; and Prof Jaki’s Senior Research Fellowship, NIHR-SRF-2015-08-001) and by the NIHR Cambridge Biomedical Research Centre (BRC-1215-20014). The views expressed in this publication are those of the authors and not necessarily those of the NHS, the National Institute for Health Research or the Department of Health and Social Care (DHSC). T Jaki and P Mozgunov received funding from UK Medical Research Council (MC_UU_00002/14).
Supplemental material
Supplemental material for this article is available online.
References
Supplementary Material
Please find the following supplemental material available below.
For Open Access articles published under a Creative Commons License, all supplemental material carries the same license as the article it is associated with.
For non-Open Access articles published, all supplemental material carries a non-exclusive license, and permission requests for re-use of supplemental material or any part of supplemental material shall be sent directly to the copyright owner as specified in the copyright notice associated with the article.