
Abstract
Due to the limited sample size and large dose exploration space, obtaining a desirable dose combination is a challenging task in the early development of combination treatments for cancer patients. Most existing designs for optimizing the dose combination are model-based, requiring significant efforts to elicit parameters or prior distributions. Model-based designs also rely on intensive model calibration and may yield unstable performance in the case of model misspecification or sparse data. We propose to employ local, underparameterized models for dose exploration to reduce the hurdle of model calibration and enhance the design robustness. Building upon the framework of the partial ordering continual reassessment method, we develop local data-based continual reassessment method designs for identifying the maximum tolerated dose combination, using toxicity only, and the optimal biological dose combination, using both toxicity and efficacy, respectively. The local data-based continual reassessment method designs only model the local data from neighboring dose combinations. Therefore, they are flexible in estimating the local space and circumventing unstable characterization of the entire dose-exploration surface. Our simulation studies show that our approach has competitive performance compared to widely used methods for finding maximum tolerated dose combination, and it has advantages over existing model-based methods for optimizing optimal biological dose combination.
Keywords
Introduction
For treating cancer, the strategy of combination therapy provides an efficient way to increase patients’ responses by inducing drug–drug synergistic treatment effects, targeting multiple sensitive sites and disease-related pathways, and increasing dose intensity without overlapping toxicities. 1 Finding a desirable dose combination is critically important for the late-stage development of combination treatments. However, early-phase dose finding/optimization for multiple drugs faces several challenges, such as a large dose exploration space, unclear drug–drug interactions, partially unknown toxicity order among some dose combination pairs, and the small-scale nature of early-phase trials.
In the last decade, numerous designs have been proposed to explore the maximum tolerated dose combination (MTDC) for drug combinations. Most of these designs use parametric models to depict the dose–toxicity relationship and use a similar dose exploration strategy to the well-known, single agent-based continual reassessment method (CRM). 2 Thall et al. 3 proposed a two-stage design for identifying three pairs of MTDCs by fitting a six-parameter model. Yin and Yuan 4 employed a copula-type model to account for the synergistic effect between drugs. Braun and Wang 5 estimated the dose-limiting toxicity (DLT) rate for drug combinations using a Bayesian hierarchical model and explored the dose matrix using an adaptive Bayesian algorithm. Wages et al. 6 proposed the partial ordering continual reassessment method (POCRM), transforming the dose-combination matrix into one-dimension and determining the treatment of the next cohort based on the CRM and Bayesian model selection. Riviere et al. 7 proposed a Bayesian dose finding design for drug-combination trials based on the logistic regression. To circumvent a lack of robustness when using parametric models, several non-parametric or model-free designs have also been proposed. Lin and Yin 8 developed a two-dimensional Bayesian optimal interval (BOIN) design to identify MTDC. Mozgunov et al. 9 proposed a surface-free design for phase I dual-agent combination trials. Mander and Sweeting 10 employed a product of independent Beta probabilities escalation (PIPE) strategy to identify the MTDC contour. Clertant et al. 11 proposed to identify MTDC or the MTDC contour using a semiparametric method.
Due to the small-scale nature of early phase clinical trials, model-based designs attempt to strike a balance between the comprehensiveness of the dose–toxicity model and the robustness of inference. As a result, parsimonious models are generally proposed to capture the dose–toxicity relationship of the entire dose exploration space in an approximate sense. Despite using parsimonious models to enhance the robustness of inference, model-based designs tend to have unstable performance when the model assumption is misspecified or the observed data is sparse. 12 This issue becomes more profound for designs of drug-combination trials, where the dimension of the dose-exploration space is large. This difficulty is because more parameters are introduced to quantify the effects of drug–drug interactions. Due to the increased model complexity, prior elicitation or model calibration becomes another hurdle that may affect the operating characteristics.
The goal of dose-finding designs rarely is to estimate the entire dose–toxicity relationship. 13 Instead, the primary objective is to accurately estimate the local region of the target dose by concentrating as many patients on doses close to the target. To this end, CRM uses a simple, underparameterized model (such as the empiric model) to conduct dose finding. Although it may produce a biased estimate for doses far from the target dose, CRM design converges almost surely to MTD. 14 Following the main idea of CRM, we propose to use local models to stabilize the dose finding procedure. Specifically, we implement POCRM locally in the adjacent region of the current dose, leading to the local data-based CRM (LOCRM). POCRM aims to characterize the entire dose-toxicity surface by specifying a limited number (typically six to eight) of orderings for the dose exploration space. In contrast, LOCRM evaluates up to five neighboring dose combinations, allowing for the use of all possible toxicity orderings within a local region, bypassing the need for preselection in POCRM. Simulation studies demonstrate that LOCRM design is effective in determining the MTDC and compares favorably with other model-based or model-assisted designs.
As a step further, we extended the LOCRM approach to optimize the dose combination based on the toxicity and efficacy simultaneously. In the modern era of precision oncology, the conventional “more-is-better” paradigm that works for chemotherapies is no longer suitable for targeted therapy and immunotherapy.15,16 Project Optimus, a recent U.S. FDA initiative, also highlights the need for innovative designs that can handle scenarios where “less-is-more.” By considering both toxicity and efficacy at the same time for decision making, finding an optimal biological dose combination (OBDC) that maximizes the risk–benefit tradeoff in a multi-dimensional dose exploration space becomes even more challenging. In addition to the challenges in finding MTDC, other major obstacles for OBDC finding include the lack of flexible and robust models to account for possible plateau dose–efficacy relationships and the difficulty in effectively assigning patients in the dose-exploration space.
Trial designs for single-agent dose optimization are abundant; see references.17–23 However, because of the aforementioned challenges, research on dose optimization methods in dose-combination trials is rather limited. Mandrekar et al. 24 developed a continual ratio model for dose optimization in drug-combination trials. Yuan and Yin 25 constructed a Bayesian copula-type model for toxicity and a Bayesian hierarchical model for efficacy. Cai et al. 26 developed a change point model to identify the possible toxicity plateau on higher dose combinations and employed a five-parameter logistic regression for efficacy estimation. Wages and Conaway 27 proposed a Bayesian adaptive design with the assumption of monotone dose–toxicity and dose–efficacy relationships within single agents. Guo and Li 28 proposed dose finding designs based on the partial stochastic ordering assumptions. The two-stage design proposed by Shimamura et al. 29 includes a zone-finding stage to evaluate toxicity on prespecified partitions and a dose-finding stage to explore the efficacy of the dose space. Yada and Hamada 30 extended the method of Yuan and Yin 25 using a Bayesian hierarchical model to share information between doses. As shown in the simulation results, many existing drug-combination dose-optimization designs may suffer from robustness problems due to the use of parametric models to quantify the entire dose-exploration space. To address this, this article introduces a LOCRM12 design based on the proposed LOCRM approach for OBDC identification. We utilize LOCRM as the toxicity model and employ the robit regression model 31 locally for efficacy. The combination of constructing local models for interim decision-making and using the robit regression makes the trial design more robust and easier to execute in practice.
The remaining of this article is organized as follows: In Section 2, we introduce the local method for modeling toxicity and propose the LOCRM design for MTDC identification. In Section 3, we describe the local efficacy model and introduce the trial design for OBDC identification. In Sections 4 and 5, we conduct extensive simulation studies to evaluate the operating characteristics of the LOCRM and LOCRM12. Section 6 provides a brief discussion.
Dose finding based on toxicity only
Partial toxicity orderings
Assume that an early-phase drug-combination trial is being conducted to determine MTDC for a combination therapy with
Ordering Ordering Ordering Ordering
Under a specific ordering
As special cases, if the current dose combination is at the edge of the dose-exploration space, that is,
When
Let
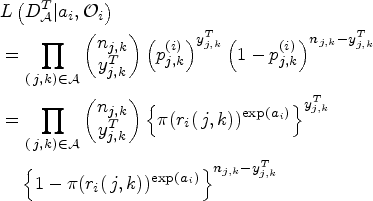
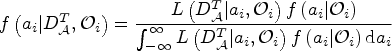
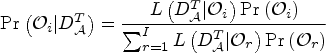
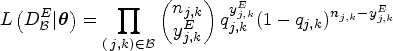
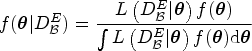
The Bayesian model averaging procedure is conducted to average the posterior estimates of multiple models. Denote the prior probability of each model (ordering) being true as
Trial design
Suppose the current dose combination is

During the trial, we add a safety monitoring rule for overdose control. Given a prespecified probability cutoff

If this overdose control rule is never activated, the trial will continue to recruit and treat patients until the maximum sample size is exhausted. The use of the local data as well as local models can stabilize the dose exploration in the drug-combination space, especially when the amount of observed information is limited and the trial has a large dose exploration space. At the end of the trial, we conduct the bivariate isotonic regression
34
for the matrix of the observed toxicity rates (function biviso() in R package Iso). By doing so, the observed information can be shared across all explored dose combinations, leading to a non-decreasing matrix of the estimated toxicity rates and thus an efficient estimate of the final MTDC. After exclusion of untried dose combinations, the dose combination whose isotonic estimated toxicity rate is closest to
Based on the LOCRM design proposed in Section 2, we further develop a dose optimization design (i.e. a phase I/II design) for dose-combination trials where the dose escalation/de-escalation decisions are made based on the toxicity and efficacy jointly. This trial design employs LOCRM as the toxicity model and an efficacy model utilizing the same local modeling idea (see the following Section 3.1). We name this dose-optimization design LOCRM12.
Efficacy model
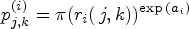
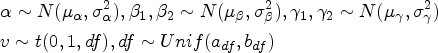
If we construct the efficacy model similar to the toxicity model, we need to enumerate all possible efficacy orderings of candidate doses. However, the partial ordering assumption does not necessarily hold for efficacy. The efficacy surface is much more complicated when taking various dose–efficacy relationships into account. Consider the case when the current combination,
Formally, let

Let

The proposed designs can be extended straightforwardly to explore combinations of more than two drugs. Suppose we aim to treat patients with
We employ the same safety control rule as the LOCRM design (Section 2.3). However, to optimize the toxicity–efficacy trade-off and accommodate the situation where a relatively toxic dose may yield much higher efficacy, we recommend a relatively loose cutoff
In the second stage (main stage) of LOCRM12, we use the proposed toxicity and efficacy models to inform escalation/de-escalation decisions. Generally, we treat the next cohort of patients at the locally most efficacious and safe dose combination. Proper safety control and balanced patient assignment between doses are also to be considered. Specifically, we follow a two-step rule to decide the locally optimal dose combination for the next cohort of patients. In the first step, we identify a set of safe dose combinations based on the estimated local MTDC

In addition to the safety stopping rule used in the LOCRM, we also continuously monitor the efficacy of the considered dose combinations. If the posterior efficacy probability satisfies

At the end of the trial, we determine OBDC by finding the most efficacious dose combination among a safe dose set, which is the collection of dose combinations that have the isotonically estimated toxicity probability no greater than that of the selected MTDC. For dose optimization trials that focus on balancing the risk–benefit tradeoff, we recommend using a larger value for
To evaluate the operating characteristics of the proposed LOCRM design, we choose a model-based design (POCRM
6
) and a model-assisted design (BOIN
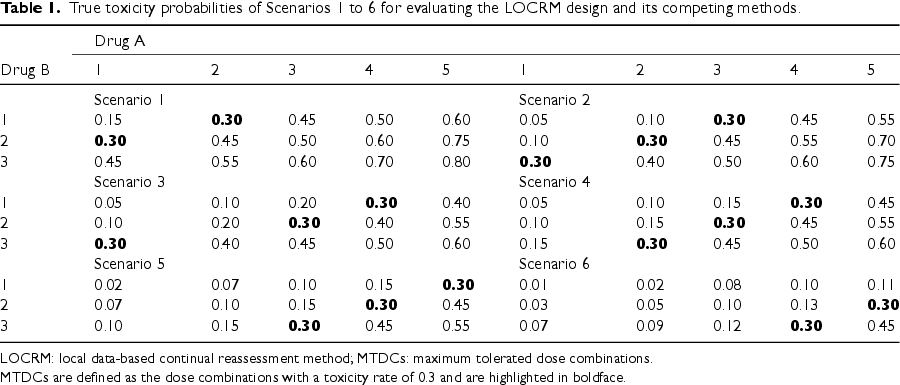
True toxicity probabilities of Scenarios 1 to 6 for evaluating the LOCRM design and its competing methods.
True toxicity probabilities of Scenarios 1 to 6 for evaluating the LOCRM design and its competing methods.
LOCRM: local data-based continual reassessment method; MTDCs: maximum tolerated dose combinations.
MTDCs are defined as the dose combinations with a toxicity rate of 0.3 and are highlighted in boldface.
For the LOCRM design, we generate skeletons by using the algorithm proposed by Lee and Cheung
33
(function getprior() in R package dfcrm). To implement the getprior() function, one needs to prespecify the target rate (
The performance of LOCRM and other methods is assessed based on four metrics: (a) percentage of trials that ultimately choose one of the true MTDCs; (b) number of patients assigned to any of the true MTDCs; (c) percentage of trials that end up selecting a dose combination with a toxicity rate greater than
Simulation results of the LOCRM, POCRM, and BOIN
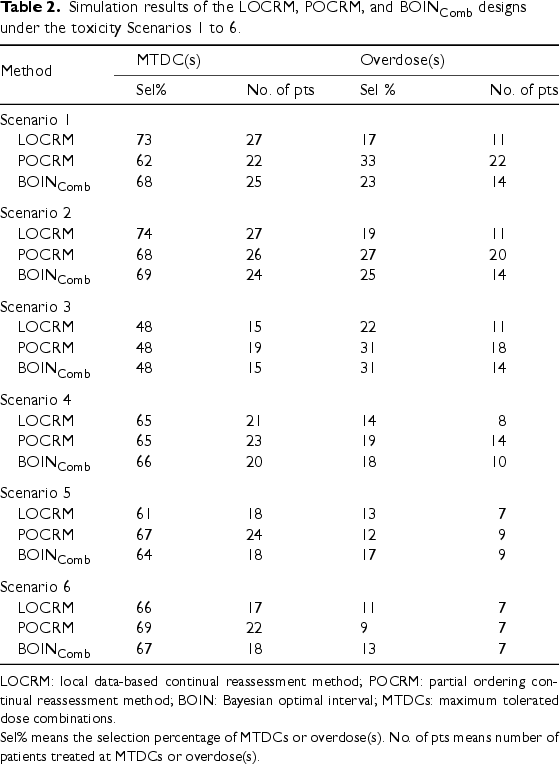
LOCRM: local data-based continual reassessment method; POCRM: partial ordering continual reassessment method; BOIN: Bayesian optimal interval; MTDCs: maximum tolerated dose combinations.
Sel% means the selection percentage of MTDCs or overdose(s). No. of pts means number of patients treated at MTDCs or overdose(s).
True toxicity and efficacy probabilities of Scenarios 7 to 16 for evaluating the performance of the LOCRM12, Cai, and YY designs.
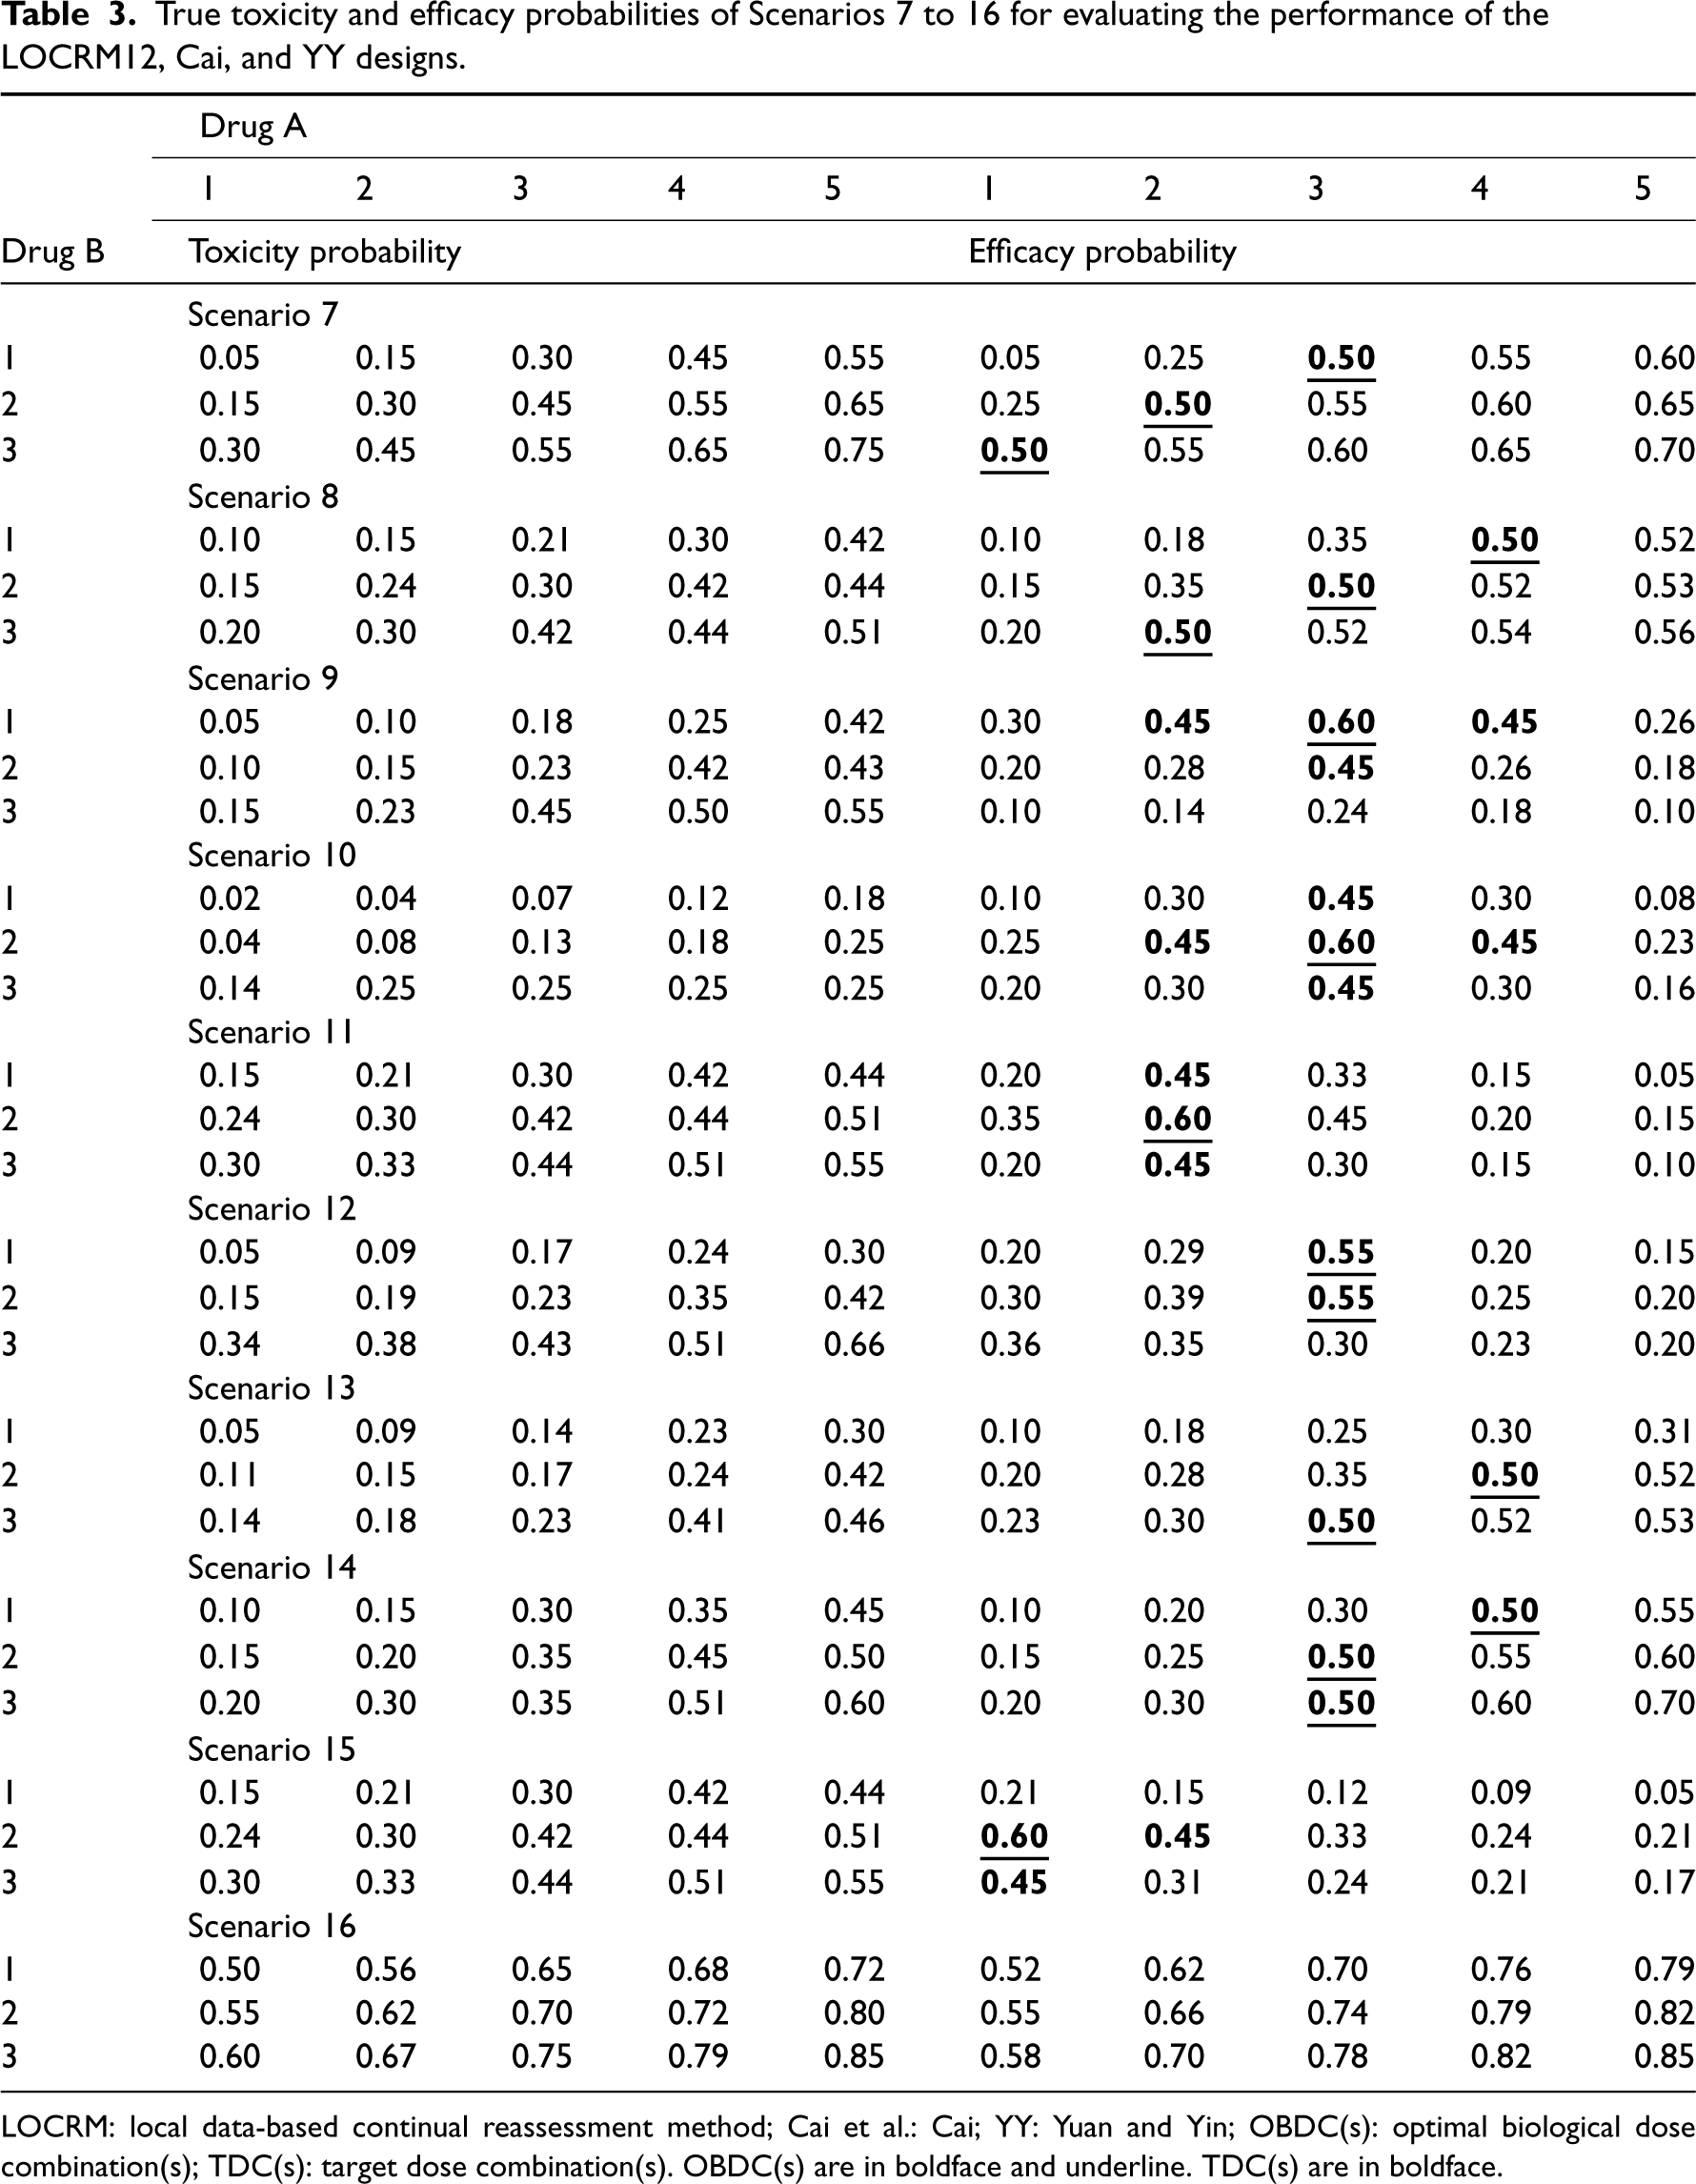
LOCRM: local data-based continual reassessment method; Cai et al.: Cai; YY: Yuan and Yin; OBDC(s): optimal biological dose combination(s); TDC(s): target dose combination(s). OBDC(s) are in boldface and underline. TDC(s) are in boldface.
Simulation configuration
To demonstrate the desirable performance of the proposed LOCRM12 design, we compare it with two competing methods, Cai et al.
26
(referred to as Cai) and Yuan and Yin
25
(referred to as YY). Ten representative scenarios with five doses for drug A and three doses for drug B are present in Table 3. The 10 scenarios incorporate various dose–toxicity and dose–efficacy relationships that can be seen in real trials. The raw doses for drug A and drug B are
The upper limit for the toxicity rate is set as
Operating characteristics
The evaluation of operating characteristics for the proposed and competing methods are based on the following six indicators: (a) selection percentage of true OBDC(s); (b) number of patients treated at OBDC(s); (c) selection percentage of target dose combinations (TDCs); (d) number of patients treated at TDC(s); (e) selection percentage of overly toxic dose(s); (f) number of patients treated at overly toxic dose(s). Indicators (a) and (b) are to assess the design’s ability to identify optimal dose combinations. Since all doses are overly toxic in Scenario 16, selecting any dose as OBDC is not expected. Thus, we summarize the probability of early stopping and the average number of patients that are not enrolled in the trial. We define TDCs as the dose combinations with a response rate no smaller than 0.45 among the safe dose combinations. As a result, (c) and (d) assess the probability of avoiding treating patients at subtherapeutic levels. Large values of indicators (a) to (d) are preferred. Indicators (e) and (f) are to evaluate the safety profile of the competing designs. Smaller values of the two indicators are preferred.
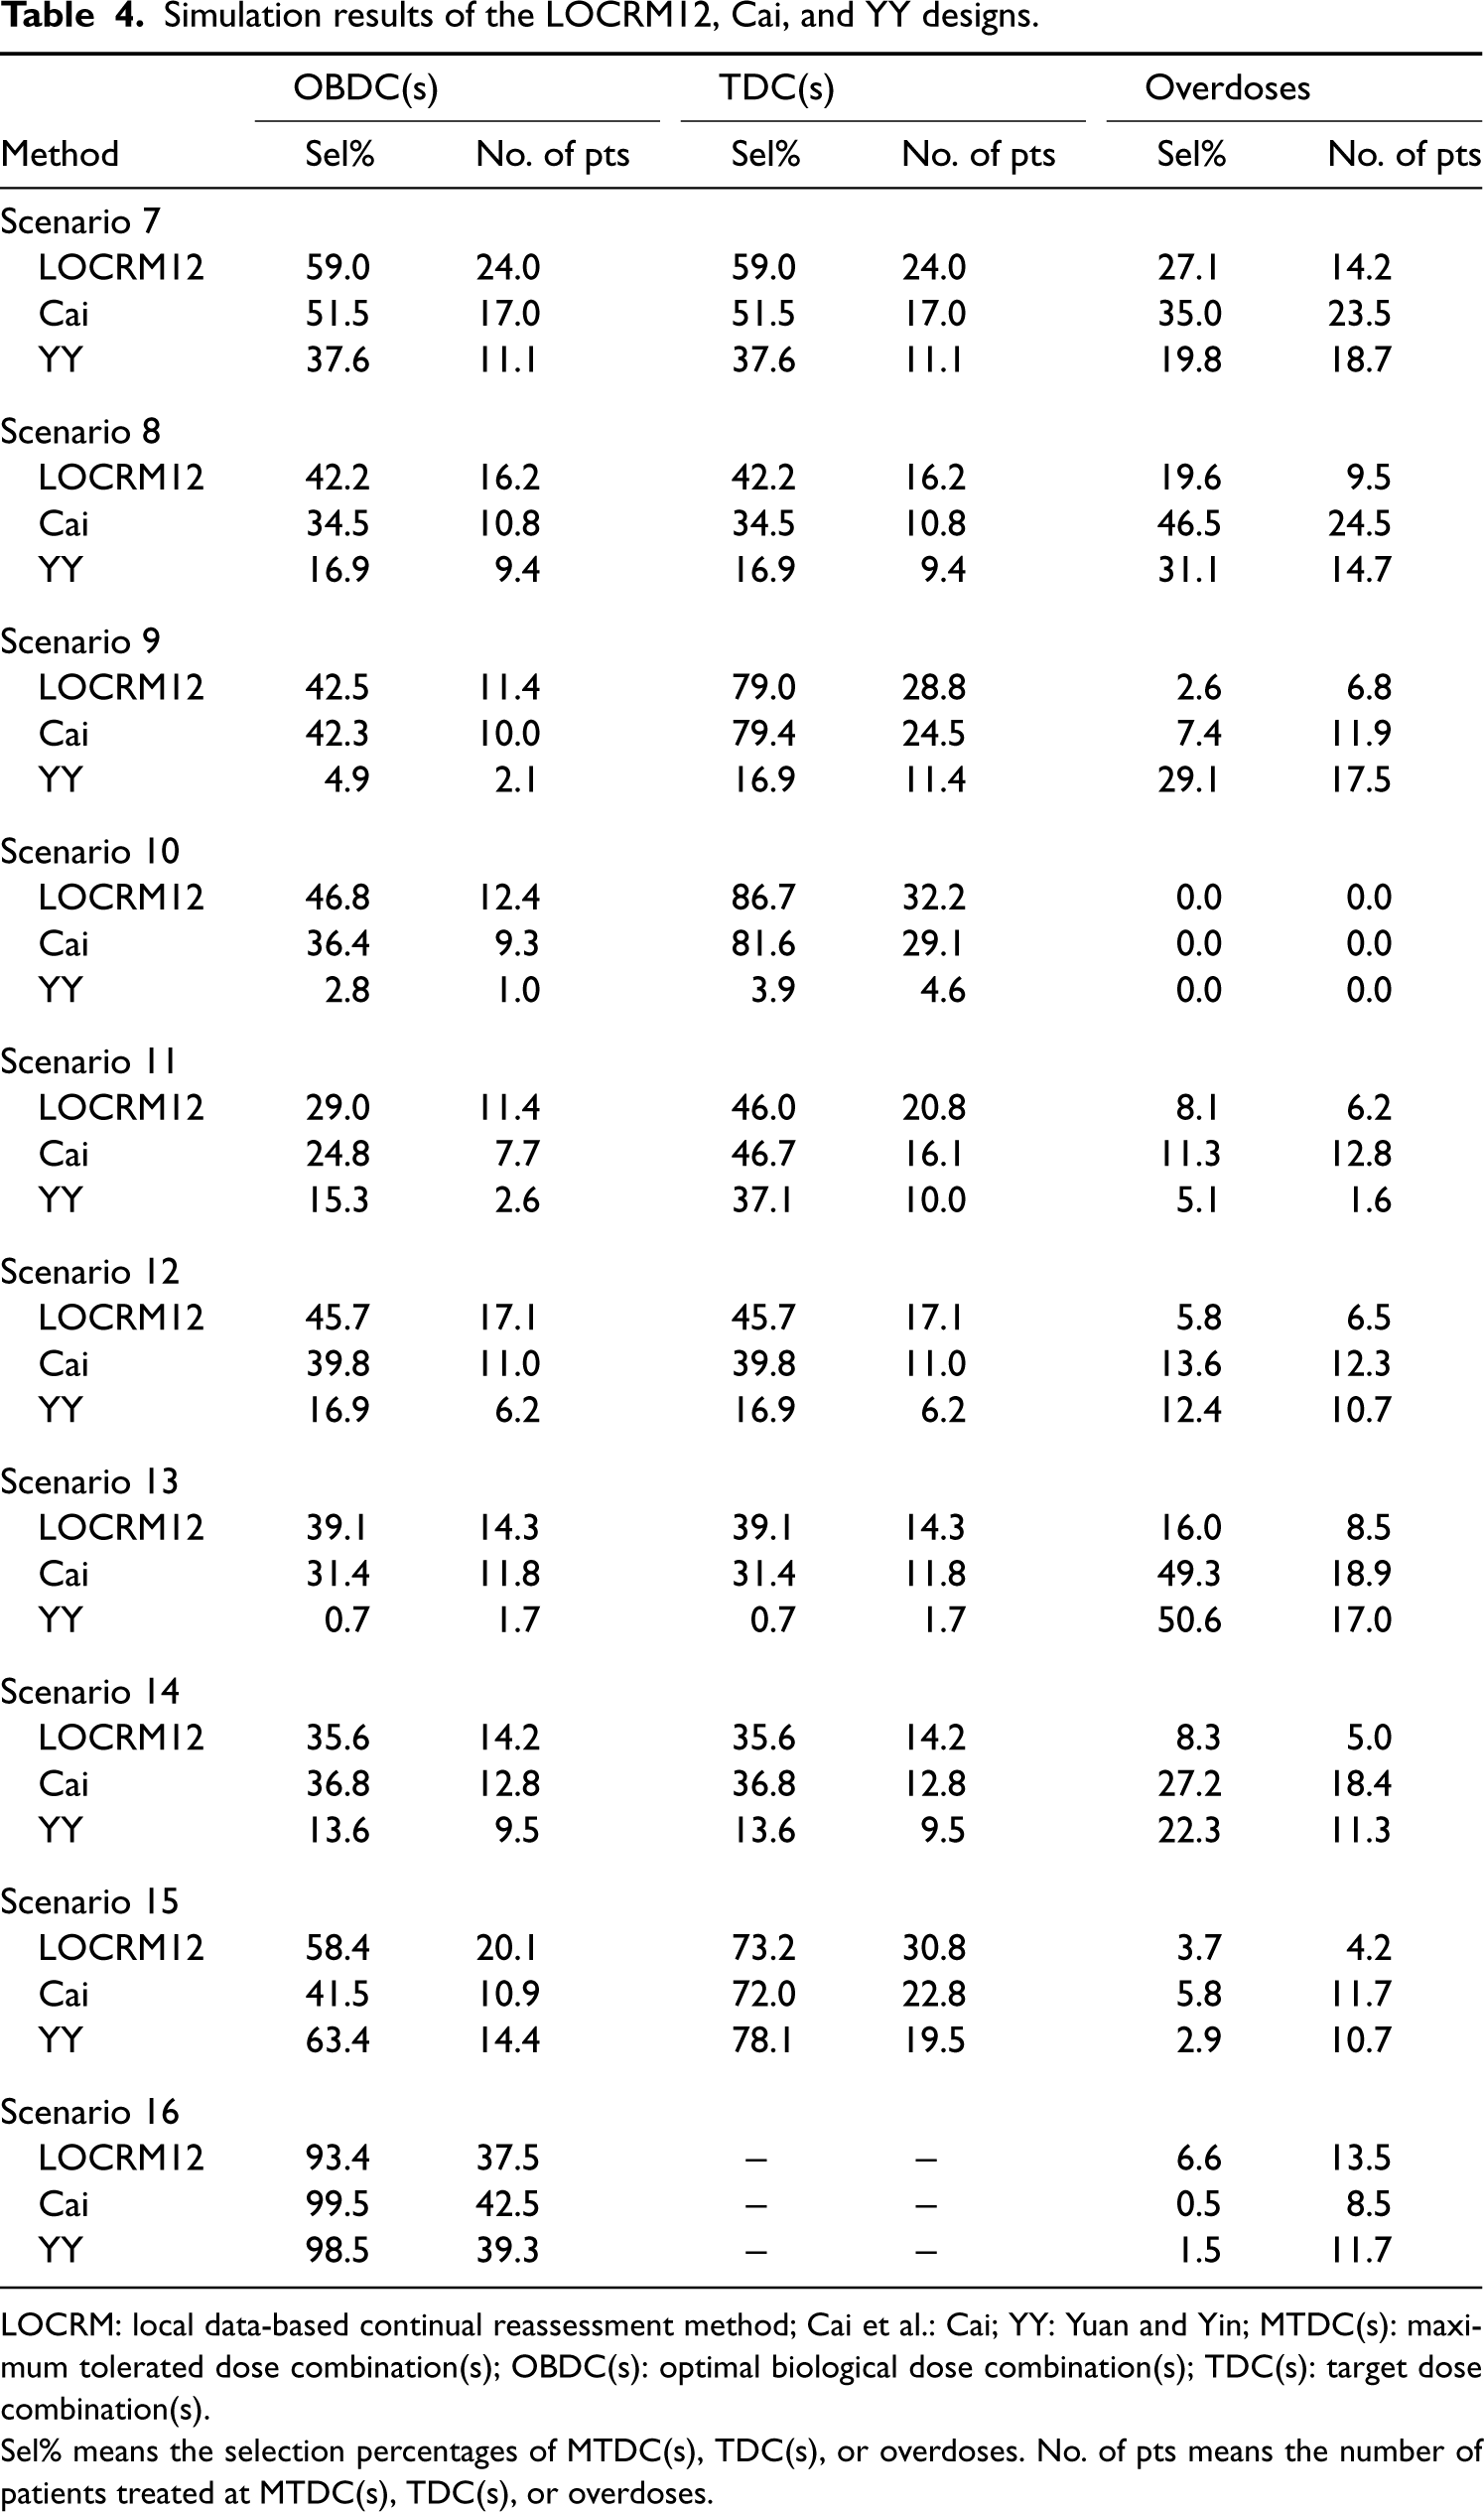
The operating characteristics of the proposed LOCRM12 design and competing methods are summarized in Table 4. In Scenarios 7 and 8, where OBDCs are located at the off-diagonal of the dose matrix, LOCRM12 performs the best in OBDC identification. In Scenario 7 particularly, LOCRM12 selects the correct OBDC with a probability 7.5% larger than the Cai design (59.0% vs. 51.5%) and 21.4% larger than the YY design (59.0% vs. 37.6%) design. LOCRM12 also allocates 7.0 and 12.9 more patients to OBDC than Cai (24.0 vs. 17.0) and YY (24.0 vs. 11.1), respectively. In terms of safety, the LOCRM12 design exhibits a better safety profile than the Cai design. As observed in Scenarios 7 and 8, the Cai design allocates 9.3 and 15.0 more patients to overly toxic dose combinations, respectively. In Scenarios 9 and 14, LOCRM12 yields comparable performance with the Cai design in terms of OBDC identification, while it shows an advantage in terms of safety control. In Scenarios 10 to 13, the LOCRM12 design is the most efficient for OBDC identification. In Scenario 11, the YY design shows the best safety control, but a limited ability to accurately select the OBDC(s) and TDC(s). In Scenario 15, the YY design performs the best in selecting OBDC and TDCs. However, the LOCRM12 design still possesses an advantage in terms of patient allocation. For example, the LOCRM12 design allocates 5.7 and 11.3 more patients than YY to OBDC and TDCs, respectively. Moreover, the YY design is very sensitive to scenario specifications. For example, in Scenario 13, this design selects OBDC(s) with a probability of 0.7% and selects the overly toxic dose combinations with a probability of 50.6%. In Scenario 16, where all dose combinations are overly toxic, LOCRM12 has similar performance as the Cai and YY designs. In Scenarios 9–11 and 15, where TDCs include more dose combinations than OBDCs, the LOCRM12 design exhibits promising operating characteristics in terms of both the selection percentage of TDCs and the number of patients treated at TDCs. For example, in Scenario 10, the selection percentage of TDCs of the LOCRM12 design is as high as 86.7%, while those of Cai and YY are 81.6% and 3.9%, respectively. The number of patients treated at TDCs based on the LOCRM12, Cai, and YY are 32.2, 29.1, and 4.6, respectively. In Scenarios 9 and 15, the selection percentages of TDCs are comparable between LOCRM12 and Cai, but the LOCRM12 design allocates more patients to TDCs.
Simulation results of the LOCRM12, Cai, and YY designs.
Simulation results of the LOCRM12, Cai, and YY designs.
LOCRM: local data-based continual reassessment method; Cai et al.: Cai; YY: Yuan and Yin; MTDC(s): maximum tolerated dose combination(s); OBDC(s): optimal biological dose combination(s); TDC(s): target dose combination(s).
Sel% means the selection percentages of MTDC(s), TDC(s), or overdoses. No. of pts means the number of patients treated at MTDC(s), TDC(s), or overdoses.
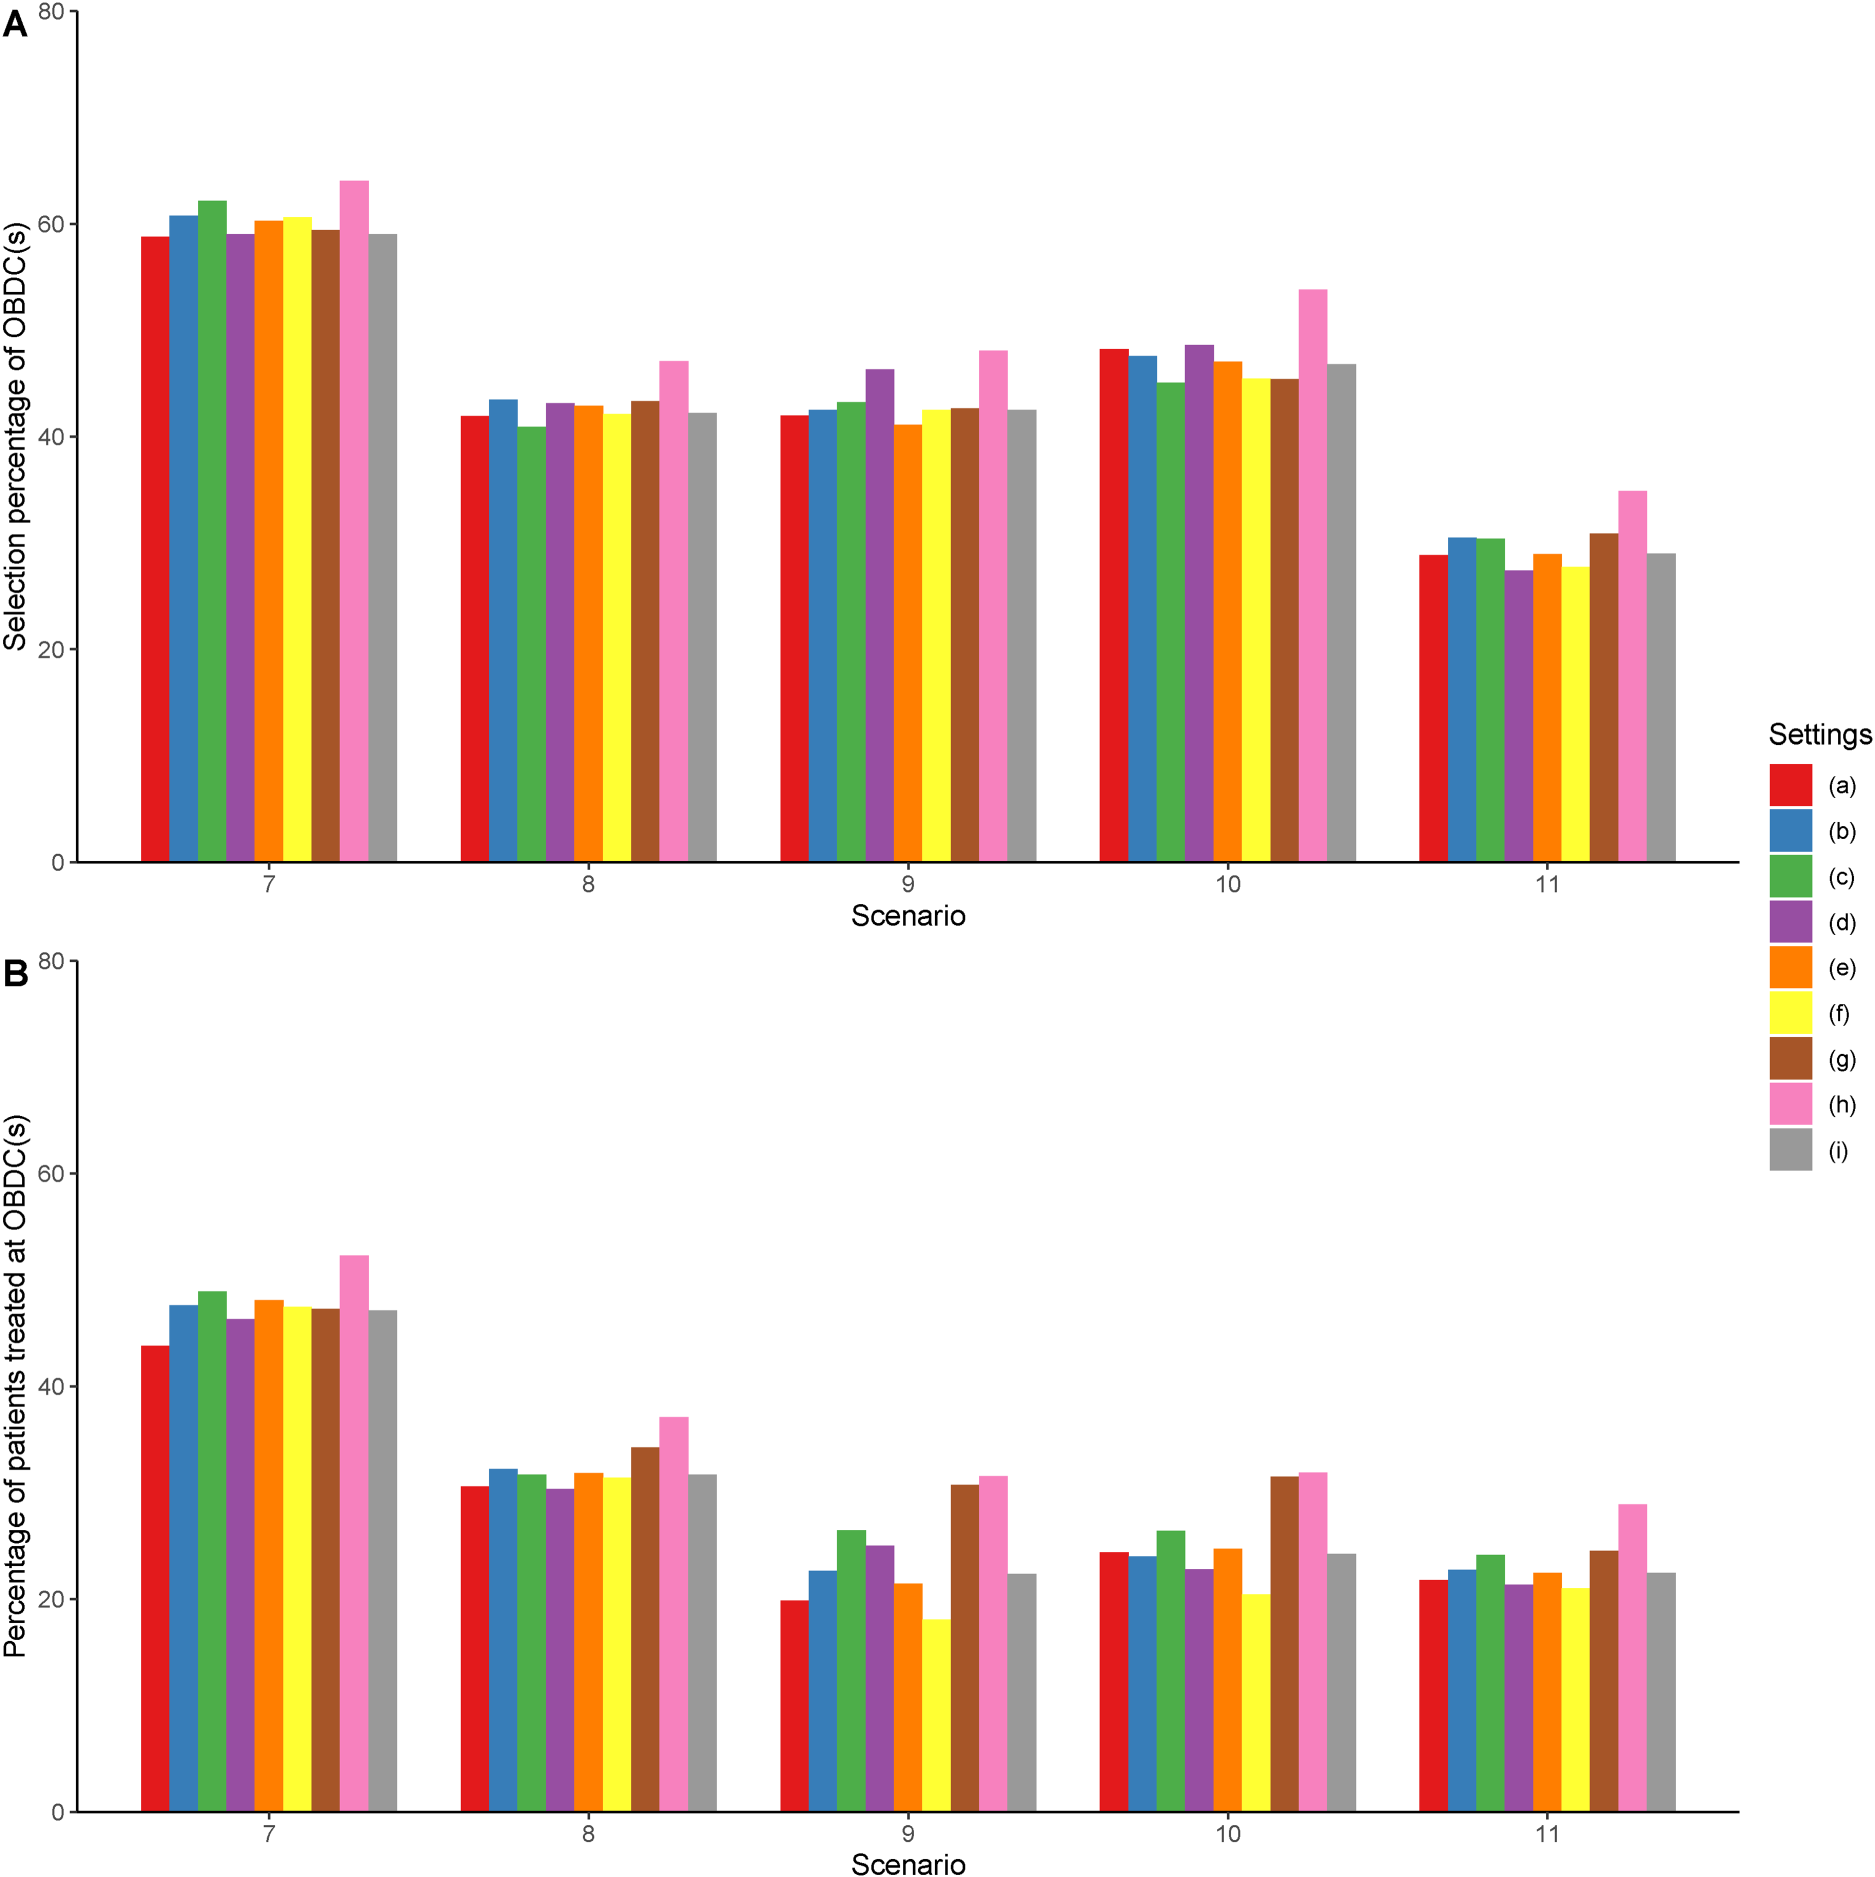
Results of the sensitivity analysis. Settings (a) to (h) shown in the legend correspond to the results under Settings (a) to (h) described in Section 5.3. Setting (i) corresponds to the results under the original setting described in Section 5.1.
In this section, we investigate the robustness of the proposed design under various configurations of the prior distributions or design parameters. Specifically, we study the impact of settings for toxicity modeling (i.e. the halfwidth of the indifference interval), the impact of parameters for efficacy modeling (including the hyperparameters
In Setting (a), we investigate the performance of LOCRM12 using a smaller halfwidth of the toxicity indifference interval. Technically, a smaller halfwidth indicates the distance between prior toxicity probabilities is smaller, which to some extent promotes escalation. In Setting (b), we use a smaller (more informative) prior variance for the unknown parameter used in the CRM model. In Setting (c), we similarly examine larger prior variances in the efficacy model. In Settings (d) and (e), we study the performance of LOCRM12 under different values of
Discussion
This article presents two designs, LOCRM and LOCRM12, for the early-phase exploratory dose-combination trials to determine the MTDC and OBDC, respectively. The LOCRM design uses CRM locally and makes escalation and de-escalation decisions among the adjacent doses of the current dose (i.e.
Footnotes
Acknowledgements
We would like to thank the Editor, the Associate Editor, and the reviewers for their valuable comments and suggestions, which greatly contributed to enhancing the quality of the article.
Declaration of conflicting interests
The author(s) declared no potential conflicts of interest with respect to the research, authorship, and/or publication of this article.
Funding
Dr Lin is partially supported by grants from the National Cancer Institute (5P30CA016672, 5P50CA221703, and 1R01CA261978). Dr Wages is partially supported by grants from the National Cancer Institute (R01CA247932).