
Abstract
One of the primary challenges encountered in propensity score (PS) weighting is the presence of observations with missing covariates. In such cases, several potential solutions based on multiple imputation have been proposed. The most prevalent of these is the MIte method, which combines treatment effect estimates derived from imputed datasets. A limited number of PS studies have incorporated the MIte method with the missing indicator method; however, these studies only incorporated the missing indicator into the PS model. The aim of this simulation study is to propose two novel methods that incorporate the missing indicator approach with the MIte. This incorporation either entails including the missing indicator into the outcome model (MIMIo) or, alternatively, into both the outcome and PS model (MIMIpso). The construction of the simulation scenarios was predicated on three elements: the mechanism of missing data, the type of treatment effect, and the presence of unmeasured confounding. In the presence of unmeasured confounding, the MIMIpso method was the most effective method under the MAR mechanism. In the context of the MNAR mechanism, the method that exhibited the lowest bias was MIMIo for homogeneous treatment effect and MIMIpso for heterogeneous treatment effect. The MIte method exhibited the highest levels of bias and variation. In view of the difficulties involved in identifying the mechanism of missing data, the variability in treatment effects across subgroups and the potential for unmeasured confounding variables in practice, researchers are encouraged to utilize the MIMIpso method.
Keywords
Introduction
Propensity score (PS) analysis can be employed to obtain unbiased estimates of the treatment effect in nonrandomized studies that contain confounding variables. PS, e(xi), is defined as the conditional probability of a patient being assigned a treatment given observed covariates, a one-dimensional summary of multidimensional covariates. 1
Inverse probability of treatment weighting (IPTW) is a commonly utilized PS-based balancing strategy, and this paper focuses on PS-IPTW. In IPTW, each patient is typically assigned an unstabilized weight
In practice, one of the primary challenges in calculating the PS is the presence of missing values in the covariates. In such cases, the complete case (CC) analysis, the missing indicator method, and multiple imputation (MI) are viable approaches that can be employed. The most straightforward of these methods, CC analysis, is based on estimating the PS only for patients who have observed values for all covariates. CC analysis generally produces biased estimates unless the missing data mechanism is missing completely at random (MCAR), and is inefficient in terms of power under all missing data mechanisms. 5 Another straightforward method, the missing indicator method (A missing indicator variable, which takes the value 0 if the corresponding value is observed and 1 otherwise, is included in PS model), is seldom employed due to its tendency to introduce bias.6,7 However, Blake et al. suggest that this method provides unbiased estimates in PS analysis under the following assumptions: no unmeasured confounding; the conditional independence of the covariate values of patients with missing data from treatment and outcome; and the correct specification of the outcome model. 8 CC analysis and the missing indicator method perform poorly in terms of overall balance, and methods that explicitly account for missing data perform better than these methods, according to Bottigliengo et al. 9 The final method, MI, is a widely utilized approach for addressing missing data in medical research. The fundamental premise of MI is the iterative estimation of missing values through the sampling of the posterior predictive distribution, conditioned on the observed data. A substantial body of evidence exists demonstrating the superiority of the MI over alternative approaches for handling missing data.10–12
Motivation
A number of potential solutions for combining post-MI estimates in PS analysis have been put forth in the literature. These methods entail the combination of treatment effect estimates (referred to as “MIte”), PSs (referred to as “MIps”), or parameter estimates within the PS model (referred to as “MIpar”) with the objective of estimating the treatment effect.13,14 The majority of authors in the literature, with the exception of Leite et al., concur that the MIte approach is the optimal method under PS weighting.13–18 Qu and Lipkovic and Seaman and White employed a methodology termed “multiple imputation missingness pattern” to assess the efficacy of the MIte approach. This involved incorporating the pattern of missing data into the PS model.19,20 In contrast, Choi et al. also evaluated the performance of MIte by including the missing indicator into the PS model and concluded that the optimal method selection is contingent upon the missing data structure and the presence of effect modification. 21 One area of the literature that requires further development is the refinement of the MIte method, specifically the addition of the missing indicator to the PS model but not the outcome model. The explicit modelling of missing data, including the missing indicator within the outcome model and both the PS and the outcome model, may prove beneficial for the estimation of treatment effects. In light of these considerations, the aim of this simulation study is to propose two novel methods, namely MIte missing indicator in outcome model (MIMIo) and MIte missing indicator in PS and outcome model (MIMIpso), which seek to incorporate the missing indicator approach with MIte by including the missing indicator into the outcome model or, alternatively, into both the outcome and PS models.
Design of the simulation study
A data generation mechanism comparable to that described by Choi et al. was adopted along with a series of supplementary scenarios, and previously employed approaches were compared with the novel methods. 21 All simulations were conducted using the R program, version 4.2.1. 22
Data generation mechanisms
Two scenarios were considered: no unmeasured confounding and unmeasured confounding. In the simulation scenarios, two continuous covariates (
Scenario 1: no unmeasured confounding
Covariates:

In this way the SD of
Treatment assignment: The treatment T was generated from the binomial distribution depend on

In this model, 330 subjects, or approximately 33% of the subjects, received treatment.
Outcome: Depending on Homogeneous null treatment effect: Homogeneous non-null treatment effect: Heterogeneous treatment effect:
The homogeneous treatment effect assumes that the treatment had a constant effect on the outcome. In the case of heterogeneous treatment effect, adding effect modification
Covariates:

Treatment assignment: The treatment T was generated from the binomial distribution depend on

In this model, 330 subjects, or approximately 33% of the subjects, received treatment.
Outcome: Depending on Homogeneous null treatment effect: Homogeneous non-null treatment effect: Heterogeneous treatment effect:
In both scenarios, missing values were generated for 50% of the MCAR: A random 50% of the observations in MAR: Let R be the binary missing indicator for MNAR: Scenario 1: The probability of
Scenario 2: The missingness in
Firstly, it should be noted that in all simulated datasets, the covariates were heterogeneous across treatment groups. However, further details on this are not presented in this study, as it was beyond the scope of the research. The PSs were obtained through logistic regression, after which the stabilized weights were calculated using the PSs. The average treatment effect was estimated as the coefficient of the treatment in the weighted regression model, where the outcome was predicted solely by the treatment. Following the generation of missing values in
Methods applied after MI
The following four methods, which are to be employed after imputing missing data, are summarized below. In order to apply the methods outlined below, a missing indicator variable, denoted as R, was defined with a value of 1 for each subject with missing data, and 0 otherwise.
MIte method: For each imputed dataset, (a) PSs were calculated by logistic regression, (b) Stabilized weights were obtained, (c) Treatment effects were estimated by weighted linear regression. Finally, using Rubin's rule, treatment effect estimates were combined into a single treatment effect across the estimated data sets.
14
MIte missing indicator-PS model (MIMIps): The first step of the MIte method was modified by adding R in the PS model along with the covariates. The remainder of the procedure remains unchanged. MIte missing indicator-outcome model (MIMIo): The first two steps of the MIte method were applied. In the next third step, the outcome model, which estimates the treatment effect, was modified by adding R. MIte missing indicator-PS and outcome models (MIMIpso): The PS and outcome models in steps 1 and 3 of the MIte method were modified by adding R.
In all scenarios, 1000 datasets were generated through simulation. In order to facilitate comparisons between the methods, the bias and SD of the treatment effect were taken into account as performance measures.
Results
The performance measures of the MIte, MIMIps, MIMIo and MIMIpso methods for simulation scenarios 1 and 2 were presented in Tables 1, 2 and 3 and Figures 1 and 2, respectively, for the homogeneous null, homogeneous non-null and heterogeneous treatment effects under different missing data mechanisms.
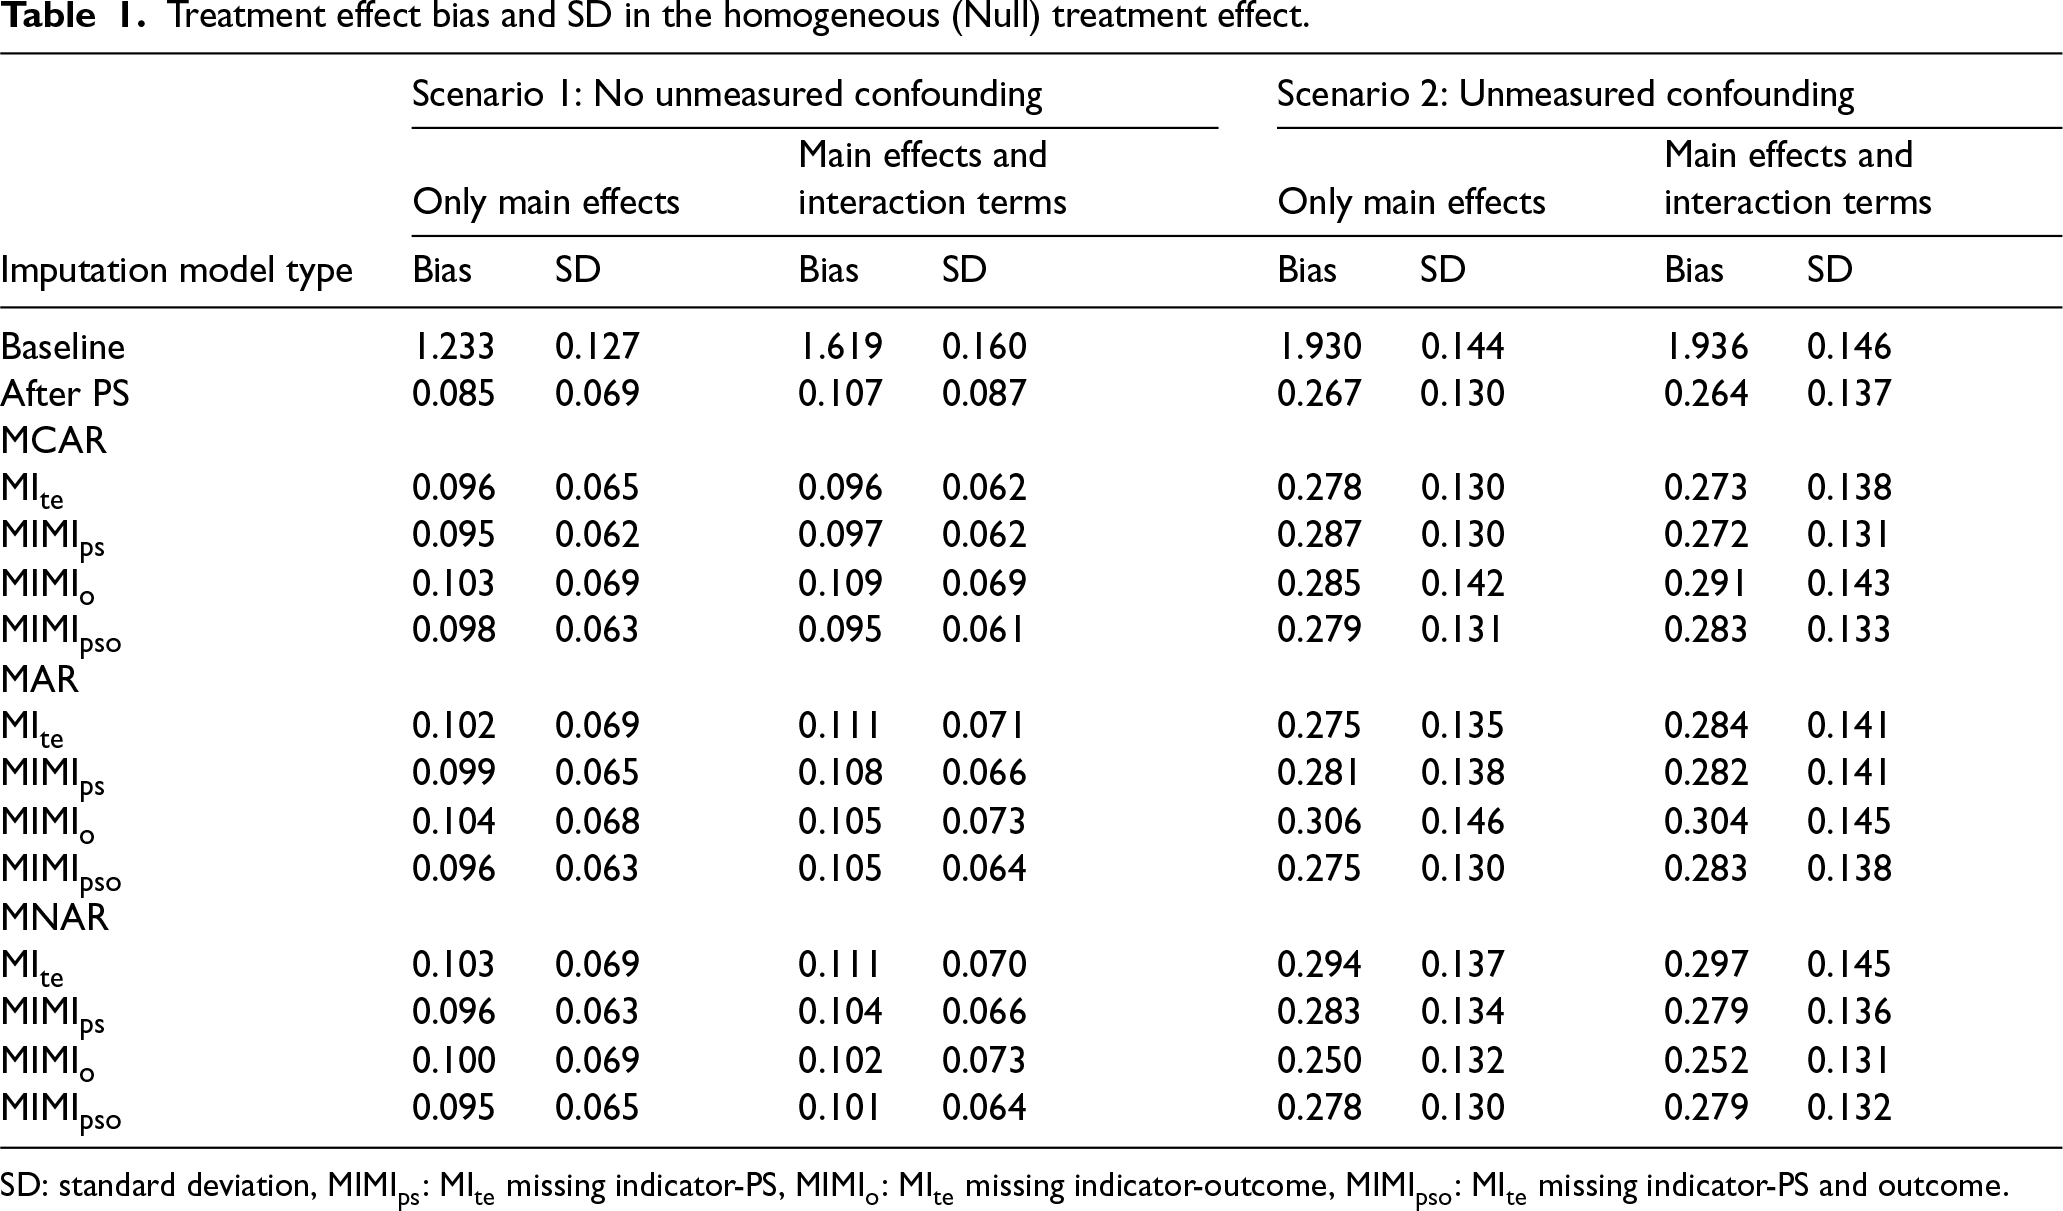
Treatment effect bias and SD in the homogeneous (Null) treatment effect.
Treatment effect bias and SD in the homogeneous (Null) treatment effect.
SD: standard deviation, MIMIps: MIte missing indicator-PS, MIMIo: MIte missing indicator-outcome, MIMIpso: MIte missing indicator-PS and outcome.
Treatment effect bias and SD in the homogeneous (Non-Null) treatment effect.
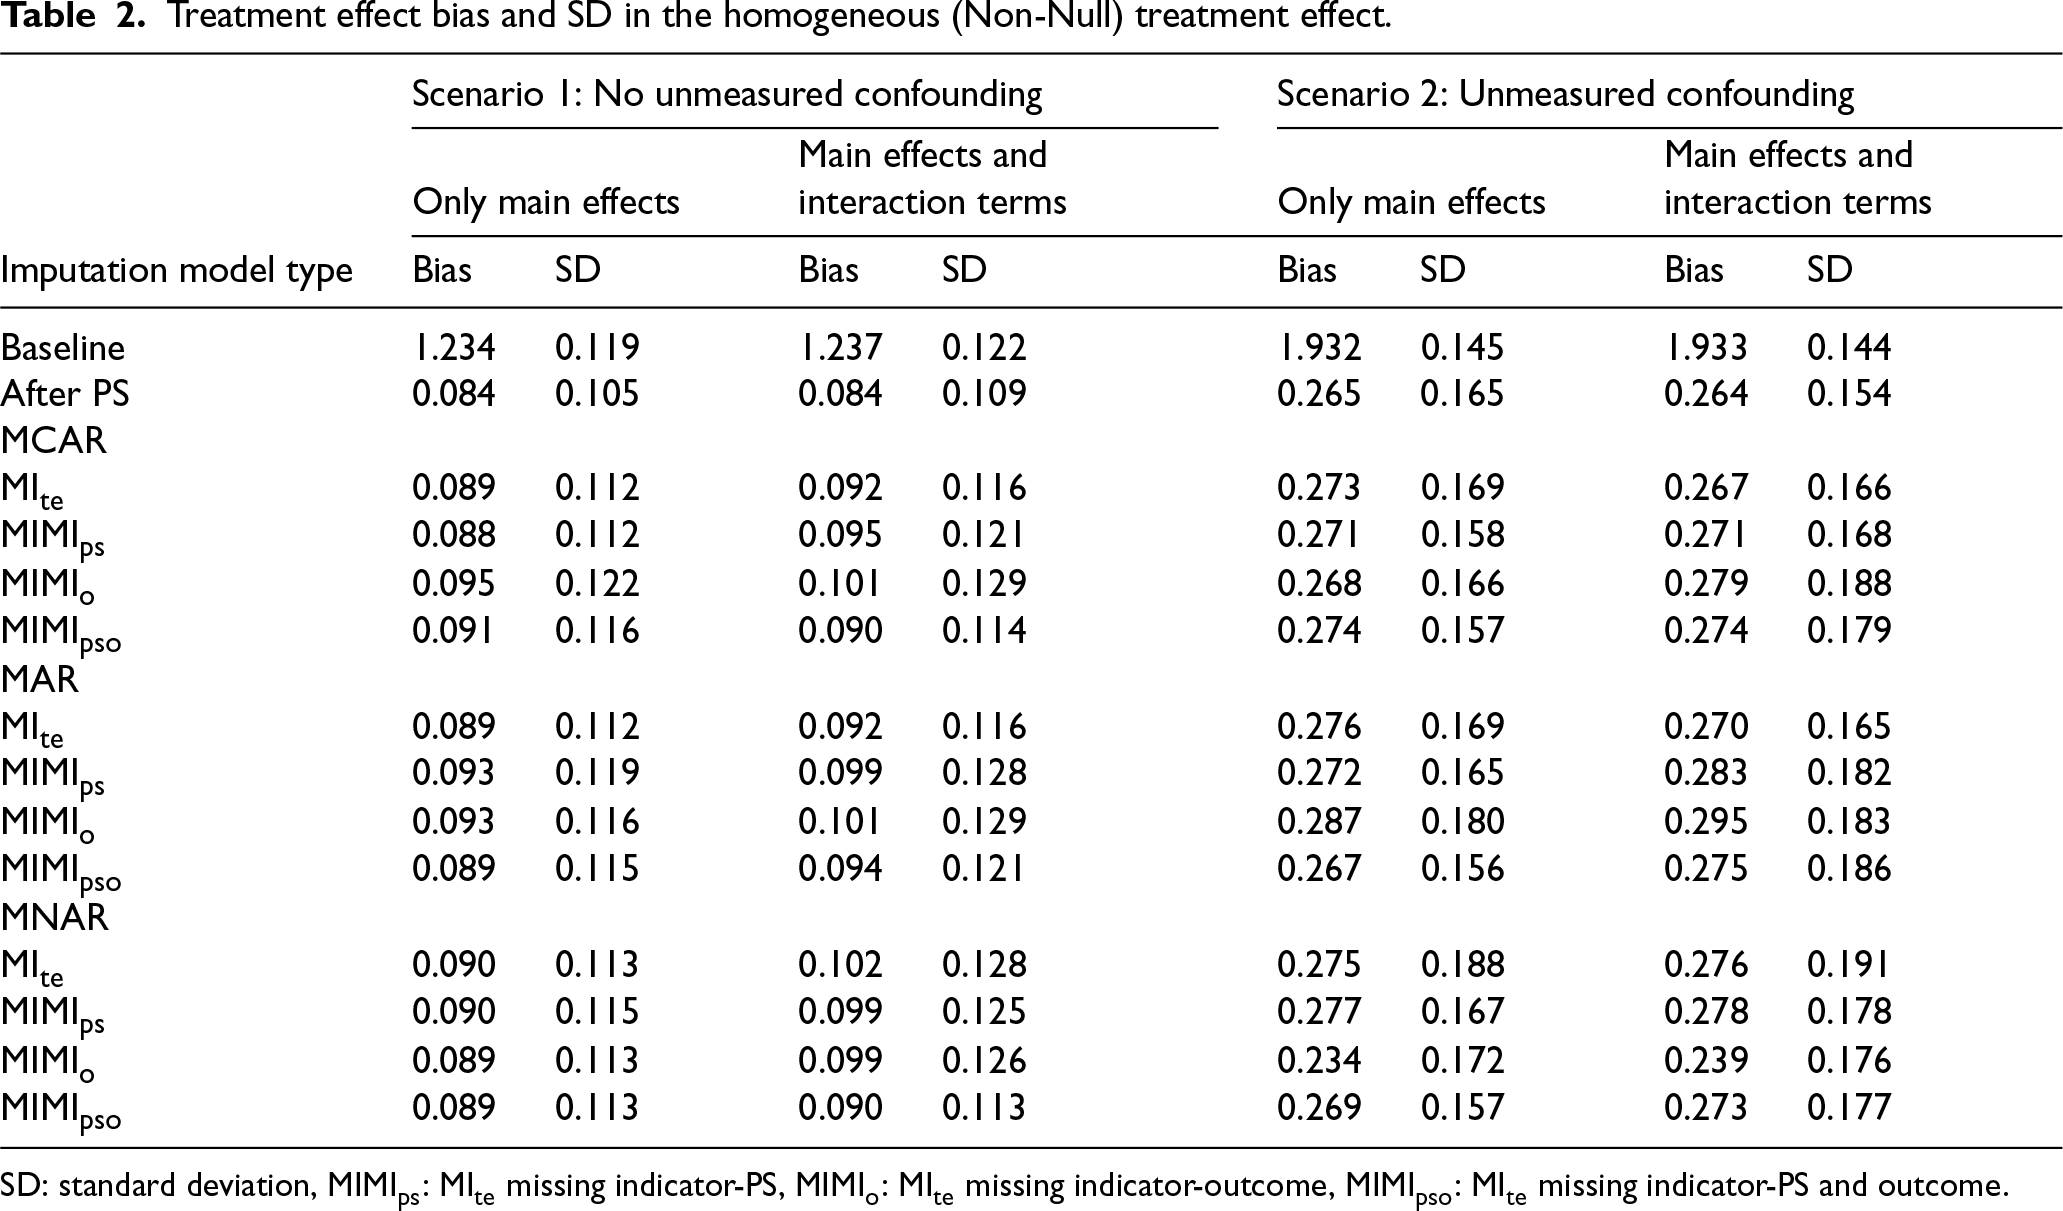
SD: standard deviation, MIMIps: MIte missing indicator-PS, MIMIo: MIte missing indicator-outcome, MIMIpso: MIte missing indicator-PS and outcome.
Treatment effect bias and SD in the heterogeneous treatment effect.
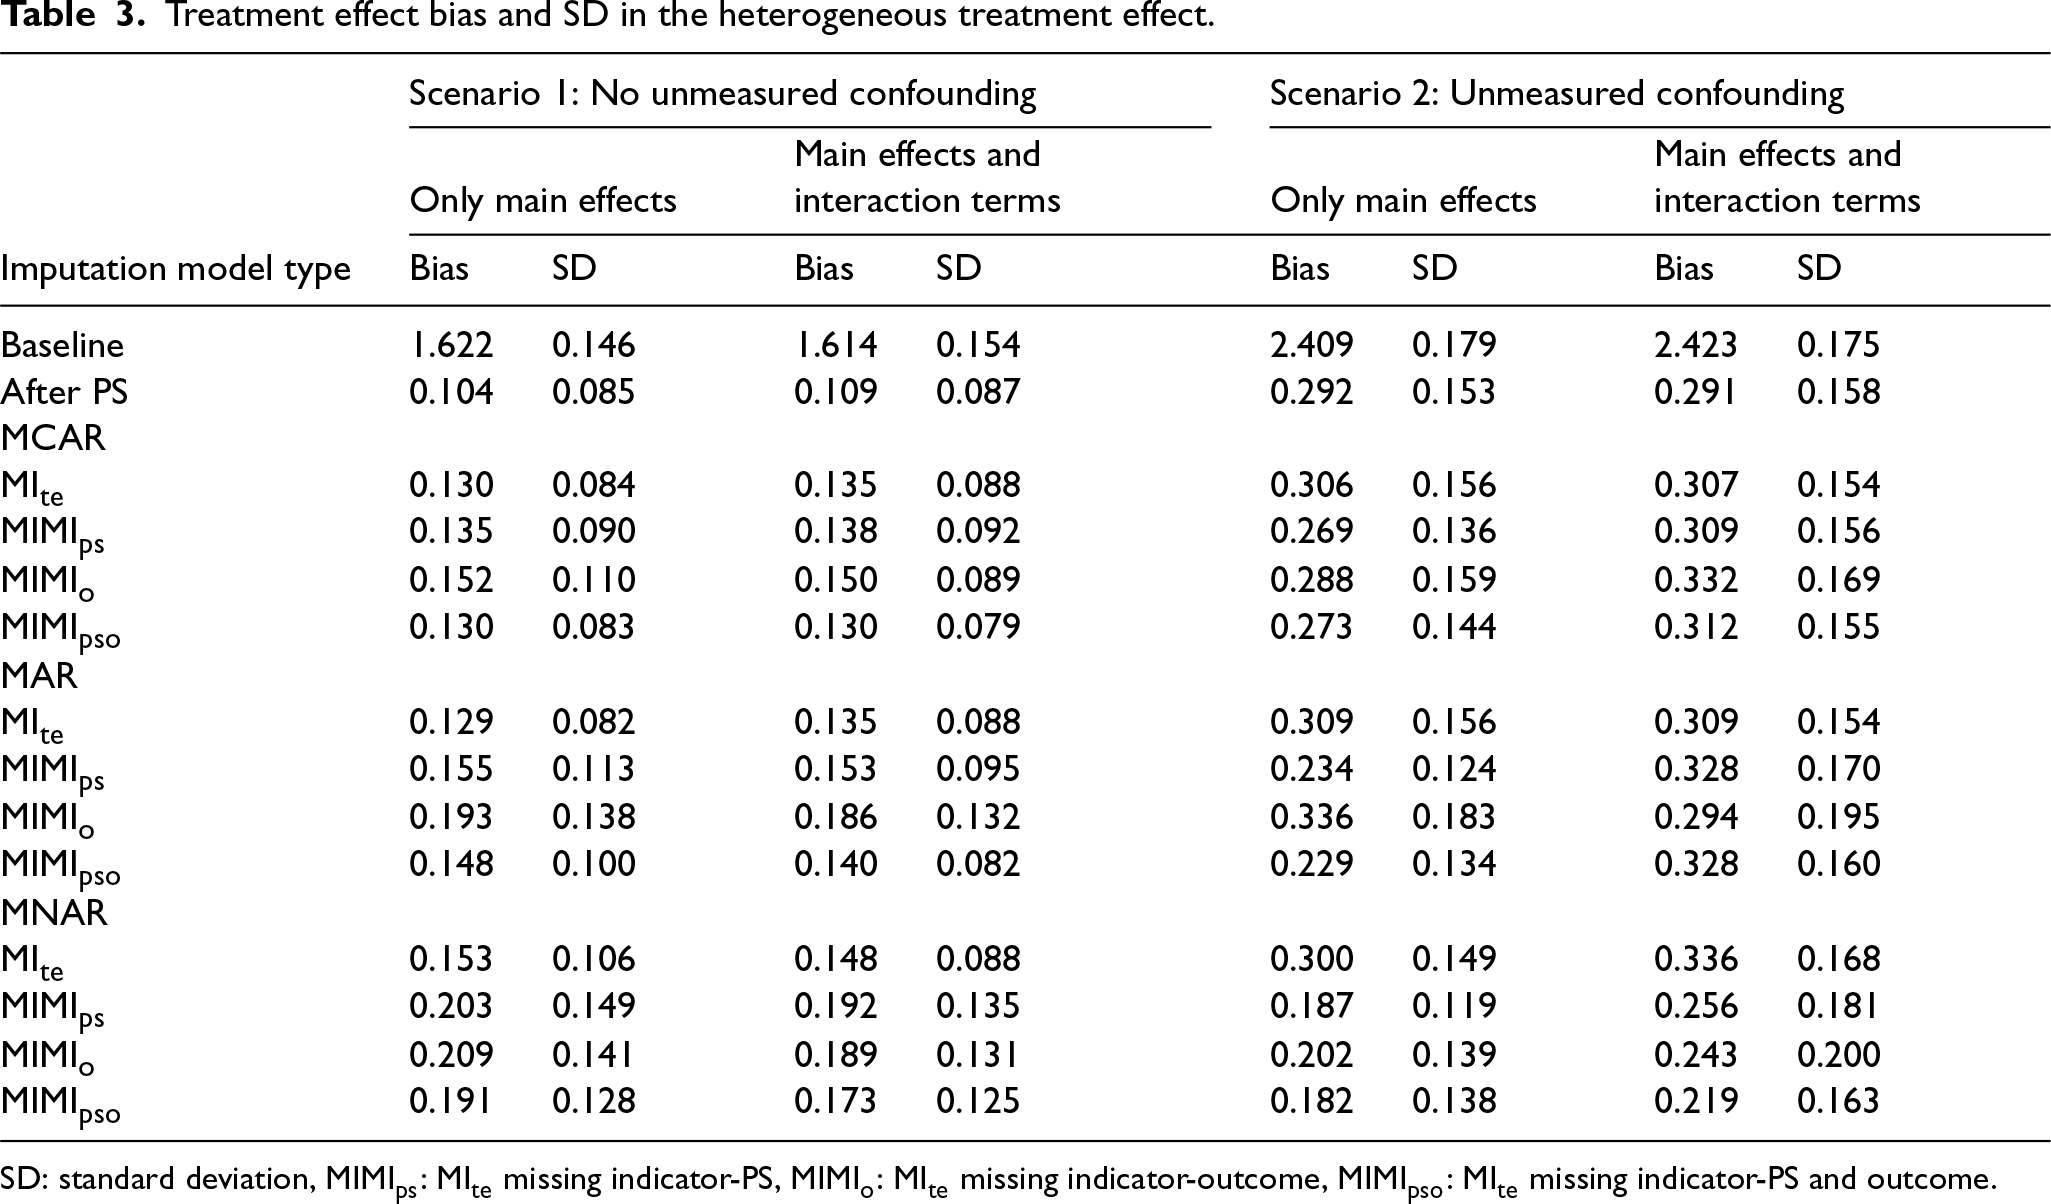
SD: standard deviation, MIMIps: MIte missing indicator-PS, MIMIo: MIte missing indicator-outcome, MIMIpso: MIte missing indicator-PS and outcome.
Homogeneous treatment effect
Among the models for all methods, the SD was observed to be lower when the treatment effect was null, and the bias was found to be slightly lower when the treatment effect was non-null. In the context of a null treatment effect, the MIMIps method in MCAR, the MIMIpso method in MAR, and the MIMIps and MIMIpso methods in MNAR were identified as the methods with the smallest bias and variation. In the context of a non-null treatment effect, the methods exhibiting the smallest bias and variation were MIte and MIMIps in the MCAR scenario. In contrast, the performance of the four methods in the MAR and MNAR scenarios was found to be almost similar. The efficacy of the methods was diminished when interaction terms were included into the imputation model (Tables 1 and 2 and Figure 1).
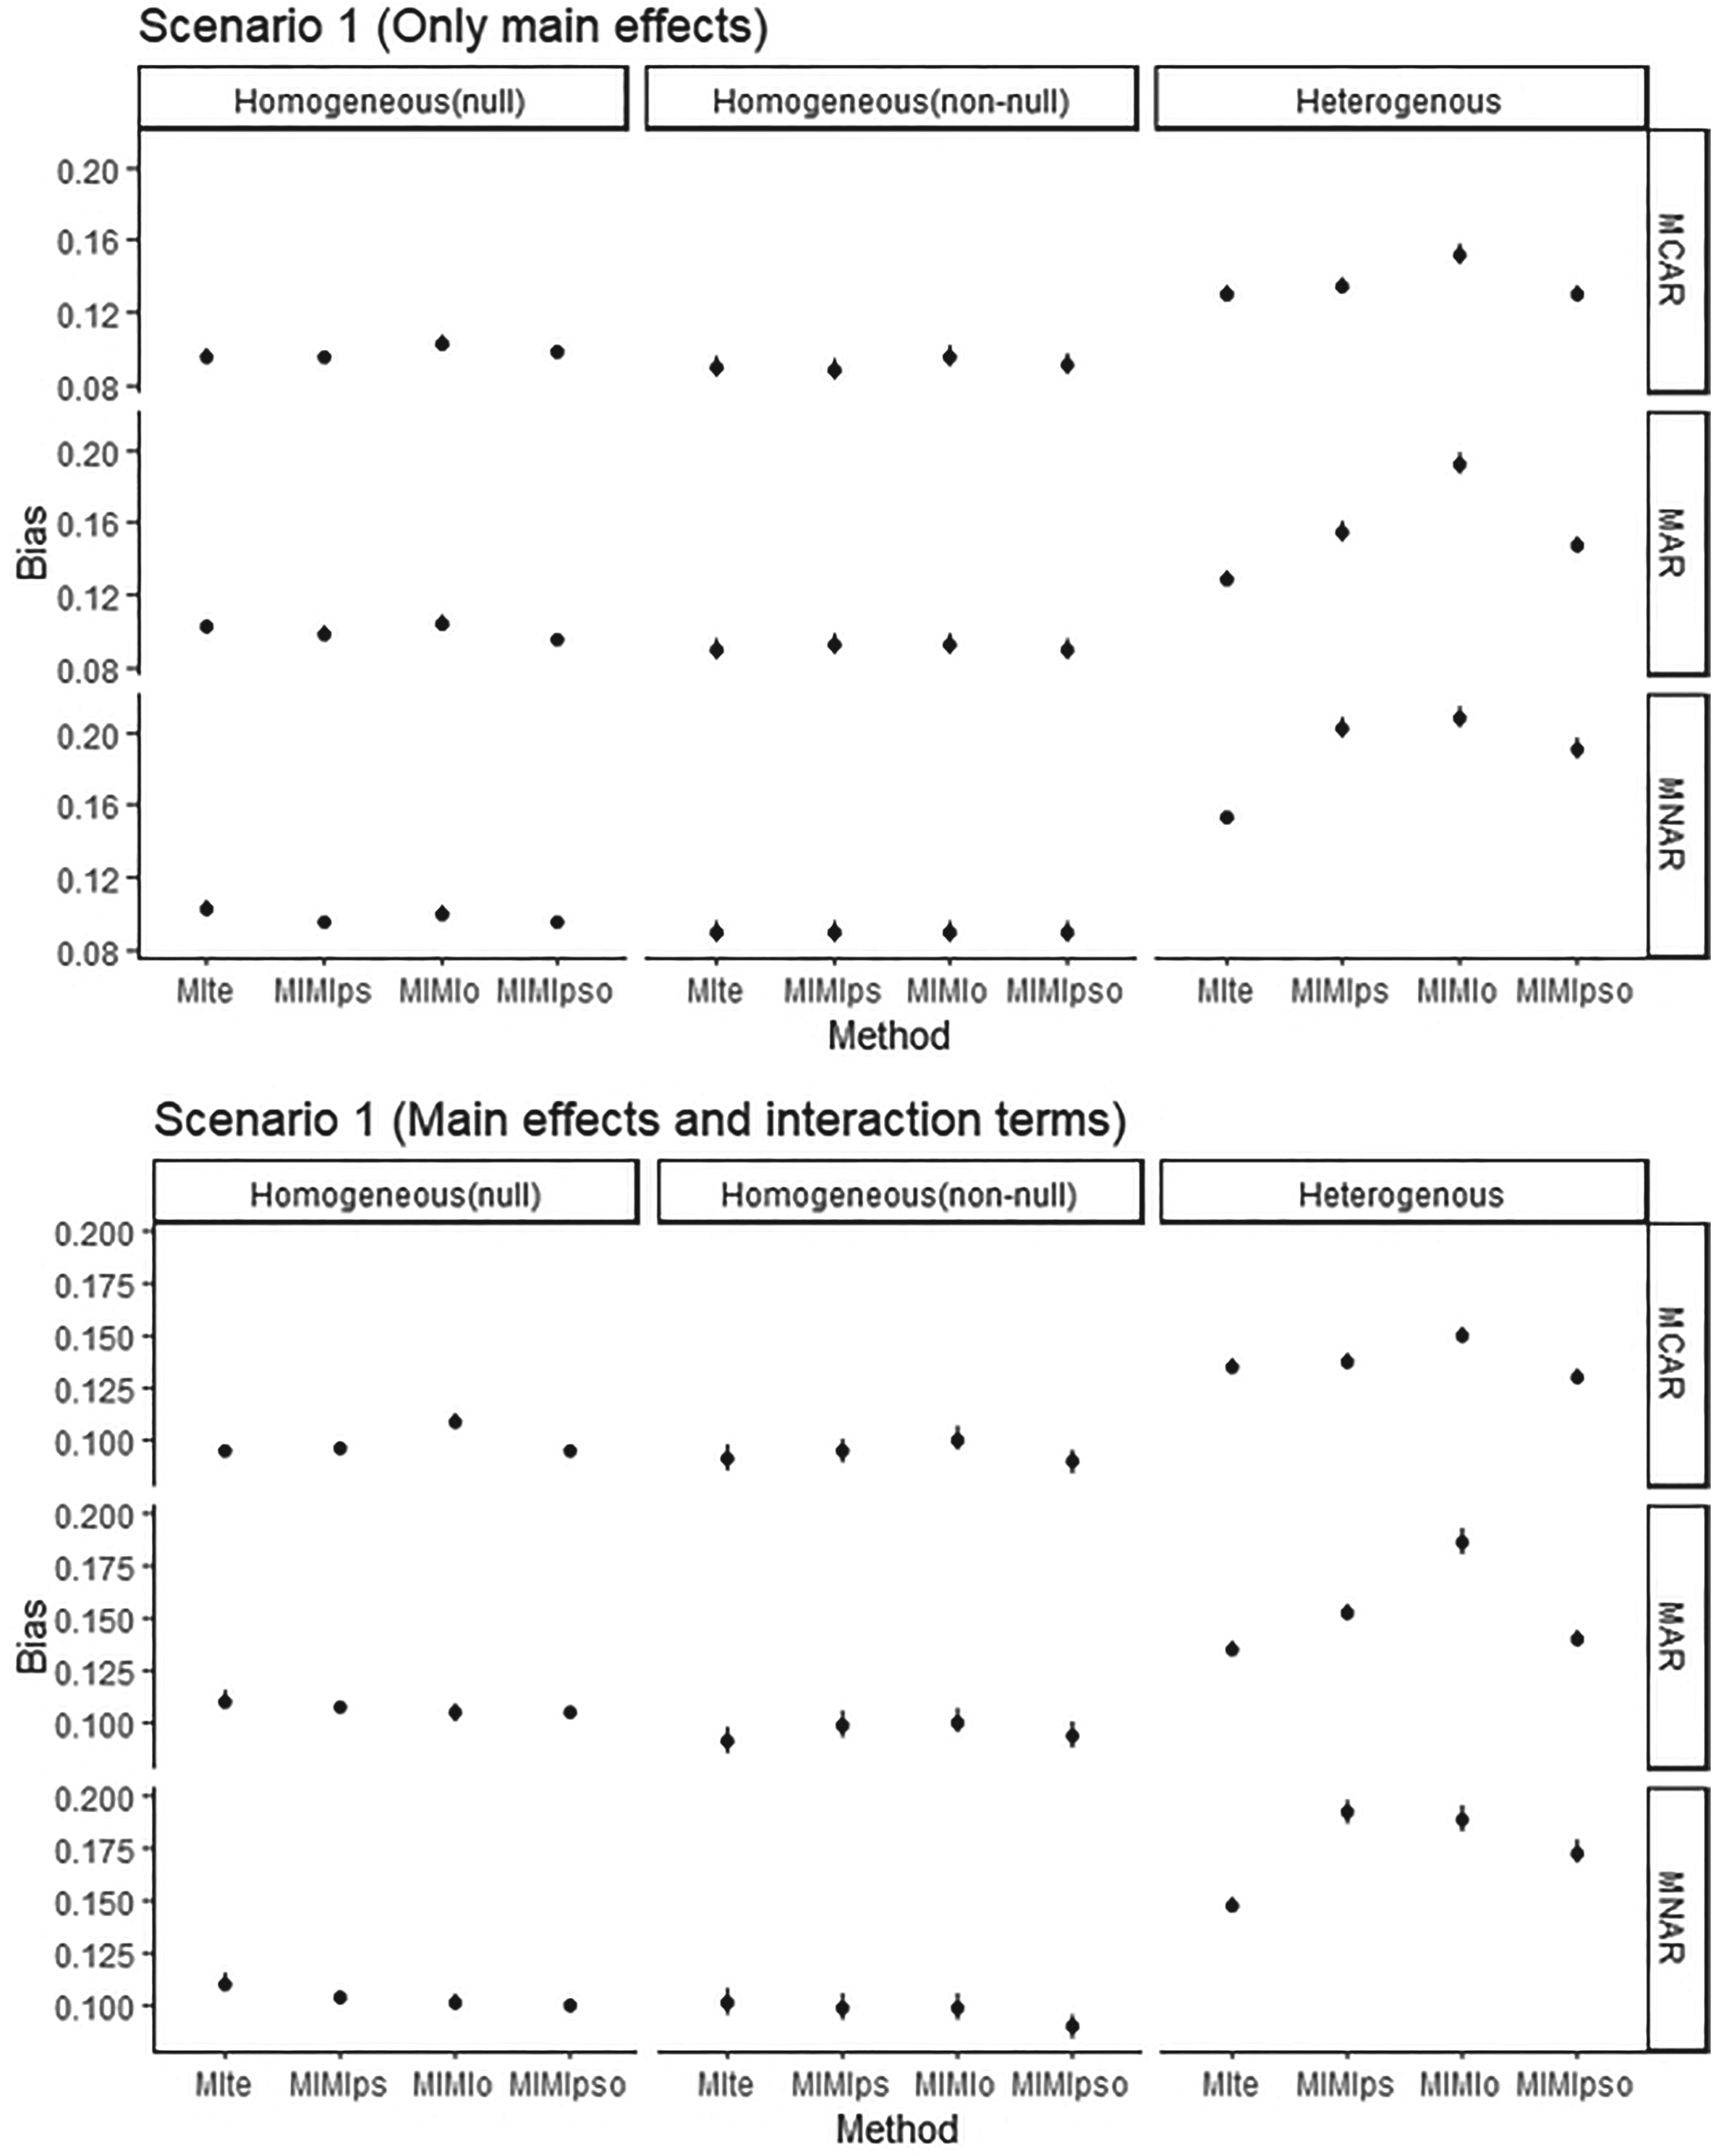
Bias of methods applied after MI in SCENARIO 1: no unmeasured confounding.
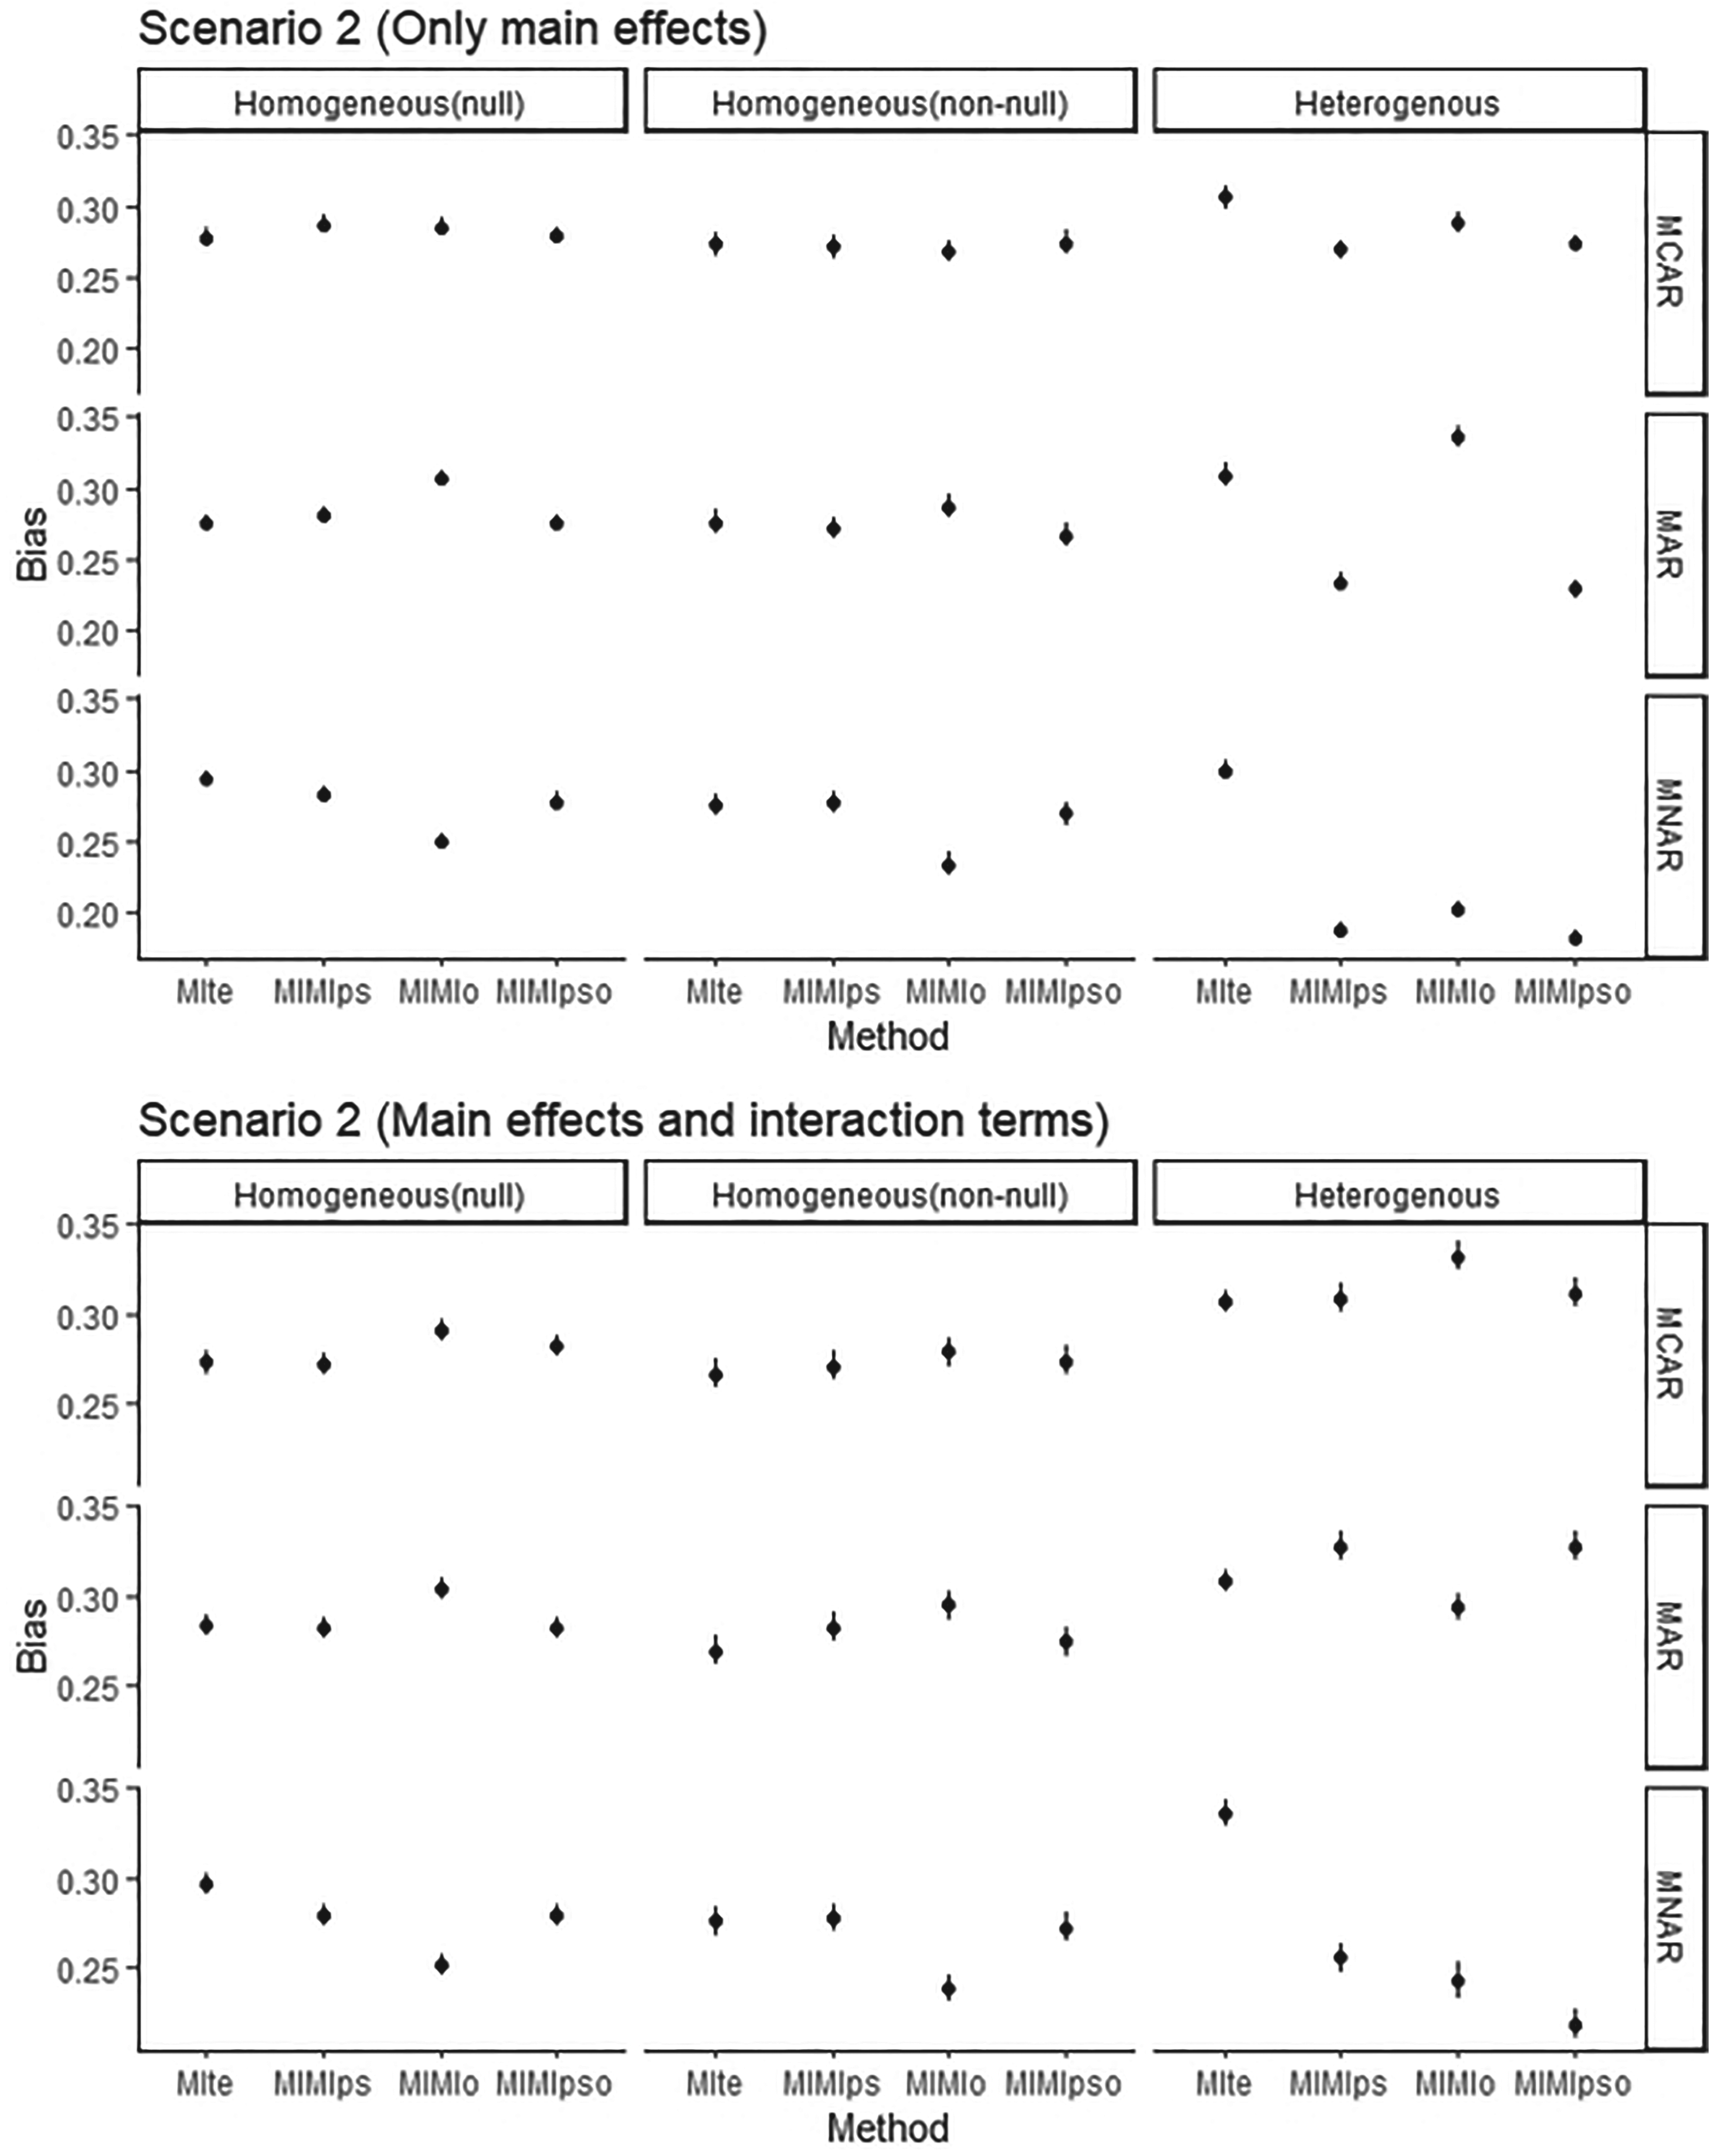
Bias of methods applied after MI in SCENARIO 2: unmeasured confounding.
The most optimal results were achieved through the use of the MIte and MIMIpso methods in the context of MCAR, the MIte method in the context of MAR, and the MIte method that includes an imputation model with interaction terms in the context of MNAR (Table 3, Figure 1).
Scenario 2: unmeasured confounding
Homogeneous treatment effect
The methods with the lowest bias and SD when the treatment effect was null were the MIte and MIMIpso in MCAR and MAR, and the MIMIo method in MNAR. When the treatment effect was non-null, the method with the lowest bias was MIMIo in MCAR and MNAR and MIMIpso in MAR (Tables 1 and 2 and Figure 2).
Heterogeneous treatment effect
In MCAR, the MIMIps method exhibited the lowest level of bias. In contrast, in MAR and MNAR, the MIMIpso method demonstrated the lowest level of bias. The inclusion of interaction terms into the imputation model yielded no discernible impact, akin to the MNAR scenario in Scenario 1 (Table 3, Figure 2).
In this scenario, the method with the highest degree of bias and variation in MNAR mechanism was the MIte method.
The incorporation of a missing indicator into the PS and outcome model within the MAR mechanism resulted in a favorable and positive impact on bias reduction, irrespective of whether the treatment effect exhibited homogeneity or heterogeneity. This impact is also applicable in the case of MNAR, where the missing indicator was included into the outcome model for homogeneous treatment effects and into the PS and outcome models for heterogeneous treatment effects.
The impact of a 25% missing data is also assessed in this study, with the relevant outcomes presented in the Supplementary material. It was observed that the most efficacious methods for 25% and 50% missing data were not radically different and, in fact, were largely parallel.
Discussion
This study investigates the impact of incorporating the missing indicator into the MIte method in different ways on the treatment effect estimates in the presence of missing data in the PS-IPTW analysis. In this context, the research question guiding the study was whether the missing indicator should be incorporated into the MIte method with the PS model, the outcome model, or both the PS and the outcome model. This evaluation was conducted through a simulation scenario. To ensure comparability of results, we employed the data generation scenario proposed by Choi et al., but pursued a distinct analytical trajectory in examining the simulated datasets. 21 The initial discrepancy pertained to the utilization of standardized weights, a methodology unfamiliar to us in the context of PS-IPTW analysis when dealing with missing data. Secondly, in all scenarios, interaction terms were included into the imputation model, irrespective of whether heterogeneous treatment effects were also considered. In this context, as in the study of Choi et al., the MIte and MIMIps methods were used in PS-IPTW analysis to handle missing data. In light of these considerations, the scenarios in which our study demonstrated superior performance were identified through a comparative analysis of the two studies. These findings are summarized below: In the context of a homogeneous null treatment effect, the SD was observed to be lower. Similarly, in the presence of unmeasured confounding and a homogeneous null treatment effect, the overall performance in MCAR and the SD in MNAR were superior. Furthermore, in the heterogeneous treatment effect, the SD and also the bias in MNAR were lower. It is noteworthy that the SDs of the treatment effect estimates in our study were frequently lower than those reported by Choi et al. (2019). It can be posited that the primary reason for this discrepancy is the utilization of stabilized weights, which differs from the approach employed by Choi et al. (2019). The application of stabilized weights serves to reduce the variability inherent in the weight distribution. However, even with disparate weightings, it was observed that the confidence intervals for the estimated treatment effects exhibited overlap, indicating that the fluctuations in bias and SD are mutually compensating.
Choi et al. evaluated the CC analysis and missing indicator methods, as well as the MIte and MIMIps methods. 21 They concluded that the optimal approach to handling missing data depends on the specific missing data mechanism and the presence of effect modification. The findings of their study indicate that the missing indicator method and CC analysis are not generally recommended for handling missing values. In light of the extensive criticism directed at these methods in the literature, we chose not to address the CC and missing indicator approaches in this study.11,26,27 When these two methods are disregarded, irrespective of the missing data mechanism, MIMIps for the homogeneous treatment effect and MIte, which includes interaction terms into the imputation model for the heterogeneous treatment effect, were the most effective approaches in Choi et al. However, despite the low probability of reaching a general conclusion, regardless of the missing data mechanism in this study, the overall results showed that the MIte method was less effective than alternative approaches in a large number of scenarios. In particular, when an unmeasured confounder is present, the MIte method should be applied by incorporating the missing indicator into either the outcome model or the PS and outcome models. This suggests that, in the presence of unmeasured confounding, the impact of missing values in the covariate should be taken into account following imputation. Furthermore, this is made evident when missing values are taken into account in both the PS and outcome models, as opposed to solely in the PS model.
The simulation study conducted by Noghrehchi et al. demonstrated that imputation models that are misspecified or overfitted can lead to bias in parameter estimates. 28 As demonstrated by Choi et al., the inclusion of interaction terms among covariates, treatment, and outcome in the imputation model serves to reduce bias in instances where a heterogeneous treatment effect is present. This phenomenon was limited to the MNAR mechanism in the present study, resulting in a reduction in standard deviation and the introduction of bias. The same mechanism yielded disparate results in the presence of an unmeasured confounder, namely that the efficacy of the methods was diminished by the inclusion of interaction terms into the imputation model. In other words, when the mechanism is MNAR and there are no unmeasured confounders, the addition of interaction terms to the imputation model improves the estimates of the treatment effect if it varies among subjects. The addition of interaction terms to the imputation model was found to result in an increase in bias and standard deviation, rather than providing any benefit, when the treatment effect was homogeneous. Therefore, in the case of a homogeneous treatment effect and a heterogeneous treatment effect with no unmeasured confounding, the appropriate imputation model may be one that includes only the main effects. Conversely, in the case of a heterogeneous treatment effect with unmeasured confounding, the model should include both the main effects and interaction terms. Further investigation is required to ascertain the optimal imputation model for missing data in PS-IPTW.
In response to the criticisms raised by Choi and Gelfond regarding the exclusive consideration of the homogeneous null treatment effect, Choi et al. conducted a replication of their simulations by setting the treatment effect to 1 and reported that the results remained consistent when the treatment effect was 0 and 1.29,30 In contrast with the findings of Choi et al., our results did not yield comparable outcomes in both scenarios. This leads us to conclude that the magnitude of the treatment effect may have an impact on the selection of the appropriate methodology. Furthermore, a reduction in the variability of the estimated treatment effect was observed when the treatment effect was null. This indicates that treatment effect estimates are less consistent when there is a homogeneous non-null treatment effect. Further research is required to facilitate more detailed inferences.
In the context of routinely collected healthcare data, it is challenging to ascertain the specific missing data mechanism that is responsible for the observed missing data. A review of the literature reveals that, to the best of our knowledge, only Little's MCAR test is available for evaluating whether missing data are MCAR. 31 Once it has been established that the missing data are not MCAR, it is not possible to determine whether the missing data are MAR or MNAR. As demonstrated in this study, the most suitable method for incorporating the missing indicator approach with MIte is contingent upon the nature of the treatment effect, mechanism for missing data, and the existence of unmeasured confounding. In other words, irrespective of the missing data mechanism, it is evident that it is not possible to discuss the superiority of a method in terms of homogeneous or heterogeneous treatment effects. In light of these and the fact that the treatment effect often varies across subgroups in practice, the researcher may choose to commence a study with the presumption that the treatment effect is heterogeneous, that missing data are MNAR, and that there are unmeasured confounding variables. In such a framework, the most optimal method for obtaining treatment effect estimates with PS-IPTW is to utilize the MIte approach, in which the indicator variable is included into the PS and outcome model, referred to as MIMIpso in this study. Consequently, rather than employing the MIte approach as the default, researchers should incorporate it with the missing indicator method.
Supplemental Material
sj-docx-1-smm-10.1177_09622802251338365 - Supplemental material for Incorporation of missing indicator with multiple imputation in propensity score analysis with partially observed covariates: A simulation study
Supplemental material, sj-docx-1-smm-10.1177_09622802251338365 for Incorporation of missing indicator with multiple imputation in propensity score analysis with partially observed covariates: A simulation study by Sevinc Puren Yucel Karakaya and Ilker Unal in Medical Research
Footnotes
Authors’ contributions
All authors contributed to the study conception and design. Data generation and analysis were performed by Sevinc Puren Yucel Karakaya and Ilker Unal. The first draft of the manuscript was written by Sevinc Puren Yucel Karakaya and all authors commented on previous versions of the manuscript. All authors read and approved the final manuscript.
Declaration of conflicting interests
The authors declared no potential conflicts of interest with respect to the research, authorship, and/or publication of this article.
Ethics approval
The study does not require ethical approval.
Funding
The authors received no financial support for the research, authorship, and/or publication of this article.
Supplemental material
Supplemental material for this article is available online.
References
Supplementary Material
Please find the following supplemental material available below.
For Open Access articles published under a Creative Commons License, all supplemental material carries the same license as the article it is associated with.
For non-Open Access articles published, all supplemental material carries a non-exclusive license, and permission requests for re-use of supplemental material or any part of supplemental material shall be sent directly to the copyright owner as specified in the copyright notice associated with the article.