
Abstract
Multi-location studies are increasingly used in environmental epidemiology. Their application is supported by designs and statistical techniques developed in the last decades, which however have known limitations. In this contribution, we propose an improved modelling framework that addresses these issues. Specifically, this flexible framework allows the direct modelling of demographic differences across locations, defining geographical variations linked to multiple vulnerability factors, capturing spatial heterogeneity and predicting risks to new locations, and improving the assessment of uncertainty. We illustrate these new developments in an analysis of temperature-mortality associations in Italian cities, providing fully reproducible R code and data.
Introduction
Multi-location studies have become the standard in environmental epidemiology due to the need to investigate health risks across regions and populations. Pooling several locations together increases the power of environmental epidemiology studies, allowing for the accurate estimation of the impacts on health from various exposures.1–7 This is helped by the increasing availability of global8,9 and high-resolution10,11 datasets for many environmental stressors.
The standard analytical approach for multi-location studies is the two-stage framework,12,13 which consists of the following steps: (i) location-specific associations between an environmental exposure and a health outcome are independently estimated, and (ii) these associations are pooled in a second-stage meta-analysis. This approach, developed in the last decades, is still an active research topic resulting in flexible two-stage designs.14,15 The two-stage analytical framework, in these settings, presents computational convenience compared to alternative single-stage multilevel models such as Bayesian disease mapping or Poisson log-linear models.16–19 In a longitudinal context typical of environmental epidemiology, the first stage allows a fine characterisation of complex exposure-lag-response relationships through modern techniques, while controlling for trends and time-varying confounders specific to each location. 20 The second stage then allows improving first-stage estimates of association both at the pooled and location-specific levels, as well as allowing the assessment of heterogeneity and its drivers. Modelling this complexity through single-stage methods would necessitate an intractable number of parameters to estimate, and single-stage studies in some applications necessitate simplifications of the models, with potential biases in the estimates.
Despite its inherent advantages, the current two-stage analytical framework still presents limitations that hamper the generalisation and accuracy of its results. First, in multi-country studies, the use of administrative data with inconsistent stratification prevents sub-group analyses from assessing differential risks within a population, for example by age. This ultimately hampers the comparability of burden estimates between countries, or more generally between populations with very different structures. This creates confusion as to whether differential impacts are due to local vulnerabilities or to varying age structures across populations. Second, differences in risks across locations can be due to complex patterns involving several drivers of vulnerability, usually highly correlated with each other. Unfortunately, the computational complexity and limited sample size of meta-analytical models limit the integration of these drivers in the second stage to only a handful of location-specific characteristics, posing important limits to the amount of heterogeneity that such models are able to capture. 21 Finally, the computation of the uncertainty in the impact measures at various geographical levels is made difficult by the correlation of location-specific risks estimates induced by the second-stage meta-analytical procedure. It is important to account for the uncertainty at the various stages of the analysis to avoid an underestimation of the uncertainty, especially in the analyses involving a high number of small location-specific datasets and low heterogeneity.
This contribution describes specific modelling extensions of the two-stage framework for the analysis of environment-related health risks, specifically addressing the limitations highlighted above. This extended framework allows for estimating health burdens in populations with little or no health data available,22,23 risk disaggregation for coarsely and inconsistently grouped populations, in particular by age groups, 22 or spatial downscaling of the health risk. 24 We additionally expand this risk prediction framework to the important step of health impact assessment, notably through age-standardisation of the burden estimates and accurate uncertainty assessment. The framework is structured in eight separate sections introducing analytical developments at various stages. Each section represents a package that can be considered or discarded depending on the objective of the analysis using this framework. It is illustrated through a case-study application using a real multi-location database of Italian cities. The example application is fully reproducible using code and data freely available in an online repository.
Data
The case study demonstrates an application of the framework in an analysis of temperature-mortality associations in 87 Italian cities within the period 2011 to 2021. The list of cities represents a sub-sample of a large urban database defined by Eurostat. 25 To illustrate one of the extensions, specifically related to the prediction of the risk to new locations, we hold out the data for 27 (30%) of the cities, considering them as unobserved and assuming that no mortality data is available to directly estimate temperature risks. The list of cities and specific details are available in supplementary materials.
Each city includes series of daily mortality counts and mean temperature. Mortality series are extracted from a dataset made publicly available by the Italian National Institute of Statistics (ISTAT) that includes all deaths from 7904 municipalities across Italy. 26 We construct city-specific series by aggregating deaths for any cause from municipalities within the selected cities for five age groups (0–44, 45–64, 65–74, 75–84 and 85 and older). Temperature series are extracted from the fifth generation of European Reanalysis (ERA5)-Land dataset, which provides daily mean temperature at 2 m on a global grid of approximately 9 km. 8 Series are constructed by averaging pixel centroids contained within city boundaries provided by Eurostat.
We also defined 21 city-specific meta-variables representing socio-economic, land-use, environmental and climatic factors, extracted from the Eurostat urban and regional databases as well as from various reanalysis and remote sensing products. These 21 meta-variables are used to characterise differences in local vulnerability. We extracted death rates, population size and life expectancy for the five age groups in each city from Eurostat. These statistics are used to compute baseline mortality series and impact measures. Finally, we also extracted point locations for each city from OpenStreetMap data. The full list and definitions are provided in supplementary materials and provided in previous work. 22
Methodological framework and results
In this section, we present eight main steps of the extended methodological framework, each as a self-contained package with its own section. Relations between packages and the workflow of the analysis are shown in Figure 1. Within each section, we introduce the methodological details, the specific choices made for the temperature-related mortality application and the results of this application. The structure is replicated in the R scripts reproducing the analysis.
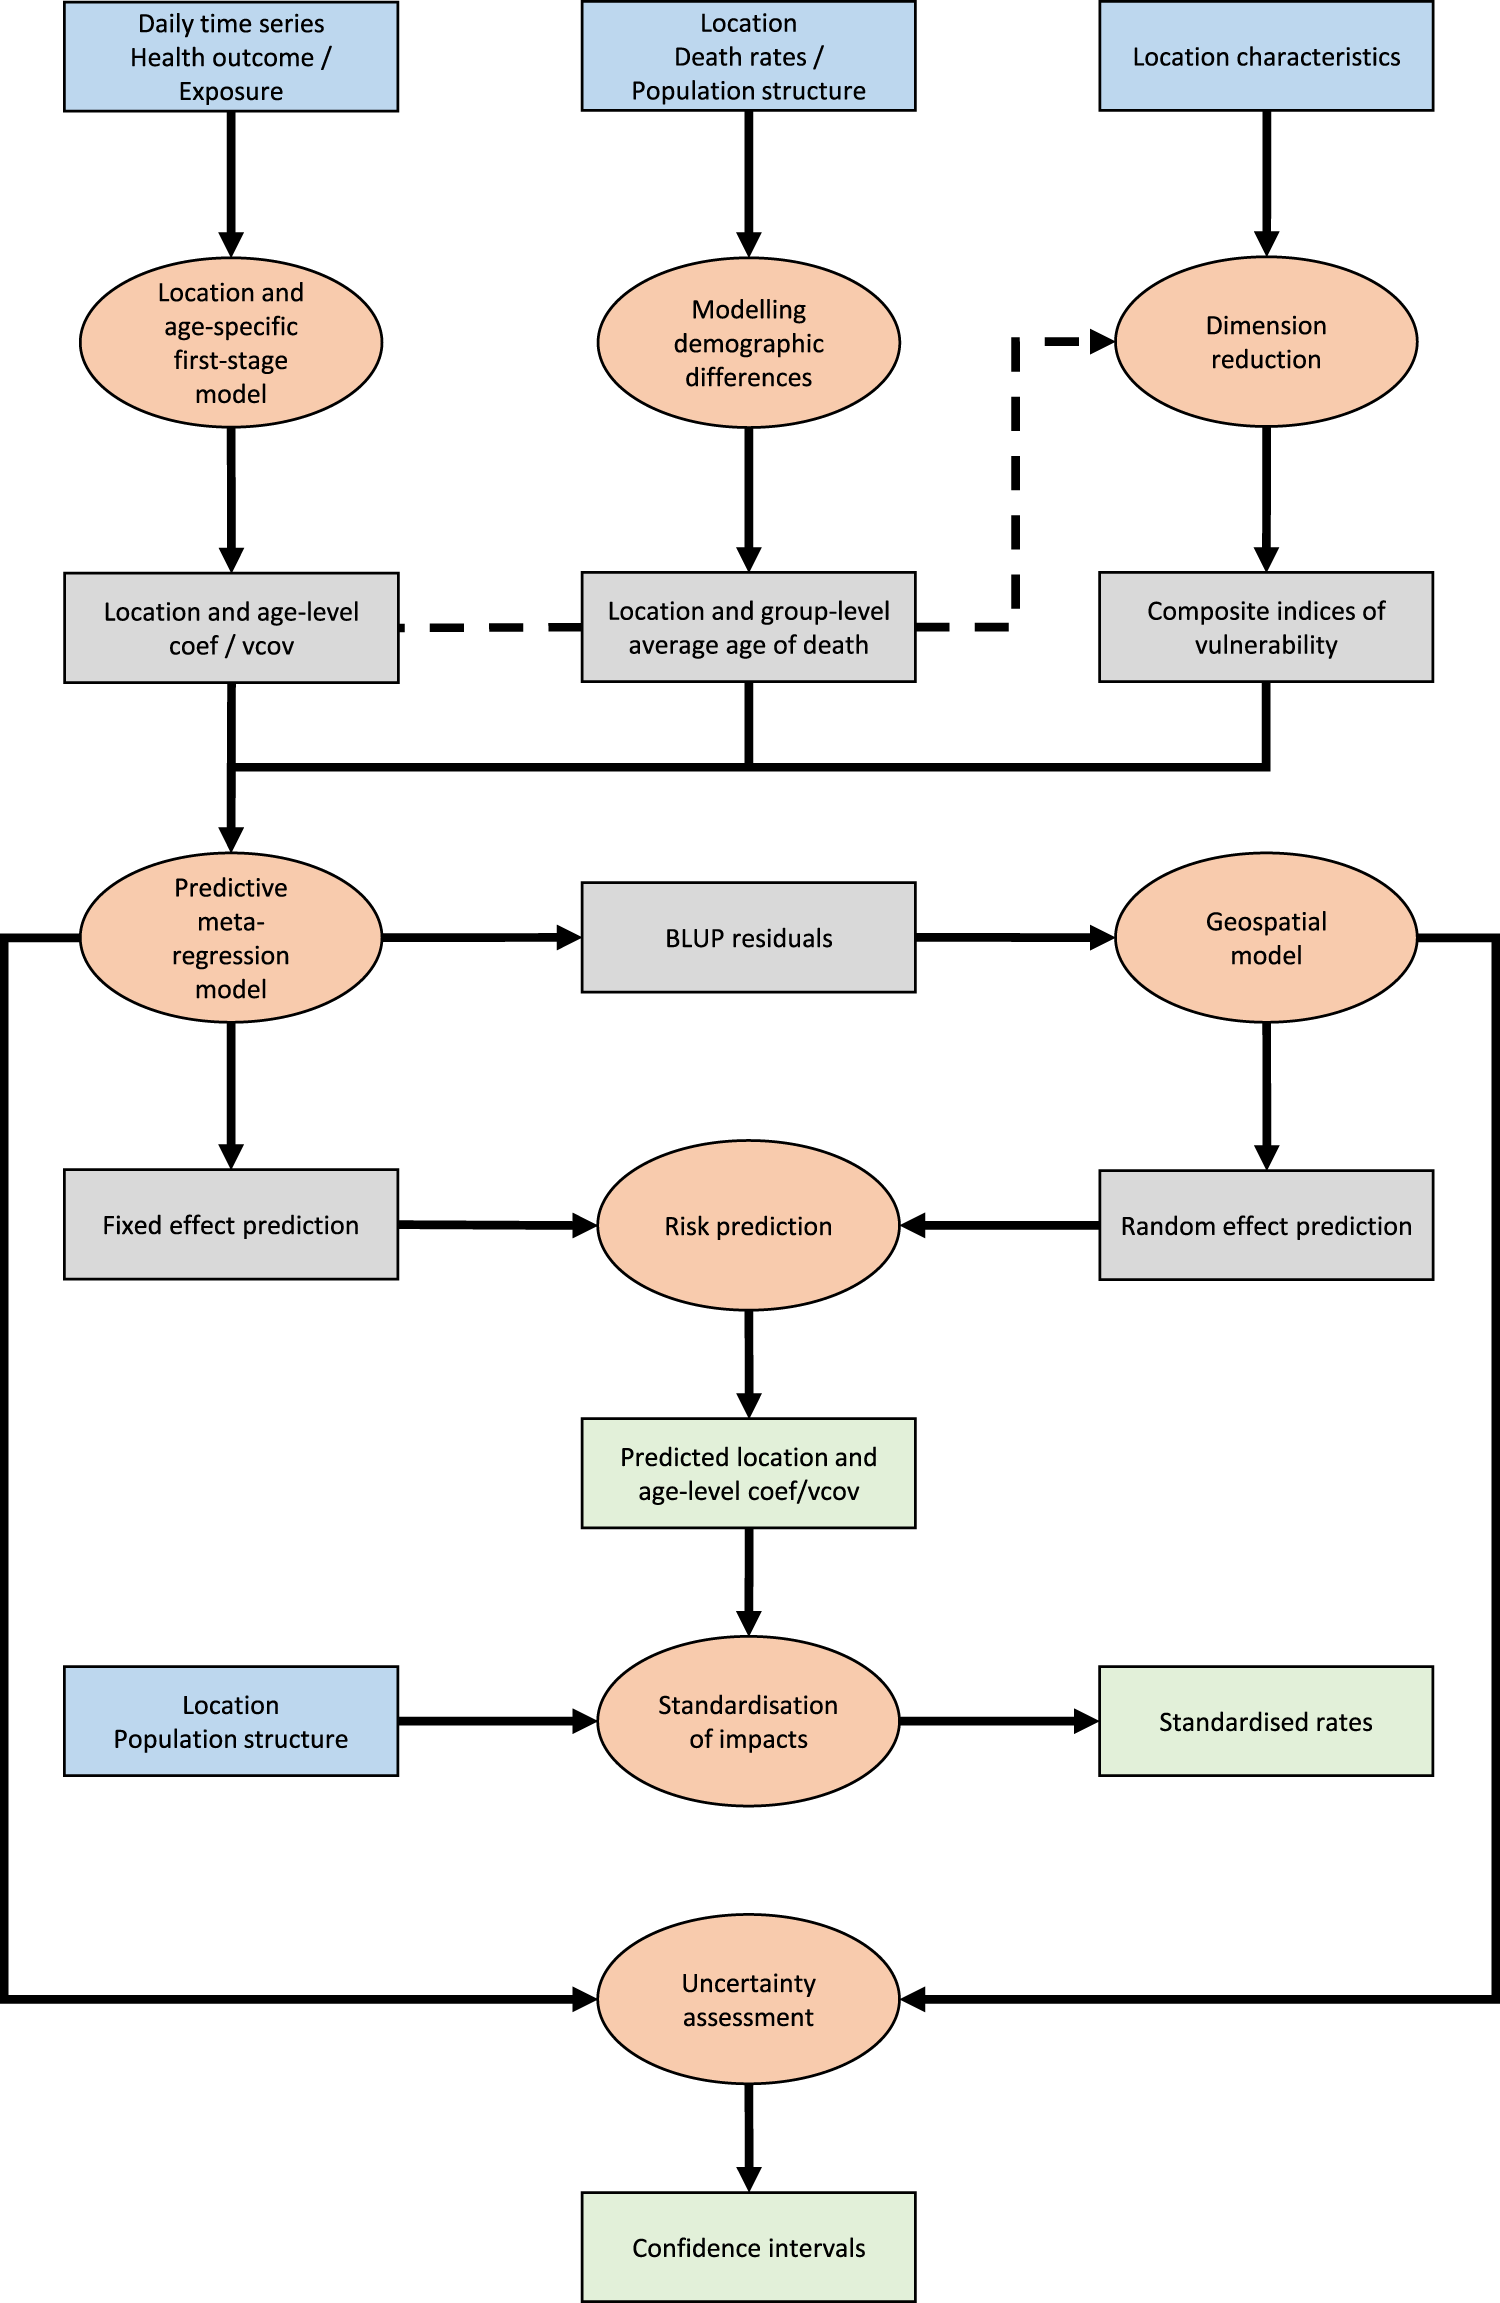
Flowchart describing the eight steps of the predictive framework. Orange ellipses indicate the eight steps, while rectangles indicate data, with blue being input data, grey being intermediate data and green being results. For color figure, see online version.
Motivation and description
The first step of the methodological framework is to estimate location- and age-specific first-stage associations between the exposure and health outcome of interest where available. Generally, the objective of the first-stage model is to obtain an estimation of a vector of parameters

The association of interest is represented by the flexible function f that can be non-linear and includes lags l. This function is uniquely defined by the parameter vector
The present application follows a time series design, in which
Modelling demographic differences
Motivation and description
When age groups a are defined in Section 3.1, the next step is to attribute an age variable
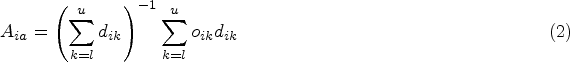
In the present application, we apply formula (2) for age groups 0–44, 45–64, 65–74 and 75–84, and life expectancy at 85 for age group 85+. For the youngest age group, this results in values of
Composite indices of vulnerability
Motivation and description
Vulnerability to an environmental stressor depends on many local characteristics that can feature the local climate as well as socio-economic, topologic and environmental conditions.
33
These factors are therefore predictors of the local risk represented by the vector
To combine the contributions of many potential drivers of vulnerability, we resort to dimension-reduction techniques. Using a (potentially large) number P of local characteristics for location i, defined by the P-length vector
Application
We choose PLS as it tends to more efficiently summarise the information in a limited number of components, especially when the objective is then to predict an outcome. 37 To illustrate the nature of these composite indices of vulnerability, Figure 2 shows the correlation between the first six PLS components obtained on the Italian dataset and the original 21 city-specific characteristics. While the interpretation of each component is somewhat subjective, the plot shows for instance that the second component tends to represent greener and inland cities, while component 4 represents an urban-rural separation.
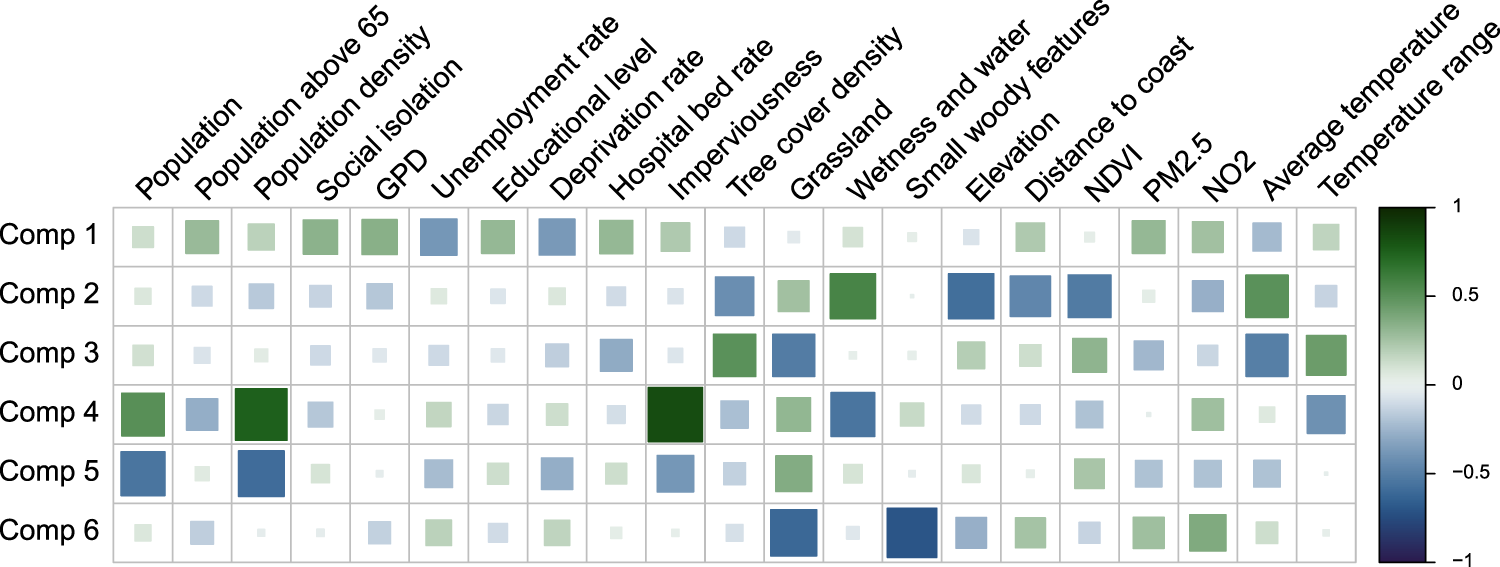
Linear correlation between meta-predictors and partial least-squares (PLS) components. Square size and colour both indicate the correlation magnitude. For color figure, see online version.
Motivation and description
Once first-stage coefficients representing city and age group-specific ERFs
The predictive model can be expressed as a multilevel multivariate meta-regression model,
14
defined as:

From model (3), best linear unbiased predictions (BLUPs) are usually computed, in which locations with high first-stage variance are pulled towards locations with more accurate first-stage estimate and similar fixed-effect values, that is

In the illustrative example, the fixed-effect matrix
To illustrate disaggregation of age groups, Figure 3 shows the average ERF predicted at four different age values when composite indices
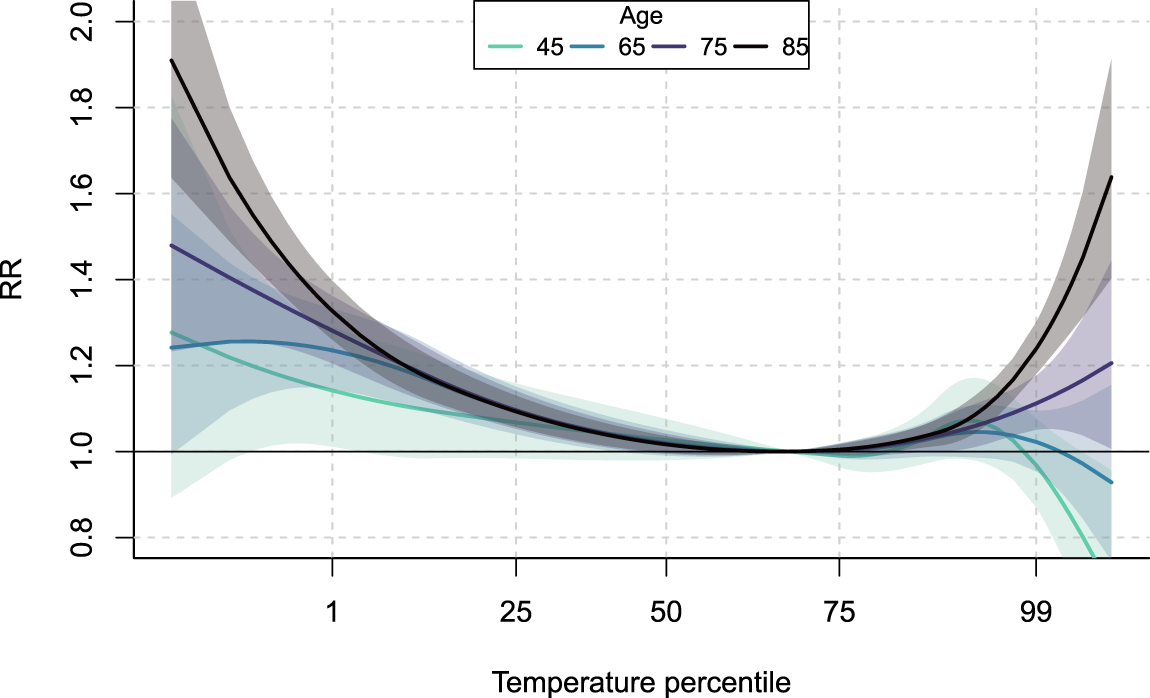
Average exposure-response relationships at various age values predicted from the meta-regression model. Shaded areas indicate the 95% confidence interval. For color figure, see online version.
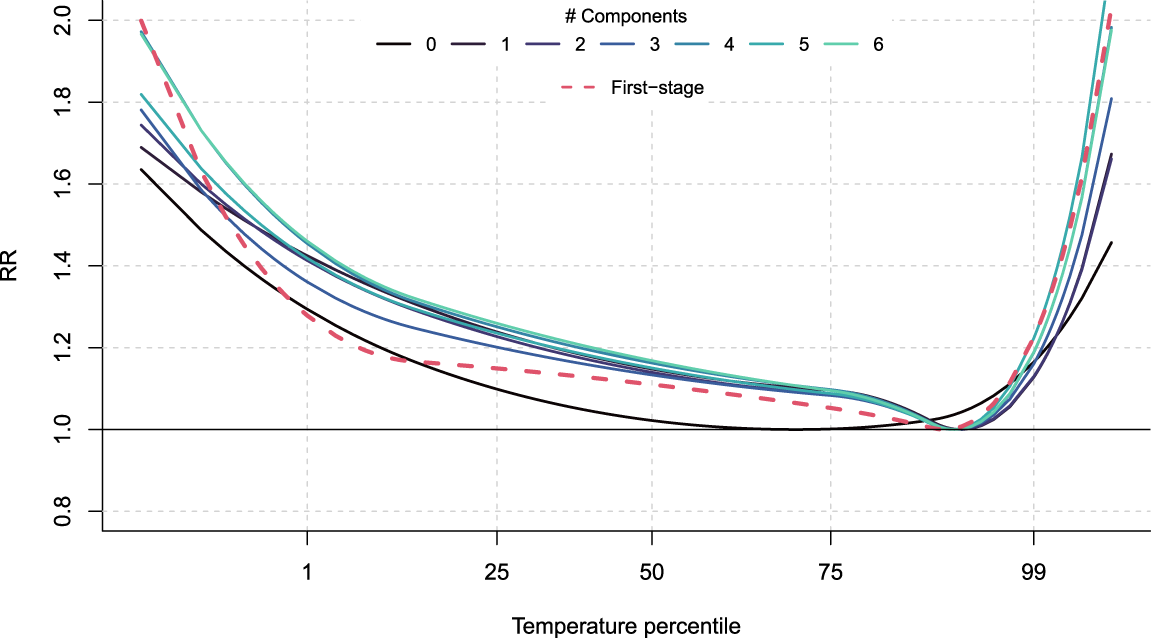
Predicted overall cumulative exposure-response relationships for the age group 75–85 in the city of Turin when including different number of PLS components. For color figure, see online version.
Motivation and description
Despite the wealth of information included in the predictive model of equation (3), fixed effect predictions
BLUPs residual coefficients
Application
In this application, we consider kriging, which is a well-established geostatistical method that results in the BLUP in the context of Gaussian random fields, while being easily extendable to multivariate outcomes and offering measures of variance of the extrapolation. More specifically, an isotropic kriging is performed considering a Gaussian model with nugget effect fitted by least-squares on the empirical semi-variogram. We describe kriging in more detail in supplementary materials. In our illustrative example, the map in the left-hand panel of Figure 5 shows BLUP residuals
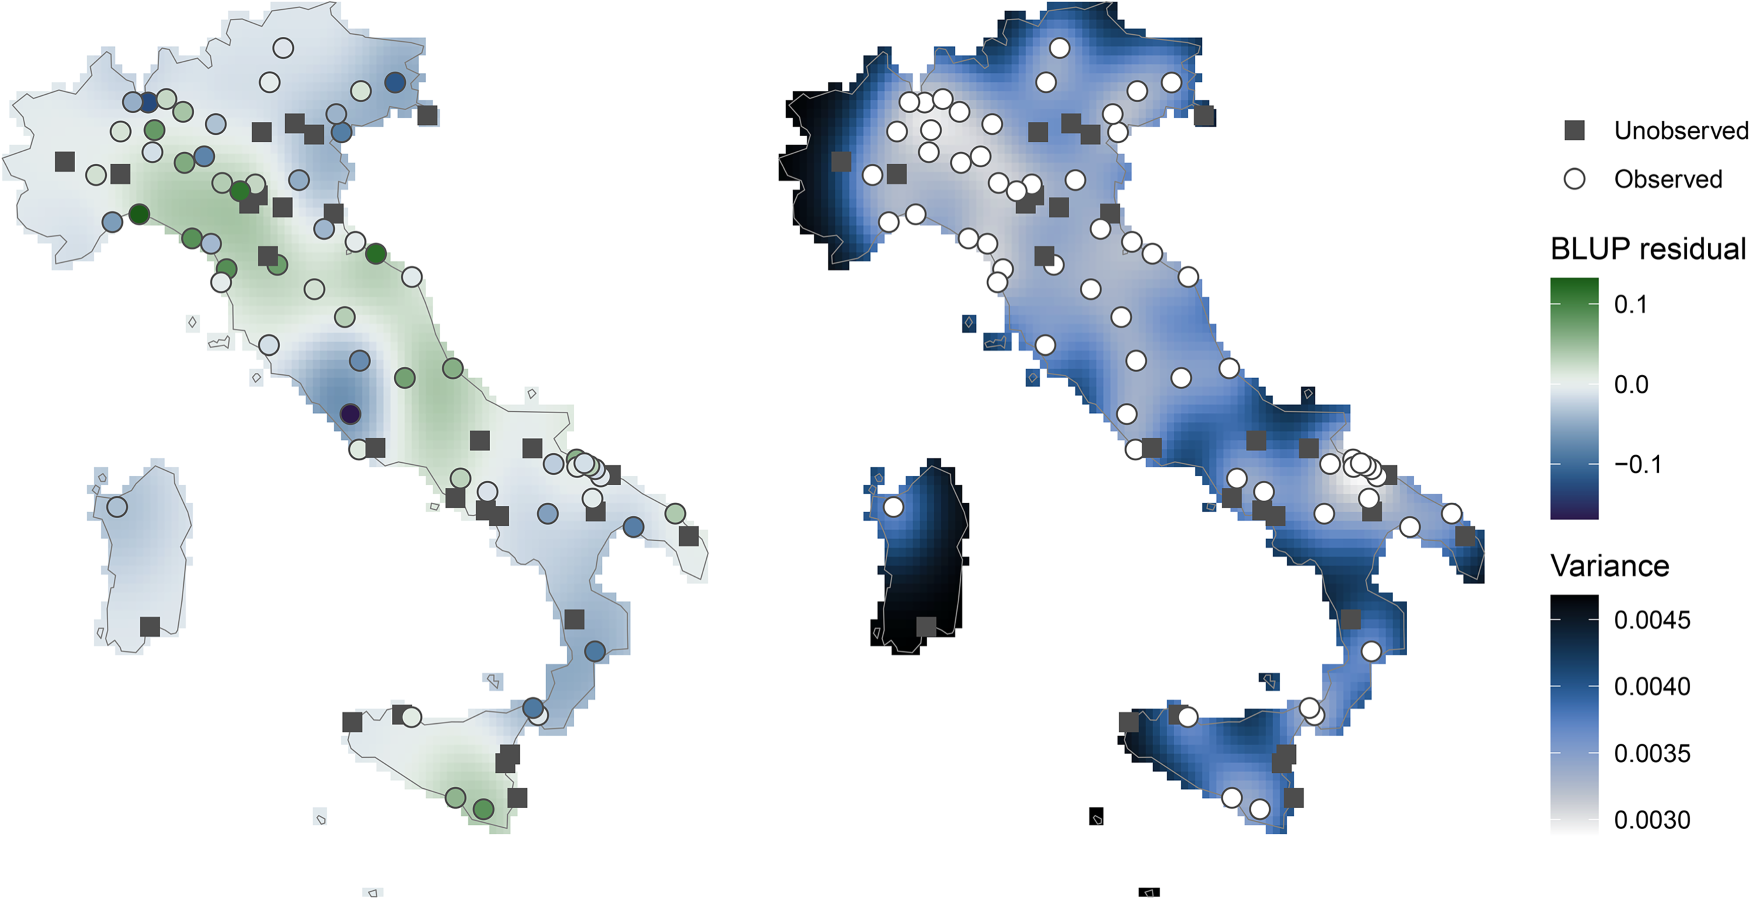
Maps of BLUP residuals of the second spline coefficient
Motivation and description
Once the predictive meta-regression (3) and the geo-spatial models are fitted, the risk associated with the exposure of interest can then be fully predicted for unobserved locations. We apply the following prediction process: (i) compute the composite indices of vulnerability
Application
Examples of predicted curves are displayed in Figure 6 for age group 75–84 in a sample of ten unobserved cities. The plot shows how the framework allows to predict a wide range of ERF shapes and magnitude. The comparison of the curves highlights the discrepancy between northern and southern cities, even though latitude is not included in the meta-analytical model. Specifically, northern cities tend to have less steep relative risk curves for both heat and cold, which could be linked to less harsh summers and generally wealthier populations, as well as a much higher minimum mortality percentile, indicative of acclimatisation.
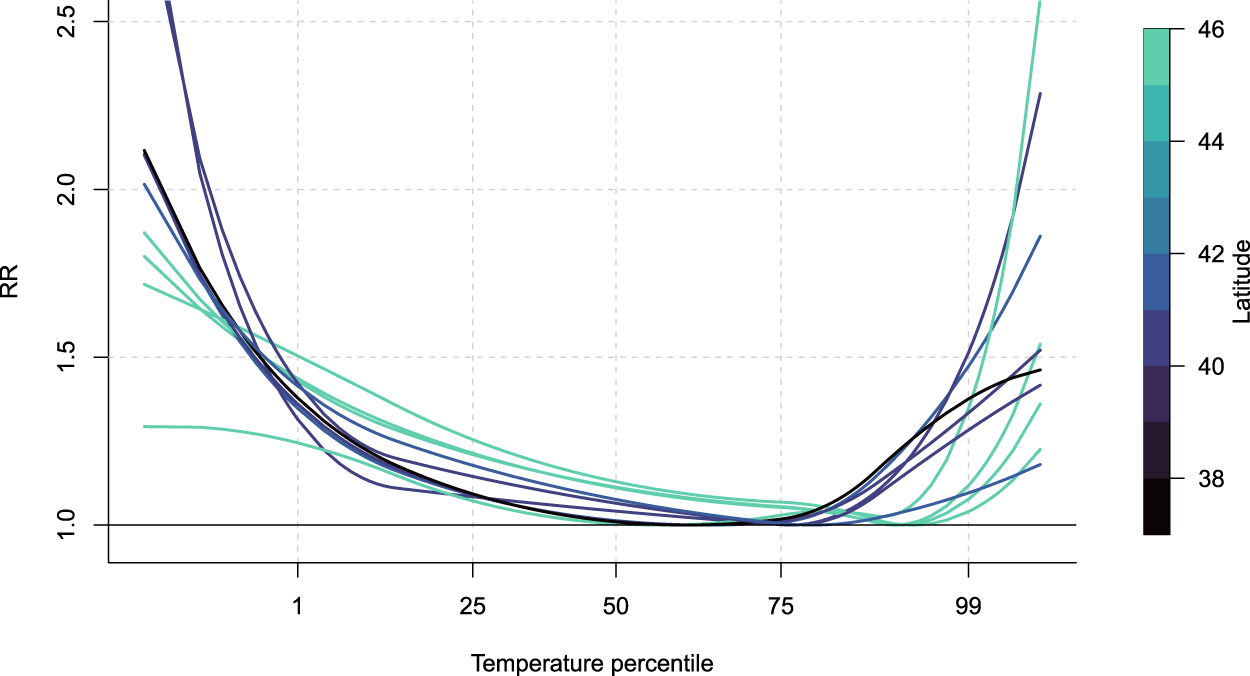
Predicted response functions at a sample of ten unobserved locations for age group 75–85. Colour gradient indicates latitude of the city, with darker colours indicating southern cities and lighter indicating northern cities. For color figure, see online version.
Motivation and description
Once predictions of the coefficients
In large multi-location settings, these indices have important limitations in quantifying and comparing impacts of the exposure across populations. 45 First, attributable measures offer an incomplete picture of the actual impact on a population, depending on its size and its outcome-specific mortality rate. Second, and more importantly, they do not account for demographic differences. Since both the age structure and age-specific risks usually vary between locations, the comparison of attributable numbers and fractions can be biased by demographic differences, and mask variation in vulnerability due to other factors, such as the environment or the socio-economic conditions of the populations. A more appropriate impact measure is the excess rate, which can be reported as both age-specific or standardised using a reference population.
Age group-specific excess mortality rates

In this application, standardised rates (5) are computed using the average Italian demographic structure as a reference. Figure 7 illustrates the effect of standardisation on the excess mortality in five cities with different age structure. The extremes are Caserta, which displays a young population with a large proportion below 40 years old, and La Spezia, characterised by a much older population (left-hand panel). The right-hand panel shows that standardisation increases the estimated excess mortality rates in the younger cities of Caserta and Cagliari and decreases it in the older city of La Spezia. On the other hand, the figure is almost unchanged in Varese and Forli where the age structures are very close to the average Italian age structure.
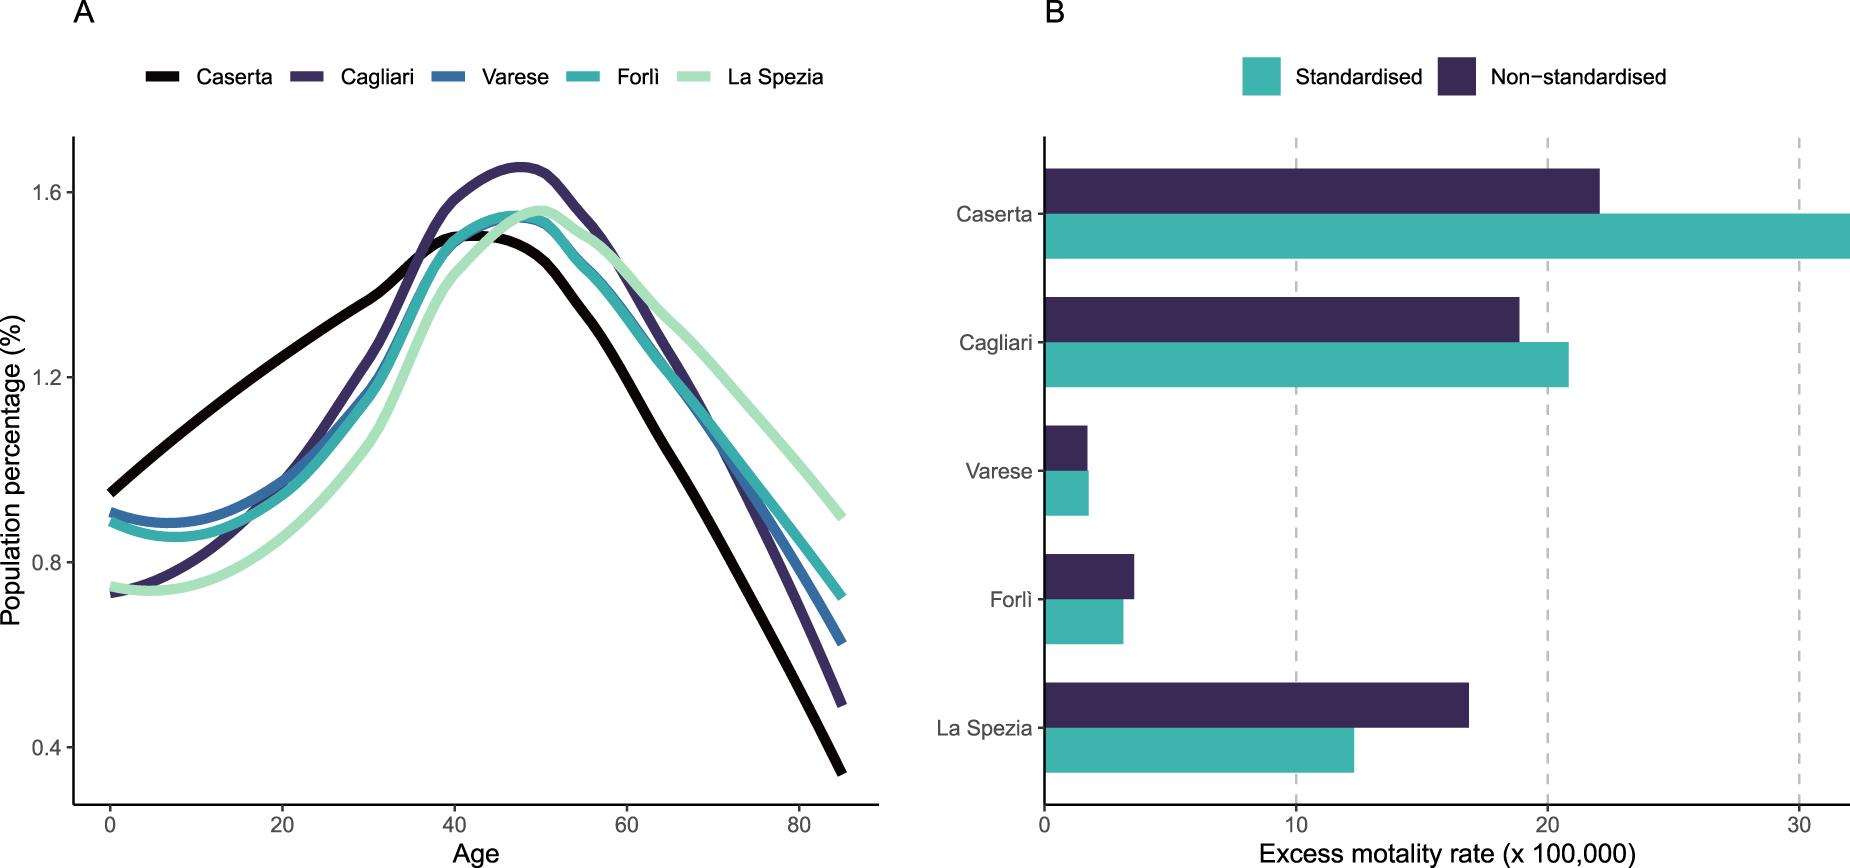
Standardisation of excess mortality rates in five Italian cities: (a) age distributions and (b) difference between standardised and non-standardised excess mortality rates. For color figure, see online version.
Motivation and description
Given the complexity of public health impact measures such as the AF or standardised excess mortality rates described above, closed-form formulae are not easily derived to define standard errors and confidence intervals for these measures.
46
Therefore, we usually resort to empirical confidence intervals (eCI),
47
computed by simulating a large number N of synthetic spline coefficients from city and age group-specific coefficients
The established method to simulate synthetic spline coefficients is to sample from the central estimate
To account for this dependency, simulations must be performed from the original source of uncertainty, which is the predictive meta-regression model. Therefore, instead of simulating from predicted coefficients
Application
Figure 8 shows various confidence intervals obtained through
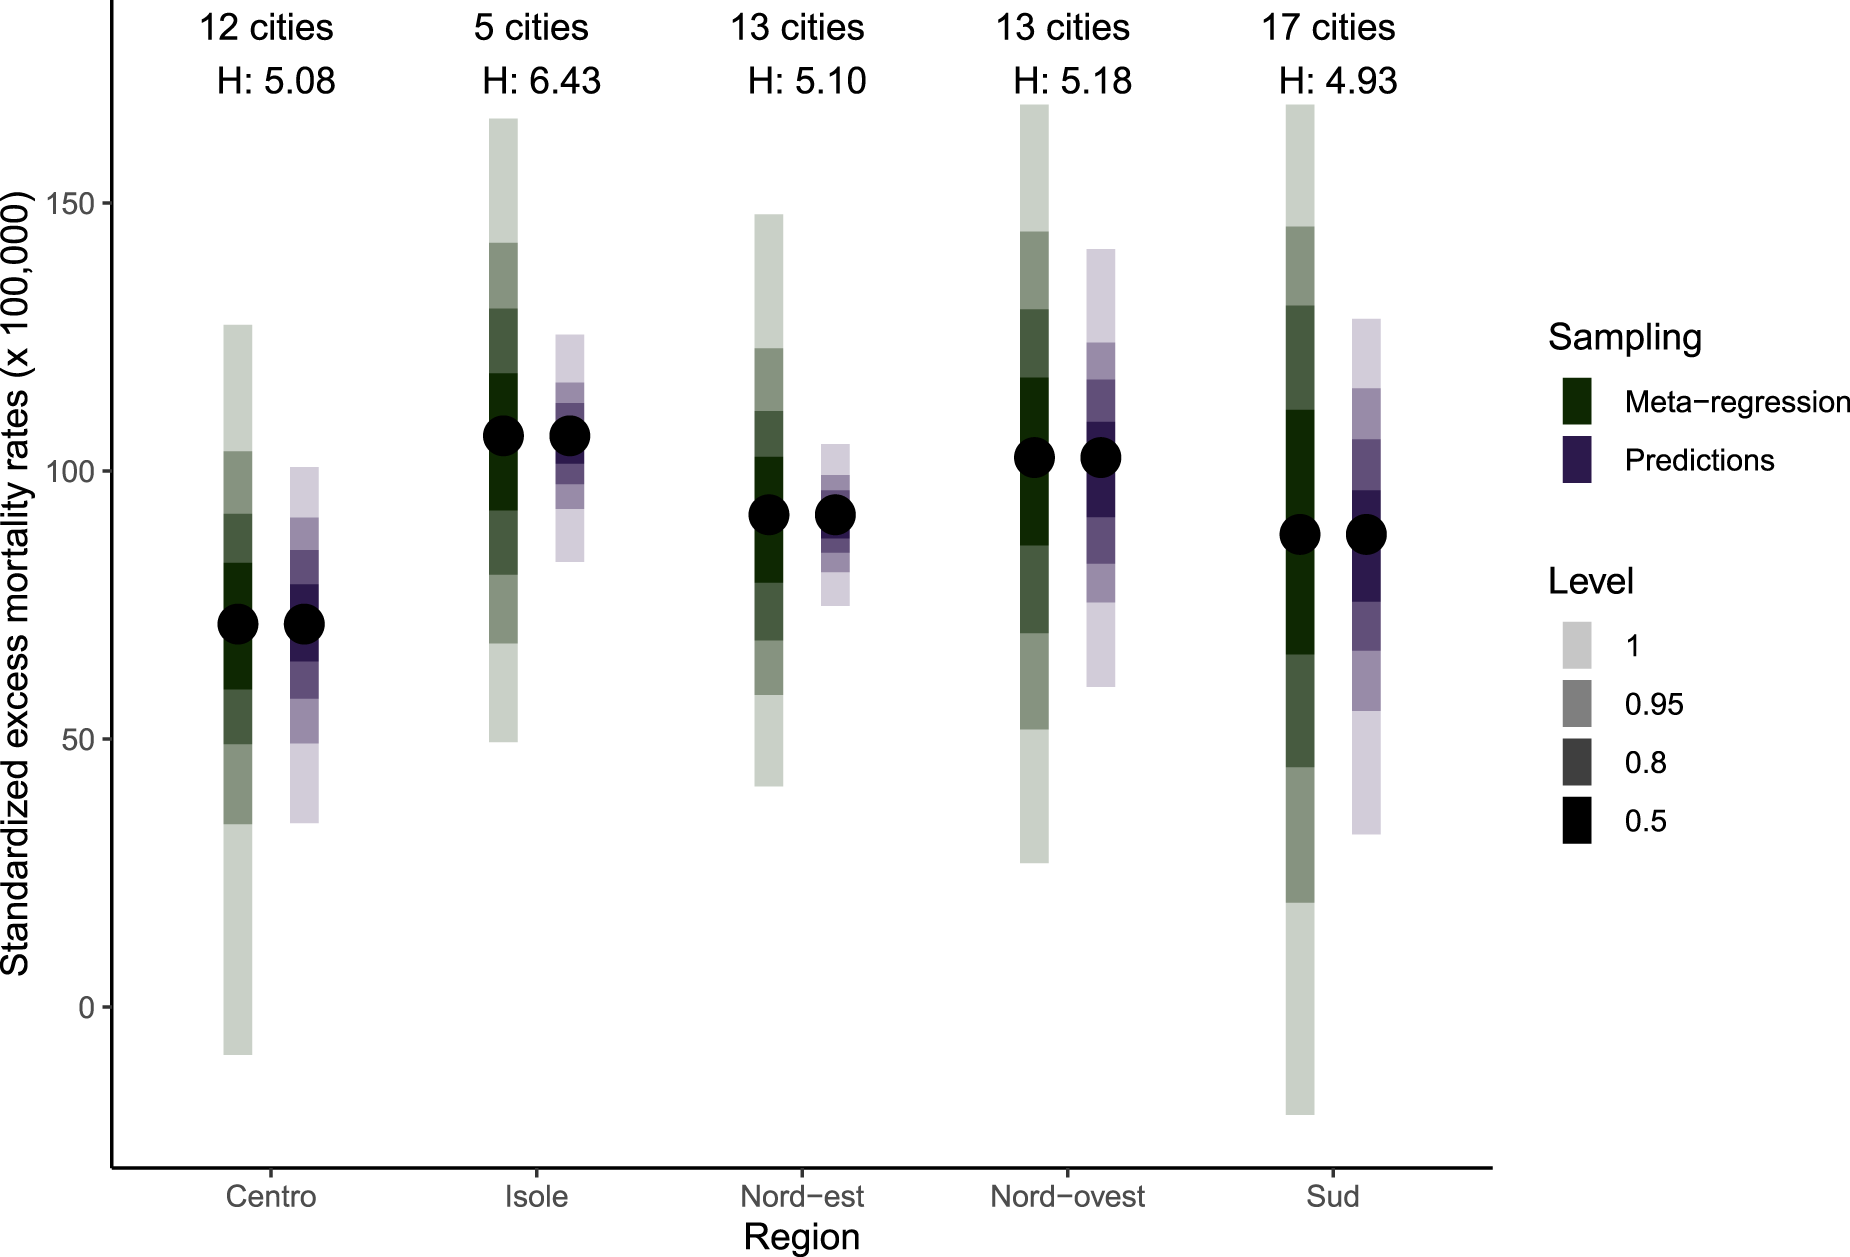
Distribution of standardised excess mortality rates over 1000 Monte Carlo simulations with the point estimate and 95% confidence intervals. Meta-regression indicates that simulations are performed at the meta-coefficients levels and predictions that simulations are performed using the predicted coefficients for each location and age group. The H score represents the regional heterogeneity statistic. For color figure, see online version.
We evaluate the predictive power of the proposed framework on the holdout cities selected in section 2. The reference to which the framework is compared is a classical two-stage analysis of the full set of cities. This is done by applying steps 1 to 4 of the predictive framework (first-stage to predictive meta-regression model), and computing predicted relationships for the 27 unobserved cities. All methodological details, including the specification of the DLNM cross-basis and the terms of the predictive meta-regression model, are identical to the application described in Section 3. We therefore compare the computed reference BLUPs to the predicted ERF when these 27 cities are considered unobserved.
Figure 9 shows the root-mean-squared error between predicted ERFs and the reference ERFs described above for the 27 unobserved cities, and compares it to the first-stage estimates for these same cities. It indicates the predicted ERFs tend to be close to the reference ones with a RMSE generally below 20%, and almost null for Heat and Total in the oldest age groups. This is confirmed by the predicted ERF in supplementary material that tend to be close to the BLUP ones. By contrast, there is a large difference between first-stage ERFs and the reference ones, showing that the prediction framework is able to capture differences between locations and age groups.
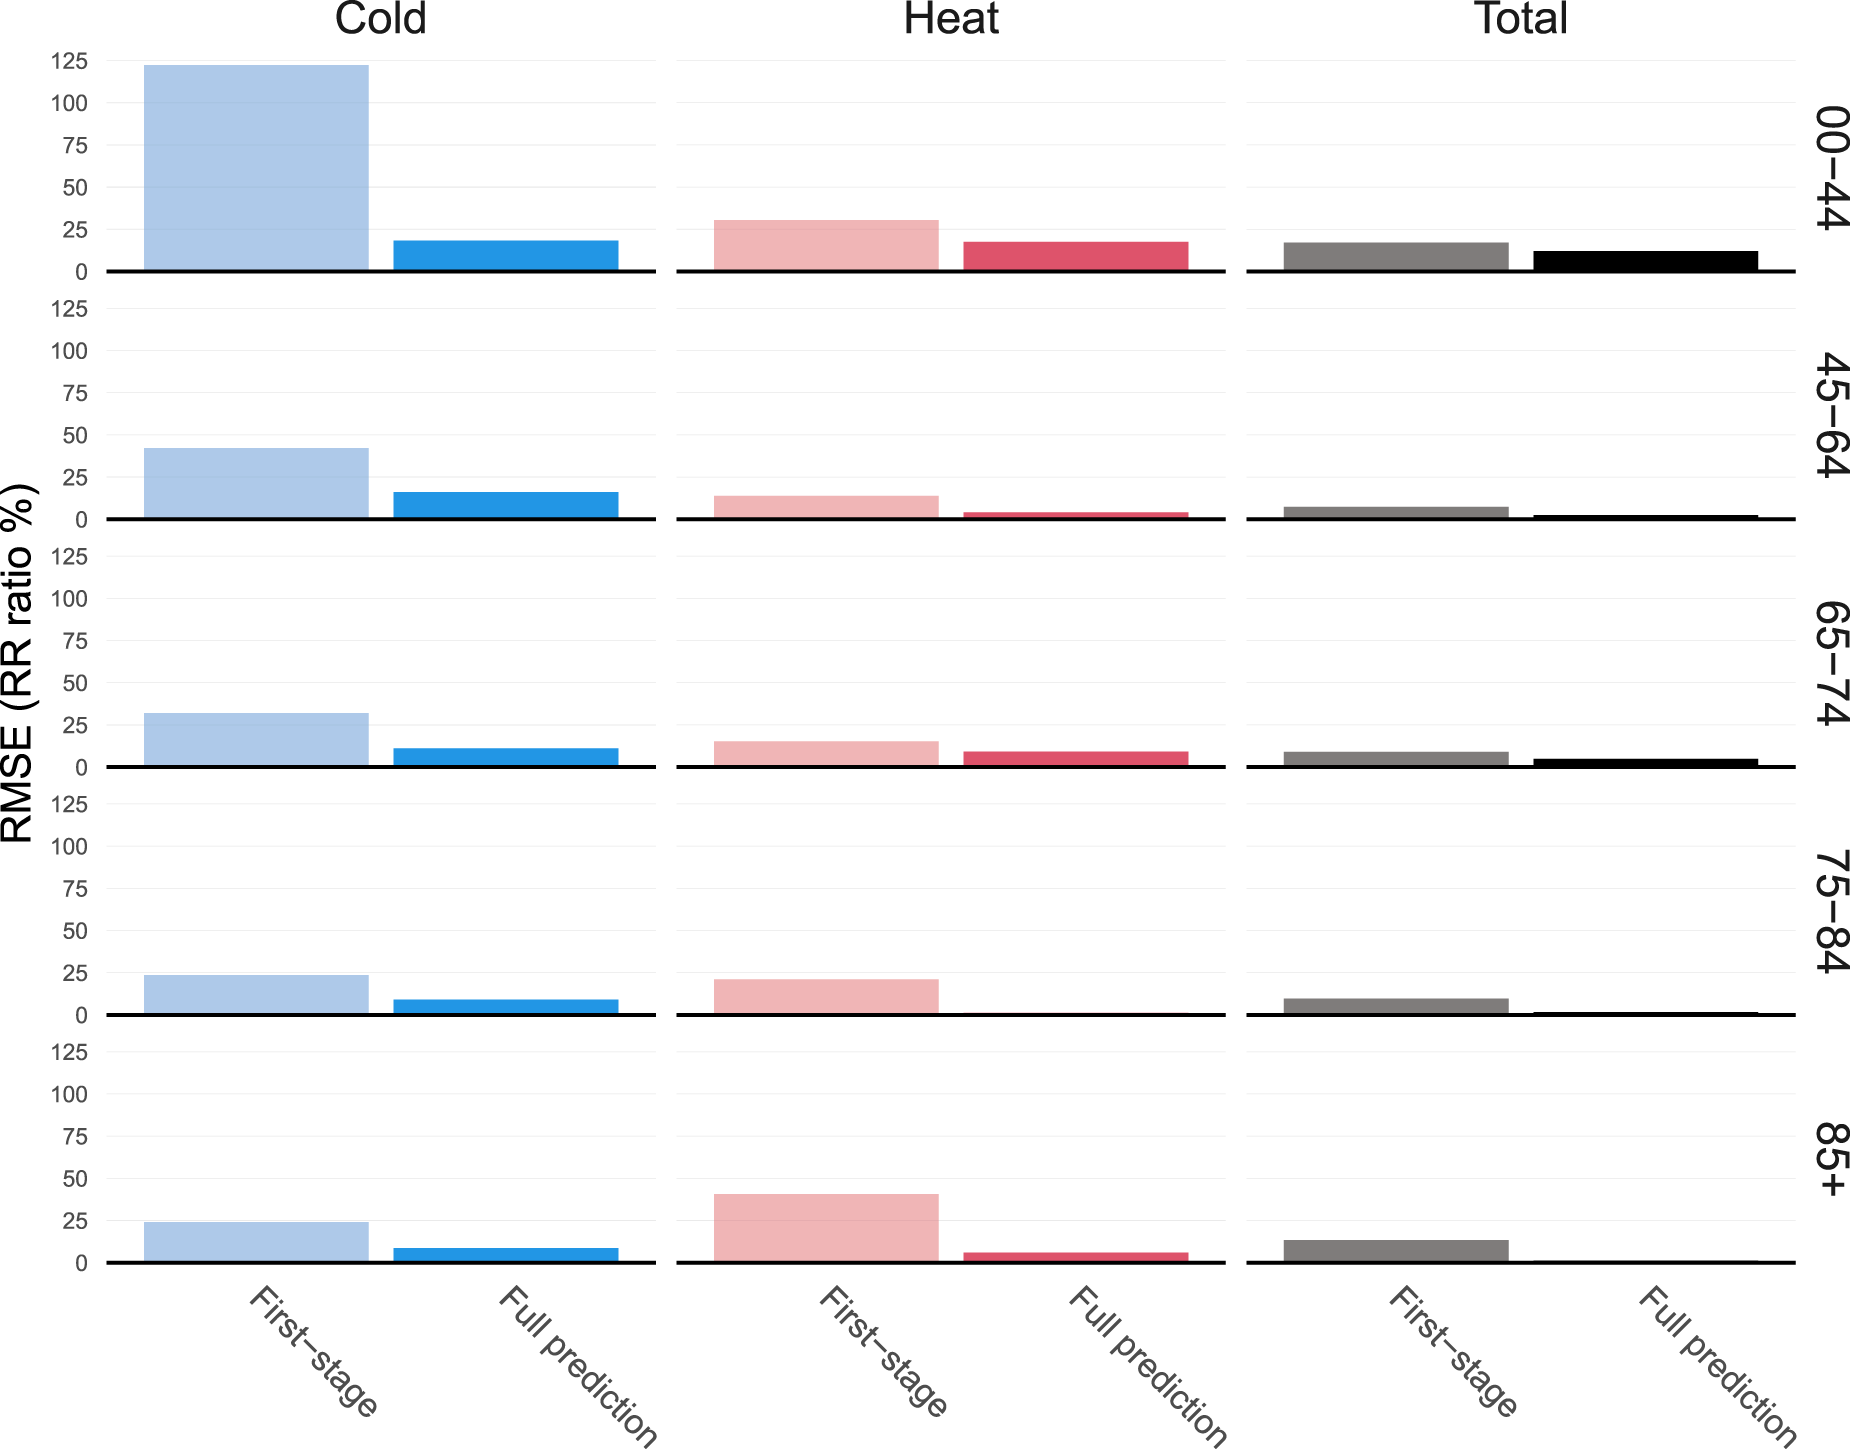
Root mean squared error (RMSE) of first-stage and predicted exposure-response functions (ERF) compared to best linear unbiased predictions (BLUPs) from a full two-stage analysis. RMSE is expressed as a relative increase on the relative risk (RR) scale, that is as exp(RMSE) – 1. The Total column represents RMSE computed on the whole ERF while the Cold and Heat columns restrict the RMSE on the temperature below the 5th percentile, and above the 95th percentile, respectively. For color figure, see online version.
Comparing the different columns of Figure 9, it is clear that predictive performances are better in the middle of the ERF, and are usually the worst on the cold part of the ERF curve. There are also large differences between age groups, with the biggest RMSE found for the youngest group. These differences highlight poorer prediction performances where uncertainty is usually at its highest because of low mortality counts.
In this contribution, we propose a cohesive set of modelling extensions for the two-stage framework used for risk estimation and health impact assessment in environmental epidemiology. This framework provides an accurate prediction of risks and impacts of environmental exposure on a health outcome, harnessing the modelling of major drivers of vulnerability, including age as well as any local characteristic potentially modifying the risk associated with the exposure. The inclusion of these local characteristics in a predictive meta-regression model, together with the spatialisation of the random part of BLUPs, provides an improved spatial representation for locations with no available outcome data. Finally, this framework offers improvements in the quantification of impacts, through the computation of standardised excess mortality rates to account for local age structures, and through a revised Monte Carlo simulation scheme that better represents the original source of uncertainty in the modelling.
This new framework builds upon previous work on two-stage modelling strategies, and it extends their applicability in a variety of situations including complex multilevel structures or longitudinal studies. 15 The generation of flexible predictive models that incorporate contributions from various effect modifiers, as well as the separate modelling of fixed and random parts of BLUPs, the latter using geostatistical methods, extends the capabilities of multi-location studies. This has enabled large scale analysis of differential risks by age group, 49 as well as substantially increasing the coverage of recent health impact assessments. 22 This framework have also been used to downscale risks and impacts at small scales where power is lacking to obtain accurate estimates. 24 This framework can be applied to study the health impacts in various scenarios, whether it is the implementation of urban policies aiming to increase the tree cover density, 50 disentangling the role of specific components of air pollutants, 35 or adaptation pathways in future climate. 51
There are still important limitations to the applicability of this new framework. First and foremost, several stages rely on the availability of a consistent database of location-specific characteristics. This is not an issue in areas such as Europe or the United States, but it is an important limitation in areas with more data scarcity such as lower- and middle-income countries. Besides, the complexity of the framework necessitates a large number of available locations to achieve good predictive power. The validation study, along with previous studies including a multi-city analysis in Europe, 22 show that there remain uncaptured risk differentials, even after the spatialisation of BLUP residuals. Indeed, contributions of vulnerability drivers can be highly complex, with potentially non-linear effect modifications and interactions between local characteristics. Modelling such complex patterns is possible in theory, although in practice it poses important methodological and computational problems. Finally, the framework is focused purely on risk prediction, with the intent to provide an accurate picture of risks and impacts of the exposure of interest. In particular, the use of dimension reduction techniques in the second stage is valuable for combining contribution of multiple vulnerability drivers, but it is not suitable to infer independent effect modification of individual local characteristics.
The validation study performed here shows satisfactory predictive performances by the proposed framework, but it remains to be evaluated at a larger scale. Indeed, Italy remains a populous country with clear heat-related mortality effects. Poorer performances on the youngest age group suggest that the predictive performances of the framework could be lower in more modest contexts. The context of multi-location studies in environmental epidemiology also renders any validation difficult, since there is no clear outcome variable to be predicted by the modelling. First-stage ERF estimates are subject to important uncertainties, and mortality time series depend on many location- and age-specific factors that need to be controlled for. Therefore, additional research is needed on the evaluation of such a framework to conduct health impact assessments in understudied locations such as the African continent or the Middle-East.
The limitations exposed above outline the need for further methodological development, specifically focusing on risk prediction in order to capture the high complexity of vulnerability to environmental exposures. This includes the development of machine learning methods for meta-regression to improve fixed effect prediction, 21 as well as methods to integrate the spatialisation of risk, such as spatially structured random effects. Additional work is also needed on the evaluation of such a framework as the predictions are here compared to BLUPs which presents uncertainties and inherently depends on the chosen meta-regression model.
In conclusion, this contribution illustrates a modelling extensions for multi-location analyses of environmental risk factors, addressing known limitations of established methods. The framework builds on recent developments in two-stage designs and meta-analytical methods, as well as implementing sophisticated statistical techniques to model complex associations that vary between and within populations.
Supplemental Material
sj-zip-1-smm-10.1177_09622802241313284 - Supplemental material for Modelling extensions for multi-location studies in environmental epidemiology
Supplemental material, sj-zip-1-smm-10.1177_09622802241313284 for Modelling extensions for multi-location studies in environmental epidemiology by Pierre Masselot and Antonio Gasparrini in Statistical Methods in Medical Research
Supplemental Material
sj-docx-2-smm-10.1177_09622802241313284 - Supplemental material for Modelling extensions for multi-location studies in environmental epidemiology
Supplemental material, sj-docx-2-smm-10.1177_09622802241313284 for Modelling extensions for multi-location studies in environmental epidemiology by Pierre Masselot and Antonio Gasparrini in Statistical Methods in Medical Research
Footnotes
Acknowledgements
The authors would like to thank Malcolm Mistry for providing the ERA5-Land temperature time series at the selected locations.
Data availability
The data and computer code are freely available on the corresponding author's Github.
Declaration of conflicting interests
The authors declared no potential conflicts of interest with respect to the research, authorship and/or publication of this article.
Funding
The authors disclosed receipt of the following financial support for the research, authorship and/or publication of this article: This work was supported by the EU Horizon 2020 and Medical Research Council (grant numbers 820655 and MR/R013349/1).
Supplemental material
Supplemental material for this article is available online.
References
Supplementary Material
Please find the following supplemental material available below.
For Open Access articles published under a Creative Commons License, all supplemental material carries the same license as the article it is associated with.
For non-Open Access articles published, all supplemental material carries a non-exclusive license, and permission requests for re-use of supplemental material or any part of supplemental material shall be sent directly to the copyright owner as specified in the copyright notice associated with the article.