
Abstract
In stopping the spread of infectious diseases, pathogen genomic data can be used to reconstruct transmission events and characterize population-level sources of infection. Most approaches for identifying transmission pairs do not account for the time passing since the divergence of pathogen variants in individuals, which is problematic in viruses with high within-host evolutionary rates. This prompted us to consider possible transmission pairs in terms of phylogenetic data and additional estimates of time since infection derived from clinical biomarkers. We develop Bayesian mixture models with an evolutionary clock as a signal component and additional mixed effects or covariate random functions describing the mixing weights to classify potential pairs into likely and unlikely transmission pairs. We demonstrate that although sources cannot be identified at the individual level with certainty, even with the additional data on time elapsed, inferences into the population-level sources of transmission are possible, and more accurate than using only phylogenetic data without time since infection estimates. We apply the proposed approach to estimate age-specific sources of HIV infection in Amsterdam tranamission networks among men who have sex with men between 2010 and 2021. This study demonstrates that infection time estimates provide informative data to characterize transmission sources, and shows how phylogenetic source attribution can then be done with multi-dimensional mixture models.
Introduction
Genomic surveillance of human pathogens is increasingly used to help combat the spread of infectious diseases such as COVID-19, antimicrobial-resistant bacteria, Ebola virus, or HIV.1–5 This involves the sequencing of the genetic code of pathogen samples obtained from diagnosed individuals 6 or the environment such as wastewater,7,8 and then phylogenetic analyses are used to estimate ancestral relationships between samples based on an assumed model which describes the rate of mutation as pathogens evolve. 9 Inferred evolutionary relationships are represented by phylogenetic trees, in which branch lengths represent the degree of genetic variation between samples that appear as tips of the tree, and these phylogenetic trees are indicative of epidemic transmission networks among human hosts. 10 These methods can be used for example to detect new circulating pathogens or pathogen variants, 11 determine growth rates, 12 quantify modes of disease spread, 13 or characterize population-level drug resistance.14,15 Particular interest centers on reconstructing pathogen transmission, with the primary aim to identify population-level factors that underpin disease spread.16,17 It is usually not possible to determine with certainty from the genetic data alone that one individual is the source of infection in another person, particularly in the case of fast-evolving pathogens such as HIV. For instance, it is common to observe genetically near-identical HIV sequences between women, even though HIV transmission between women is highly unlikely, and molecular patterns of the near-identical virus suggest instead that one or more men of the same transmission chain remained unobserved. 18 For this reason, population-level inferences into the drivers of pathogen transmission focus on analyses that seek to harness the information contained in phylogenetic trees spanning all available samples,19–22 particular parts of phylogenetic trees,23,24 or a larger number of phylogenetically reconstructed transmission pairs.17,25,26 The latter approaches have proven particularly useful when additional data provide insights into the direction of transmission,10,27 as then flexible and computationally efficient regression methods using attributes of the likely source and recipient can be used to quantify transmission flows.28,29 Large sets of phylogenetic transmission pairs are typically identified using genetic distances between pathogen sequences or patristic distances along lineages in phylogenetic trees, sometimes coupled with additional criteria including the statistical support that the two individuals are part of the same sub-tree of the true, unknown phylogeny, or the depth of the lineage separating the two individuals, often expressed in units of calendar time. 30 In practice, these linkage criteria are often loosely justified, but especially those based on evolutionary distances can be more firmly grounded in statistical models on the expected number of genetic mutations under a generative evolutionary clock model.31,32 Clock models describe the genetic distance between two sequences in terms of the amount of time elapsed since the lineages leading to the two observed sequences diverged and are used widely to characterize pathogen evolution, including, for example, the evolution of novel severe acute respiratory syndrome coronavirus 2 (SARS-CoV-2) variants in immuno-compromised patients. 33 The challenge is to define the time elapsed, since the divergence time of the lineages leading to the observed sequences is unknown. We address this, using HIV as an example, by leveraging additional data that can be used to estimate the time since infection and approximate the time elapsed as the interval between the infection event and the sampling time of two observed sequences, which assumes that the two lineages diverged at the infection event (Figure 1). We then express the likelihood that observed genetic distances evolved within a specified time elapsed between two individuals under a standard evolutionary clock model. This approach can account for substantial natural heterogeneity in time elapsed when attempting to interpret genetic distances arising from variation in when HIV is transmitted, how late individuals are diagnosed, and when diagnosed individuals’ samples are sequenced. We then embed this transmission pair likelihood into a two-component Bayesian mixture model (BMM) to estimate posterior probabilities that pairs of individuals are actual transmission pairs, relative to a background noise distribution on genetic distances and time elapsed. We will see that the posterior transmission pair probabilities are themselves uncertain and so are not of immediate interest, but by aggregating the posterior transmission pair probabilities we can identify and quantify the drivers of transmission at population-level.
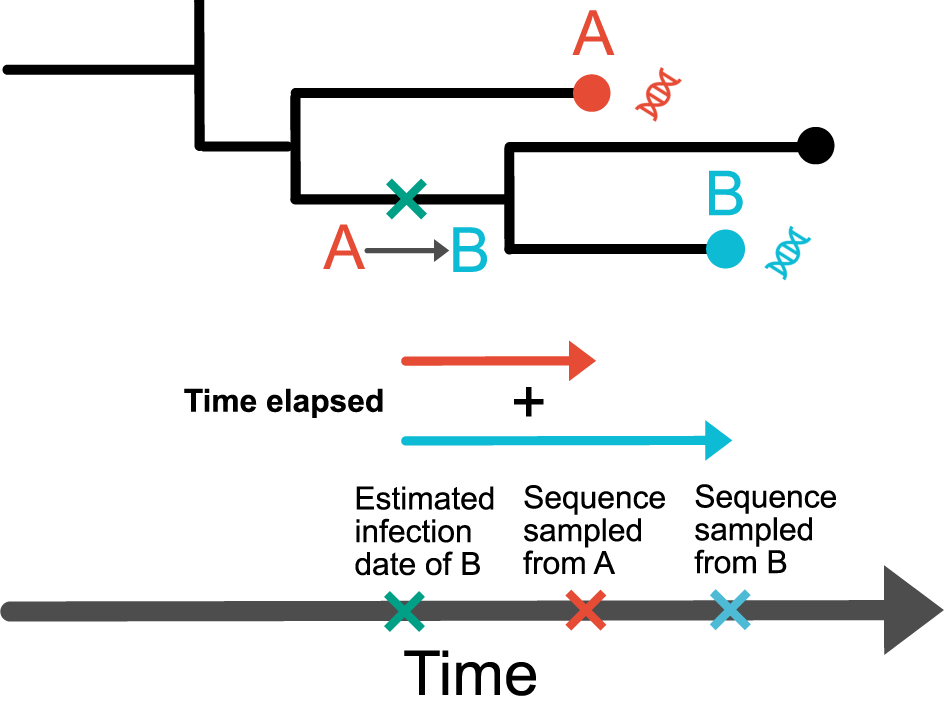
Schematic of a phylogenetic tree illustrating how to approximate time elapsed. We consider that A transmitted to B, with the sequence sampling dates of A and B known. We estimate the infection date of individual B and estimate the time elapsed as the cumulative time between the infection date of B and each of the sequence sampling dates of A and B.
BMMs are widely used to classify points into latent components of similar data, 34 characterized by a distinct probability distribution. As such, BMMs are a natural starting point for interpreting two-dimensional point patterns of genetic distances and time elapsed. We limit ourselves to allocating points probabilistically into two components—a signal and a background component—rather than exploring high or infinite-dimensional components, 35 as our primary interest centers on the population-level drivers of infection and not the point classifications. More fundamentally, unrelated pairs of individuals can have genetic distances and times elapsed that are compatible with the HIV evolutionary rate. This is a challenge because the number of all possible pairwise combinations of individuals far exceeds the number of transmission pairs. We adopt previous work that attaches generalized linear predictors to the BMM mixing weights to improve classification accuracy 36 and other big data reduction techniques, circumventing highly imbalanced classification problems. Sections 2.1 to 2.3 lay out the notation that we use to describe unknown transmission events and transmission flows, and the data available to estimate these. Section 2.4 introduces the Bayesian hierarchical evolutionary clock model that we use to represent the relationship between viral HIV sequences and the time elapsed between them. In Sections 2.5 to 2.7, we integrate the evolutionary clock model as a signal component of increasingly complex BMMs and describe how we estimate population-level transmission flows and population-level sources of transmission. Section 3 assesses the performance of the mixture model on simulated data, characterizes the accuracy of phylogenetic source attribution with BMMs, and presents techniques to improve classification accuracy when the number of unrelated pairs far exceeds the number of actual transmission pairs. In Section 3.5, we apply the method to characterize the age-specific drivers of HIV transmission between 2010 and 2021 among men who have sex with men (MSM) in Amsterdam, the Netherlands, who were part of phylogenetically reconstructed transmission chains. Finally, Section 4 summarizes our findings and discusses the application of our method to other pathogens.
Target quantities
Consider a population of


A subset of infected individuals are diagnosed, and we denote the number of diagnosed individuals infected with the pathogen by
All potential sources are epidemiologically possible sources of infection, based on the times elapsed and the available biomarker data used to estimate the times elapsed. We use the term “potential sources” to describe epidemiologically possible sources, which we distinguish from “phylogenetically possible” sources, and “likely sources” following inference under the Bayesian model that we describe further below.
The values of the
It is often possible to narrow down the potential sources of new cases based on demographic and clinical data, for example:
exclude pairs with a time elapsed >16 years, since each individual is likely to show symptoms within 8 years of seroconversion;
42
using mortality data, exclude pairs in which the potential source died before the estimated infection date of the recipient;
17
using migration and mobility data, exclude pairs in which the potential source did not reside in the study population by the estimated infection date of the recipient;43,44 and using clinical data, exclude pairs with evidence that the potential source was not infectious on the infection date of the recipient. In our HIV case study, we estimated subject-specific viral load curves with LOESS smoothers to longitudinally collected viral load measurements and considered individuals with viral loads below 200 copies of virus per milliliter blood as non-infectious.45,46
However, in our case study, the number of potential sources for each new case continues to be very large with these exclusion criteria applied, which motivates us to consider pathogen sequence data.
A smaller subset of infected individuals also have a pathogen sequence sampled, and we denote the number of diagnosed individuals with a sampled pathogen by

It is common to base phylogenetic inference of linkage on the number


We next develop a likelihood model for patristic distances and times elapsed from data of known transmission pairs, which will serve as the signal component of the BMM. A detailed knowledge of transmission chains is rare. However, one clinical investigation
57
in Belgium previously led to the characterization of the direction of transmission between individuals of one HIV transmission chain and the timing of transmission events. Subsequently, a large number of viral sequences were obtained for in-depth molecular analysis of this chain,
58
and we developed the signal component of the BMM based on these data within a Bayesian random effects modeling framework due to the extensive variation in within-host viral evolution in these data.
59
In the Belgian study, HIV pol sequences were sampled for each individual in the known transmission chain from multiple time points. We therefore define each sequence pair for a source


The model in (8) and (9) was fitted with
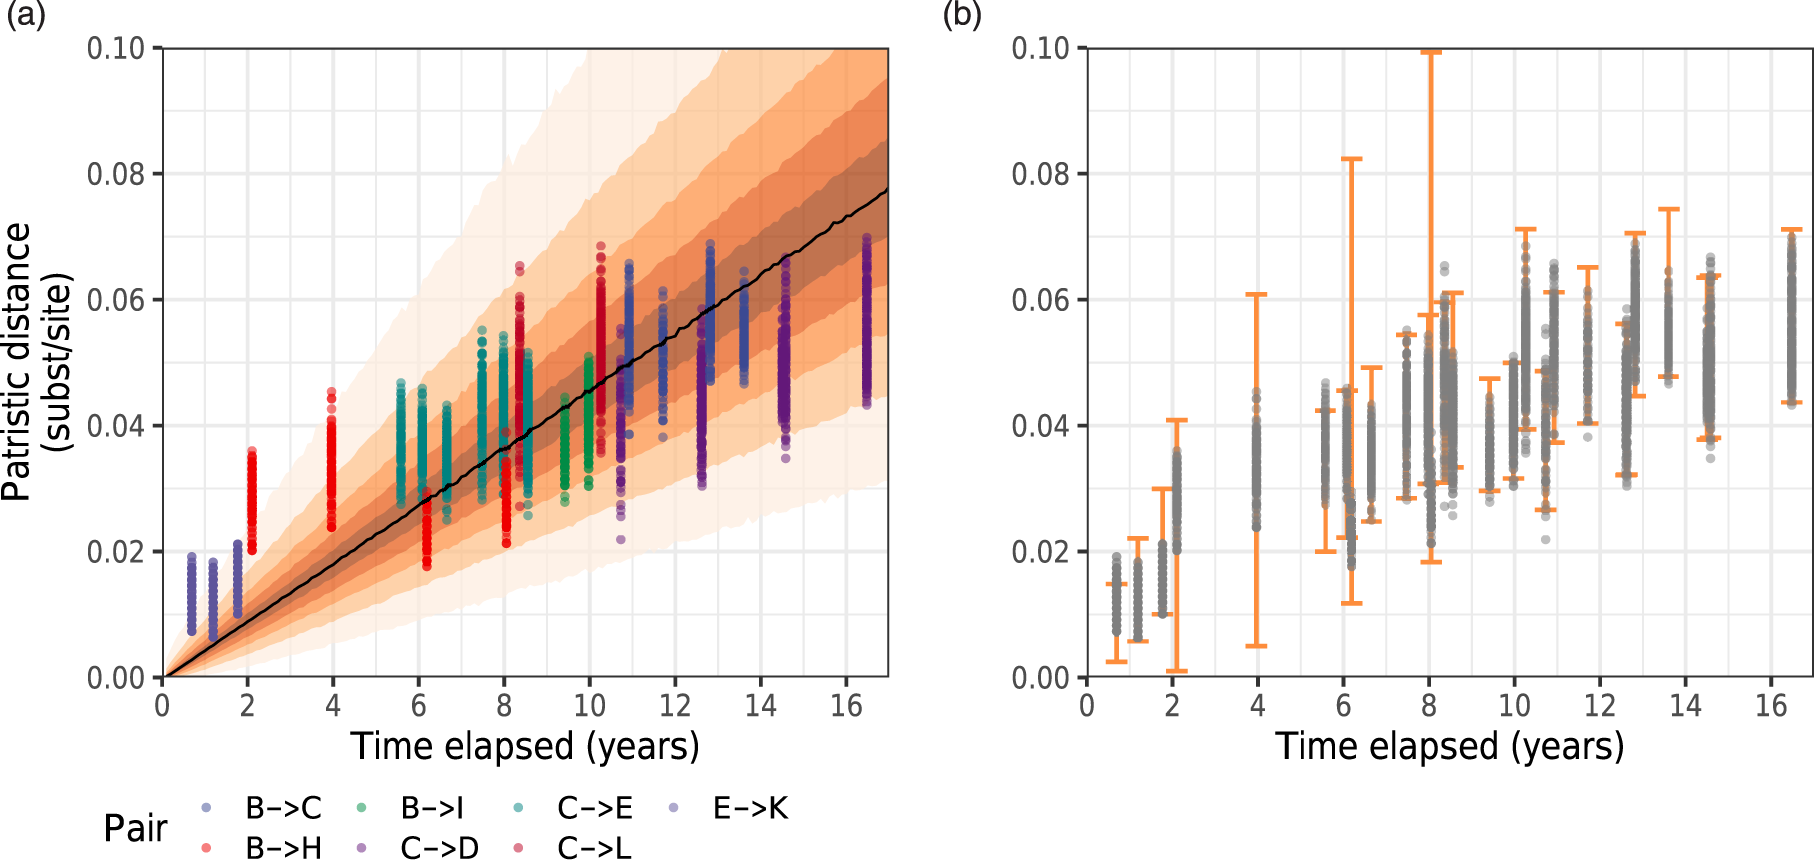
Belgian transmission chain data and model fit of evolutionary clock model. (a) Patristic distances between pairs of sequences from epidemiologically confirmed transmission pairs in Belgium, against time elapsed. Colors denote transmission pairs. Orange ribbons correspond to quantiles (at 10% increments between 10% and 90%, in addition to 95% credible intervals) of the posterior predictive distribution of the average evolutionary rate across pairs in the hierarchical clock model. (b) Posterior predictive 95% credible intervals of patristic distances by time elapsed (orange) for known transmission pairs, with data points overlaid. Transmission pair B
The predictive distribution of the shape and scale parameters of the model at a given time elapsed for a new pair, not in the training dataset,

We next incorporate the fitted model described by (8) and (9) as a signal component for phylogenetically likely transmission pairs into a two-component BMM. For ease of read, we will from now on suppress in the notation that the signal component was derived on the data


The resulting BMM is


The primary purpose of the fitted BMM is to characterize population-level transmission flows between groups of individuals specified by distinct demographic, behavioral, or clinical covariates. We achieve this by considering all pairwise combinations of sampled individuals with source and recipient attributes


For recipient

We next considered incorporating additional individual-level covariates as predictors of the BMM mixing weights to better separate true transmission pairs from those with false transmission pair signal, that is, truly unlinked pairs of individuals that fall into the signal component of the mixture model (11). We denote


In many cases, the covariates can be continuous, such as the age of the likely source and the likely recipient individual in the


Throughout, the model was fitted with the Stan probabilistic computing language using the
Simulations to evaluate estimation performance
We assessed the performance of the mixture models for estimating transmission flows and transmission sources on simulated HIV transmission networks derived from the discrete-time individual-based HIV epidemic model (PopART-IBM), which was developed in the context of the HPTN071/PopART HIV combination intervention prevention trial. 64 The model is informed by data collected from surveys, health care facilities, and community healthcare workers delivering interventions as part of the HPTN071 trial. The model parameters were calibrated to age-sex-specific data on incidence, prevalence, antiretroviral therapy (ART) uptake, and viral suppression from a representative cohort at the level of communities participating in the trial. Simulated transmission events depend on individual-level parameters including age, sex, set point viral load, and CD4 counts of the transmitter (Supplemental Table S1). The simulation begins with the starting population size in 1900, and the epidemic is seeded randomly with infectious cases in 1965–1970. The model runs until 2020 and returns a large number of separate, simulated transmission chains. For each new case, sequence sampling dates were simulated using a Weibull distribution. For each transmission pair, the time elapsed was calculated and patristic distances were simulated from the signal distribution (8). For unlinked pairs, patristic distances were simulated from the uniform background distribution (12). Full details are presented in Supplemental Material S4.
Evaluating estimation performance
For each of the models (13), (16), and (17), the accuracy of the target quantities (1) from the posterior was evaluated by comparing the mean absolute error (MAE), defined for each Monte Carlo sample, to the corresponding true quantity in the simulated data among known transmission pairs. For (1a),
Results
Constructing the signal component of the BMM
We first fitted the Bayesian hierarchical evolutionary clock model to patristic distances and time elapsed from 5186 sequences from 10 individuals in a well-characterized HIV transmission chain from Belgium.57,58 Maximum-likelihood viral phylogenies were reconstructed with
False transmission pair signal in the BMM signal component
We next sought to assess the estimation accuracy of the two-component vanilla BMM (13) on simulated data generated under an individual-based HIV epidemic model developed to represent contemporary African HIV epidemics and used to interpret the outcomes of the HIV prevention trial network trial 071 (HPTN071/PopART). 64 The model simulated transmission dynamics over 55 years from 1965 in a starting population of 32,217, initializing the epidemic with 148 transmission events to randomly chosen individuals in the first five years under default input parameters (see Supplemental Material S4). The model simulated 34,961 transmission events. For ease of tractability, we considered only the most recent 500 incident cases between 9 June 2017 and 31 December 2019, which were distributed over 276 distinct transmission chains (Figure 3(a)). We assumed that a pathogen sequence was sampled for all individuals with HIV. Since 2005, there have been 9355 potential sources with infection dates that preceded those of a new case between mid-2017 and the end of 2019. These formed 4,552,006 unique pairwise combinations of potential heterosexual transmission pairs with the 500 incident cases. In total, 768,257 potential pairs were excluded based on very large time elapsed, including 39 actual transmission events, due to the epidemic model simulating individual infection times which can lead to unrealistic values from the tails of the distribution in some cases (see Section 2). The 461 actual transmission events thus comprised 0.012% among all potential transmission pairs, rendering the unlabeled classification task of identifying true transmission pairs highly imbalanced.
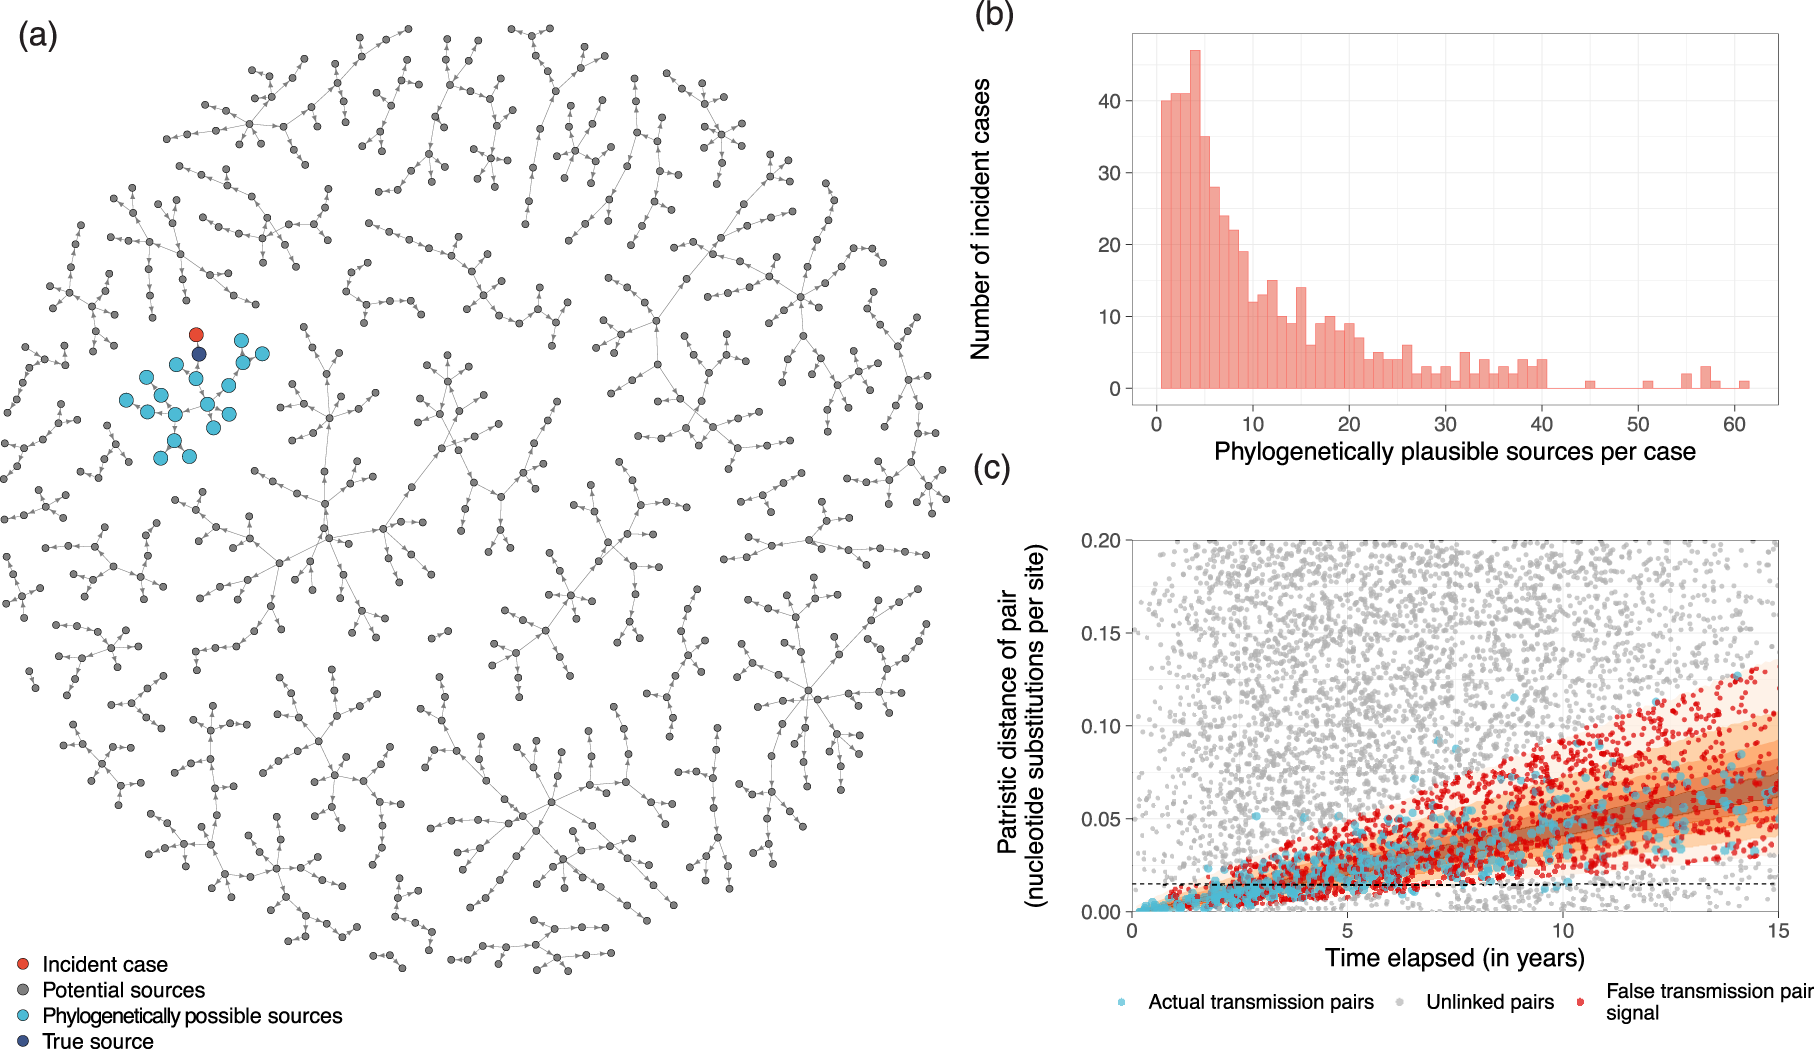
Phylogenetically possible sources and false transmission pair signal in an HIV epidemic simulation. (a) Sample of transmission chains containing one of the 500 most recent incident cases in the simulation generated under the PopART-IBM. One of the recent cases is highlighted in red, a random sample of their potential sources in gray, which correspond to sampled participants who are part of a distinct phylogenetically observed transmission chain, all phylogenetically possible sources in light blue, and the actual transmitting partner of the simulation in dark blue. (b) Number of all phylogenetically possible sources for the 500 most recent incident cases in the simulation. (c) Patristic distances and time elapsed between phylogenetically possible sources and each of the 500 most recent incident cases in the simulation. Actual transmission pairs in the simulation are shown in blue. Pairs that exhibited false transmission pair signal are shown in red. These are defined as phylogenetically possible unlinked pairs with patristic distances that fall within the 95% quantiles of the posterior predictive distribution of the distances for a given time elapsed from the fitted molecular clock model. All other unlinked pairs are in gray.
Individuals were grouped into distinct phylogenetic transmission networks, reducing the number of heterosexual, phylogenetically possible transmission pairs to 5519, with the 461 actual transmission events comprising 8.3% of the remaining pairs, a 600-fold improvement in balance. Each newly acquired case had on average 9,104 potential sources and 11.2 phylogenetically possible sources after excluding potential sources not within the same transmission chain (Figure 3(b)). Figure 3(c) illustrates how the quantitative data on patristic distances and time elapsed narrow down further the likely transmitters among pairs that fall into the signal component of the BMM. Importantly, a considerable fraction of the transmission events in the simulation (shown in red in Figure 3(c)), and their true sources, were associated with late diagnosis, which resulted in a large time elapsed. Application of standard phylogenetic selection criteria for reconstructing transmission pairs, such as a maximum patristic distance of 1.5% (i.e. 1.5 substitutions per 100 nucleotides,66–69 indicated by the horizontal line in Figure 3(c)), would have excluded these pairs, introducing selection bias. By accounting for time elapsed in the phylogenetic source attribution problem, we avoid this selection bias. However, the inference problem remains challenging, since 37% of phylogenetically possible pairs exhibited false transmission pair signal, defined as truly unlinked pairs that fall into the 95% quantiles of patristic distances for a given time elapsed under the BMM signal component.
With these statistical challenges in mind, we first evaluated the estimation accuracy of the BMM in the idealized scenario that the newly acquired cases had each on average two phylogenetically possible sources, including the true transmitting partner. The unlinked pairs were sampled randomly to achieve the desired balance. On these pairs, we considered the following binary source attribution problem. In each of the 461 transmission events, the true transmitting partners were allocated to have the same population-level characteristic “category 1,” while all other phylogenetically possible but unlinked sources were allocated to “category 2.” In this simulation, all phylogenetically possible pairs had a small patristic distance (
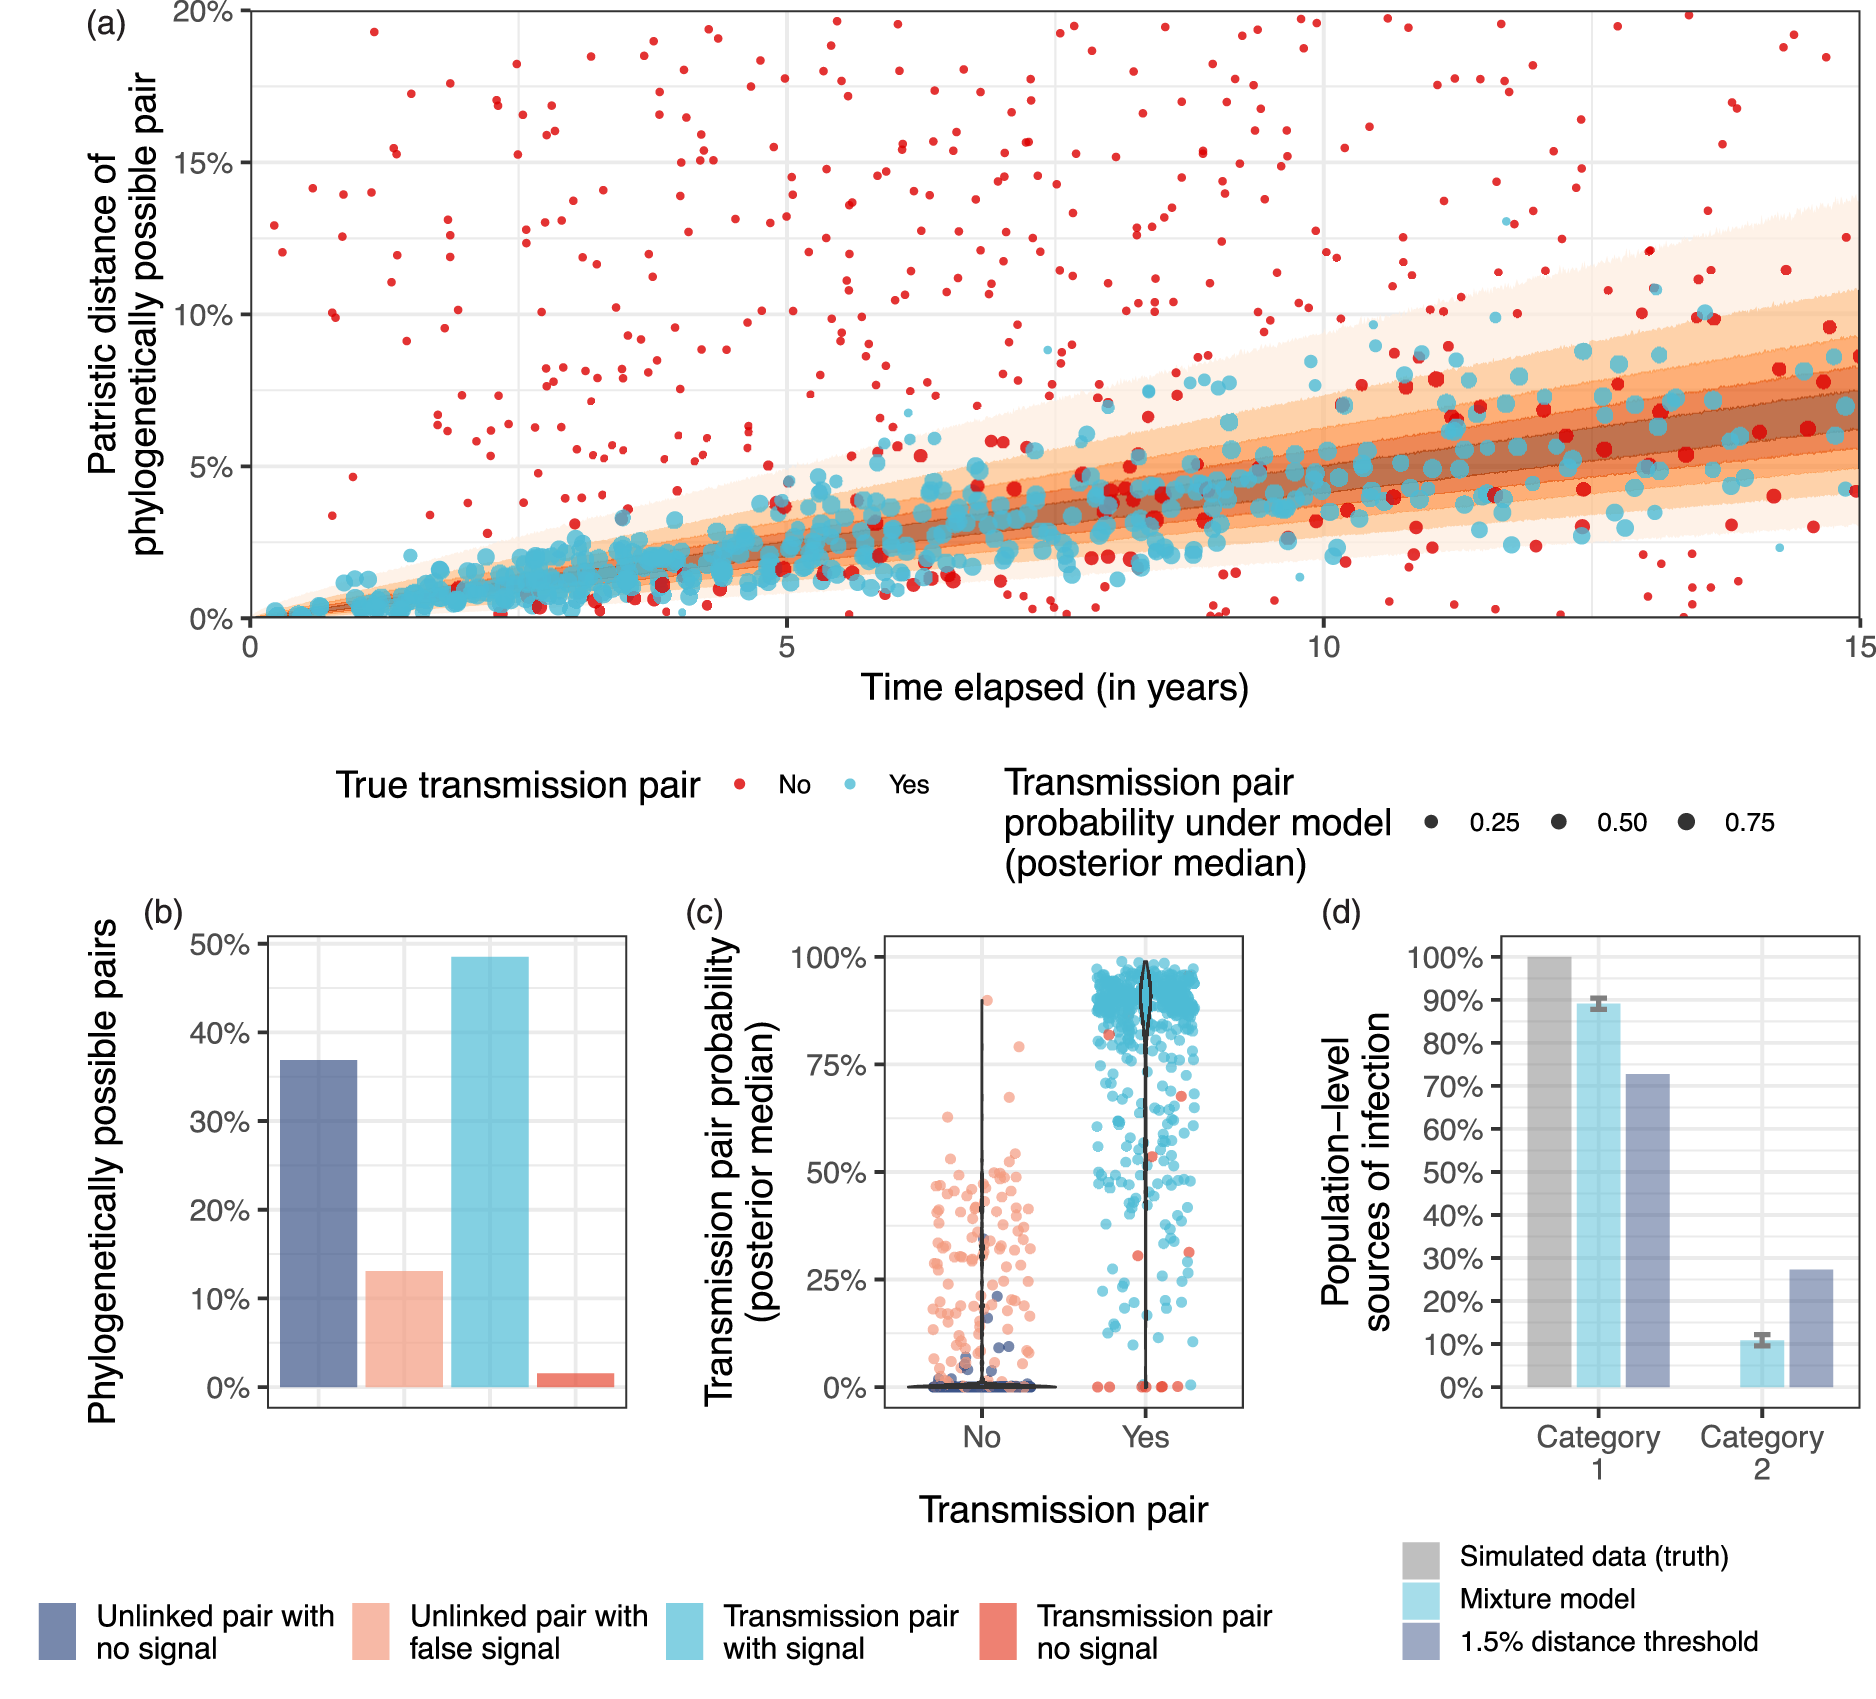
Source attribution with the vanilla Bayesian mixture model (BMM) in the case of two competing phylogenetically possible sources per new case. From the HIV epidemic simulation, only two competing phylogenetically possible sources for each of the 500 most recent cases were retained to assess source attribution in an idealized scenario. (a) Patristic distances and time elapsed for each phylogenetically possible pair, with true transmission pairs shown in blue and unlinked pairs in red. The size of observations corresponds to their posterior probability of being a true transmission pair inferred from the vanilla BMM. (b) Empirical proportion of pairs with and without transmission pair signal (based on 95% quantiles of a molecular clock), for actual transmission pairs and unlinked pairs among the phylogenetically possible pairs. (c) Posterior probability of being a transmission pair, by actual transmission pairs and unlinked pairs. (d) Posterior median estimates of transmission flows and 95% credible intervals under the vanilla BMM, compared to using a 1.5% threshold on patristic distances, and simulated ground truth.
We next returned to simulated transmission dynamics under the HPTN071/PopART model that included many more pairs with false transmission pair signal in the BMM signal component. We considered the same binary source attribution problem as before, allocating all actual transmitting partners to have the same population-level characteristic “category 1” and all unlinked, but phylogenetically possible sources to “category 2.” In this simulation, 26% of pairs were unlinked with false transmission pair signal, and 0.3% of pairs had no transmission pair signal despite being linked transmission pairs (Figure 5(b)). Fitting the vanilla BMM (13), we estimated that 45% (43%–47%) of transmissions were attributed to category 1, implying an MAE of 55% (52%–57%). For comparison, when we classified phylogenetically likely transmission pairs based on patristic distances <1.5%, we estimated that 25% of transmissions were attributed to category 1, and the MAE was 75%. These simulation results indicate that the error in phylogenetic source attribution can be very large with either a standard classification approach or the vanilla BMM. In particular, the large estimation error is associated with situations in which the phylogenetically possible pairs that are falsely classified as transmission pairs outnumber those pairs that are correctly classified.
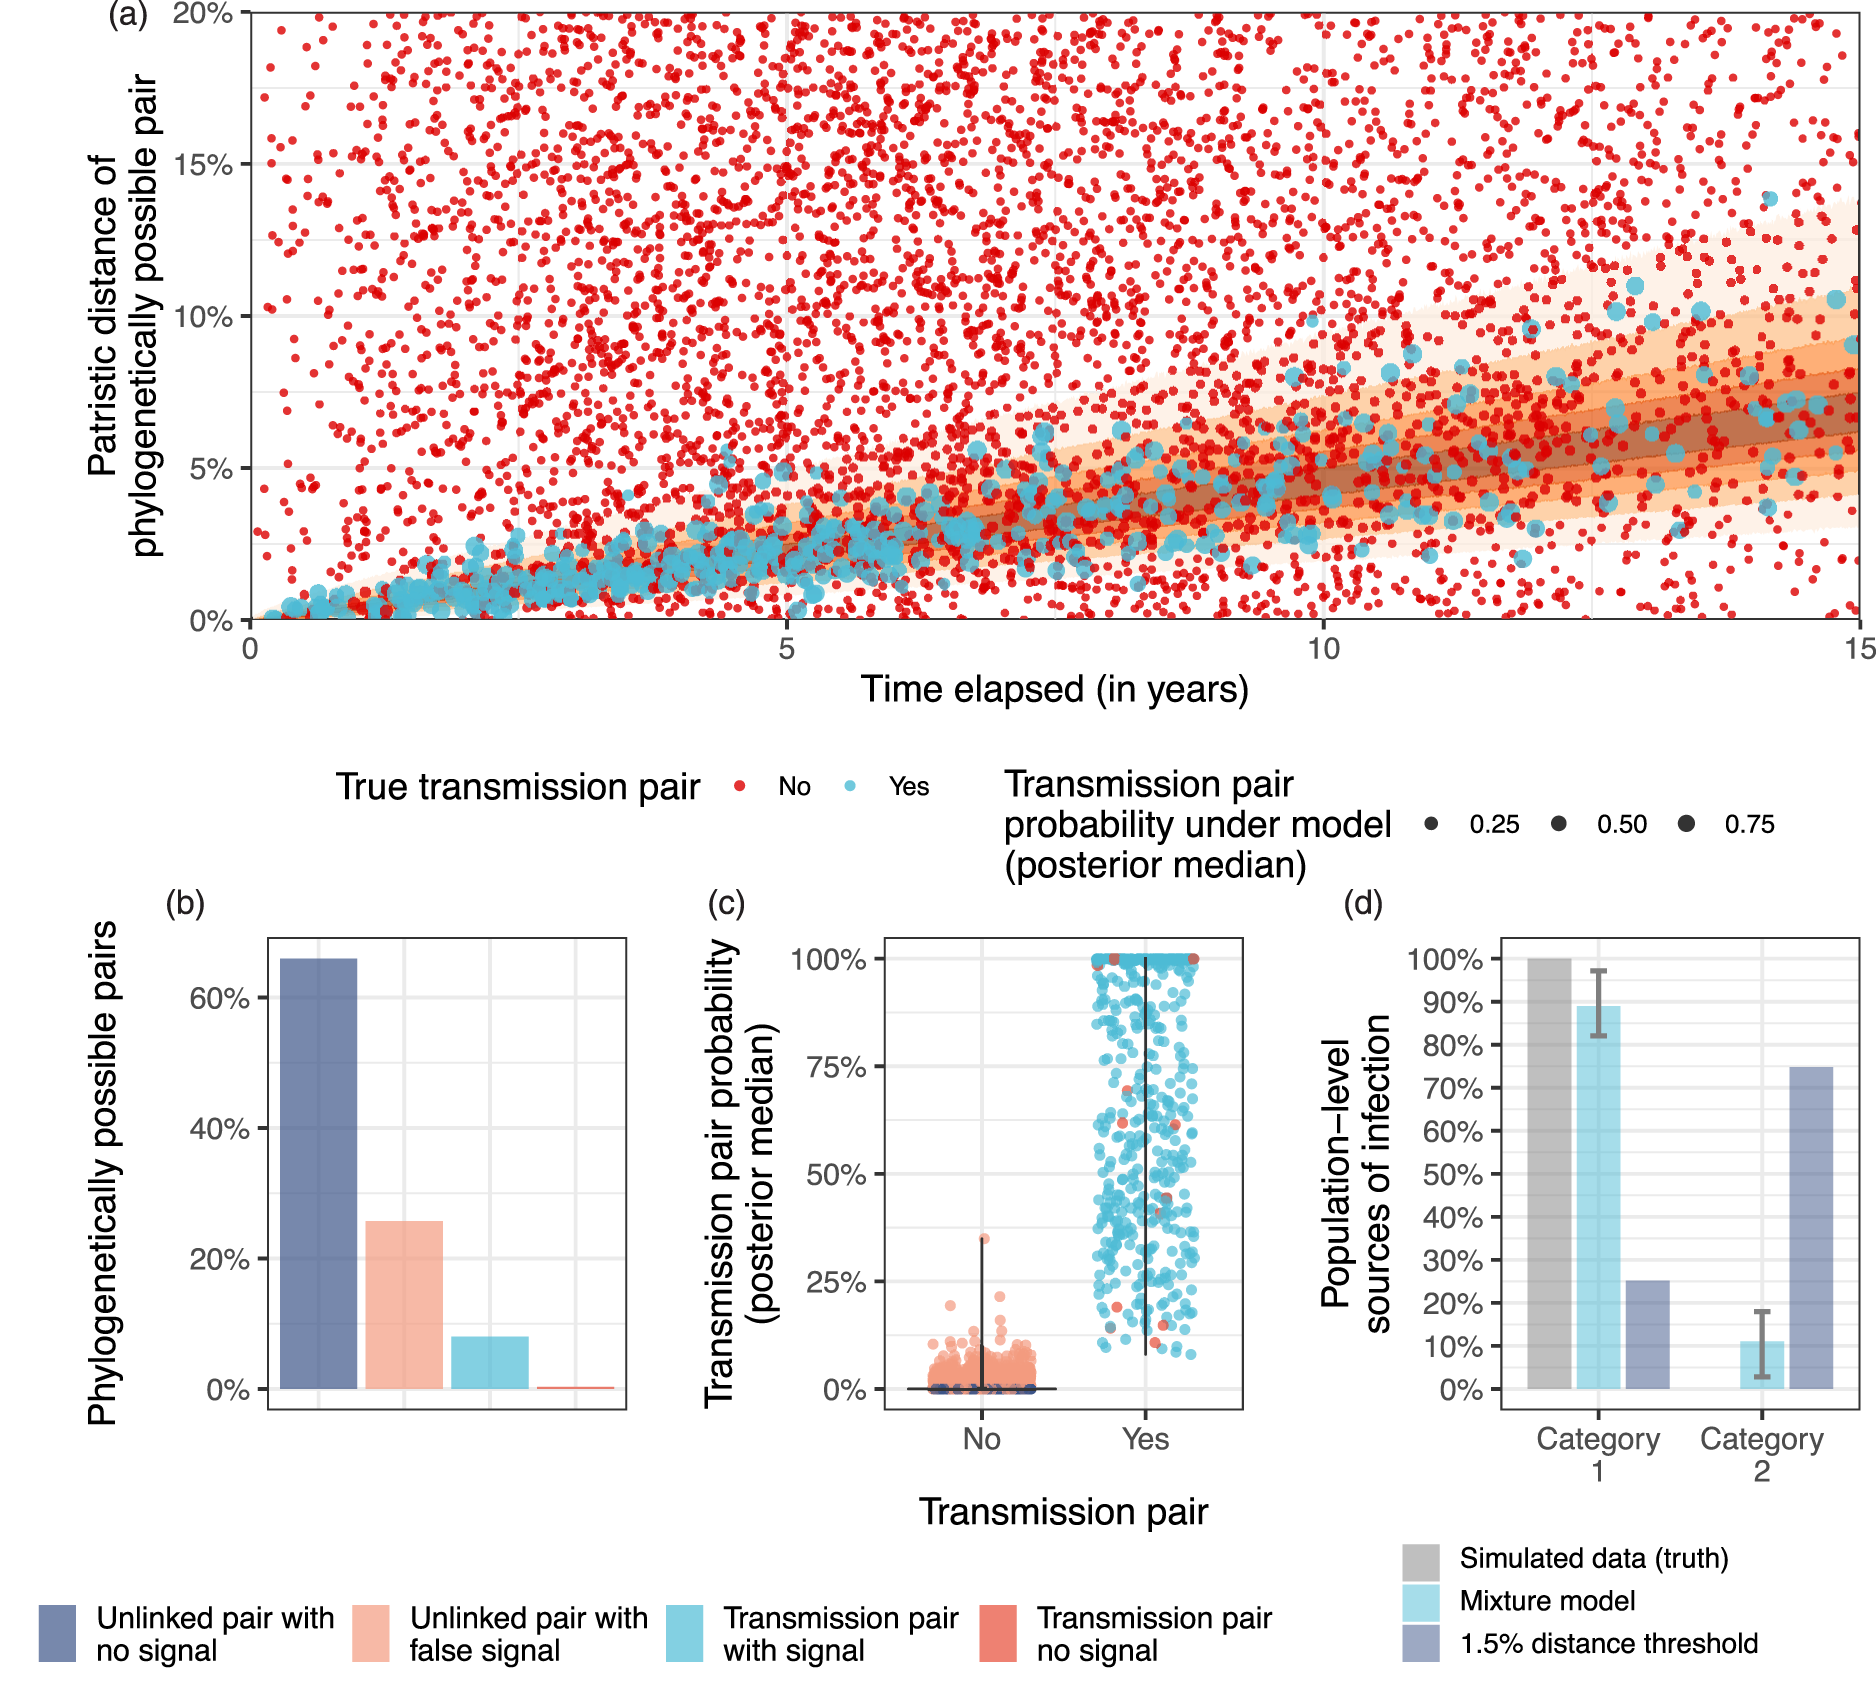
Source attribution with the covariate Bayesian mixture model (BMM) in the case of many competing phylogenetically possible sources per new case. (a) Patristic distances (number of substitutions per 100 nucleotides) and time elapsed for each phylogenetically possible pair, with true transmission pairs shown in blue and unlinked pairs in red. The size of observations corresponds to their posterior probability of being a true transmission pair inferred from the covariate BMM. (b) The empirical proportion of pairs with and without transmission pair signal (based on 95% quantiles of a molecular clock), for actual transmission pairs and unlinked pairs. (c) The posterior probability of being a transmission pair, split by actual transmission pairs and unlinked pairs. (d) Posterior median estimates of transmission flows and 95% credible intervals under the covariate BMM, compared to using a 1.5% threshold on patristic distances.
To improve on this poor estimation accuracy, we next considered the covariate BMM (16) that included as a predictor of the BMM mixing weights (16c) the binary covariates: “category 1” and “category 2.” In other words, we added features that make the classification task perfectly identifiable upon correct parameterization of the BMM. Fitting the model, we found that nearly all previous pairs with false transmission pair signal were now estimated to have a low posterior probability of being a transmission pair (Figure 5(c)) and 89% [82%–97%] of transmission events were attributed to category 1, implying an MAE of 11% (3%–18%) (Figure 5(d)). These simulations indicate that the covariate BMM can accurately estimate population-level drivers of transmission even when many pairs exhibit false transmission pair signal, provided that additional covariate data are available that perfectly separate transmission pairs from unlinked pairs.
More realistically, we considered a (non-binary) source attribution scenario in which simulated transmission events were associated with similarity in the age of newly acquired cases and their transmitting partners. Data were simulated so that age similarity did not perfectly separate transmission pairs from unlinked pairs (Figure 6(a)). For the actual transmission pairs, we simulated the age of the sources using a truncated log-normal distribution between 16 and 75 with a mean of 30 years and simulated the age of the recipients in each pair using the age of their source as a mean to generate correlated ages. We simulated the ages of the unlinked pairs uniformly across the same age range. We included the ages of the cases and their phylogenetically possible sources as independent predictors of the mixing weights of the covariate BMM and sought to recover the age profile of the sources of transmission in the simulation by 5-year age groups. We performed several experiments, keeping the average number of phylogenetically possible sources per incident cases in each experiment fixed at 2, 2.5, 3.3, 5, 10, 12.5, to represent scenarios with minimal to pervasive false transmission pair signal (Figure 6(b)). We also compared source attribution using a 1.5% patristic distance threshold to classify phylogenetically likely transmission pairs, the vanilla BMM, and an HSGP random function BMM (17) in which the mixing weights were modeled through a 2D random function on the age of the newly acquired case and their phylogenetically possible source. Table 1 shows that the HSGP random function BMM had consistently the lowest MAE, and was 0.3% [0.2%–0.5%] for an average of two phylogenetically possible sources per newly acquired case, increasing to 0.7% [0.4%–1.1%] for an average of five phylogenetically possible sources per newly acquired case, and 1.2% [0.8%–1.7%] for an average of 12.5 phylogenetically possible sources per case. Note that the MAE cannot be directly compared with earlier results since we estimated the sources across more strata.
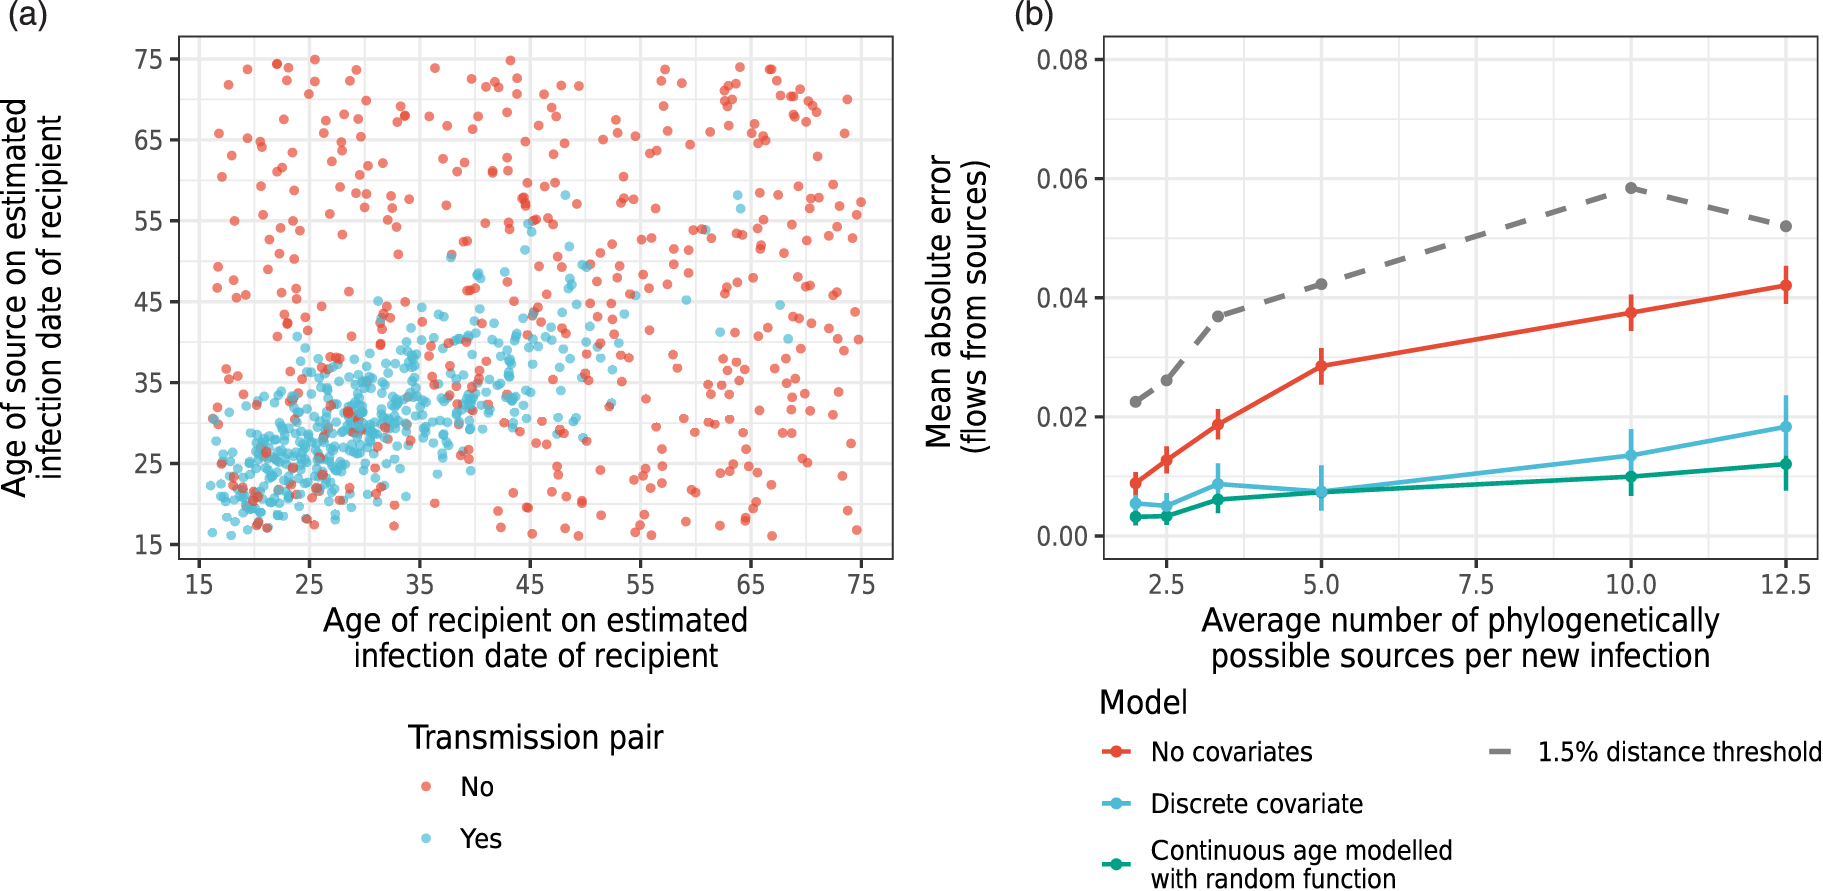
Performance of three models, benchmarked against inference through a fixed genetic distance threshold. (a) Structure of the simulated ages of sources and recipients in true transmission pairs and unlinked pairs. (b) Mean absolute error (MAE) in the estimated transmission flows from each source category (age group) under the three models. MAE for flows by estimating sources with a 1.5% patristic distance threshold. We note that the MAE cannot be directly compared to that in Figure 4 because there are more strata from which we estimate the sources.
Accuracy in phylogenetic source attribution by 5-year age bands on simulated data with substantial false transmission pair signal.
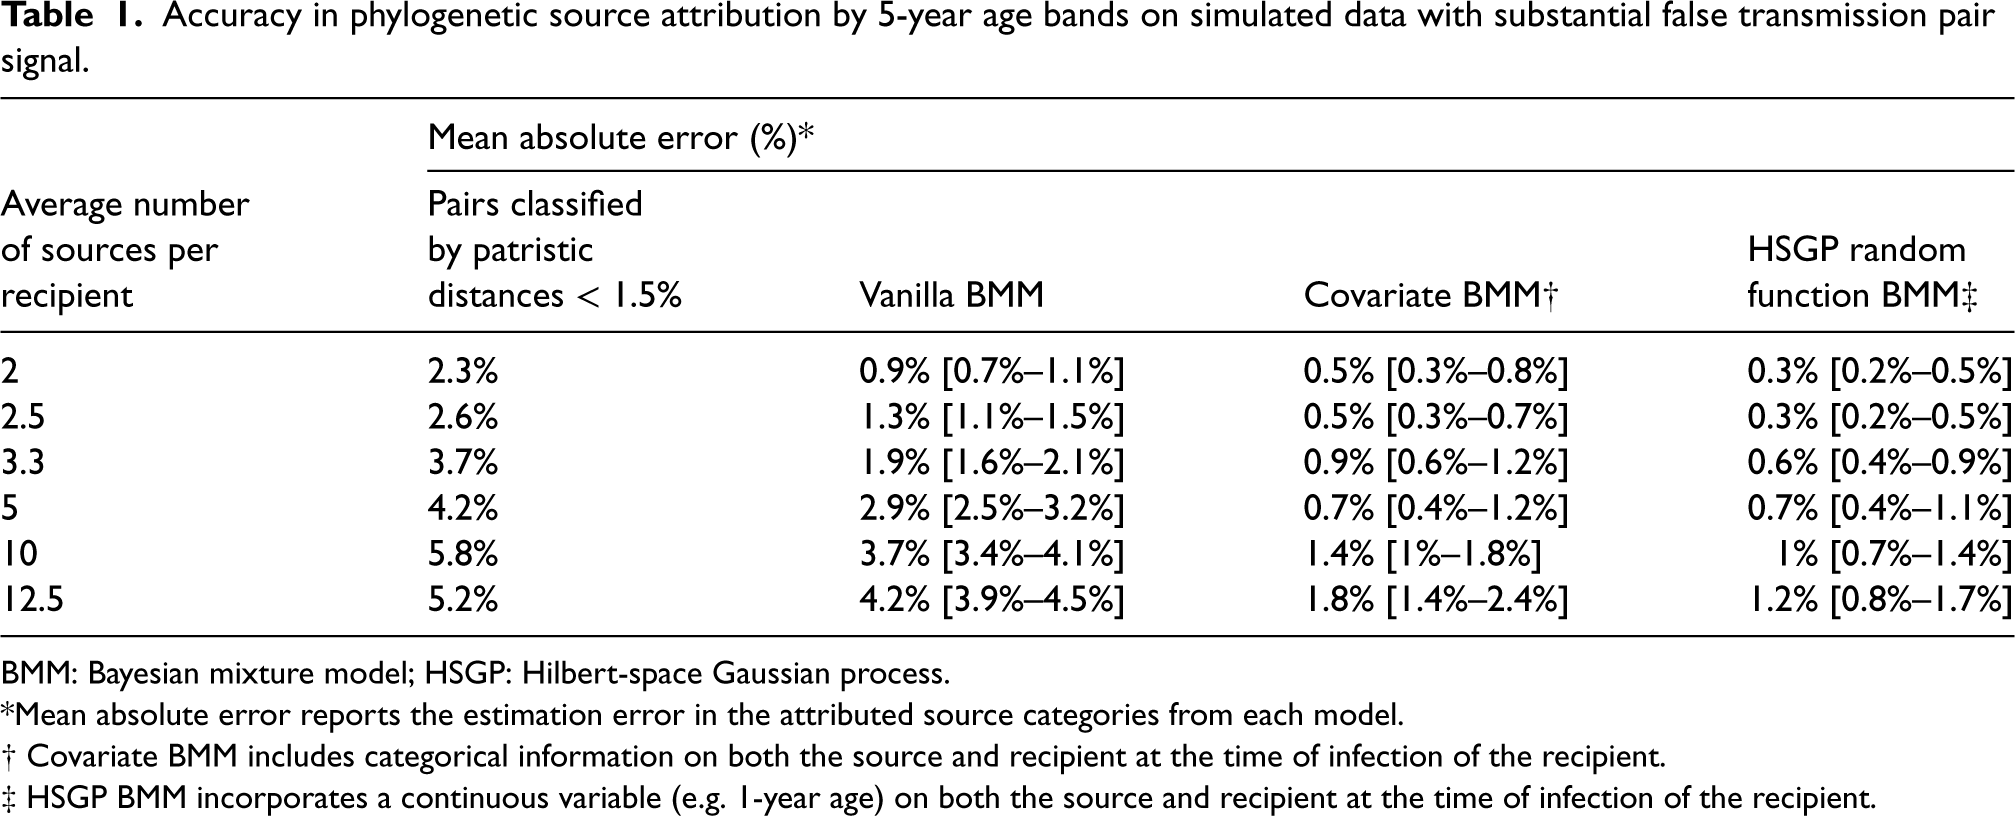
BMM: Bayesian mixture model; HSGP: Hilbert-space Gaussian process.
*Mean absolute error reports the estimation error in the attributed source categories from each model.
Finally, we illustrate our method on data from HIV transmission chains among Amsterdam MSM. Data on people living with HIV in the Netherlands were obtained from the ATHENA observational cohort, comprising demographic, clinical, and viral sequence data for diagnosed individuals until 17 January 2022. 37 Amsterdam residents were geolocated using residential postal codes at enrollment, or at a registration update. Longitudinal CD4 and viral load measurements enabled us to estimate HIV infection times with a Bayesian model trained on data from 19,788 seroconverters with known date of last negative test from the CASCADE collaboration.38,39 We used posterior median infection time estimates to calculate the time elapsed (6). HIV phylogenies and phylogenetic transmission chains for the major subtypes and CRFs among Amsterdam MSM were reconstructed in the context of 1321 additional HIV sequences from Amsterdam residents in other HIV risk groups, 7119 from the rest of the Netherlands and 12,821 international sequences using FastTree and phyloscanner (see Section 2). Figure 7(a) illustrates the resulting data for a large clade of all subtype B samples.
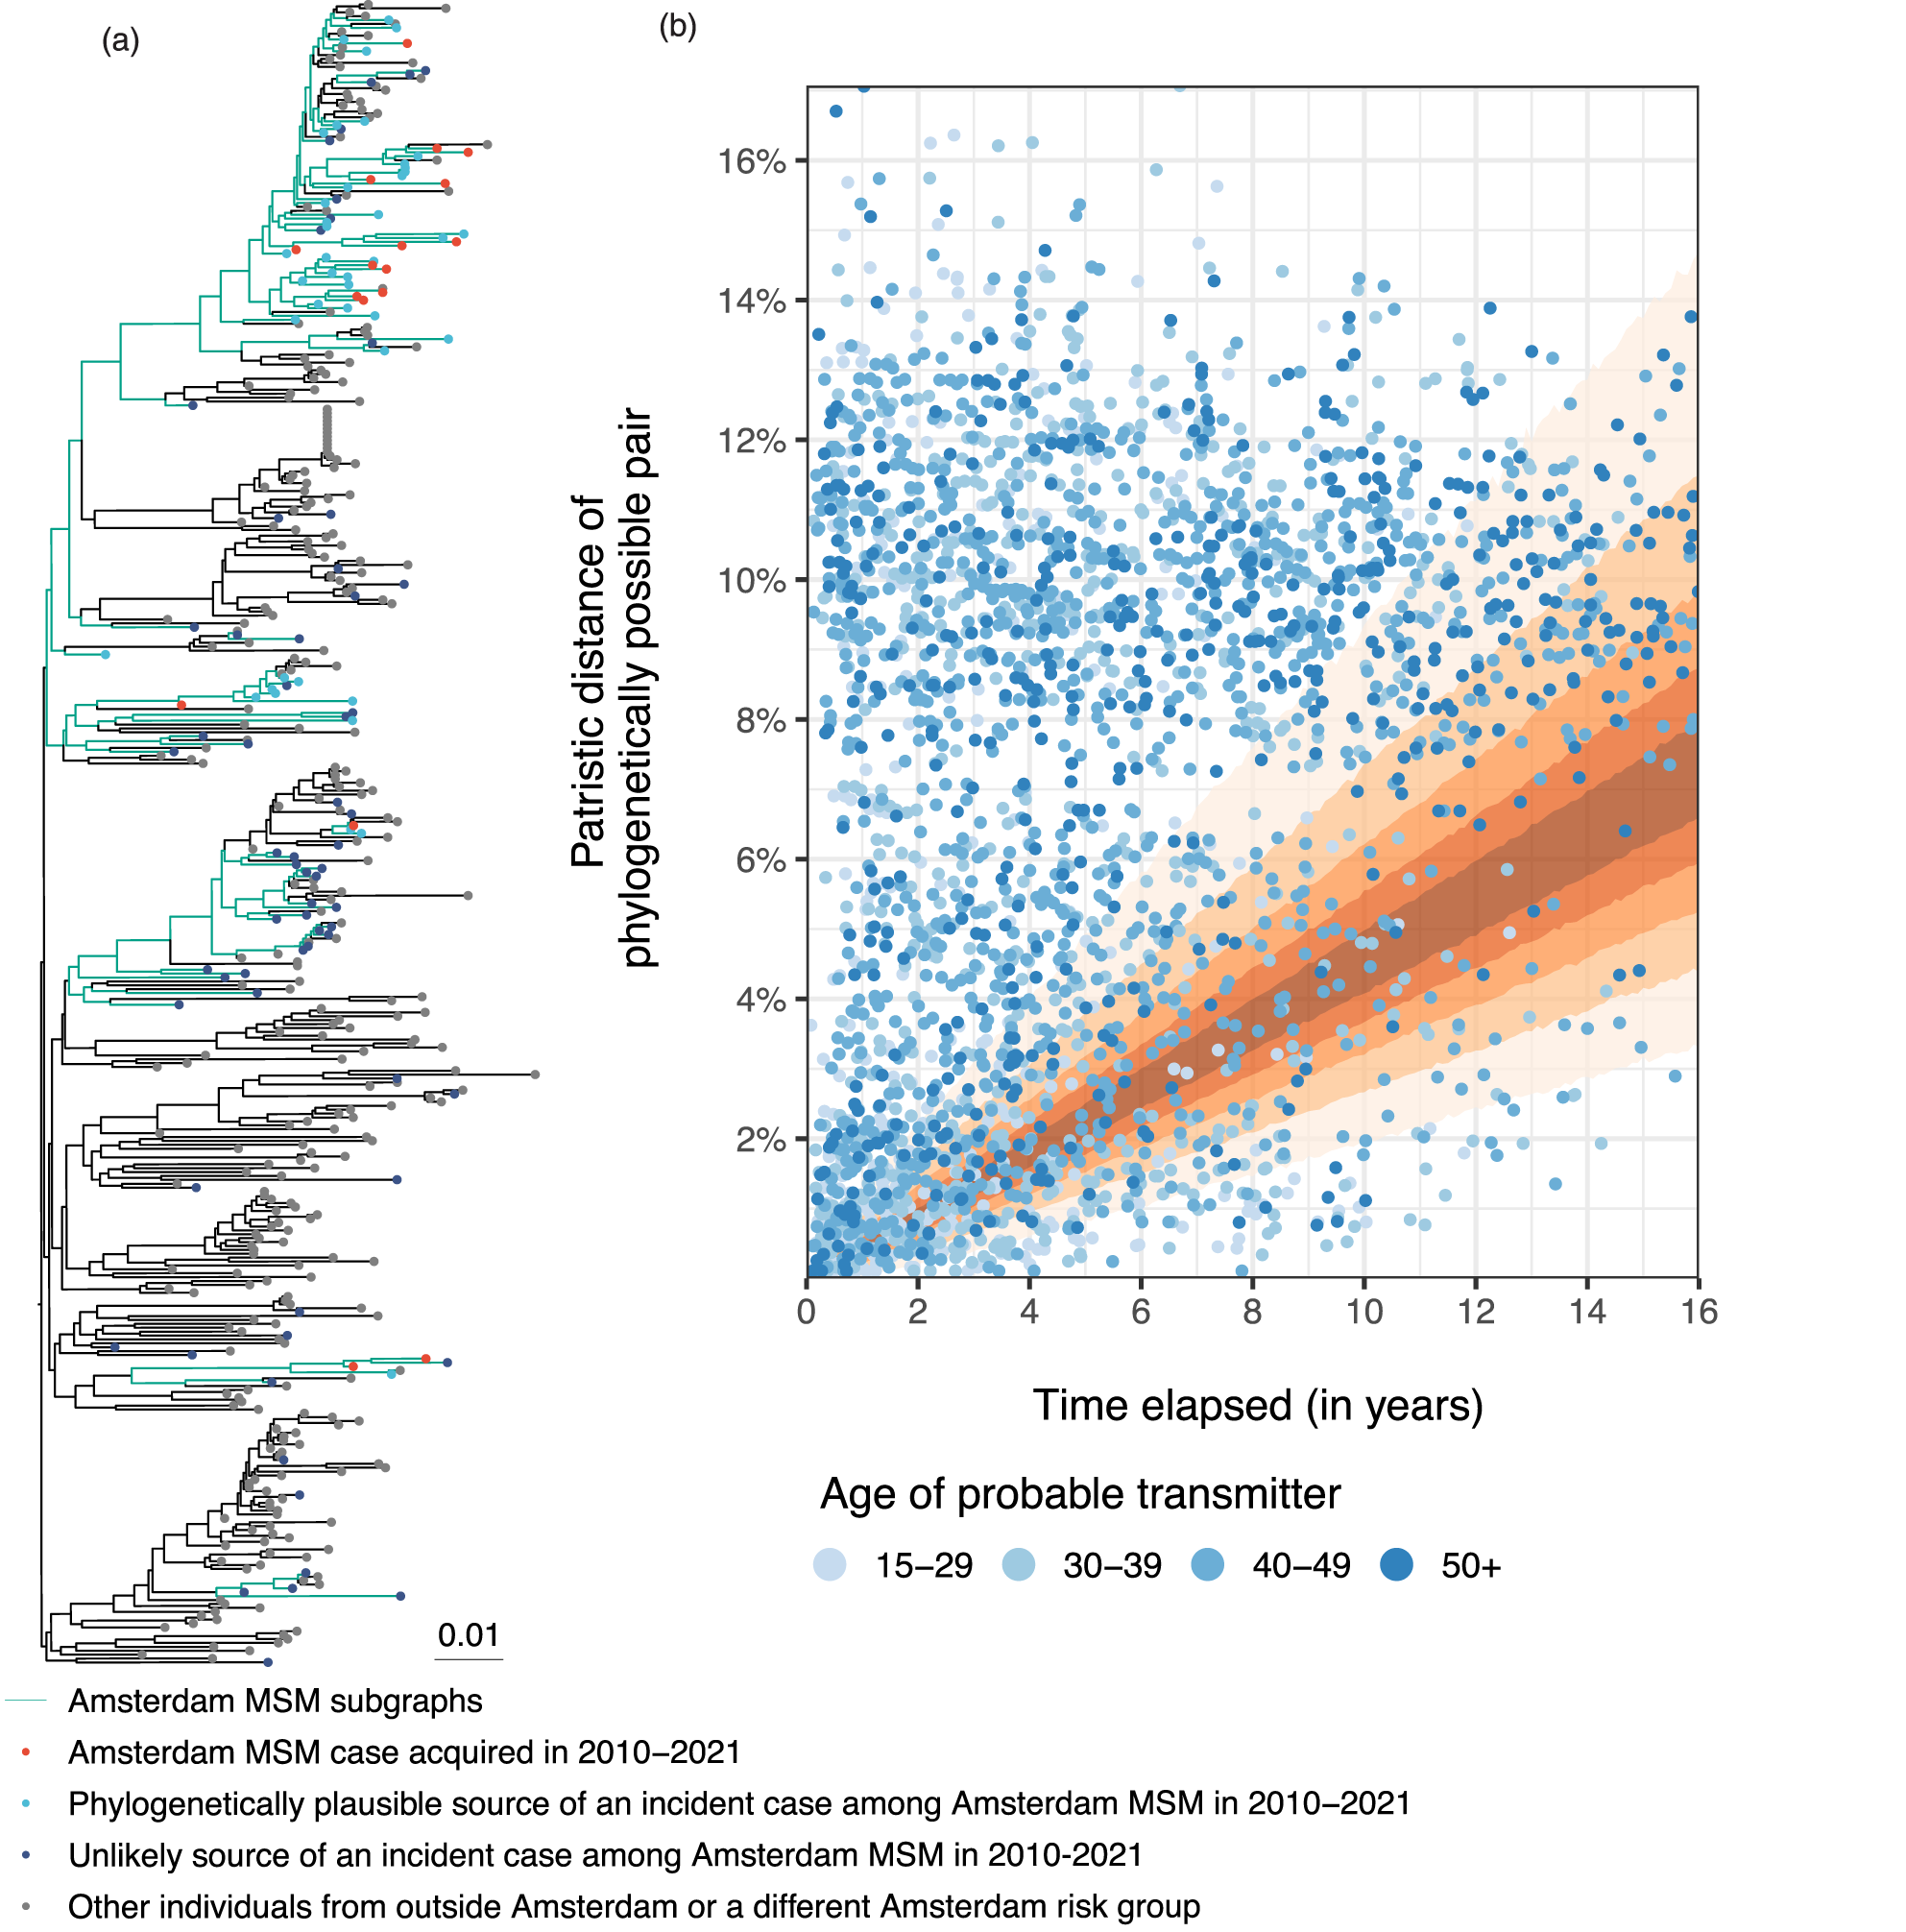
Phylogenetic data from Amsterdam men who have sex with men (MSM). (a) Clade of subtype B among Amsterdam MSM. A clade is a subset of the phylogenetic tree including all descendents of an ancestral lineage. MSM subgraphs are identified by colored branches. Members of MSM subgraphs with an infection date since 2010 have red tips; members who are a phylogenetically possible source for these recipients have light blue tips; members who are neither a source nor a recipient have dark blue tips. (b) Patristic distances and estimated time elapsed for phylogenetically possible transmission pairs of Amsterdam MSM.
Our primary aim was to quantify age-specific population-level sources of transmissions among Amsterdam MSM between 2010 and 2021. In total, there were 1335 new HIV diagnoses among Amsterdam MSM with an estimated infection date during the study period, and 840 had an HIV sequence of one of the predominant HIV-1 subtypes or CRFs B, C, 01AE, A1, 02AG, D, G, F1, 06cpx available. Of these, 524 Amsterdam MSM formed a phylogeographically distinct transmission chain of more than one member, which we focus on in our analysis. The remainder were considered to have acquired HIV from a non-Amsterdam MSM source, or unobserved Amsterdam MSM. For these, we identified 3033 potential sources among Amsterdam MSM with an estimated infection date that preceded that of the new case, which formed 1,372,332 potential transmission pairs. Of these, we excluded 65,104 (4.74%) pairs with potential sources who were deceased prior to the infection date, 16,934 (1.23%) with potential sources who migrated to the Netherlands after the infection date, 906,756 (66.07%) with potential sources who were estimated to have suppressed and thus untransmittable virus at the infection date, 13,140 (0.96%) with potential sources who had an implausibly long time elapsed, and 367,574 (26.78%) with potential sources who were not part of the same phylogenetically reconstructed transmission chain. Seven of the remaining phylogenetically possible pairs had a distance of zero (i.e. their sequences were identical). Examining metadata for these pairs suggested these were distinct individuals, so we reset their patristic distance to one mutation across the length of the alignment (0.077% substitution rate), but carried out a sensitivity analysis to assess the impact of omitting these pairs (see Supplemental Material S5.3).
In total, this left 409 sampled new Amsterdam MSM cases with at least one sampled Amsterdam MSM as a phylogenetically possible source. Each new case had a median of 3 and an average of 6.9 phylogenetically possible sources, and there were a total of 2824 phylogenetically possible transmission pairs. The median time elapsed was 4.17 years, and thus we expected many phylogenetically possible transmission pairs to have patristic distances above a patristic distance threshold of 1.5% since the dates at which viral sequences could be obtained were long after the estimated infection time. Many phylogenetically possible pairs had patristic distances outside of the posterior predictive distribution of the clock model, suggesting these are unlikely to be true transmission pairs given their incompatibility with the molecular clock (Figure 7(b)). A small proportion of pairs had a small patristic distance relative to their time elapsed. These could be true transmission pairs, with individual-level infection date uncertainty resulting in an error in the estimated time elapsed, or could be unlinked pairs from the same phylogenetic cluster, with an intermediary person between them in the unobserved transmission chain. We fitted the HSGP random function BMM (17), with the mixing weights specified through a 2D random function on the age of the recipient and the source at the estimated infection time of each phylogenetically possible transmission pair. The model converged and mixed well with no divergences and a runtime of 59 min on a 2020 MacBook Pro (Supplemental Figures S4 and S5). This model had an MAE of
Infection times were bootstrap sampled 50 times and models were refitted to account for uncertainty in infection time estimates. We found that transmissions originated from all age groups among Amsterdam MSM in 2010–2021, with an estimated 28% [23%–33%] from 15 to 29-year-olds, 31% [27%–36%] from 30 to 39-year-olds, 26% [22%–31%] from 40 to 49-year-olds, and 15% [12%–19%] from MSM aged 50 and above (Figure 8(a)). Stratifying by age of recipients, we found that most incident cases had a source within the same age band, but not strongly so. For all age groups, more than half of incident cases originated from sources that were either older or younger. For example, for Amsterdam MSM aged 15–29, an estimated 39% [32%–46%] of incident cases originated from 15 to 29-year-olds, 34% [28%–41%] from 30 to 39-year-olds, 19% [14%–25%] from 40 to 49-year-olds, and 7% [4%–11%] from MSM aged 50 and above (Figure 8(b)). Considering transmissions by age of the recipients, our data indicated that the age structure of transmission sources is shifting from older sources to incident Amsterdam MSM aged 15–29 to younger sources to incident Amsterdam MSM aged 50 and above. To examine this further, we calculated the age gap between the age of the phylogenetically possible source and the age of the new case at the likely time of the infection event and weighted these age gaps by the posterior probability that the pair represents an transmission event (Supplemental Material S6). We estimate that 15–29-year-old Amsterdam MSM had sources of transmissions who were on average 6 years older (posterior interquartile range [IQR] 0–15 years) while 30–39-year-olds had sources on average the same age (IQR 6 years younger to 9 years older), 40–49-year-olds had sources on average 6 years younger (IQR 14 years younger to 2 years older), and Amsterdam MSM aged over 50 had sources that were on average 11 years younger (IQR 3 to 20 years younger).
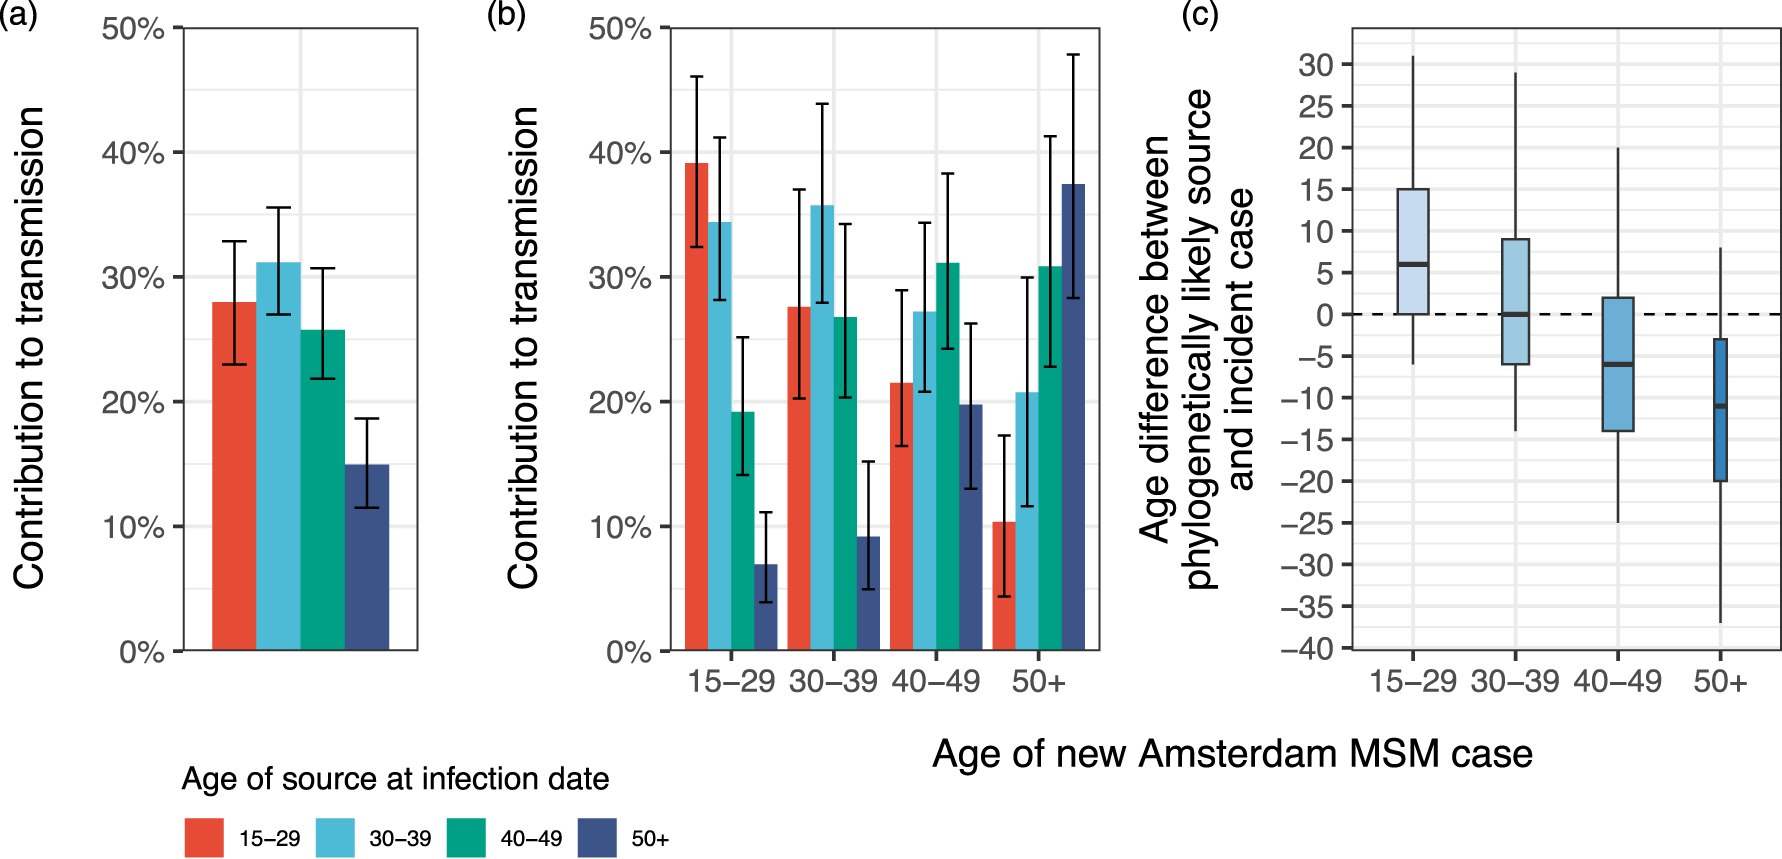
Estimated age of Amsterdam men who have sex with men (MSM) sources of transmission in Amsterdam MSM who acquired infection in 2010–2021. (a) Overall contribution of age groups to transmissions within Amsterdam MSM transmission networks in 2010–2021 (bar: posterior median; errorbar: 95% posterior credible intervals). (b) Contribution of age groups to transmissions within each recipient age band of 15–29 years, 30–39 years, 40–49 years, and 50 years and above (bar: posterior median; errorbar: 95% posterior credible intervals). (c) Estimated age difference between the sources and recipients in likely transmission pairs, with a positive age difference indicating older likely sources. The thick line within boxplots indicates the posterior median age difference, the box the posterior interquartile range, the whiskers the 2.5% and 97.5% posterior quantiles, and the widths of the boxplots are proportional to number of likely pairs who have a recipient in each recipient age band of 15–29 years, 30–39 years, 40–49 years, and 50 years and above.
We present a novel approach to phylogenetic source attribution that combines molecular genetic distances between sampled pathogen sequences with time elapsed in a BMM that has a population-level molecular clock as its signal component. This statistical approach to source attribution is now becoming increasingly possible as various methods are now available for estimating infection times from clinical and demographic data as we have used here,70,71 but also from deep-sequence data,72–75 the number of ambiguous nucleotide mutations in consensus sequences,76–79 and combinations of biomarker and pathogen sequence data.80,81 The main additional information needed to leverage these time since infection estimates are the evolutionary clock model that underpins the signal component of the BMM. We focused on developing the approach for HIV transmission dynamics because a previous study 58 sequenced a large number of pathogens from a known transmission chain, enabling us to use a large dataset of over 2800 sequence pairs to construct the signal component. Similar approaches, or even using molecular clocks parameterized as part of large-scale phylogenetic analyses, 82 could be explored for a wide range of other pathogens that mutate sufficiently rapidly relative to the time scale of transmission dynamics.83,84
A central insight from our investigation is that the signal derived from combining molecular genetic distance measures with time elapsed remains ambiguous, and there is as in previous research26,61,85 no way to identify the source of transmission with certainty. Simulations based on the PopART-IBM HIV transmission model demonstrate that the large majority of data points falling into the BMM signal component correspond to unlinked pairs of individuals, and thus exhibit false signal that can introduce significant bias to population-level source attribution inferences. Additional features are necessary to reduce misclassification rates on the true, unknown transmission status between individuals in phylogenetically possible transmission pairs to a tolerable level for source attribution. These features may vary between pathogens and also between localized epidemics. For example, HIV suppression status will be most informative for estimating HIV transmission sources in populations with well-established treatment programs and regular monitoring of ART response. For infectious diseases that can be cured, clinical data on cleared infections could similarly be used to ascertain when individuals were uninfectious. Diagnosis dates can be highly informative for pathogens whose serial intervals to the diagnosis date of the next infection are short.86–88 Mortality data can be useful in narrowing down the potential sources of infection for life-long infectious diseases, and mobility data can be useful in excluding potential transmission sources where populations are highly mobile or suffer from displacement or armed conflict. From a methodological angle, these considerations imply that the vanilla BMM (13) is unlikely to provide accurate source attribution inferences, and we recommend using the covariate or random function BMMs (16) and (17), or mixtures of both. Other phylodynamic approaches based on inferring transmission trees from genomic data and infection times can be applied 89 using reversible jump Markov chain Monte Carlo which accounts for unsampled individuals. However, these are best suited to large, rapidly spreading outbreaks, whilst in the case of HIV there are generally many small concurrent transmission chains consisting of few individuals.
Here, we used the random function BMM to investigate the age groups that underpin the continued spread of HIV within Amsterdam MSM transmission chains, excluding those for whom phylogenetic data indicate that they were likely infected by an individual not resident in Amsterdam. We found that no single age group drove transmission among MSM in Amsterdam between 2010 and 2021, though 30–39-year-olds contributed the highest proportion of transmissions. Analysis of deep-sequence data from six European countries participating in the BEEHIVE study, also identified MSM aged 30–39 to be the most likely source of infections across all age groups among phylogenetically linked pairs. 90 We found limited evidence of assortative mixing across all age groups, with the majority of infections in each of the recipient age bands 15–29 years, 30–39 years, 40–49 years, and 50 years and above originating from outside these age groups, respectively. Behavioural survey data collected from MSM in Amsterdam in 2008–2009 found disassortive mixing by age, particularly between casual partners, 91 and phylogenetic evidence from MSM in Switzerland suggested an average overall age gap of 9 years between inferred transmission pairs. 92 We estimated age gaps of five years between MSM under 30 and their likely sources, and MSM over 40 were between five and 12 years younger than their likely sources. Age of sources has previously been found to depend on the age of the recipient at the time of infection, with MSM under 30 in the European BEEHIVE study estimated to have a source on average 6 years older, and over 40 were estimated to have a source 8 years younger, 90 cohesive with our findings. Other studies in the United States, focused on HIV transmission to young MSM, have also identified age gaps between recipients and older sources.93,94 However, a study among Tennessee MSM found evidence from phylogenetic analysis of more transmission between young MSM than from older partners. 95 Incorporating other covariates, White MSM have been estimated to have larger age gaps between young recipients and their sources than other races and ethnicities across the US, 67 so age gaps may also be driven by population demographics. We did not quantify this in our study, however, over 40% of new diagnoses in Amsterdam MSM are among individuals with a migration background, 96 suggesting age gaps may be heterogeneous depending on the ethnicity of incident cases.
Our statistical approach has a number of important limitations. First, underpinning the model are the infection dates of individuals, which are usually unknown but can be estimated. Existing methods for estimating infection time have in general been shown to suffer from individual-level uncertainty.38,75,81 This is carried through to the time elapsed, which can lead to false transmission pair signal among truly unlinked pairs or lack of signal for actual transmission pairs, and thereby distort population-level flow estimates. However, accounting for infection time uncertainty in the application found no indications of substantial bias, though uncertainty intervals were larger. Second, we do not adjust for incomplete sampling in the model, meaning the true source for an incident case may not be among the phylogenetically possible sources. In practical applications, for many pathogens and populations, it is likely that a proportion of individuals do not have a sequence, due to being undiagnosed, or for reasons of study enrollment and consent. 20 For example, we were unable to fit the model to data from heterosexual phylogenies from Amsterdam, due to small sample sizes and low sequence coverage. Approaches have been developed for assessing whether datasets have sufficient samples to identify truly linked transmission pairs, 97 and for accounting for incomplete sampling in source attribution, which goes beyond the scope of this study but could be incorporated in practice.98,99 Thirdly, we focus on developing a parsimonious clock model to nest within the mixture model. There is limited data available for pairs with a time elapsed of less than one year and above 15 years to train the model; as a result, there is a large uncertainty associated with inferences made for individuals with values outside this range. In addition, we consider a linear trend in the within-host evolutionary rate over time, though it is possible the rate decreases over a prolonged period. 100 For reasons of parsimony, we also assume a uniform background distribution in the mixture model. The background distribution may depend on the specific application, and simulations could be used to select an appropriate distribution. Finally, we have demonstrated the application of this method to estimating sources of HIV. However, it could be applied to other fast-evolving pathogens such as Hepatitis C and Ebola, if similar data from confirmed transmission pairs, or existing estimates of their evolutionary rate, are available.101,102 Other predictors, with existing evidence of their association with known transmitters, may be used in place of age to inform the BMM mixture weights, and population-level transmission flows may be summarized by other covariates of interest. 103
In summary, this paper develops a mixture model framework for incorporating time since infection estimates and pathogen genomic data to estimate population-level sources of pathogen spread. We find that time since infection estimates are informative about characterizing transmission sources, both through reducing the number of potential sources for each new infection case, and by providing the data needed to interpret pathogen genomic data in the context of the signal derived from pathogen-specific molecular clocks. We also find that individual-level sources of transmission cannot be identified even with additional time since infection estimates, and demonstrate that false transmission pair signal is pervasive in realistic simulations of HIV spread as well as real-world data from Amsterdam. This prompted us to take a Bayesian approach that integrates uncertainty in individual-level class labels and estimates the relevance of additional covariates for source attribution through modeling generalized linear predictors of the mixture model mixing weights. The model has been principally developed to characterize HIV transmission flows, but is readily applicable to source attribution of other pathogens providing pathogen-specific molecular clocks can be specified.
Supplemental Material
sj-pdf-1-smm-10.1177_09622802241309750 - Supplemental material for Bayesian mixture models for phylogenetic source attribution from consensus sequences and time since infection estimates
Supplemental material, sj-pdf-1-smm-10.1177_09622802241309750 for Bayesian mixture models for phylogenetic source attribution from consensus sequences and time since infection estimates by Alexandra Blenkinsop, Lysandros Sofocleous, Francesco Di Lauro, Evangelia Georgia Kostaki, Ard van Sighem, Daniela Bezemer, Thijs van de Laar, Peter Reiss, Godelieve de Bree, Nikos Pantazis, Oliver Ratmann and on behalf of the HIV Transmission Elimination Amsterdam (H-TEAM) Consortium in Medical Research
Footnotes
Acknowledgements
We thank the steering committee of the Amsterdam HIV transmission initiative and the Machine Learning & Global Health network for earlier comments on this work.
Declaration of conflicting interests
The author(s) declared the following potential conflicts of interest with respect to the research, authorship, and/or publication of this article: AvS received funding for managing the ATHENA cohort, supported by a grant from the Dutch Ministry of Health, Welfare and Sport through the Centre for Infectious Disease Control of the National Institute for Public Health and the Environment; and received grants unrelated to this study from European Centre for Disease Prevention and Control paid to his institution. PR received grants unrelated to this study from Gilead Sciences, ViiV Healthcare, and Merck, paid to his institution. GdB received honoraria from her institution for scientific advisory board participation in Gilead Sciences and speaker fees from Gilead Sciences (2019), Takeda (2018–2022), and ExeVir (2020–current). NP received grants unrelated to this study from ECDC and Gilead Sciences Hellas, paid to his institution; and received honoraria for presentations unrelated to this study from Gilead Sciences Hellas. OR received grants unrelated to this study from the NIH, and the Bill & Melinda Gates Foundation, paid to his institution.
Funding
The author(s) disclosed receipt of the following financial support for the research, authorship, and/or publication of this article: This study received funding as part of the H-TEAM initiative from Aidsfonds (project number P29701) and the Engineering and Physical Sciences Research Council (EP/X038440/1). The H-TEAM initiative is being supported by Aidsfonds (grant numbers: 2013169, P29701, and P60803), Stichting Amsterdam Dinner Foundation, Bristol-Myers Squibb International Corporation (study number: AI424-541), Gilead Sciences Europe Ltd (grant number: PA-HIV-PREP-16-0024), Gilead Sciences (protocol numbers: CO-NL-276-4222, CO-US-276-1712, and CO-NL-985-6195), and M.A.C AIDS Fund.
Supplemental material
Supplemental material for this article is available online.
References
Supplementary Material
Please find the following supplemental material available below.
For Open Access articles published under a Creative Commons License, all supplemental material carries the same license as the article it is associated with.
For non-Open Access articles published, all supplemental material carries a non-exclusive license, and permission requests for re-use of supplemental material or any part of supplemental material shall be sent directly to the copyright owner as specified in the copyright notice associated with the article.